1. Introduction
Climate change is an increasingly important topic, affecting most aspects of our daily lives. According to the Intergovernmental Panel on Climate Change (IPCC), anthropogenic greenhouse gas (GHG) emissions must start to decrease by the year 2025, at which point rapid and deep GHG emission reductions are needed for humanity to limit global warming to 1.5 °C or even to 2 °C [
1]. One of the major contributors to GHG emissions is the global food system, which accounts for around 30% of total emissions [
2]. Although there are several ways to reduce GHG emissions from the food system, such as reducing food waste [
3], reducing the use of fossil fuel in agriculture, and reducing emissions from the transportation of food [
4], one important possibility is to change what we actually choose to eat, and to substitute a high-GHG emission diet and high-GHG emission products with a low-GHG emission diet and low-GHG emission products [
5,
6,
7,
8]. The emissions reduced by switching to a low-GHG diet are often directly related to the energy used in producing and transporting the food, and therefore such a change in diets would also benefit the energy system as a whole [
4]. Furthermore, changing diets or choosing different products is also something that is within the control of the individual consumer, whereas changing the global production system and transportation system for food is almost impossible for the individual consumer.
The potential for reducing GHG emissions by switching to a low-GHG diet is substantial. In a systematic review, the conclusion was that by switching to more sustainable diet patterns, reductions in greenhouse gas emissions from the food system could be as high as 70–80%, with medians of about 20–30% [
9]. Although many consumers have heard general recommendations to reduce GHG emissions from food, such as “eat less meat”, more specific knowledge about which specific products should be avoided is generally low [
10,
11]. This includes differences
between food categories such as exotic fruit and meat, differences
within food categories such as ruminants and chicken in the meat category, and differences for
specific products depending on how the food has been produced and transported, such as a non-organic avocado grown in Spain vs. an organic avocado grown in Mexico [
12]. Exemplifying these differences in a review about the environmental impact of food, the median GHG emissions was 0.7 kg CO
2e/kg of product for plant-based products but the same for meat-based products was 22.4 kg CO
2e/kg; the median for poultry meat was 7.5 kg CO
2e/kg, but for beef herd bovine meat it was 60.0 kg CO
2e/kg, and finally the 10th percentile of beef herd bovine meat was 40.4 kg CO
2e/kg but the 90th percentile was 209.9 kg CO
2e/kg [
12]. Thus, if consumers had more specific knowledge about what to change in their diet, rather than general advice such as “eat less meat”, there is a high potential of achieving higher reductions in GHG emissions while requiring fewer dietary changes. In this study we will develop and evaluate a digital tool to increase this kind of knowledge.
However, changing what one eats to a more low-GHG diet is not an easy task because it involves changing deeply-rooted behaviors and practices. In this paper, we have used a behavior change framework and method called “The Behavior Change Wheel” [
13] (BCW, described in the section “Theory and Previous Work”) to design an intervention aimed at supporting people who want to switch to a more low-GHG diet. The intervention is a digital grocery list that displays the estimated CO
2e emissions of food products added to the list, where the general goal is to increase
food product carbon literacy, which is defined in this paper. In this paper, we describe how we have designed the prototype using the BCW framework and motivate how this can support the target behavior of buying and eating food products with lower GHG emissions. This paper aims to:
Provide a definition and framework of different kinds of food literacy related to greenhouse gas emissions
Quantitatively evaluate to what extent a digital grocery list displaying the estimated CO2e emissions of food products leads to increased food product carbon literacy
Quantitatively evaluate whether possible knowledge gains are expanded beyond the actual products exposed to the user via the digital grocery list
Qualitatively evaluate the system to provide “implications for design” for future designs of similar systems.
2. Food Carbon Literacy
In this paper, we will provide a framework for food literacy related to greenhouse gas emission and introduce the term “food carbon literacy”. We will define it based in part on three other “literacies” used for related topics: food literacy, household energy literacy, and carbon literacy.
The term “food literacy” is widely used but has different meanings. The most widespread definition is provided by Vidgen, namely, “…the scaffolding that empowers individuals, households, communities or nations to protect diet quality through change and strengthen dietary resilience over time. It is composed of a collection of inter-related knowledge, skills, and behaviors required to plan, manage, select, prepare, and eat food to meet needs and determine intake.” This is then simplified to mean “the tools needed for a healthy lifelong relationship with food.” [
14]. In a more comprehensive review of the term, a total of 51 definitions of food literacy were found [
15]. Out of six different themes, one theme (food systems) also included an environmental aspect. However, none of the definitions included specific mentions of climate or climate change.
In the energy field, “household energy literacy” has been used in several studies, where van den Broek has identified four different kinds of household energy literacy [
16]:
Device energy literacy is described in that it “…reflects people’s knowledge of the energy consumption of domestic appliances. This energy literacy therefore involves a semi-objective evaluation of people’s ability to report the correct kWh for household devices or estimate the energy use of a device relative to other devices.”
Action energy literacy is described as “…focus[ing] on people’s perception of actions to save energy in one’s home. Householders who have high levels of action energy literacy know what type of energy saving behavior will result in the highest energy saving output.”
Financial energy literacy is described as “…the ability to judge the financial impact of energy consumption with a focus on the financial savings of energy-saving investments.”
Finally, multifaceted energy literacy is described to be “…made up of device energy literacy, action energy literacy, financial energy literacy as well as more general knowledge about energy compared to the previous types of energy literacy. It also includes energy attitudes, values, and even energy-related behavior itself.”
The third kind of literacy we have been inspired by is carbon literacy, a term that has emerged in recent years. Howell provides a definition as “…an individual’s ability to obtain, understand, and evaluate the relevant information necessary to make decisions with an awareness of the likely consequences regarding greenhouse gas emissions.” [
17]
2.1. Definition of Food Carbon Literacy
Based on these three literacies, we propose the term “food carbon literacy” as a new kind of literacy and framework for categorizing, comparing, and generalizing future research findings. It can be seen either as a sub-component of the broader term “food literacy” or as a sub-component of the broader term “carbon literacy”. Based on the definitions of the four different kinds of household energy literacy described above, we propose the following definitions for “food carbon literacy”.
Food carbon literacy is made up of the three subcomponents food product carbon literacy, food handling carbon literacy, and financial food carbon literacy described below, as well as more general knowledge about greenhouse gas emissions caused by the food system. It also includes attitudes, values, and behaviors related to greenhouse gas emissions related to the food system and food-related practices.
Food product carbon literacy reflects people’s knowledge of the greenhouse gas emissions of different food products in relation to other food products and in relation to non-food related emissions. This literacy therefore involves a semi-objective evaluation of people’s ability to report the correct GHG emissions for food products or estimate the GHG emissions of food products relative to other food products and other non-food related activities.
Food handling carbon literacy reflects people’s knowledge of the greenhouse gas emissions related to the handling of food products, such as transportation from the supermarket, cooking, storing, and food waste. Individuals who have high levels of food handling carbon literacy know what type of GHG emissions will result from different phases of food handling relative to other phases of food handling and to other non-food related activities.
Financial food carbon literacy is the ability to judge the financial impact of choosing food which satisfies nutritional needs and has low GHG emissions, and the ability to choose cheap and low-GHG emission food that satisfies nutritional needs.
2.2. Combining Food Literacy and Food Carbon Literacy—Choice of Functional Unit
One problem discussed in research about food and sustainability is which functional unit should be used [
18], which has an impact on what is considered “good” and therefore has an impact on food product carbon literacy. The most common functional unit found in Life Cycle Assessments (LCA) studies for GHG emissions and food is “kg of product” giving the measure “kg CO
2e /kg product”, which is also used in this study. However, that is problematic, because it does not take into account the nutritional content of the food, and arguably the “function” of food is not the weight of the food but its properties in allowing us to live a healthy life. The nutritional content of food is also a central part of food literacy. For example, from a strict perspective of reducing CO
2e emissions from food, the “optimal diet” would be to only consume rapeseed oil, where extremely low levels of CO
2e would be emitted for the number of calories you need per day, but which would obviously be an extremely unhealthy diet.
To exemplify this further, one of the problems is that some food products contain high amounts of water (such as carrots, with 90% water content) whereas others contain little water when bought, but water is added during cooking. For example, pasta is usually bought in dry form with around 10% water content but increases in weight almost by a factor of three when water is added when it is cooked, up to around 70% water content. The CO2e emissions for pasta shown in various databases is in dry form, but a fairer CO2e value would be to divide the value in the databases by 3 because that would make it comparable to other similar products where water is already in the product when bought, such as in fruit, vegetables, and potatoes. Cheese is another example, in that it usually has a high GHG footprint when expressed as “kg CO2e/kg product”, but cheese is (somewhat simplified) milk where water has been removed. Cheese could therefore be perceived as much worse than it really is only defined by CO2e/kg of product.
Another functional unit that can be used is the caloric content of food, giving the measure “kg CO2e/calorie”. This can arguably be a better unit of measure because we usually eat a relatively constant number of calories per time unit. However, drawing this to extreme values shows problems with this functional unit as well, where food products with a very high caloric content such as palm oil will result in low (“good”) values, and food with low caloric content such as fruit and vegetables will result in high (“bad”) values, which is in opposition to current nutrient guidelines.
One way to get a more balanced nutritional score is to use a combined measure, such as “nutrient rich food index” (NRF11.3) that combines scores for 11 healthy nutrients and 3 unhealthy nutrients, but these indices have other problems [
18,
19]. One problem is whether some nutrients should be considered more important than others and, if so, how this should be calculated. Another problem is that NRF11.3 can have zero or negative values if there are high scores for unhealthy nutrients and low scores for healthy nutrients. This means that the measure CO
2e /NRF11.3 would approach infinity when the NRF11.3 score approaches zero and turn to negative values when the NRF11.3 score is negative. Finally, the availability of detailed nutritional data about food is limited, making the calculation of such indices for food products difficult [
20].
From an academic and scientific point of view, these discussions about functional units to measure the “goodness” of food are very relevant [
20], but from a literacy point of view, they make matters quite complicated for the average, moderately-interested user. The measure “kg CO
2e/kg product” has the distinct advantage of being very easy to comprehend, in that a user can immediately get an impression of the amounts of CO
2e that are the result of a food product. Our recommendation is therefore to continue to use the measure “kg CO
2e/kg product” despite its weaknesses, and to leave communication of the nutritional value of food as a separate area of food literacy, for example by using separate nutritional labels.
3. Theory and Previous Work
Designing a digital behavior change intervention benefits from a structured approach grounded in behavioral science [
13]. However, as shown in a review on digital behavior change interventions for more sustainable food consumption, this is rarely the case in this area, where the designed systems often lack theoretical grounding or a clear discussion of how or why they should be effective [
21]. Therefore, in this study we have grounded the design of the intervention and system using the framework of “The Behavior Change Wheel” and the behavior change technique taxonomy v1.1. [
13,
22].
3.1. The Behavior Change Wheel and Behavior Change Technique Taxonomy
The behavior change wheel is a framework used both for designing and characterizing behavior change interventions. It is based on a synthesis of 19 different behavior change frameworks from different disciplines [
13]. This framework outlines a multi-step method for designing behavior change interventions. We have used a subset of the steps, starting with
defining the problem in behavioral terms,
selecting, and specifying the target behavior,
identifying what needs to change,
identifying behavior change techniques and finally
identifying mode of delivery. The behavior change techniques are categorized using The behavior change technique taxonomy, which contains 16 clusters of behavior change techniques divided into a total of 93 distinct behavior change techniques [
22].
There are several reasons for using these frameworks. Michie [
13] argues that from a design perspective they give a firm theoretical grounding for how to rationally choose the most appropriate approaches from a full range of options. As pointed out, this is often not the case, and in research it is instead common for interventions to be based on common sense models of behavior [
13,
23]. From the perspective of building new knowledge, it is important to have a consistent and well-defined terminology when reporting results from interventions, which makes it easier both to find studies of a particular kind of intervention and to compare the effectiveness of different kinds of interventions under different kinds of circumstances [
13,
23].
3.2. Previous Work on Digital Behavior Change Interventions for Food Carbon Literacy
Some earlier works have investigated how to use digital technologies to support consumers in choosing food with lower greenhouse gas emissions. One approach has been to make post-purchase calculations on greenhouse gas emissions from food purchases [
19,
24,
25,
26]. Data collection has either involved scanning barcodes of food product purchases [
19,
24], or extracting purchase data from receipts [
25], and then mapping these products in databases of greenhouse gas emissions from food and presenting it to users in an app or on a web page. Post-purchase feedback regarding organic food purchases have also been investigated, where feedback was integrated into the supermarket chain’s customer database [
27,
28,
29] and presented via a web portal.
Although post-purchase feedback can offer good insights into personal food-related emissions, the feedback comes after the purchases already have been made and it is not possible to change the purchase in question. It would be better if the feedback could be given when there is still time to change the purchases. Furthermore, post-purchase feedback requires relatively high levels of interest to maintain for an extended period of time. Earlier work in human–computer interaction (HCI) and sustainability has criticized this image of the engaged, data-centric user [
30], and it would be desirable to design solutions that are better integrated into daily practices and become a natural part of everyday life.
One study looks at pre-purchase feedback, where a web plugin scans web-based recipes for ingredients and calculates carbon emissions from these [
31]. This is better than post-purchase feedback because there are still possibilities of changing plans regarding what to eat, but a problem in the study was that few users based their meals on online recipes, thereby making the system less useful.
However, to our knowledge there have been no studies exploring the possibility of getting feedback while planning grocery purchases using a digital grocery list, which is what we aim to do in this study, as discussed further in the next section.
4. System Design
The design of the intervention loosely followed the steps of the behavior change wheel framework. The initial steps are to identify the problem in behavioral terms, selecting the target behavior and identifying what needs to change. At the start of this project, we decided that the problem expressed in behavioral terms is that we want consumers to buy food with low-GHG emissions rather than food with high-GHG emissions. In order to do this, we needed a suitable dataset of what constitutes low- and high-GHG emission food.
The dataset of GHG emissions from food we chose for use in this study was the LCAFDB database [
32], developed during an earlier project. In this database, our research group has collected life cycle data about greenhouse gas emissions from various scientific and grey sources. The reasons for choosing this database were that (1) it is completely free to use and has an API we were used to working with; (2) it has a crowd-sourced synonym function which allows several different names or spellings of products entered by users to be mapped to the correct food in the database; and (3) the data was mainly collected in a Swedish context which generally gives more accurate data than global averages would have provided [
20]. However, it also set some limits to what we could do. Using the hierarchical categorization of food presented by Hedin in [
20], the database only had data on the ‘product-type level’ (i.e., “Spaghetti”) and not on the ‘product level’ (i.e. “Barilla Spaghetti, 500 g”). This gave the limitation that the intervention could not be aimed at choosing between products of the same product type with different GHG emissions (i.e., “Barilla Spaghetti, 500 g” vs “Nestlé Penne, 500 g”), but choices instead had to be made on the product-type level (i.e., “Pasta” vs “Rice”). This limitation will be discussed in the discussion section of this paper.
Continuing the analysis, we decided that the target group of this intervention would be people who already had an interest in reducing their greenhouse gas emissions from food but lacked knowledge regarding which products were suitable to choose from. This corresponds to a need to increase ‘psychological capability’ in the BCW framework. It was decided that a suitable point of intervention would be the planning phase, corresponding to the point at which a household plans what meals to cook and what food products are needed to cook that food. As mentioned above, a previous study had investigated the use of a plugin to a web browser that could calculate the emissions on a product level of digital recipes published on the web [
31]. However, one result from that study was that few participants used digital recipes, and therefore were seldom exposed to the GHG emissions caused by the recipe’s ingredients. Therefore, we decided to instead target the grocery shopping lists many use where ingredients are added, and when it is still possible to either choose a replacement ingredient for the recipe or choose another recipe altogether. A grocery list was also suitable for the data we had available, since entries on a grocery list are generally on the product-type level, as discussed above. Completing the BCW analysis we defined which behavior change techniques the intervention would use and motivations for these changes, as described in
Table 1.
Design of the User Interface
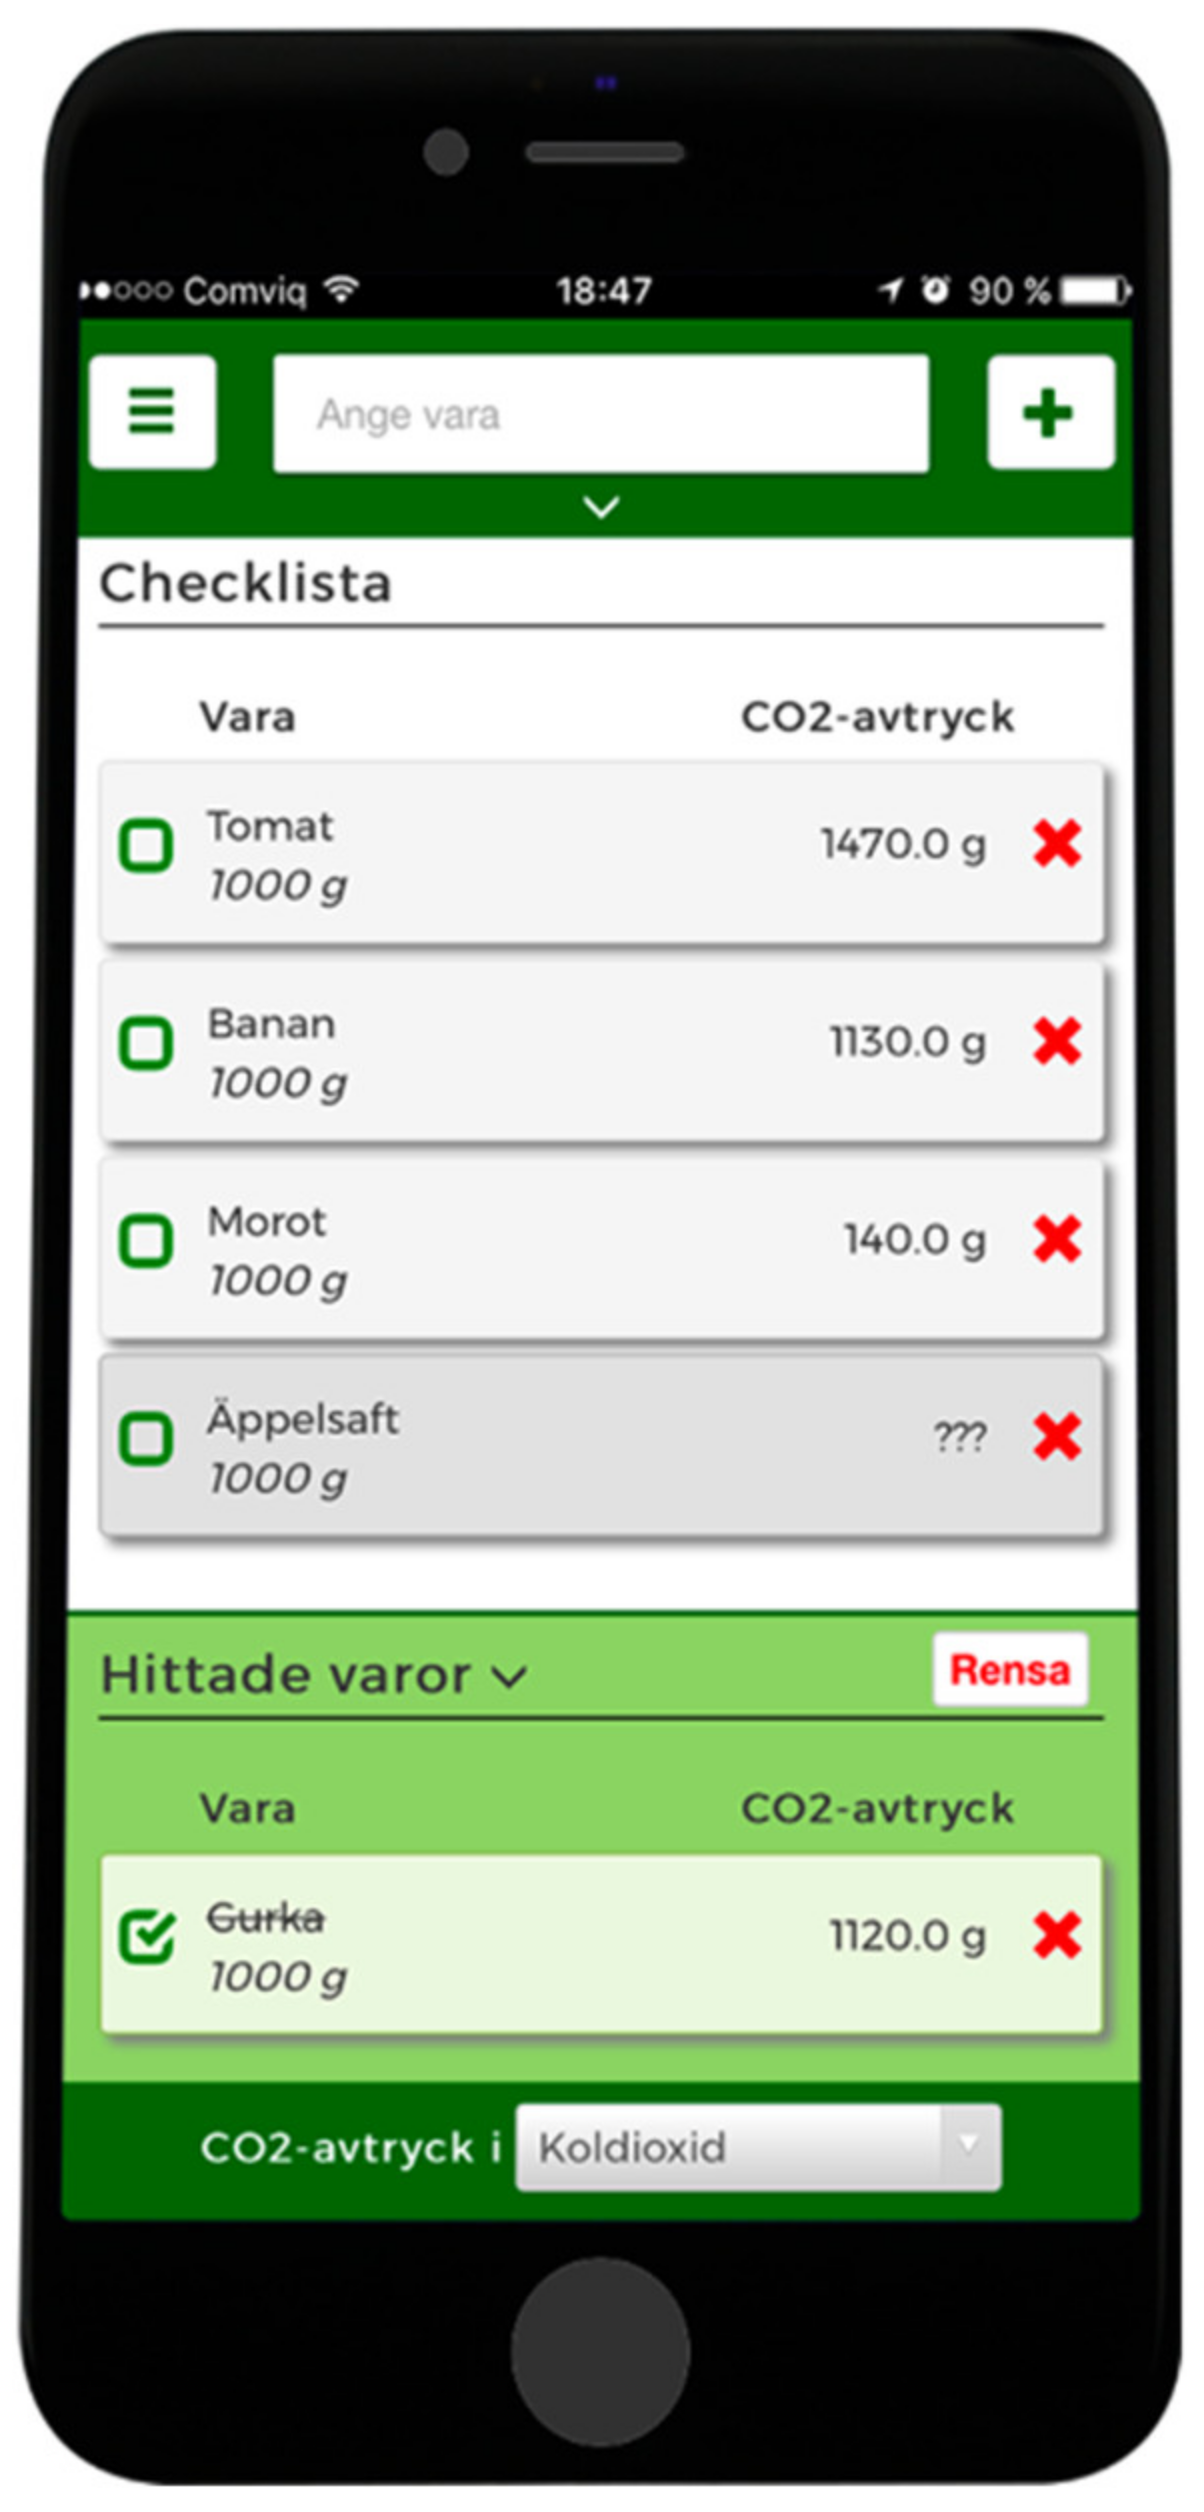
The grocery list was developed as a web application adapted for mobile phones. After logging into an account, the user was exposed to a view with three parts.
The first part was a search function, where the user could start writing the name of a product to be added to the list. The search function listed all entries in the databases, where the entered string was matched to all products in the database containing a corresponding substring, thereby minimizing the risk of entering a string not matched to a product in the database (e.g., “Apple” vs “Apples”). However, it was also possible to add products not found in the database because all possible products are not in the database, and a grocery list requires this possibility in order to be useful.
The second part was the main view, where all items on the list were shown along with the corresponding GHG emission. Parts one and two are shown in
Figure 1.
The third part was a unit converter, where the user could choose in what unit the emissions were expressed. Earlier research discusses the problem that units such as kWh or kg CO
2e are very abstract to most people, and it could be better to express such units as other more relatable activities or actions [
33,
34,
35]. In this case, CO
2e was the default choice, but it was also possible to choose units such as number of km that could be driven using a standard car or on the metro, hours of watching TV or using a laptop using a standard energy mix, number of charges of mobile phones, or number of beers, as shown in
Figure 2.
5. Materials and Methods
After developing the prototype, it was tested on actual users in a pilot study. The criteria for participation in the study was to be the person in the household who managed most of the household’s food purchases, to normally use a grocery list while buying groceries, owning a smartphone, and agreeing to share their grocery lists for the purpose of this study. The participants in the study were recruited from two groups. The first group was comprised of participants in a Swedish Facebook group with a name translated as “more environmentally-friendly everyday life”. The group had 15,500 members. A request for participation in the study was posted, and 22 members applied to sign up, of which 13 met the requirements and 3 completed the study. The second group was comprised of students from an engineering program who, as part of another course, were required to participate in a number of research studies. Participation was voluntary and consent was obtained, but if the students chose not to participate, they would have to participate in another study or do an extra assignment. Of the 200 students participating in the course, course management chose 36 students who matched the criteria for participation, all of whom agreed to participate in the study.
The participants started by answering a questionnaire where they estimated the carbon footprint of a number of products. Participants were provided with values for the median, maximum, and minimum values in the dataset in order to have some reference points as to what reasonable values could be.
Next, during a period of two weeks, the participants used the digital grocery list to plan their grocery purchases. After each purchase they submitted the items on the list to researchers before deleting them, and also submitted a form indicating whether they had changed any products on list due to their GHG emissions. After the test period, the participants answered the same carbon footprint questionnaire that was used before the study, and also answered in free text form about possible reasons for not changing items on the list, as well as general experiences regarding the design of the system.
The analysis of the questionnaires was done using a similar method as Hedin and Zapico [
35] where the ‘correctness’ of an answer was determined by a quotient of the correct answer and the respondent answer. An answer 10 times higher than the correct value was seen as equally good/bad as an answer 10 times lower than the correct value. To make the results comparable, the formula used to calculate the quotient if the respondent answer was lower than the correct answer was
If the respondent answer was instead higher than the correct answer, the formula was
This resulted in values of x between 0 and 1, where the closer the value was to 1, the more correct the answer was. The resulting distributions were tested for normality using the Anderson–Darling normality test, and were found to be roughly normally distributed and, therefore, paired t-tests could be used for analysis. Separate analyses were done for food products to which the participant had been exposed, and to food products to which the participant had not been exposed, in order to examine whether the participants had generalized possible learning beyond the products they had been exposed to. Effect sizes were calculated using Cohen’s D [
36].
The question in the final questionnaire about possible reasons for not changing items in the list was analyzed using inductive thematic analysis, broadly following the 6-step method described by Browne and Clarke [
37]. Two of the authors of this paper did an initial thematical analysis, which was then discussed and agreed upon with the main author. It should be noted that even though the number of occurrences for each theme is reported, the purpose of such an analysis is not quantitative but qualitative, and therefore measures such as inter-coder reliability are not relevant.
6. Results
A total of 27 of the 36 participants from the student group who started the test completed all parts of it. Only 3 of the 13 participants from the Facebook group completed it and provided valid data. Reasons for excluding the remaining participants included not answering the questionnaires at all, not using the app, or providing answers that were obviously not serious attempts to answer correctly.
The users reported a total of 103 lists. The average number of products types each user was exposed to during the entire test period was 20.7, with a standard deviation of 11.1. A total of 820 individual products were added, distributed over 282 product types, with “milk” being the most commonly-added product type, with 31 occurrences.
6.1. Results from GHG Emission Questions, All Product types
The 30 participants who completed the study provided a total of 730 answers to the questionnaires where GHG emissions from food product types were estimated. In the pre-questionnaire, the median answers were incorrect by a factor of 3.4 (i.e., the value of x in the calculation in the method chapter was 0.29). In the post-questionnaire, the results had improved, and the median value of the answers was incorrect by a factor of 2.2 (i.e., the value of x in the calculation in the methods chapter improved to 0.445). A two-tailed paired t-test showed that the changes were statistically significant (p < 0.0001), and the change was large, with an effect sized (calculated using Cohen’s D) of 1.087.
6.2. Results from GHG Emission Questions, Only Exposed Product types
When including only the answers for product types, the participants had been exposed to (product types they had added to their lists), 143 answers remained. In the pre-questionnaire the median answers for these were incorrect by a factor of 4 (i.e., the value of x in the calculation in the method chapter was 0.25). In the post-questionnaire the results had improved, and the median value for the answers was incorrect by a factor of 2.2 (i.e., the value of x in the calculation in the method chapter was 0.445). A two-tailed paired t-test showed that the changes were statistically significant (p < 0.0001), and the change was large, with an effect size (calculated using Cohen’s D) of 1.16. The effect size was slightly higher here than when combining the calculations for all product types, as could be expected.
6.3. Results from GHG Emission Questions, Only Non-exposed Product types
When including the answers for product types, the participants had not been exposed to (product types they had not added to their lists), 617 answers remained. In the pre-questionnaire the median answers for these were incorrect by a factor of 3.39 (i.e., the value of x in the calculation in the method chapter was 0.295). In the post-questionnaire, the results had improved and the median value for the answers was incorrect by a factor of 2.33 (i.e., the value of x in the calculation in the method chapter was 0.43). A two-tailed paired t-test showed that the changes were statistically significant (p < 0.0001), and the change was large, with an effect size (calculated using Cohen’s D) of 0.93. The effect size was lower than when combining calculations for all products, as could be expected, but was still an exceptionally high result.
6.4. Reasons for Not Replacing Product Types with Low-GHG Product Types
Only 6 of the participants reported replacing an item added to the list due to its high GHG emissions. The final questionnaire provided an opportunity to describe reasons for not replacing items. A total of 35 different reasons were provided, which after thematic analysis were placed into the categories shown in
Table 2. These are not meant to present a complete or representative picture of all possible reasons, but rather to serve as starting points for discussions.
7. Discussion
7.1. The Statistical Results
The statistical analysis showed that there was a significant and large learning effect, both for products the users had been exposed to, and for products they had not been exposed to. The effect sizes of 1.087, 1.16, and 0.93 are all clearly above the 0.8 that Cohen in his original paper considers to be a “large” effect [
36]. In a learning context, Hattie suggests that an effect size larger than 0.6 should be considered large when evaluating innovative methods with the purpose of spreading knowledge [
38].
What is especially interesting is the large effect size of 0.93 for the products the participants never even saw in the system. One possible explanation to this is that the knowledge gained of exposed products was generalized to more general knowledge for similar products, an indication of increased food product carbon literacy.
It should be noted that this effect was measured directly after the study, and no long-term follow-up was made. Previous studies in similar areas have shown that the effect declines after a longer period of time, but that the effect does not disappear altogether [
35].
7.2. Suggestions for Future Systems
Of the reasons for not changing products described in
Table 2, a few are related to food product carbon literacy and could be addressed in future systems.
The first of these reasons was the theme “difficult to find suitable substitutes”, which is a something future systems could address. In a small follow-up project [
39], this was addressed and a prototype (shown in
Figure 3) was developed. The results showed that such a feature was appreciated, but also showed it is not always easy to determine what a suitable substitute is, both due to personal preferences and because food products can serve different purposes in different contexts. For example, cucumbers can be a good replacement for tomatoes if used on a sandwich, but useless if you want to cook tomato soup. One idea could be to crowdsource this kind of data in a similar way as food synonyms were crowdsourced in the LCAFDB database [
32]. Another easier way to address this could be to supply alternatives not
between product categories (i.e. change pasta to potatoes), but
within a product level [
20] (i.e. change “Barilla Spaghetti, 500 g” to “Nestlé Spaghetti, 500 g”). Then, instead of showing a generic average value for Pasta, a range of values could be shown (i.e., “0.2–0.8 kg CO
2e /kg product”) where a user then could click on the range and see all available options for Pasta. If integrated with product availability in supermarkets, the system could also show which products are available in which supermarkets.
Such a feature would also address a second theme—“lack of time”—from the thematic analysis, where the problem was mainly a lack of time to come up with an alternative meal. If alternatives within the same product category were offered, the same meal could still be prepared. However, comparing products on a product level would currently not be unproblematic since there are still a few LCAs on the product level, and furthermore there is no fixed standard for how such an LCA should be done [
6], providing opportunities for unfair comparisons. However, this would also mean an incentive for the agricultural sector to change production methods and to perform LCA analyses of their products, since customers will have direct access to this data when choosing which products to buy.
A third theme in the thematic analysis was “hard to determine if a footprint was high”. What constitutes a “high footprint” is not trivial. It could mean, for example, “worse compared to the average of all products”, “worse compared to the average of what I usually buy”, or “worse than what would be a sustainable diet”. It will also depend on the use of functional units as discussed above, where a product might have a low GHG footprint, but at the same time have low nutritional value, thereby making the emissions less necessary than a product with a higher GHG footprint but much higher nutritional values. One approach could be to have separate values for nutritional value and carbon emissions, and that these could either be combined into one ‘goodness value’ or be displayed separately as discussed above and in [
19]. A “high footprint” could also be relative to some completely different but more easily understood activity, such as kilometers of driving a car. This feature existed in this prototype, but few used it.
A final theme worth considering is the “price” theme. Price is generally considered one of the most important factors influencing what people choose to eat [
40]. Including price in an interface would make it easier to choose suitable low GHG products and would also support increased
financial food carbon literacy. Including prices in such a system would not be easy, since prices can differ between different stores, and since these prices are generally not openly available to a third-party app. However, it could be possible to include them in an online store.
One problem related to the system design was that all emission values were based on “per 1000 g of product”. This might give unrealistic expectations of the total footprint of the products that were actually purchased. For example, “Prosciutto” has a very high footprint per 1000 g of product but is usually bought in very small quantities resulting in relatively low total footprints, whereas “milk” has a relatively low footprint per 1000 g of product but is often bought in large quantities resulting in high total footprints. Adding the possibility to add quantities to the list interface could amend that but would, at the same time, add complexity to the use of the list, since at the planning stage one might not know the actual amounts of the product you will actually buy. Also, adding quantities to the list interface would be an extra step in the use of the list, which might reduce the usefulness of the list from a user’s perspective.
7.3. A Holistic View of the Food System
The GHG emission values presented to the users are generally calculated using LCA. However, there are critiques against using that method for calculating emissions from food because it by necessity involves setting system boundaries, and effects outside these boundaries are hard to assess. For example, eating less ruminant meat is an easy conclusion to draw after using the digital grocery list, but if many people reduced their ruminant meat consumption this would have consequences on completely different parts of the food system, such as increased use of artificial fertilizers. Furthermore, just focusing on one environmental aspect such as GHG emissions might have unwanted consequences on other important environmental aspects such as biodiversity, water use, and land use. Like many areas it is seldom as easy as a simple ‘this is good’ or ‘this is bad’. This, such as the problems associated with functional units discussed above, is common knowledge among sustainability and nutrition experts, and they can interpret the data presented in a system such as this better than a lay person.
7.4. Limitations and Future Studies
The empirical parts of this study were carried out for a limited duration on a relatively small set of respondents, most of whom were well-educated students living in Sweden. Future studies should involve a broader range of participants from different contexts, and longitudinal studies to measure long-term gains in food carbon literacy.
8. Conclusions
In this paper we have introduced a definition and framework around the concept of “food carbon literacy”. Our intention is that this framework can be used to categorize, compare, and generalize future studies within the area.
We have also presented the design of a digital grocery list for mobile phones showing GHG emissions from the food products added to the list, with the goal of increasing food carbon literacy, and evaluated its effect on food product carbon literacy.
We could see that the grocery lists led to a strong improvement on short-term food product carbon literacy for users, meaning that they were significantly better at estimating the carbon footprint of food products they had added to their lists during their trial. Furthermore, significant improvements were seen even for products the users had not added to their lists, indicating that the knowledge had been generalized.
We have also identified problem areas of various severity regarding how such an application can and should be implemented, where some, such as suggesting suitable replacements for food with high GHG emissions, would improve the usefulness of the system. Open access to more specific data about products such as detailed LCA analyses, detailed nutritional values, and price would afford many useful functions to such a system, and would also lead to better possibilities of deepening food carbon literacy.
Other problems discovered and discussed, such as which functional unit is best for providing a valid view of the food products, and how take other environmental and health aspects into account are of a more fundamental nature. However, since food carbon literacy is one piece of the puzzle in educating consumers about sustainable eating, and since the functionality described in this paper is relatively easy to integrate into other grocery list apps or, for example, online stores, it is our hope that this paper will inspire researchers and practitioners to engage in future work in this area.
Author Contributions
Conceptualization, B.H.; methodology, B.H., L.G. and G.J.; software, L.G. and G.J.; data collection, L.G. and G.J statistical analysis, B.H., L.G. and G.J.; thematic analysis, L.G. and G.J.; writing—original draft preparation, B.H., L.G. and G.J.; writing—review and editing, B.H.; supervision, B.H.; project administration, B.H.; funding acquisition, B.H. All authors have read and agreed to the published version of the manuscript.
Funding
This research was funded by The Swedish Energy Agency, grant number 48099-1 and by The Swedish Innovation Agency, grant number 2018-04115.
Institutional Review Board Statement
Ethical review and approval were waived for this study, after consultation with our local ethics representative.
Informed Consent Statement
Informed consent was obtained from all subjects involved in the study.
Data Availability Statement
The data presented in this study are available on request from the corresponding author. The data are not publicly available since the agreement with the participants was for this study only.
Conflicts of Interest
The authors declare no conflict of interest.
References
- IPCC. Mitigation of Climate Change; IPCC: Geneva, Switzerland, 2022. [Google Scholar]
- Crippa, M.; Solazzo, E.; Guizzardi, D.; Monforti-Ferrario, F.; Tubiello, F.N.; Leip, A. Food systems are responsible for a third of global anthropogenic GHG emissions. Nat. Food 2021, 2, 198–209. [Google Scholar] [CrossRef]
- Schanes, K.; Dobernig, K.; Gözet, B. Food waste matters—A systematic review of household food waste practices and their policy implications. J. Clean. Prod. 2018, 182, 978–991. [Google Scholar] [CrossRef]
- Cuéllar, A.D.; Webber, M.E. Wasted food, wasted energy: The embedded energy in food waste in the United States. Environ. Sci. Technol. 2010, 44, 6464–6469. [Google Scholar] [CrossRef] [PubMed]
- Westhoek, H.; Lesschen, J.P.; Rood, T.; Wagner, S.; De Marco, A.; Murphy-Bokern, D.; Leip, A.; van Grinsven, H.; Sutton, M.A.; Oenema, O. Food choices, health and environment: Effects of cutting Europe’s meat and dairy intake. Glob. Environ. Change 2014, 26, 196–205. [Google Scholar] [CrossRef]
- Carlsson Kanyama, A.; Hedin, B.; Katzeff, C. Differences in environmental impact between plant-based alternatives to dairy and dairy products: A systematic literature review. Sustainability 2021, 13, 12599. [Google Scholar] [CrossRef]
- Hallström, E.; Carlsson-Kanyama, A.; Börjesson, P. Environmental impact of dietary change: A systematic review. J. Clean. Prod. 2015, 91, 1–11. [Google Scholar] [CrossRef]
- Eustachio Colombo, P.; Patterson, E.; Lindroos, A.K.; Parlesak, A.; Elinder, L.S. Sustainable and acceptable school meals through optimization analysis: An intervention study. Nutr. J. 2020, 19, 1–15. [Google Scholar] [CrossRef]
- Aleksandrowicz, L.; Green, R.; Joy, E.J.M.; Smith, P.; Haines, A. The impacts of dietary change on greenhouse gas emissions, land use, water use, and health: A systematic review. PLoS ONE 2016, 11, e0165797. [Google Scholar] [CrossRef]
- Shi, J.; Visschers, V.H.M.; Bumann, N.; Siegrist, M. Consumers’ climate-impact estimations of different food products. J. Clean. Prod. 2018, 172, 1646–1653. [Google Scholar] [CrossRef]
- Hartikainen, H.; Roininen, T.; Katajajuuri, J.M.; Pulkkinen, H. Finnish consumer perceptions of carbon footprints and carbon labelling of food products. J. Clean. Prod. 2014, 73, 285–293. [Google Scholar] [CrossRef]
- Poore, J.; Nemecek, T. Reducing food’s environmental impacts through producers and consumers. Science 2018, 360, 987–992. [Google Scholar] [CrossRef] [PubMed]
- Michie, S.; van Stralen, M.M.; West, R. The behaviour change wheel: A new method for characterising and designing behaviour change interventions. Implement. Sci. 2011, 6, 42. [Google Scholar] [CrossRef] [PubMed]
- Vidgen, H.A.; Gallegos, D. Defining food literacy and its components. Appetite 2014, 76, 50–59. [Google Scholar] [CrossRef] [PubMed]
- Thompson, C.; Adams, J.; Vidgen, H.A. Are we closer to international consensus on the term ‘food literacy’?: A systematic scoping review of its use in the academic literature (1998–2019). Nutrients 2021, 13, 2006. [Google Scholar] [CrossRef]
- Van den Broek, K.L. Household energy literacy: A critical review and a conceptual typology. Energy Res. Soc. Sci. 2019, 57, 101256. [Google Scholar] [CrossRef]
- Howell, R.A. Carbon management at the household level: A definition of carbon literacy and three mechanisms that increase it. Carbon Manag. 2018, 9, 25–35. [Google Scholar] [CrossRef]
- Sonesson, U.; Davis, J.; Hallström, E.; Woodhouse, A. Dietary-dependent nutrient quality indexes as a complementary functional unit in LCA: A feasible option? J. Clean. Prod. 2019, 211, 620–627. [Google Scholar] [CrossRef]
- Bergqvist, H. Supporting consumers in making sustainable food purchases: Exploring the potential of using combined scores based on climate impact and nutrition for food products in digital services, KTH, School of Electrical Engineering and Computer Science (EECS). Master Thesis, KTH Royal Institute of Technology, Stockholm, Sweden, 2021. [Google Scholar]
- Hedin, B. OmniFood—Exploring the Possibilities of a Consumer System With Ubiquitous Access to Data About the Food We Eat (submitted). In Proceedings of the Workshop on Computing within Limits, 21 June 2022. [Google Scholar]
- Hedin, B.; Katzeff, C.; Eriksson, E.; Pargman, D. A systematic review of digital behaviour change interventions for more sustainable food consumption. Sustainability 2019, 11, 2638. [Google Scholar] [CrossRef]
- Michie, S.; Richardson, M.; Johnston, M.; Abraham, C.; Francis, J.; Hardeman, W.; Eccles, M.P.; Cane, J.; Wood, C.E. The Behavior Change Technique Taxonomy (v1) of 93 Hierarchically Clustered Techniques: Building an International Consensus for the Reporting of Behavior Change Interventions. Ann. Behav. Med. 2013, 46, 81–95. [Google Scholar] [CrossRef]
- Michie, S.; Fixsen, D.; Grimshaw, J.M.; Eccles, M.P. Specifying and reporting complex behaviour change interventions: The need for a scientific method. Implement. Sci. 2009, 4, 40. [Google Scholar] [CrossRef]
- Bergqvist, H.; Möller, J.; Bergqvist, H. Inventariesystem för minskat matsvinn i hushåll En teknisk designstudie med teoretisk grund i beteendevetenskap En teknisk designstudie med teoretisk grund i beteendevetenskap. Bachelor Thesis, KTH Royal Institute of Technology, Stockholm, Sweden, 2019. [Google Scholar]
- Shin, O.; Clemedson, E. Direktfeedback för att uppmuntra till hållbar matkonsumtion. Bachelor Thesis, KTH Royal Institute of Technology, Stockholm, Sweden, 2019. [Google Scholar]
- Möller, J. Climate impact awareness through visualization of digital food receipts: Development and evaluation of an application visualizing grocery climate data, KTH, School of Electrical Engineering and Computer Science (EECS). Master Thesis, KTH Royal Institute of Technology, Stockholm, Sweden, 2021. [Google Scholar]
- Zapico, J.L.; Katzeff, C.; Bohné, U.; Milestad, R. Eco-feedback Visualization for Closing the Gap of Organic Food Consumption. In Proceedings of the 9th Nordic Conference on Human-Computer Interaction, Gothenburg, Sweden, 23–27 October 2016; ACM: New York, NY, USA, 2016; pp. 75:1–75:9. [Google Scholar]
- Bohne, U.; Zapico, J.L.; Katzeff, C. The EcoPanel: Designing for reflection on greener grocery shopping practices. Proc. Enviroinfo ICT Sustain. 2015, 22, 221–228. [Google Scholar] [CrossRef]
- Bohné, U. Exploring the Intersection of Design, Reflection and Sustainable Food Shopping Practices The Case of the EcoPanel. Ph.D. Thesis, KTH Royal Institute of Technology, Stockholm, Sweden, 2016. [Google Scholar]
- Strengers, Y. Smart Energy in Everyday Life: Are You Designing for Resource Man? Interactions 2014, 21, 24–31. [Google Scholar] [CrossRef]
- Lindström, D.; Kasperi, J. Klimatsmart matlagning: Automatisk presentation av recepts koldioxidutsläpp i webbläsaren, School of Computer Science and Communication (CSC), KTH. Bachelor Thesis, KTH Royal Institute of Technology, Stockholm, Sweden, 2014. [Google Scholar]
- Hedin, B. LCAFDB—A Crowdsourced Life Cycle Assessment Database for Food. In Proceedings of the Fifth IFIP Conference on Sustainable Internet and ICT for Sustainability, Funchal, Portugal, 6–7 December 2017. [Google Scholar]
- Zapico, J.L.; Turpeinen, M.; Brandt, N. Climate persuasive services: Changing behavior towards low-carbon lifestyles. In Proceedings of the 4th International Conference on Persuasive Technology, Claremont, CA, USA, 26–29 April 2009; ACM: New York, NY, USA, 2009; pp. 14:1–14:8. [Google Scholar]
- Hedin, B.; Zapico, J. Kilowh. at—Increasing energy awareness using an interactive energy comparison tool. In Proceedings of the International Conference on Persuasive Technology, Amsterdam, The Netherlands, 4–6 April 2017; pp. 175–185. [Google Scholar]
- Hedin, B.; Luis Zapico, J. What Can You Do with 100 kWh? A Longitudinal Study of Using an Interactive Energy Comparison Tool to Increase Energy Awareness. Sustainability 2018, 10, 2269. [Google Scholar] [CrossRef]
- Cohen, J. Statistical Power Analysis for the Behavioral Sciences, 2nd ed.; Routledge: London, UK, 1988. [Google Scholar]
- Braun, V.; Clarke, V. Using thematic analysis in psychology. Qual. Res. Psychol. 2006, 3, 77–101. [Google Scholar] [CrossRef]
- Hattie, J.; Biggs, J.; Purdie, N. Effects of Learning Skills Interventions on Student Learning: A Meta-Analysis. Rev. Educ. Res. 1996, 66, 99–136. [Google Scholar] [CrossRef]
- Eckernäs, A.; Westerlund, E.K. Presentation av mer klimatsmarta alternativ för livsmedelsprodukter: Design och utvärdering av ett scannerbaserat system. Bachelor Thesis, KTH Royal Institute of Technology, Stockholm, Sweden, 17 December 2020. [Google Scholar]
- Garnett, T.; Mathewson, S.; Angelides, P.; Borthwick, F. Policies and actions to shift eating patterns: What works? In A Review of the Evidence of the Effectiveness of Interventions Aimed at Shifting Diets in More Sustainable and Healthy Directions; Food Climate Research Network; University of Oxford: Oxford, UK, 2015. [Google Scholar]
| Publisher’s Note: MDPI stays neutral with regard to jurisdictional claims in published maps and institutional affiliations. |
© 2022 by the authors. Licensee MDPI, Basel, Switzerland. This article is an open access article distributed under the terms and conditions of the Creative Commons Attribution (CC BY) license (https://creativecommons.org/licenses/by/4.0/).


