Article

Hydrogen Leakage Simulation and Risk Analysis of Hydrogen Fueling Station in China

1
School of Management, China University of Mining and Technology (Beijing), Beijing 100083, China
2
School of Economics and Management, Guizhou University of Engineering Science, Bijie 551700, China
*
Authors to whom correspondence should be addressed.
Sustainability 2022, 14(19), 12420; https://doi.org/10.3390/su141912420
Submission received: 6 September 2022 / Revised: 22 September 2022 / Accepted: 27 September 2022 / Published: 29 September 2022
(This article belongs to the Section Hazards and Sustainability)

Abstract

:
Hydrogen is a renewable energy source with various features, clean, carbon-free, high energy density, which is being recognized internationally as a “future energy.” The US, the EU, Japan, South Korea, China, and other countries or regions are gradually clarifying the development position of hydrogen. The rapid development of the hydrogen energy industry requires more hydrogenation infrastructure to meet the hydrogenation need of hydrogen fuel cell vehicles. Nevertheless, due to the frequent occurrence of hydrogen infrastructure accidents, their safety has become an obstacle to large-scale construction. This paper analyzed five sizes (diameters of 0.068 mm, 0.215 mm, 0.68 mm, 2.15 mm, and 6.8 mm) of hydrogen leakage in the hydrogen fueling station using Quantitative Risk Assessment (QRA) and HyRAM software. The results show that unignited leaks occur most frequently; leaks caused by flanges, valves, instruments, compressors, and filters occur more frequently; and the risk indicator of thermal radiation accident and structure collapse accident caused by overpressure exceeds the Chinese individual acceptable risk standard and the risk indicator of a thermal radiation accident and head impact accident caused by overpressure is below the Chinese standard. On the other hand, we simulated the consequences of hydrogen leak from the 45 MPa hydrogen storage vessels by the physic module of HyRAM and obtained the ranges of plume dispersion, jet fire, radiative heat flux, and unconfined overpressure. We suggest targeted preventive measures and safety distance to provide references for hydrogen fueling stations’ safe construction and operation.

1. Introduction

In the context of carbon neutrality, the global energy structure is shifting from fossil fuels to renewable energy to reduce carbon dioxide emissions [1]. Hydrogen is an important way to support renewable energy development due to its advantages of extensive source, clean and carbon-neutral, high calorific value, and abundant application scenarios [2]. Countries around the world are accelerating the pace of hydrogen energy development. The US promulgated the “Hydrogen Roadmap U.S.”, Japan proposed to create a “Hydrogen based society” in the “Basic Hydrogen Strategy”, South Korea released the “Hydrogen Economy Development”, in which it planned to establish a “Hydrogen Economy Demonstration City”. China proposed the “Medium and Long-term Plan for the Development of Hydrogen Energy Industry (2021–2035)” in March 2022, which established hydrogen’s strategic position and development goals. The planning goal is 50,000 fuel cell vehicles by 2025 [3]. China is prioritizing the promotion of hydrogen fuel cell buses in several cities such as Beijing and Guangzhou. According to the “National Demonstration City Cluster of Hydrogen Fuel Cell Vehicle Statistic and Analysis Report (2022.4)”, as of 30 April 2022, China’s monitoring and management platform for new energy vehicles had accessed 8198 hydrogen fuel cell vehicles, of which 4241 were buses, accounting for 51% [4]. The growth of hydrogen fuel cell buses has begun to slow down because of various reasons such as economic situation, technology, and supporting infrastructure. A hydrogen fueling station is a special place for filling hydrogen fuel for hydrogen storage bottles of hydrogen fuel cell vehicles, hydrogen internal combustion engine vehicles, or hydrogen and natural gas hybrid fuel vehicles. As of March 2022, with the support of Chinese policies, the number of hydrogens fueling stations reached 264 [5]. Due to accidents such as the explosion of the Sandvika hydrogen fueling station in Norway [6] and the hydrogen tank explosion in Gangneung, South Korea [7], the safety of the hydrogen fueling station has become a major obstacle to hydrogen promotion. The main accidents of hydrogen fueling station are caused by hydrogen leaks, which can produce serious loss of life or property. For pushing hydrogen energy commercialization and hydrogen infrastructure construction, the risk assessment of hydrogen fueling stations has attracted extensive attention of many experts and scholars.
Risk analysis of hydrogen fueling station usually adopts the QRA method. The safety distance of hydrogen fueling stations means the fire separation distance for buildings, that is the interval distance to prevent a building on fire from igniting adjacent buildings within a certain period of time which is convenient for firefighting, and it is the minimum distance to avoid direct or indirect damage when a disaster occurs. Sakamoto et al. designed the physical model of the hydrogen fueling station, analyzed the scenario of multiple safety measures failure, and determined the combinations of failures that could cause accidents [8]. Gye et al. analyzed main risks of the high-pressure hydrogen fueling station in a densely populated area [9]. Tsunemi et al. conducted a consequence analysis and probability analysis on the hydrogen leakage scenarios in conjunction with failure trees, and concluded safety distances of 6 m, 11–12 m, and 11–12 m for the dispenser, accumulator, and compressor, respectively [10]. Kikukawa et al. analyzed the risk of hydrogen leakage in a 70 MPa hydrogen fueling station by extrapolation from a 35 MPa hydrogen fueling station, identified 721 failure scenarios by HAZOP (Hazard and Operability Studies) and FMEA (Failure Mode and Effect Analysis), and determined the effectiveness of safety measures in risk reduction if applied accurately and with a safety distance of 6 m [11]. Yuan et al. calculated the fatality probability, individual risk, and social risk of jet fire and explosion based on the actual situation of a hydrogen fueling station [12]. Li et al. quantitively analyzed the consequences of physical explosion, flash, jet fire, and vapor cloud explosion of hydrogen fueling station under different hydrogen storage pressures, leak diameters, and wind velocities, and drew the effect rules [13].
With the continuous improvement of risk analysis software, quantitative risk analysis of hydrogen fueling station is increasingly integrated with HyRAM, Phast/Safeti, FLACS, etc. Kwon et al. concluded the hazards influence regions of hydrogen leakage from core equipment combining Hy-KoRAM with Phast/Safeti [14]. Kim et al. concluded that the maximum distance of jet fire and heat radiation were 8.2 m and 10.6 m, respectively, which were caused by the 5 mm2 hydrogen leakage of the compressor at 90 MPa using Hy-KoRAM, and the individual risk metrics were in the ALARP (as low as reasonably practicable) region and acceptable region [15]. Kim et al. simulated several scenarios of hydrogen leakage through FLACS and concluded the maximum expansion distance of the explosion was 17 m [16]. Zhou et al. used CASST-QRA to conclude the effect areas of the explosion consequences under the fire prevention distances given by the national standard and design institute [17].
Comparing software simulation results with experiments for risk analysis, Park et al. designed experiments by thermal imaging camera and Schlieren imaging system and compared them with the simulation results of HyRAM, which yielded relatively conservative software results, and used RISKCURVES for analyzing individual and social risk to determine that the safety distance is 29 m between hydrogen fueling station and surroundings [18].
The above studies lack the quantitative analysis of the hydrogen leakage risk from hydrogen fueling stations and fire separation distances designed under the current Chinese regulations and the hydrogen fueling demands of hydrogen fuel cell buses. Since the development of hydrogen fueling stations started late in China, the research on quantitative risk analysis of hydrogen fueling stations is insufficient. Although the number of hydrogens fueling stations has ranked among the top in the world, the safety problems are prominent. There is an urgent need for quantitative risk analysis of hydrogen fueling stations that is suitable for Chinese conditions.
This study designed the hydrogen fueling station scenario according to the Chinese standard specifications and hydrogen fuel cell buses demand and calculated and analyzed the accidents frequencies, risk indicators, components failure frequencies, and physical models of consequences, resulting in more targeted recommendations for component precautionary measures and safety precautionary distance combining Quantitative Risk Assessment method with HyRAM developed by Sandia National Laboratories in the US.

2. Methodology

2.1. QRA Method

The QRA method is widely used in safety management, provides a technical means of quantitative risk assessment, and is suitable for hydrogen refueling stations [8,9,10,11,12,13,14,15,16,17,18]. Figure 1 shows a flow chart of our study. We combined the original QRA procedure (scenario definition, risk identification, probability analysis, and consequence analysis) with the physical models of hydrogen leakage consequences to assess risk and propose preventive measures for reducing risks.

2.1.1. Scenario Simulation Conditions

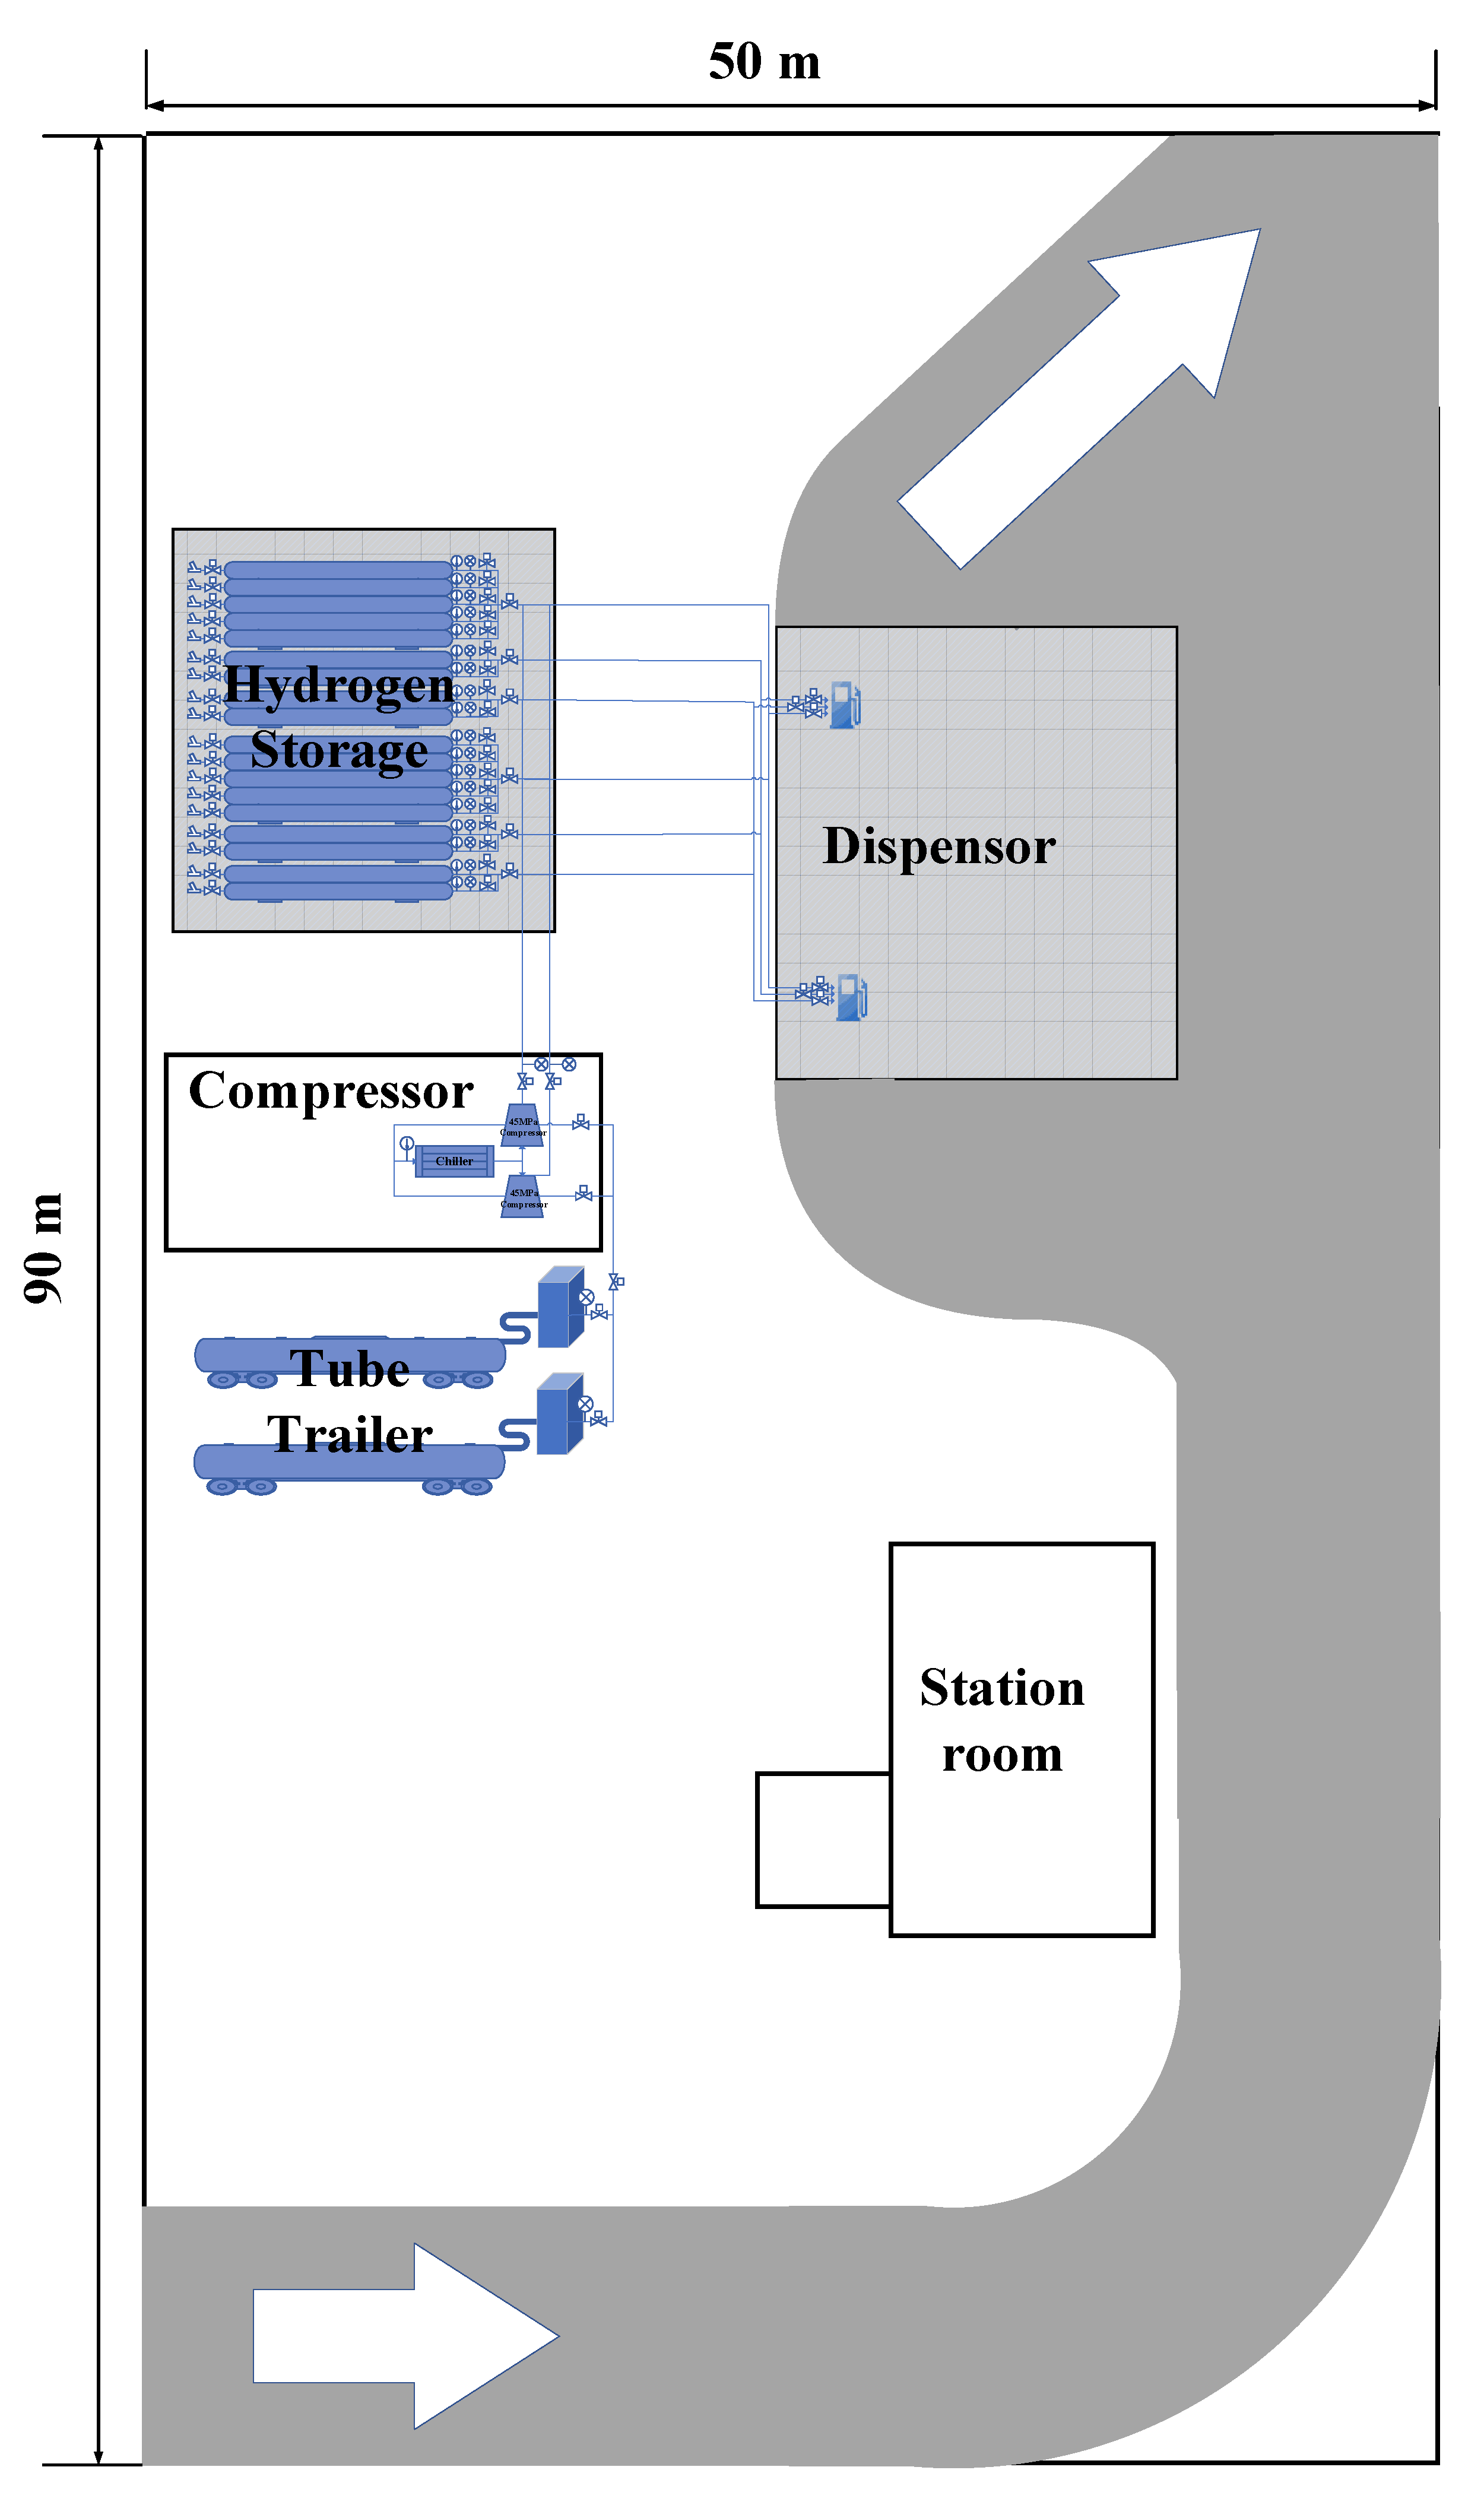
The simulation scenario is hydrogen leakage at a 35 MPa hydrogen fueling station. The station is 90 m in length and 50 m in width. We set a non-combustible solid wall with a height of 2.5 m, referring to “Hydrogen Fueling Station Technical Specifications” [19]. Assuming that the hydrogen fueling station operates continuously throughout the year, the station is staffed by three employees at all times and operates for 8760 h all year round.
China has two types of hydrogen fueling stations, one is the on-site station and the other is the off-site station. The on-site station express hydrogen production equipment in the hydrogen fueling station can produce hydrogen by itself and realize compression and filling. The off-site hydrogen fueling station refers to the delivery of hydrogen from outside of the station to the hydrogen fueling station, and filling hydrogen after secondary pressurization. The transportation modes include high-pressure gaseous hydrogen long-tube trailers, liquid hydrogen tankers, and pipeline. Due to immature technology and high cost of liquid hydrogen tankers and pipeline, most of the hydrogen fueling stations built in China are off-site stations. Therefore, we designed an off-site hydrogen fueling station in this manuscript to enhance the applicability of the results to the actual situation in China.
The hydrogen fueling station is grade three, with a capacity of less than 3000 kg and a single tank capacity of less than 800 kg. The equipment configuration is shown in Table 1. The total gaseous hydrogen mass of cylinder assemblies for storage of gaseous hydrogen is 464.41 kg at 20 °C. Assuming a hydrogen fuel cell bus’s gaseous hydrogen storage capacity is 20 kg, this station can refill 18 hydrogen fuel cell buses every day. The annual demand for this hydrogen fueling station is 6570 vehicles. According to the “Hydrogen Fueling Station Technical Specification” [19], the connection of hydrogen pipelines adopts weld fittings or bite-type fittings that have passed the hydrogen compatibility assessment. The connection between hydrogen pipelines, equipment, and valves shall be flanged or threaded. According to “Compressed Hydrogen Dispenser for Automobiles” [20], the hydrogen dispenser needs to install a gas filter between the gas source interface and the intake valve. Referring to the specifications for outer diameter and thickness of “Dimensions, Shapes, Masses and Tolerances of Seamless Steel Tubes” [21] and “Seamless Stainless Steel Pipes for Fluid Transport” [22], we set the pipe’s outer diameter to 10 mm and the pipe’s wall thickness to 1.6 mm.

2.1.2. Layout and Process Flow

The layout of the hydrogen fueling station strictly abides by the fire separation specified in the “Hydrogen Fueling Station Technical Specification” [19]. The process flow diagram and layout are shown in Figure 2. The tube trailer for gaseous hydrogen transports the hydrogen to the hydrogen unloading area, then connects the unloading hoses. The hydrogen enters the 45 MPa hydrogen compressor through the hydrogen pipeline, and after being pressed, enters the 45 MPa cylinder assemblies for storage of gaseous hydrogen, which are divided into three types: high, medium, and low for graded filling. The ratio of the number of graded cylinders is 5:2:2, thereby improving the filling efficiency and reducing the cost of hydrogen storage [23]. Where the hydrogen fueling cell vehicle is filling, the cylinder uses the pressure difference to send the gaseous hydrogen to the 35 MPa hydrogen dispensers along the pipeline.

2.2. Probability Models

The hydrogen leakage scenarios were divided into five sizes by HyRAM, which were 0.01%, 0.1%, 1%, 10%, and 100% of the pipeline’s cross-sectional area (inner diameters of 0.068 mm, 0.215 mm, 0.68 mm, 2.15 mm, and 6.8 mm) [24]. In the 0.01%, 0.1%, 1%, and 10% leakage scenarios, the frequency of each component is independent, while for the 100% leakage scenario, accidents and shutdown failure factors are added, and the vehicle hydrogenation demand is considered, the leakage frequency is calculated as the following equations [24].
P ( A c c i d e n t ) = P ( R u p t u r e   D u r i n g   F u e l i n g ) + P ( R e l e a s e   D u e   t o   D r i v e O f f )
P ( S h u t d o w n   F a i l u r e ) = P ( N o z z l e   R e l e a s e ) × P ( M a n n u a l   V a l v e   F a i l   t o   C l o s e ) × P ( S o l e n o i d   V a l v e   F a i l   t o   C l o s e )
f A c c i d e n t   a n d   S h u t d o w n   F a i l u r e = f F u e l i n g   D e m a n d s × P ( A c c i d e n t   a n d   S h u t d o w n   F a i l u r e )
Exposure to the effects of thermal radiation and overpressure from hydrogen leaks can cause harm or death. The harm models of thermal radiation and overpressure incorporate the probability formula to calculate the probability of harm or death in accidents. The probability formula is:
P ( f a t a l i t y ) = F ( Y | μ = 5 , σ = 1 ) = Φ ( Y 5 )
where Φ is the normal cumulative distribution function [24].
Thermal radiation damages personnel, equipment, and structures listed in Table 2. Because the exposure time required for damage is more than 30 min, people can complete the evacuation before the structure is damaged. Therefore, we analyzed the influence of thermal radiation on personnel. Thermal radiation’s damage degree is shown in Table 3. The formula of harm from radiant heat fluxes is:
V = I ( 4 3 ) × t
where V is the thermal dose unit, as an index of harm measuring, I is the radiant heat flux in W/m2, and t is the exposure time in seconds [24].
Four thermal probability models are encoded in HyRAM, which are Eisenberg, Tsao and Perry, TNO, and Lees models. Hydrogen leakage will produce infrared radiation and ultraviolet radiation, but the infrared radiation in the hydrogen fires is far less than the ultraviolet radiation. The result of the Tsao and Perry model would be conservative for exposure to hydrogen fires. Although the Eisenberg model only considers the influence of ultraviolet radiation, the results have better accuracy and generality at present [28]. Therefore, we adopted the Eisenberg model [29] in HyRAM. The formula is:
Y = 38.48 + 2.56 × ln ( V )
The possible accident effect of overpressure has two types, including direct effect and indirect effect, as shown in Table 3. According to Table 3, we concluded that the pressure required to throw a person against obstacles or to generate missiles that can penetrate the skin is far less than the pressure required to cause fatal lung damage. In addition, persons in the building structure have a higher probability of being crushed to death. Therefore, we adopted Models (7) and (8) in HyRAM.
TNO—Head impact model [30]:
Y = 5 8.49 ln [ 2430 P S + 4.0 × 10 8 P S i ]
TNO—Structure collapse model [30]:
Y = 5 0.22 ln [ ( 4000 P S ) 7.4 + ( 460 i ) 11.3 ]
where Ps is peak overpressure in Pa, i is the impulse of the shock wave in Pa × s.

2.3. Risk Indicator

According to the harm models selected above, we used the Potential Loss of Life (PLL) to calculate the risk level of thermal radiation and overpressure accidents and analyzed the results referring to the individual acceptable risk criteria in China. The PLL is calculated as follows [24]:
P L L = n ( f n × c n )
where n is one of the possible accident scenarios, fn is the frequency of scenario n, and cn is the expected number of fatalities for scenario n.
The hydrogen fueling station is a low-density place since the number of staff and customers is less than 30. The individual acceptable risk criterion in China for new stations is 1 × 10⁻⁵ fatalities/year in this place [31].

2.4. Hazard Models

2.4.1. Gas Plume Dispersion

HyRAM uses the physical model of plume dispersion described by Houf and Winters [32]. The model is a one-dimensional model that takes into account buoyancy effects but does not consider the aspect of wind [24]. The jet plume models are Equations (10)–(12).
v = v c l exp ( r 2 B 2 )
ρ = ( ρ c l ρ a m b ) exp ( r 2 λ 2 B 2 ) + ρ a m b
ρ Y = ρ c l Y c l exp ( r 2 λ 2 B 2 )
where:
v is the velocity of hydrogen,
ρ is the density of hydrogen,
the subscript amb denotes ambient,
the subscript cl is the centerline,
B is a characteristic half-width of the jet with half value of vcl,
λ is the ratio of density spreading relative to velocity,
r is a radius that is perpendicular to the stream-wise direction,
Y is the mass fraction of hydrogen.
We analyzed the diffusion distance and mole fraction of hydrogen leak in five leak size scenarios, including 0.068 mm, 0.215 mm, 0.68 mm, 2.15 mm, and 6.8 mm leak sizes in hydrogen storage vessels with a pressure of 45 MPa. We set the contour mole fraction to 0.04 in HyRAM, which is the lower explosion limit (LEL) of hydrogen.

2.4.2. Jet Fire Temperature and Trajectory

The jet fire physical models [24,33,34] used in HyRAM are Equations (13)–(18).
L = L f v i s s d j ρ j ρ a m b
q r a d ( x , r ) = S r a d C 4 π r 2
S r a d = X r a d m · f u e l Δ H c
X r a d = 9.45 × 10 9 ( τ f a p T a d 4 ) 0.47
τ f = ρ f W f 2 L v i s f s 3 ρ j d j 2 u j
ρ f = p a m b W m i x R T a d
where:
L* is a non-dimensional flame length,
Lvis is the visible flame length,
fs is the mass fraction of fuel in a stoichiometric mixture of fuel and air,
dj is the orifice diameter,
ρj and ρamb are the density of fuel at the orifice and air,
qrad (x,r) is the radiant heat flux measured at a particular axial location, x, and radial position, r,
Srad is the total emitted radiative power from a flame,
C* is the normalized radiative heat flux,
Xrad is the radiant fraction,
m · fuel is the mass flow rate of fuel,
Hc is the heat of combustion (120 MJ/kg for hydrogen [35]),
τf is the flame residence time,
ap is the Plank-mean absorption coefficient for an optically thin flame (0.23 for hydrogen [36]),
Tad is the adiabatic flame temperature,
ρf is the flame density,
uj is the velocity of the jet at the exit (orifice),
Pamb is the ambient pressure,
Wmix is the mean molecular weight of the stoichiometric products of hydrogen combustion in air,
R is the universal gas constant.

2.4.3. Radiative Heat Flux

Heat radiation is the main heat transfer mechanism in hydrogen fires. The curved flame of radiative heat flux from the buoyancy corrected is calculated by a weighted multi-source model [37], which is calculated as:
q = τ S r a d V F A f
τ V F A f = i = 1 N w i cos β i 4 π D i 2 τ i
w i = i w 1 i 0.75 N n n 1 N n 1 i n + 1 w 1 i > 0.75 N
where:
VF is the view factor, proportional to the heat flux transmitted to the observer,
τ is the transmissivity,
Af is the surface area of the flame,
the constraint is 1 n N , i = 1 N w i = 1 ,
wi is the emitter strength weighting parameter,
D and β are the distance and angle, respectively, between the observer and unit normal to the point emitter.

2.4.4. Unconfined Overpressure

The hydrogen storage area of the station is an open area, then the scenario of overpressure due to delayed ignition of leaking hydrogen is calculated by the TNT-equivalence method [27], which estimates the effects of an explosion relating to the trinitrotoluene explosion. The formulas are Equations (22) and (23).
m T N T e q u i v = F e q u i v m f l a m Δ H c Δ H c , T N T
R T N T = R m T N T e q u i v ( 1 3 )
where:
m T N T e q u i v is the mass of TNT that contains the same energy as combusted gaseous hydrogen,
Fequiv is the equivalence factor, which is set as 3% [38],
Hc,TNT = 4.68 MJ/kg [24],
R is the distance of overpressure,
R T N T is the scaled distance of the equivalent mass of TNT.

3. Results and Discussion

3.1. Consequence Analysis

The main risks of hydrogen fueling station are fire and explosion triggered by gaseous hydrogen leak. The volume of the leak determines the degree of accident losses. High-pressure hydrogen storage vessels, compressors, dispensers, hoses, trailers, etc. all have the possibility of hydrogen leakage. Hydrogen leakage causes frostbite, suffocation, jet fire, flash fire, and explosion accidents.
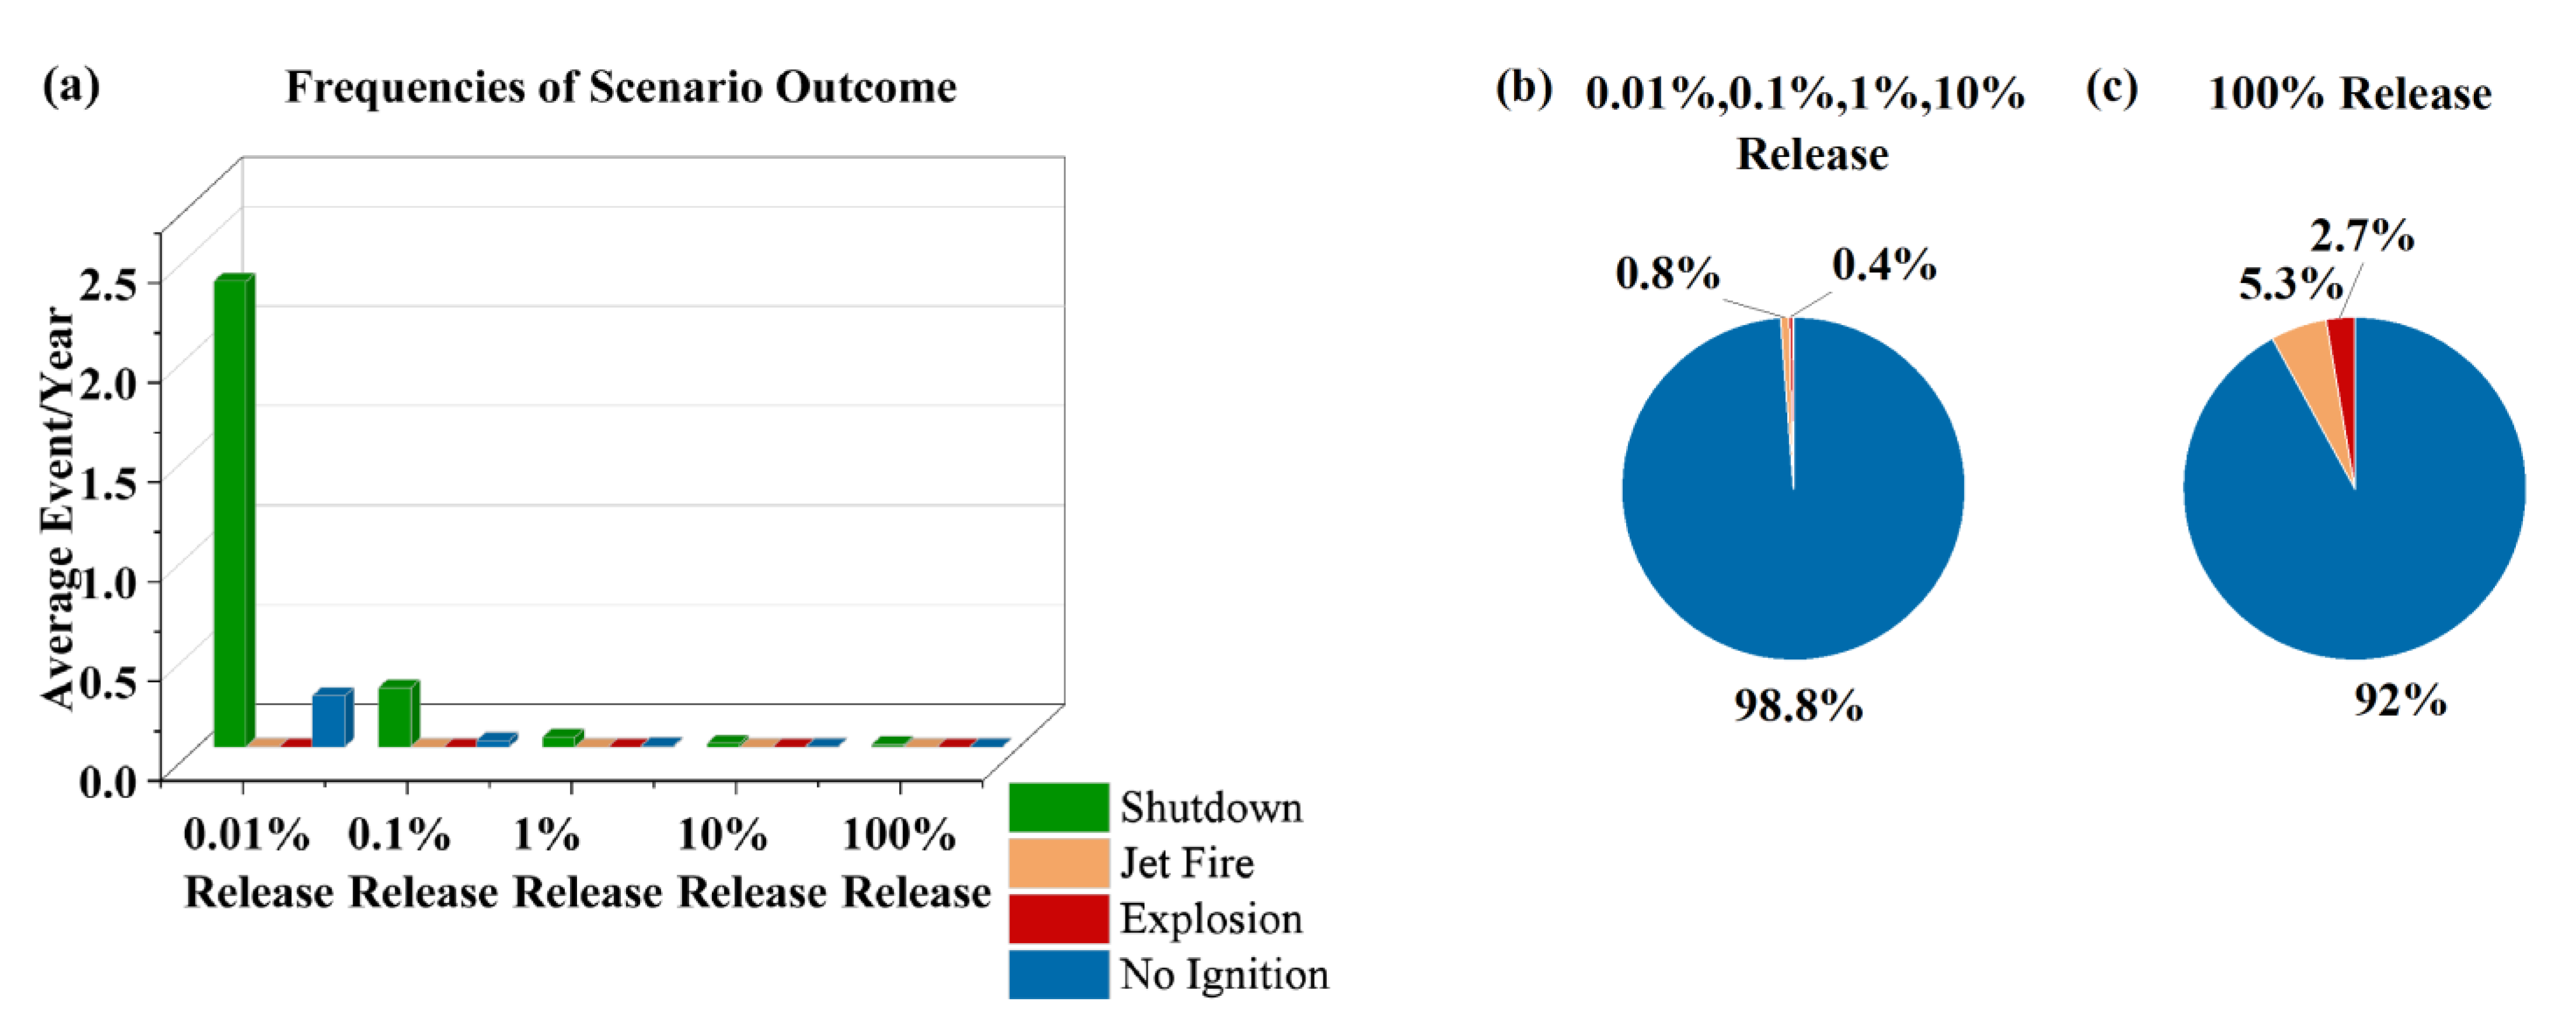
In cases where a hydrogen leak is detected and isolated by safety devices, the leaks are shut down, and no accidents occur generally. When hydrogen leakage is not detected and isolated, if there is no ignition source, a non-ignition leakage accident will occur, which may cause frostbite or suffocation. If there is an ignition source to ignite immediately, a jet flame will occur causing a personal burn accident. If the ignition is delayed, the hydrogen will accumulate, in the case of obvious overpressure, a vapor cloud explosion accident will occur, causing shock injuries to personnel; in the case of hydrogen accumulation without overpressure, flash fire accidents will occur. When the hydrogen leakage rate is less than 0.125 kg/s, the probability of immediate ignition is 0.8% and the probability of delayed ignition is 0.4%. When the hydrogen leakage rate is between 0.125 kg/s to 6.25 kg/s, the probability of immediate ignition is 5.3% and the probability of delayed ignition is 2.7%. When the hydrogen leakage rate is greater than 6.25 kg/s, the probability of immediate ignition is 23%, and the probability of delayed ignition is 12% [39].
Table 4 shows the results of risk indicators calculated by HyRAM. The PLL value under the conditions of Eisenberg and TNO-Structure Collapse models is 3.175 × 10⁻⁵, which is higher than the standard (1 × 10⁻⁵) and requires appropriate prevention measures to reduce the risk. The risk contribution refers to the ratio of each accident scenario to all accident scenarios. Among the hazards of collapse and thermal radiation, the highest risk contribution is 94.932% for the explosion scenario triggered by a 100% hydrogen leak size. The PLL value under the conditions of Eisenberg and TNO-Head Impact models is 4.414 × 10⁻⁹, which is far below the standard, and the risk contribution is concentrated in the jet fire scenario triggered by a 100% hydrogen leak size.

3.2. Probability Analysis

Based on the random leakage frequency data of components integrated into the HyRAM, we can get a probability rank of consequences, including timely shutdown, jet fire, explosion, and unignited leakage. The probability of leakage detected and isolated is 90%, which is default value of HyRAM [24].
As is shown in Figure 3, the accidents are mostly concentrated in leakages of small sizes, such as 0.068 mm and 0.215 mm. Among them, the “No Ignition” of 0.068 mm leakage scene occurred the most, reaching 0.257 times/year. Among the five leakage scenarios of 0.068 mm, 0.215 mm, 0.68 mm, 2.15 mm, and 6.8 mm, except for the consequence of leakage detected and isolated, the proportions of “No Ignition” are the largest. Due to the interaction between dispensers and human, the probabilities of jet fire and explosion are greatly increased in the 6.8 mm leakage scenario.
The cut-set refers to the predicated failure frequency of components in each scenario. It is shown in Figure 4.
In the small size leakage scenarios of 0.01% and 0.1%, the component with the highest failure frequency is the flange, which is far higher than other components, followed by the compressor, valve, and instrument. In the 1% leakage scenario, the highest failure frequency is still the flange. However, as the leakage size increases, the flange’s failure frequency drops sharply. Meanwhile, the failure frequencies of compressors, valves, and instruments are prominent. In the 10% and 100% size leakage scenarios, the filter’s failure frequency exceeds the flange’s and is the highest frequency, followed by the instrument. In addition, in the leakage scenario of 100% size, not only the failure of each component needs to be considered, but also the following scenarios should be taken into account, namely the pipeline rupture caused by overpressure during filling, the customer driving away without completing the filling process, or the nozzle release and manual valve and solenoid valve shutdown failure. The frequencies of factors that may cause “accidents and shutdown failure” are introduced in Figure 4f, where nozzle release, manual valve, and solenoid valve shutdown failure all have a high frequency. According to Equations (1)–(3), the frequency of accidents and shutdown failure is 1.8 × 10⁻⁵ times/year, which is much lower than the other components. Therefore, the prevention of hydrogen leakage accidents in hydrogen fueling stations needs to consider not only the core equipment, but also the purchase, installation, and maintenance of flanges, valves, instruments, and filters.

3.3. Hazard Simulation Analysis

3.3.1. Plume Dispersion

Figure 5 shows the hydrogen plume dispersion of five leak sizes in 45 MPa. At the same pressure, the hydrogen diffusion distance increased as the leak diameter increased. The maximum diffusion distance triggered by a 6.8 mm leak diameter is approximately 33 m, while in the leak diameter of 0.068 mm, the maximum diffusion distance is only approximately 0.35 m.

3.3.2. Jet Flame Temperature and Trajectory

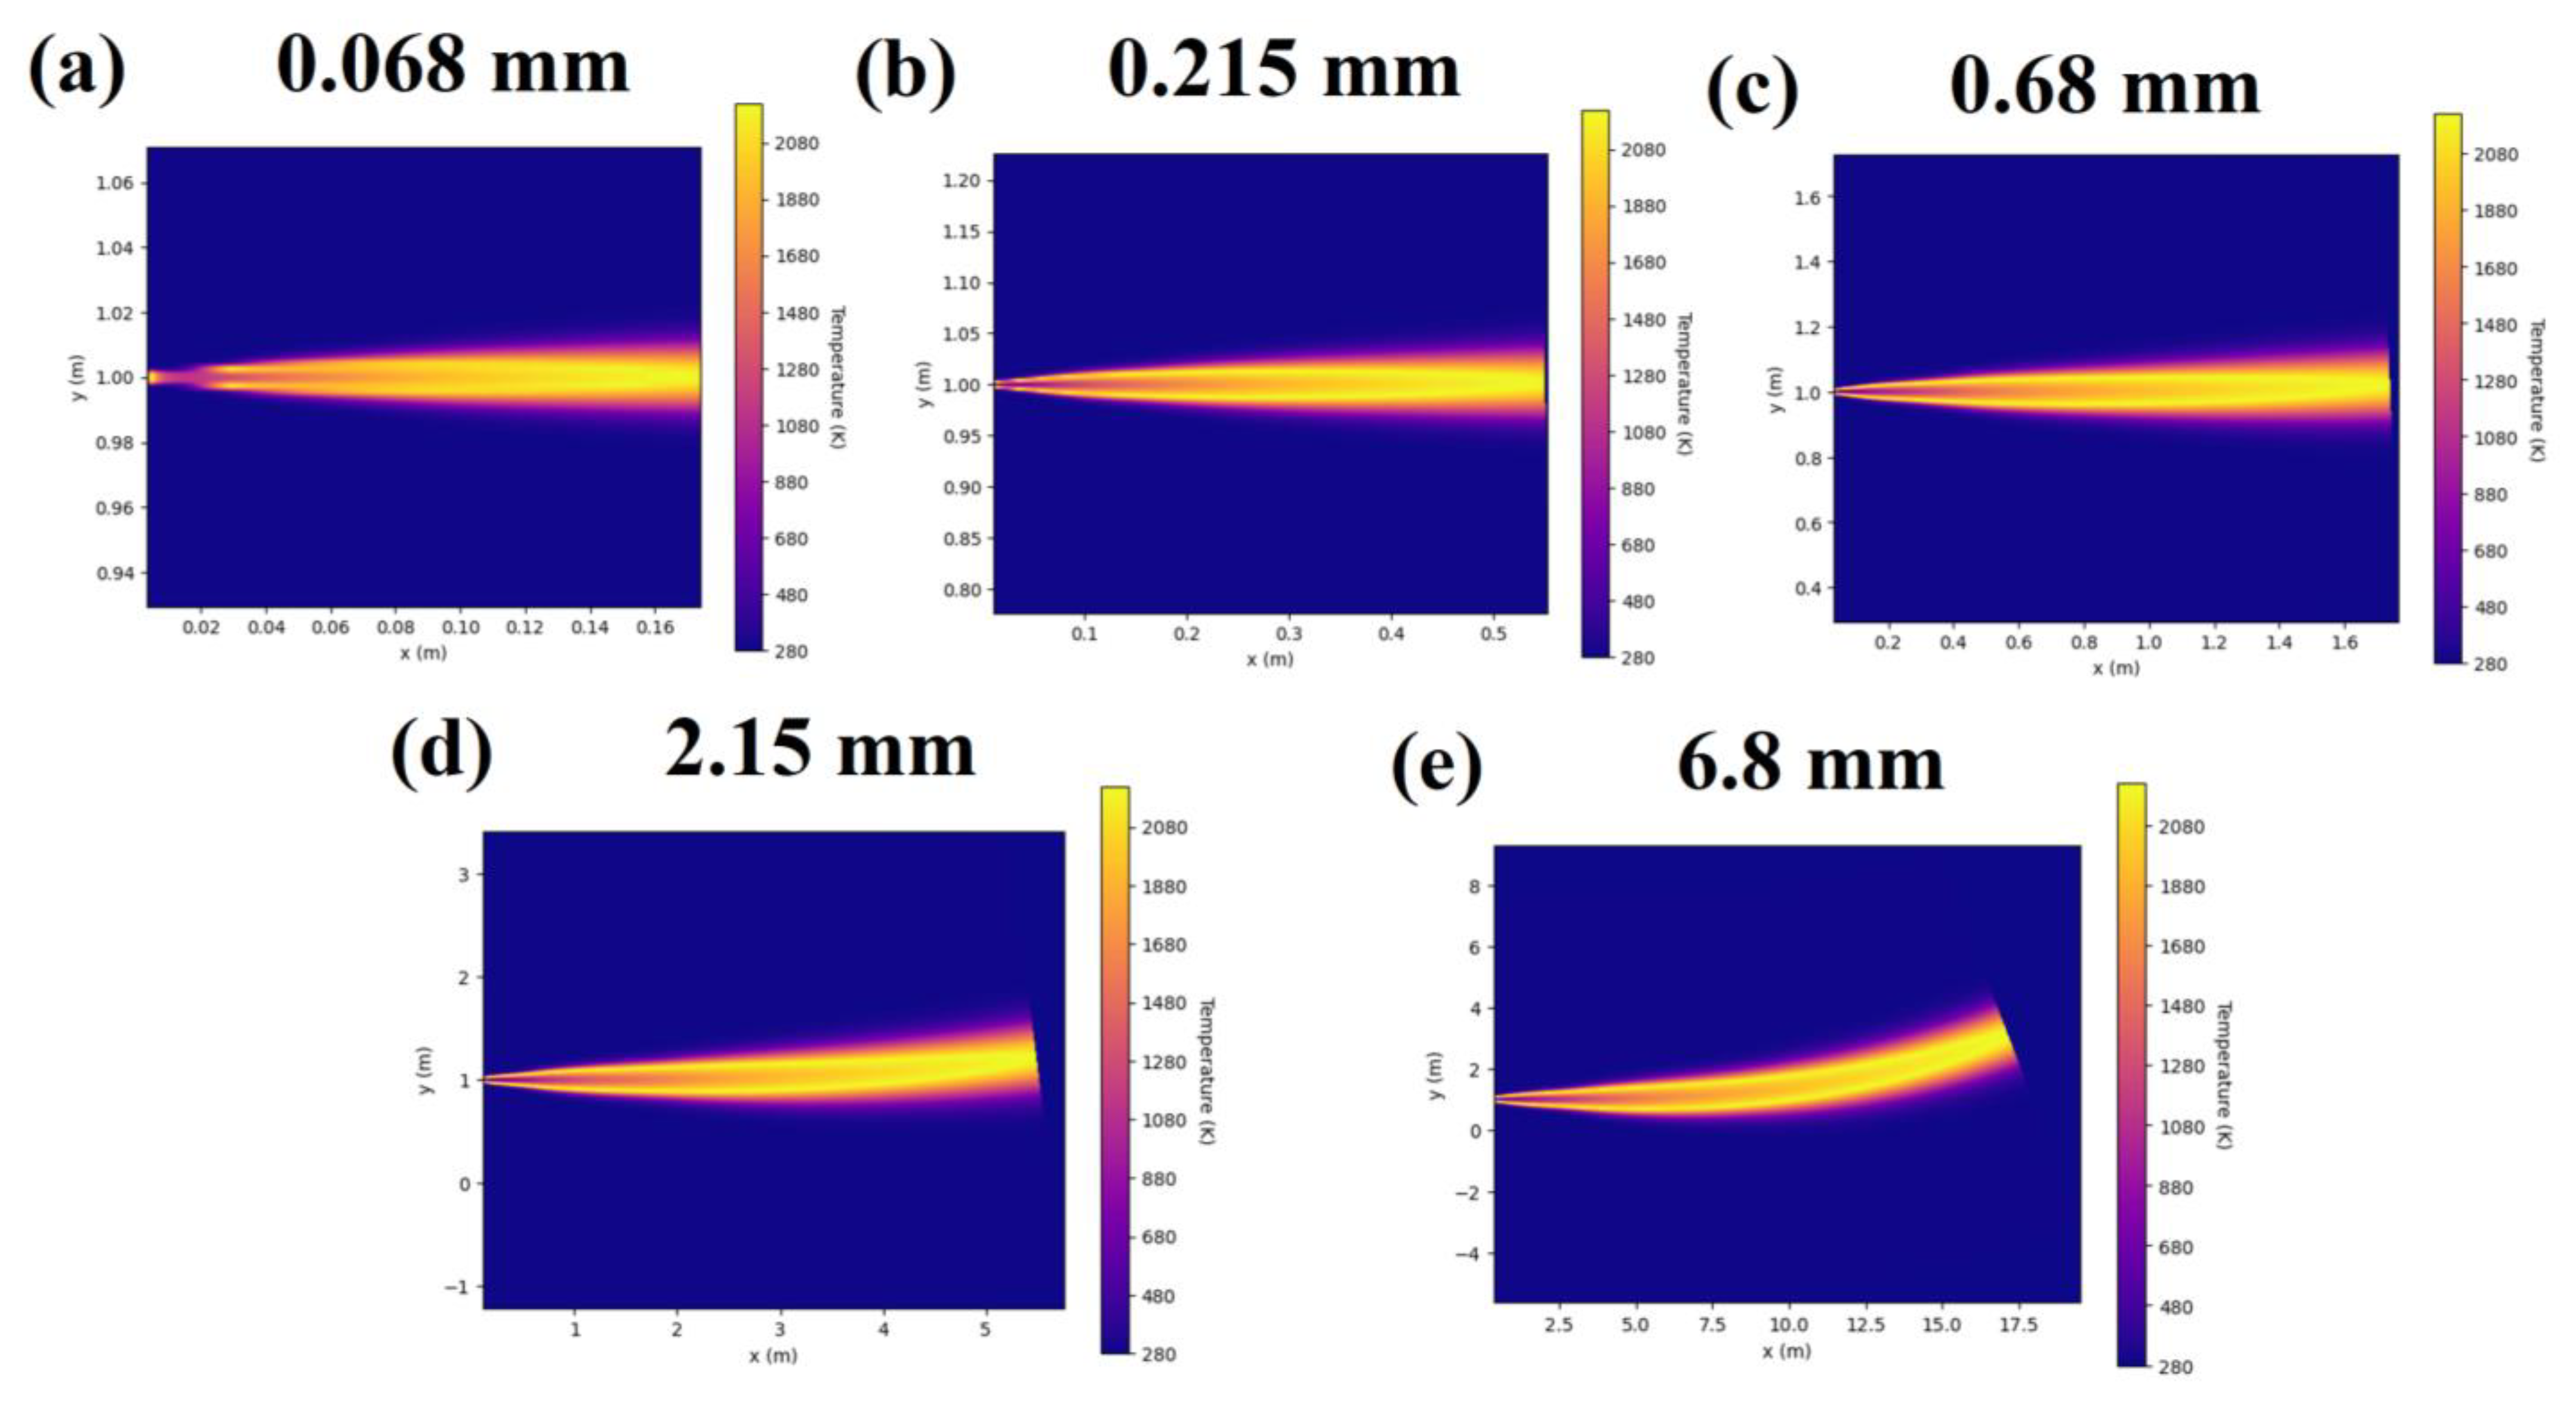
Figure 6 shows the simulated jet flame shape of hydrogen for five leak sizes. We took into account the pressure of 45 MPa of the hydrogen storage vessels. The maximum distance of the jet flame for the 0.068 mm, 0.215 mm, 0.68 mm, 2.15 mm, and 6.8 mm leak diameters reached approximately 0.17 m, 0.6 m, 1.7 m, 5.5 m, and 17.5 m, respectively. Without considering the barrier of the partition wall, the jet flame has influenced the refilling area and unloading area, and there are risks of burn injury to staff and customers.

3.3.3. Radiative Heat Flux Effect

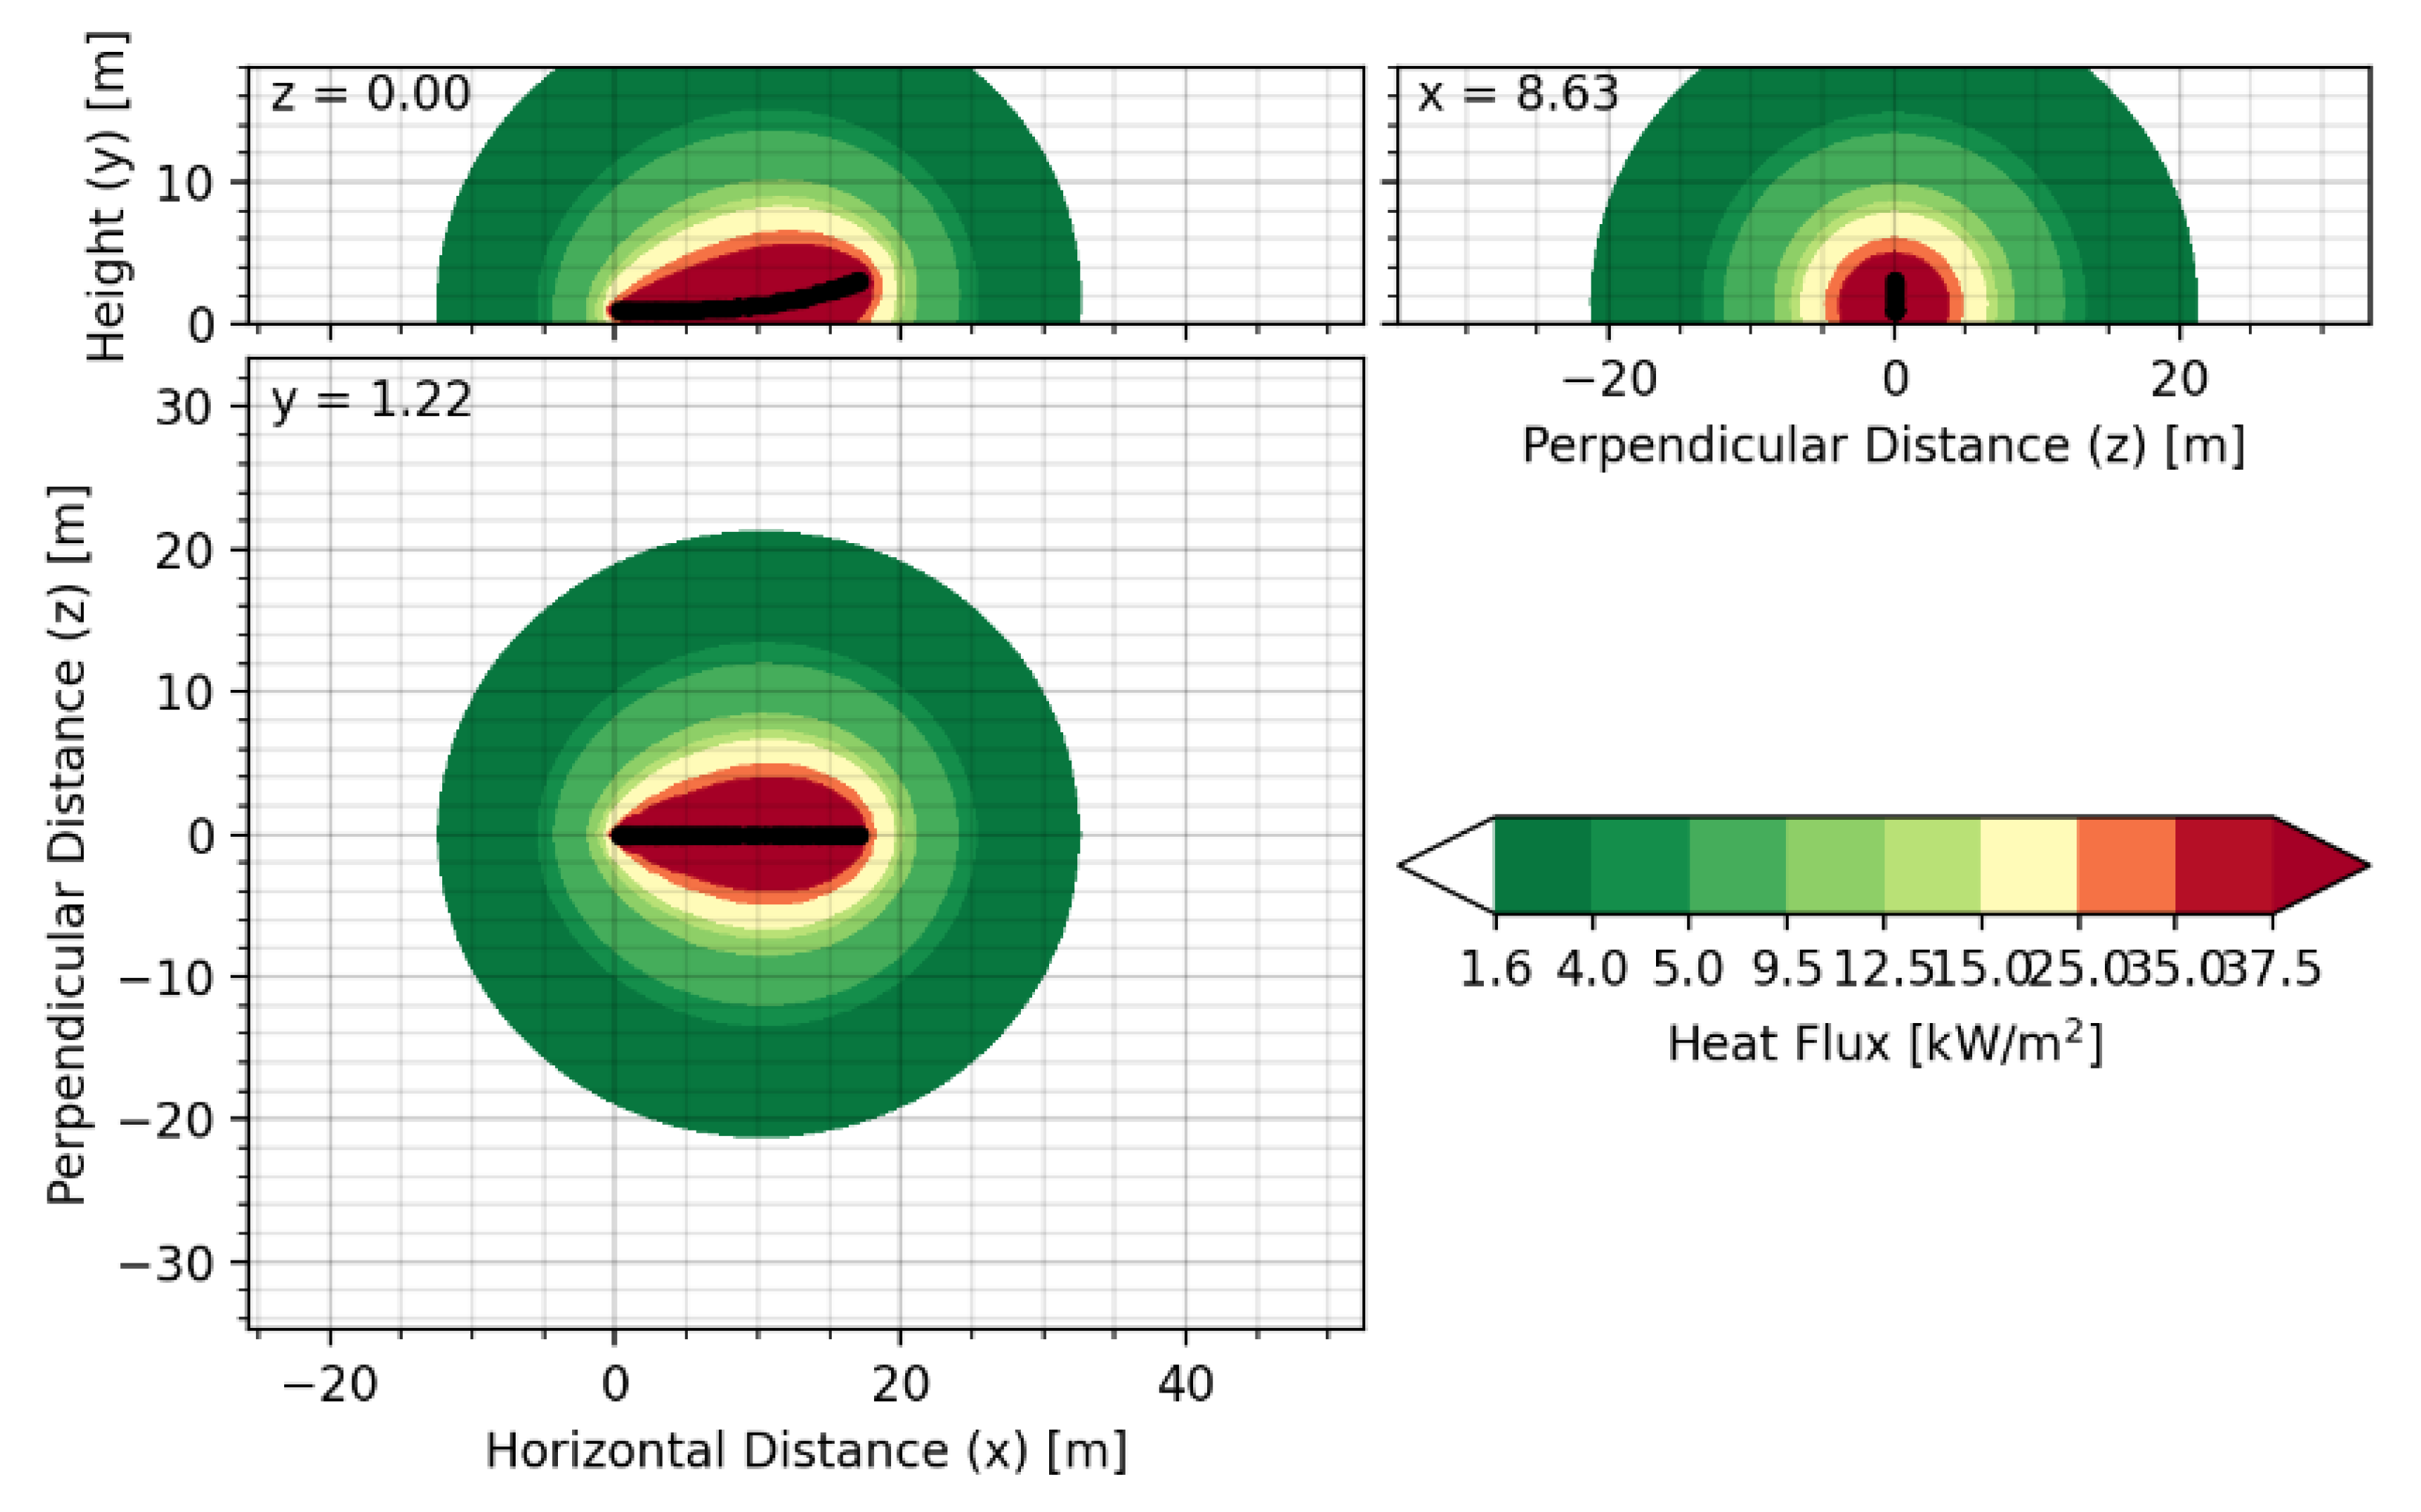
HyRAM is used to analyze the influence region of radiant heat flux. The heat flux rate is divided according to Table 2. The influence region of radiative heat flux for a 6.8 mm leak diameter at a pressure of 45 MPa is shown in Figure 7. In the simulation scenario of the most serious 100% pipe cross-sectional area leakage in five sizes, the radiative heat flux of 35 kW/m2 was transmitted up to 15 m, which has a 1% probability of death within 10 s of exposure in this area. Therefore, this region belongs to a high-risk region. The area of heat flux propagation (i.e., heat flow rate over 4 kW/m2) where first-degree burns and more serious consequences may occur to the human is more than 30 m. The staff of the station should maintain a safe distance of at least 15 m and be able to escape more than 30 m within the 20 s to prevent the occurrence of first-degree burn hazards when a 6.8 mm diameter leak occurs at 45 MPa pressure.

3.3.4. Unconfined Overpressure

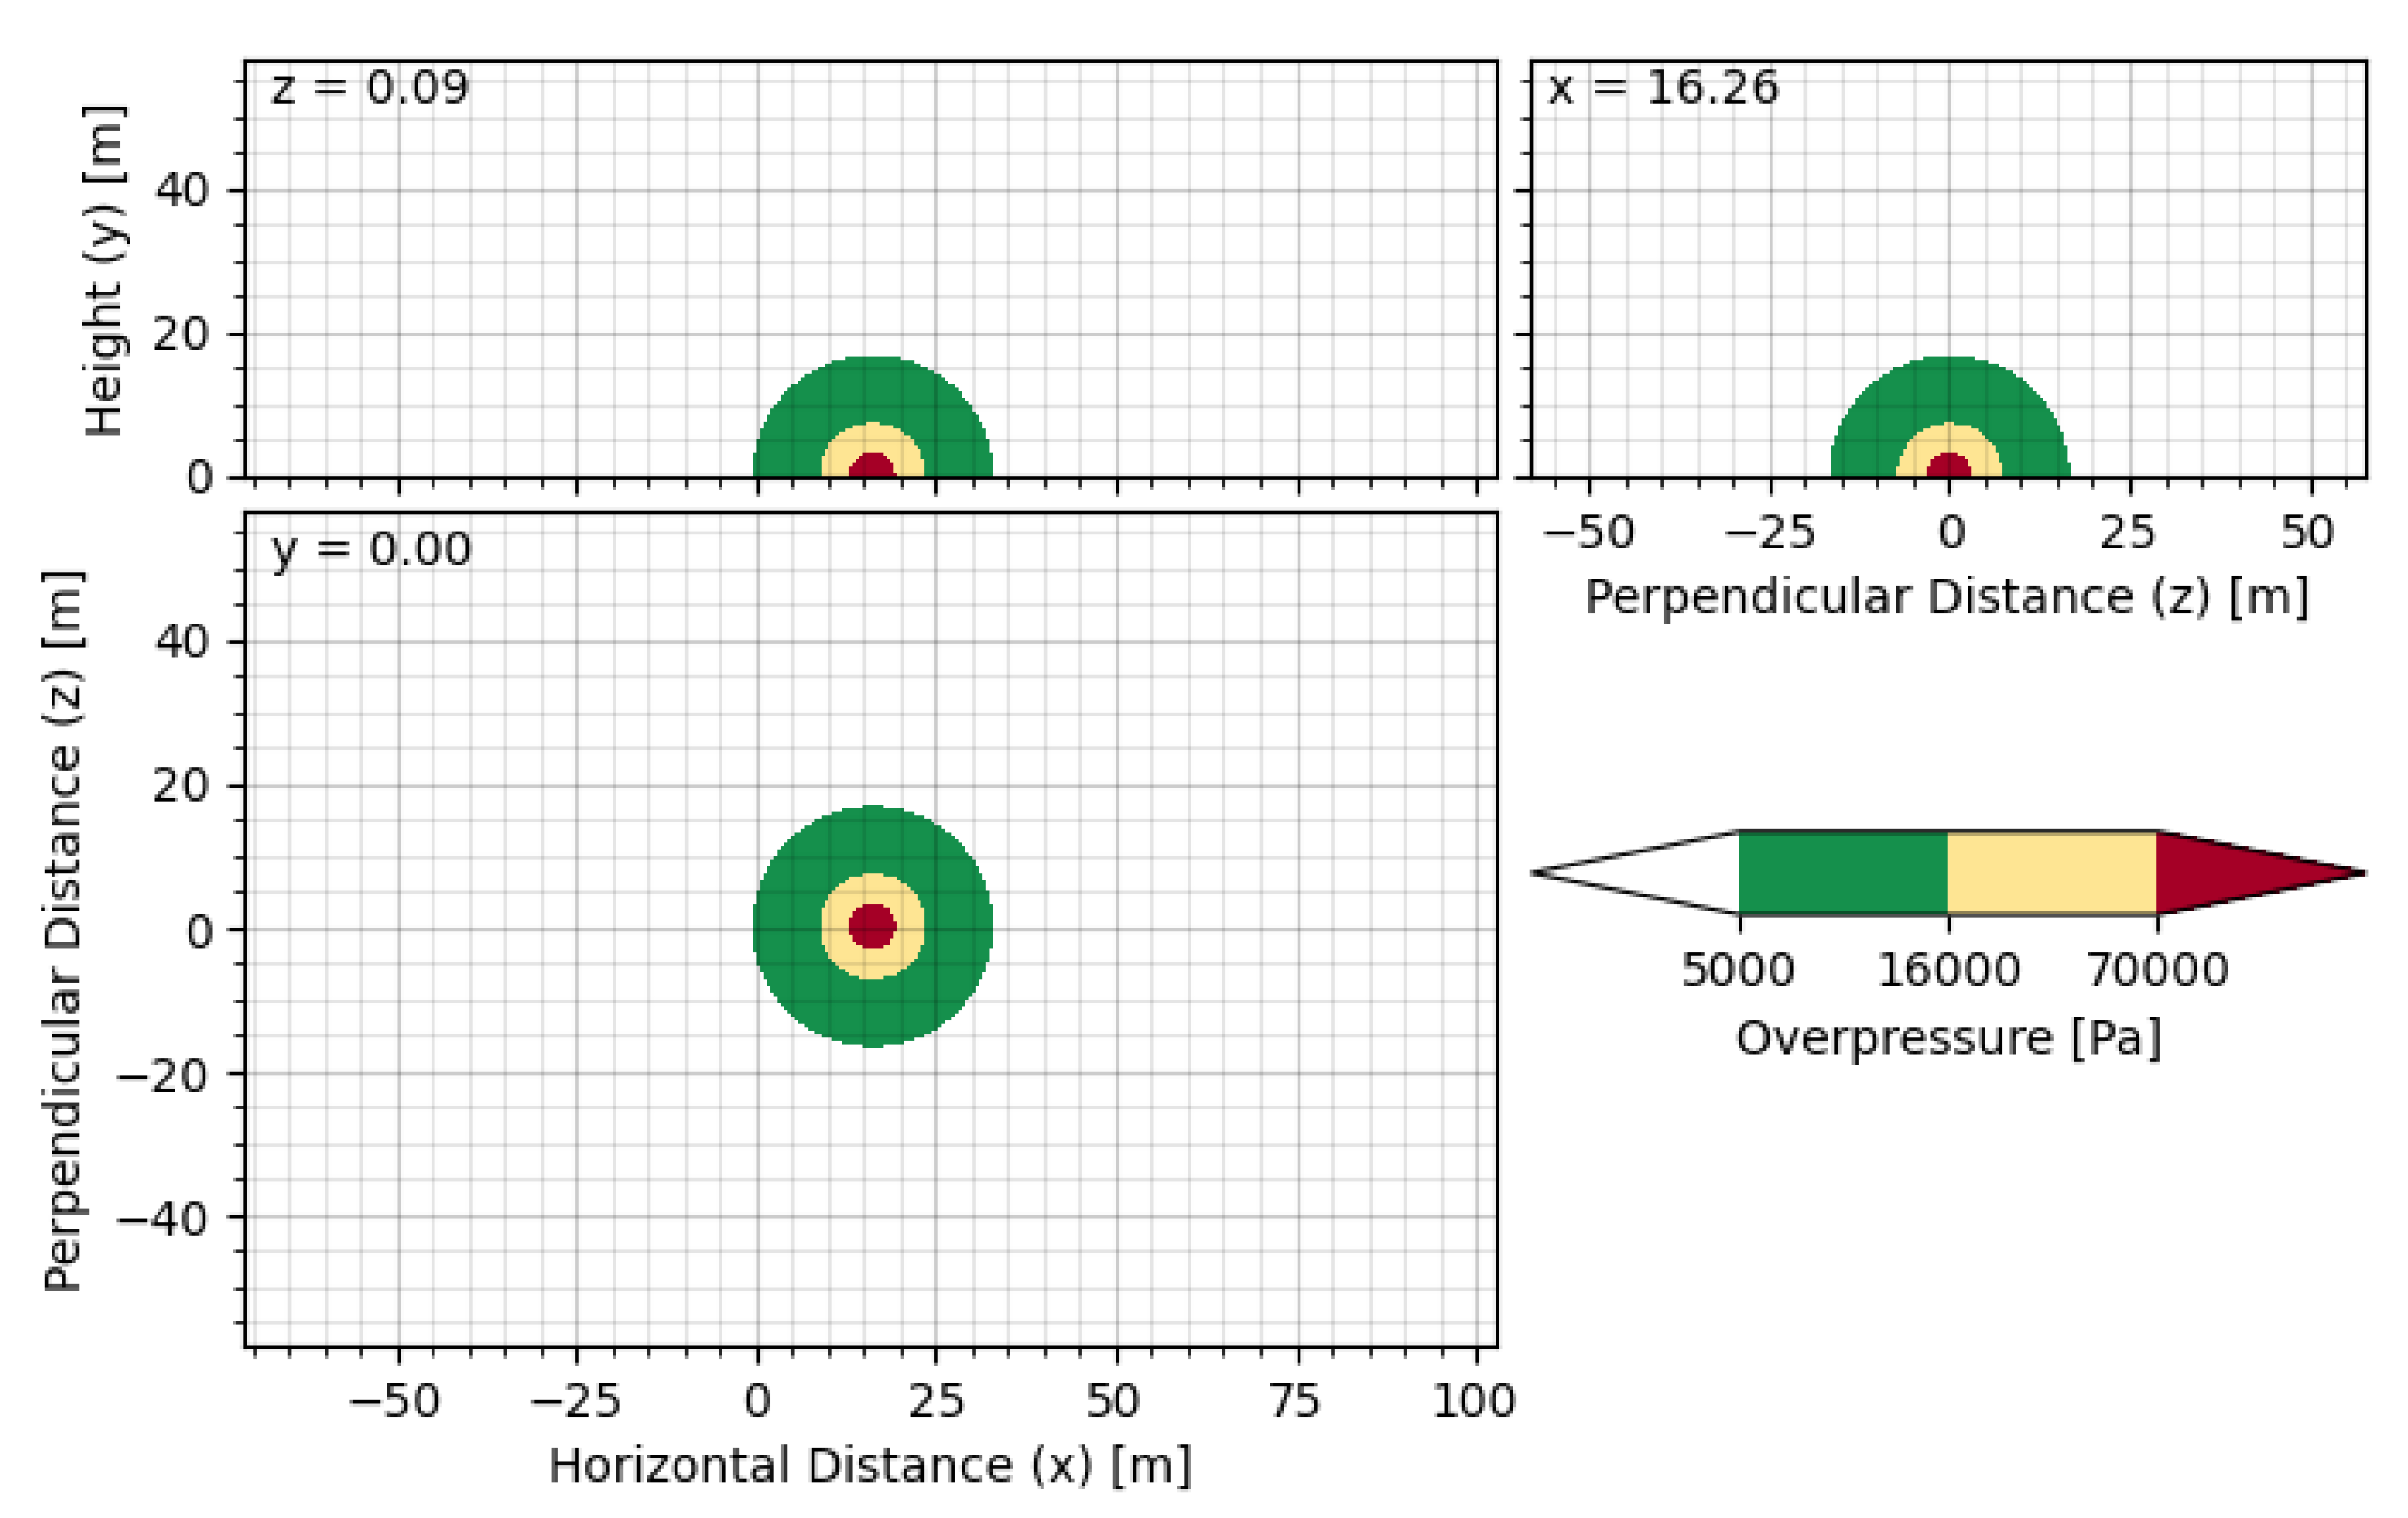
The result of the simulated overpressure is shown in Figure 8. We analyzed the leakage scenario of 6.8 mm diameter at 45 MPa, the most serious one among the five leak sizes. The radius of the overpressure area is more than 15 m, which is affected by the delayed ignition of the leaking gaseous hydrogen over 5 kPa. Among this area, the radius is approximately 7.5 m of the region affected by overpressure higher than 16 kPa, which has risks of structure collapse, possible fatality by being projected against obstacles, and skin lacerations by missiles. The diameter of the area higher than 70 kPa is approximately 5 m, which is a high-risk area with the risks of destruction of buildings, heavy machinery damage, and a 100% probability of fatality from missile wounds.
We considered the above four hazards overall and integrated the specific effect regions of the above four models in Figure 9. The region of radius 17.5 m that the jet fire reached is the most harmful area for people with the risk of burns or even death. People should avoid staying here for a long time. The gaseous hydrogen plume diffused the farthest distance, reaching 33 m. This area must forbid ignition sources. The radius of the radiant heat flow area reached 30 m, and the damage caused in this area takes 20 s to accumulate. Therefore, people should escape from this area within 20 s when a leak occurs. Referring to the fire separation distance between the hydrogen storage vessel and other facilities in the station as specified in the “Hydrogen Fueling Station Technical Specification” [19], the fire separation distance of 8 m between the third-level hydrogen storage vessel and dispenser is less than the effect range of 17.5 m of jet fire. Due to the high frequency of interaction between the hydrogen dispenser and people, the risk caused by hydrogen leakage under the condition of 6.8 mm diameter and 45 MPa pressure will do terrible damage to the staff of the station and customers, without fire barriers.

4. Conclusions

This paper adopted the QRA method to analyze the risk of hydrogen fueling stations designed referring to Chinese specifications, combined with HyRAM. We calculated that the PLL value of thermal radiation and structure collapse accidents caused by hydrogen overpressure explosion exceeded the Chinese individual acceptable risk standard and the PLL value of thermal radiation and head impact accidents caused by hydrogen overpressure explosion was lower than the standard. We concluded the distribution of high-incidence consequences of five leak sizes and high-frequency failure components triggering hydrogen leak, including flanges, valves, compressors, instruments, and filters. Based on the above results, we proposed specific recommendations for safe hydrogen fueling station construction and operation.
The purchase of flanges, valves, compressors, instruments, and filters should strictly follow the specified parameters. The installation should strictly comply with the design torque, protect the joint surface, and ensure the welding quality, among which the installation of instruments should also abide by the “Technical code of construction of instrumentation engineering for petrochemical industry” [40]. Pay attention to the anti-corrosion of pressure vessels by controlling the purity of gaseous hydrogen strictly. Set up a safe, effective, and reasonable control system to ensure smooth connection and control of monitoring, alarm, cut-off, and exhaust system.
We simulated the physical scenarios of plume dispersion, jet fire temperature and trajectory, radiative heat flux, and unconfined overpressure by the physic module of HyRAM, and concluded as follows:
(1)
As the leak size increases, the distance of hydrogen diffusion increases. The distance reached 33 m in the scenario of a 100% leak, 6.8 mm pipe cross-sectional area at 45 MPa. Ignition sources should be prohibited in this area.
(2)
In the simulated jet fire scenario, the jet distance of flame was positively correlated with the leak size. The flame jet distance exceeded 17.5 m and the central temperature exceeded 2000 K in the 6.8 mm leak size and 45 MPa. The staff and customers should avoid staying here for a long time without fire barriers.
(3)
The radiant heat flux of the high-risk area was more than 15 m horizontally along the leakage direction, reached 5 m perpendicular to the leakage direction, and rose more than 6 m under the condition of 6.8 mm and 45 MPa, which had a probability of death. The horizontal direction of the area that would cause first-degree burns to people reaching 30 m.
(4)
The radius of the affected area that would cause indirect injury to people was 7.5 m approximately in the accident simulation of the unconfined overpressure caused by delayed ignition and accumulation of leaking hydrogen, with 6.8 mm leak diameter and 45 MPa. The staff must wear safety helmets and stay away from buildings when they are in this area due to work requirements.
Considering the calculation of risk indicators (PLL value) and the hazard simulation, Figure 5, Figure 6, Figure 7, Figure 8 and Figure 9, overall, the fire-proof and explosion-proof design of the buildings should be strictly controlled at the early stage of hydrogen fueling station construction, especially in the area where people stay for a long time, to reduce the occurrence of structure collapse fatal accidents. When a leakage accident occurs without being dealt with in a timely manner, staff and customers must keep a safe distance of more than 17.5 m from the leakage source, and should not stay more than 20 s within a 30 m radius of the leakage source.

Author Contributions

Conceptualization, J.W.; data curation, J.W., X.Z. and G.Q.; formal analysis, Y.P. and G.Q.; software, G.Q.; supervision, J.W., S.W. and X.Z.; visualization, G.Q.; writing—original draft, J.W., X.Z. and G.Q.; writing—review and editing, J.W., Y.P. and X.Z. All authors have read and agreed to the published version of the manuscript.

Funding

This study has been supported by the Research Fund of Chinese Academy of Engineering (Grant No. 2021-JZ-03).

Institutional Review Board Statement

Not applicable.

Informed Consent Statement

Not applicable.

Data Availability Statement

Not applicable.

Acknowledgments

The authors would like to thank respondents and anonymous reviewers for their precious feedback and comments.

Conflicts of Interest

The authors declare no conflict of interest.

References

  1. IREA. Global Energy Transformation: A Roadmap to 2050; International Renewable Energy Aagency (IREA): Abu Dhabi, United Arab Emirates, 2019. [Google Scholar]
  2. China EV100. China Hydrogen Energy Industry Development Report 2020. Beijing. 2020. Available online: http://www.ev100plus.com/content/details1041_4302.html (accessed on 1 May 2022).
  3. NDRC. Medium and Long-Term Plan for the Development of Hydrogen Energy Industry (2021–2035). National Development and Reform Commission (NDRC) Beijing. 2022. Available online: https://www.ndrc.gov.cn/xxgk/zcfb/ghwb/202203/t20220323_1320038.html?code=&state=123 (accessed on 1 May 2022).
  4. NDANEV. National Demonstration City Cluster of Hydrogen Fuel Cell Vehicle Statistic and Analysis Report (2022.4). Beijing. 2022. Available online: http://www.ndanev.com/category/achievement/ (accessed on 1 May 2022).
  5. Trend Bank. Trend Bank Hydrogen Fueling Station Database. China Ninngbo. 2022. Available online: https://www.evpartner.com/news/234/detail-61138.html (accessed on 1 May 2022).
  6. Johansen, Ø.D. Explosion at Hydrogen Station in Sandvika. SANDVIKA (VG). 2019. Available online: https://www.vg.no/nyheter/innenriks/i/zG9Bxw/eksplosjon-paa-hydrogenstasjon-i-sandvika-svaert-overrasket (accessed on 1 May 2022).
  7. Yonhap. Hydrogen Tank Explosion Kills 2 in Gangneung. The Korea Herald. 2019. Available online: http://www.koreaherald.com/view.php?ud=20190523000739 (accessed on 1 May 2022).
  8. Sakamoto, J.; Misono, H.; Nakayama, J.; Kasai, N.; Shibutani, T.; Miyake, A. Evaluation of safety measures of a hydrogen fueling station using physical modeling. Sustainability 2018, 10, 3846. [Google Scholar] [CrossRef]
  9. Gye, H.R.; Seo, S.K.; Bach, Q.V.; Ha, D.; Lee, C.J. Quantitative risk assessment of an urban hydrogen refueling station. Int. J. Hydrogen Energy 2019, 44, 1288–1298. [Google Scholar] [CrossRef]
  10. Tsunemi, K.; Kihara, T.; Kato, E.; Kawamoto, A.; Saburi, T. Quantitative risk assessment of the interior of a hydrogen refueling station considering safety barrier systems. Int. J. Hydrogen Energy 2019, 44, 23522–23531. [Google Scholar] [CrossRef]
  11. Kikukawa, S.; Yamaga, F.; Mitsuhashi, H. Risk assessment of Hydrogen fueling stations for 70 MPa FCVs. Int. J. Hydrogen Energy 2008, 33, 7129–7136. [Google Scholar] [CrossRef]
  12. Xiongjun, Y.; Xiukun, G.; Kaiquan, W. Quantitative risk assessment on a gaseous hydrogen refueling station. Ind. Saf. Environ. Prot. 2012, 38, 6. [Google Scholar]
  13. Zhiyong, L.; Xiangmin, P.; Jianxin, M. Quantitative Assessment on Hydrogen Releases of Hydrogen Refueling Station by Consequence Modeling. J. Tongji Univ. (Nat. Sci.) 2012, 40, 2. [Google Scholar] [CrossRef]
  14. Kwon, D.; Choi, S.K.; Yu, C. Improved safety by crossanalyzing quantitative risk assessment of hydrogen refueling stations. Int. J. Hydrogen Energy 2022, 47, 10788–10798. [Google Scholar] [CrossRef]
  15. Kim, H.; Kang, S. Analysis of damage range and impact of on-site hydrogen fueling station using quantitative risk assessment program (Hy-KoRAM). Trans. Korean Hydrog. New Energy Soc. 2020, 31, 459–466. [Google Scholar] [CrossRef]
  16. Kim, E.; Park, J.; Cho, J.H.; Moon, I. Simulation of hydrogen leak and explosion for the safety design of hydrogen fueling station in Korea. Int. J. Hydrogen Energy 2013, 38, 1737–1743. [Google Scholar] [CrossRef]
  17. Jingxuan, Z.; Xiaoxi, Z.; Hucheng, G.; Xiumeng, D.; Xiuye, T.; Rongyan, W.; Wenhua, S. Accident consequence of physical explosion and steam cloud explosion of hydrogen storage facilities in hydrogenation station. Acta Sci. Nat. Univ. Nankaiensis 2021, 54, 8. [Google Scholar]
  18. Park, B.; Kim, Y.; Paik, S.; Kang, C. Numerical and experimental analysis of jet release and jet flame length for qualitative risk analysis at hydrogen refueling station. Process Saf. Environ. Prot. 2021, 155, 145–154. [Google Scholar] [CrossRef]
  19. GB 50516-2010; National Standard “Hydrogen Fueling Station Technical Specification” Modified Revision (2021 Edition). National Standard of the People’s Republic of China: Beijing, China, 2010. [CrossRef]
  20. GB/T 31138-2014; National Standardization Technical Committee for Hydrogen Energy (SAT/TC 309). Compressed hydrogen dispenser for vehicles. National Standard of the People’s Republic of China: Beijing, China, 2014. Available online: https://kns.cnki.net/kcms/detail/detail.aspx?FileName=SCSF00042990&DbName=SCSF (accessed on 5 May 2022).
  21. GB/T 17395-2008; Dimensions, Shapes, Masses and Tolerances of Seamless Steel Tubes. China Iron and Steel Association (CISA): Beijing, China, 2008. Available online: https://kns.cnki.net/kcms/detail/detail.aspx?FileName=SCSF00012916&DbName=SCSF (accessed on 5 May 2022).
  22. GB/T 14976–2012; National Standardization Technical Committee for Metal (SAC/TC 183). Seamless Stainless Steel Pipes for Fluid Transport. National Standard of the People’s Republic of China: Beijing, China, 2012. Available online: https://kns.cnki.net/kcms/detail/detail.aspx?FileName=SCSF00038516&DbName=SCSF (accessed on 5 May 2022).
  23. Yuan, X.; Li, Y.; He, J. Study on Optimal Ratio of Equal Mass Filling of Hydrogen Storage Bottle Group in Hydrogenation Station. Dongfang Electr. Rev. 2022, 36, 1. [Google Scholar] [CrossRef]
  24. Hecht, E.S.; Ehrhart, B.D. Hydrogen Plus Other Alternative Fuels Risk Assessment Models (HyRAM+) Version 4.0 Technical Reference Manual; Technical Report SAND 2021-14813; Sandia National Laboratories: Albuquerque, NM, USA, 2021. [Google Scholar]
  25. Technica, Ltd. Techniques for Assessing Industrial Hazards: A Manual; World Bank Technical Paper Number 55; World Bank: Washington, DC, USA, 1988. [Google Scholar]
  26. Jeffries, R.M.; Gould, L.; Anastasiou, D.; Franks, A.P. Derivation of Fatality Probability Functions for Occupants of Buildings Subject to Blast Loads. In Probabilistic Safety Assessment and Management’96; Cacciabue, P.C., Papazoglou, I.A., Eds.; Springer: London, UK, 1996; pp. 669–675. [Google Scholar] [CrossRef]
  27. Center for Chemical Process Safety. Guidelines for Vapor Cloud Explosion, Pressure Vessel Burst, BLEVE, and Flash Fire Hazards; John Wiley & Sons Ltd.: Hoboken, NJ, USA, 2010. [Google Scholar]
  28. LaChance, J.; Tchouvelev, A.; Engebo, A. Development of uniform harm criteria for use in quantitative risk analysis of the hydrogen infrastructure. Int. J. Hydrogen Energy 2011, 36, 2381–2388. [Google Scholar] [CrossRef]
  29. Eisenberg, N.A.; Lynch, C.J.; Breeding, R.J. Vulnerability Model. A Simulation System for Assessing Damage Resulting from Marine Spills; Technical Report SA/A-015245; U.S. Coast Guard: Washington, DC, USA, 1975. [Google Scholar]
  30. Tno, Instituut voor Milieu en Energietechnologie Tno Prins Maurit. Methods for the Determination of Possible Damage to People and Objects Resulting from Releases of Hazardous Materials (Green Book); Committee for the Prevention of Disasters: Delft, The Netherlands, 1992; ISBN 90-5307-052-4. [Google Scholar]
  31. State Administration of Work Safety. Personal and Socially Acceptable Risk Standards of Hazardous Chemical Production, Storage Installations (Trial Version). Labour Prot. 2014, 6, 12–16. Available online: https://kns.cnki.net/kcms/detail/detail.aspx?FileName=LDBH201406026&DbName=CJFQ2014 (accessed on 5 May 2022).
  32. Houf, W.G.; Winters, W.S. Simulation of High-pressure Liquid Hydrogen Releases. Int. J. Hydrogen Energy 2013, 38, 8092–8099. [Google Scholar] [CrossRef]
  33. Houf, W.; Schefer, R. Predicting radiative heat fluxes and flammability envelopes from unintended releases of hydrogen. Int. J. Hydrogen Energy 2007, 32, 136–151. [Google Scholar] [CrossRef]
  34. Panda, P.P.; Hecht, E.S. Ignition and flame characteristics of cryogenic hydrogen releases. Int. J. Hydrogen Energy 2017, 42, 775–785. [Google Scholar] [CrossRef]
  35. Hurley, M.J.; Gottuk, D.; Hall, J.R.; Harada, K.; Kuligowski, E.; Puchovsky, M.; Torero, J.L.; Watts, J.M., Jr.; Wieczorek, C.J. SFPE Handbook of Fire Protection Engineering, 5th ed.; Springer: New York, NY, USA, 2016. [Google Scholar] [CrossRef]
  36. Molina, A.; Schefer, R.W.; Houf, W.G. Radiative fraction and optical thickness in large-scale hydrogen-jet fires. Proc. Combust. Inst. 2007, 31, 2565–2572. [Google Scholar] [CrossRef]
  37. Hankinson, G.; Lowesmith, B.J. A consideration of methods of determining the radiative characteristics of jet fires. Combust. Flame 2012, 159, 1165–1177. [Google Scholar] [CrossRef] [Green Version]
  38. Center of Chemical Process Safety. Guidelines for Evaluating the Characteristic of Vapor Cloud Explosions, Flash Fires, and BLEVEs; American Institute of Chemical Engineers, Ed.; John Wiley & Sons: Hoboken, NJ, USA, 1998. [Google Scholar]
  39. Versloot, N.H.A.; Hoagland, W.; Tchouvelev, A.V.; Weiner, S.C. IEA-HIA Task 19: An International Collaboration in Hydrogen Safety; IEA: Paris, France, 2007. [Google Scholar]
  40. SH/T 3521-2013; Petrochemical Industry Standard. Technical Specification for Construction of Instrumentation Engineering in Petrochemical Industry. National Standard of the People’s Republic of China: Beijing, China, 2013. Available online: https://kns.cnki.net/kcms/detail/detail.aspx?FileName=SCSDSH/T3521-2013&DbName=SCSD (accessed on 5 May 2022).
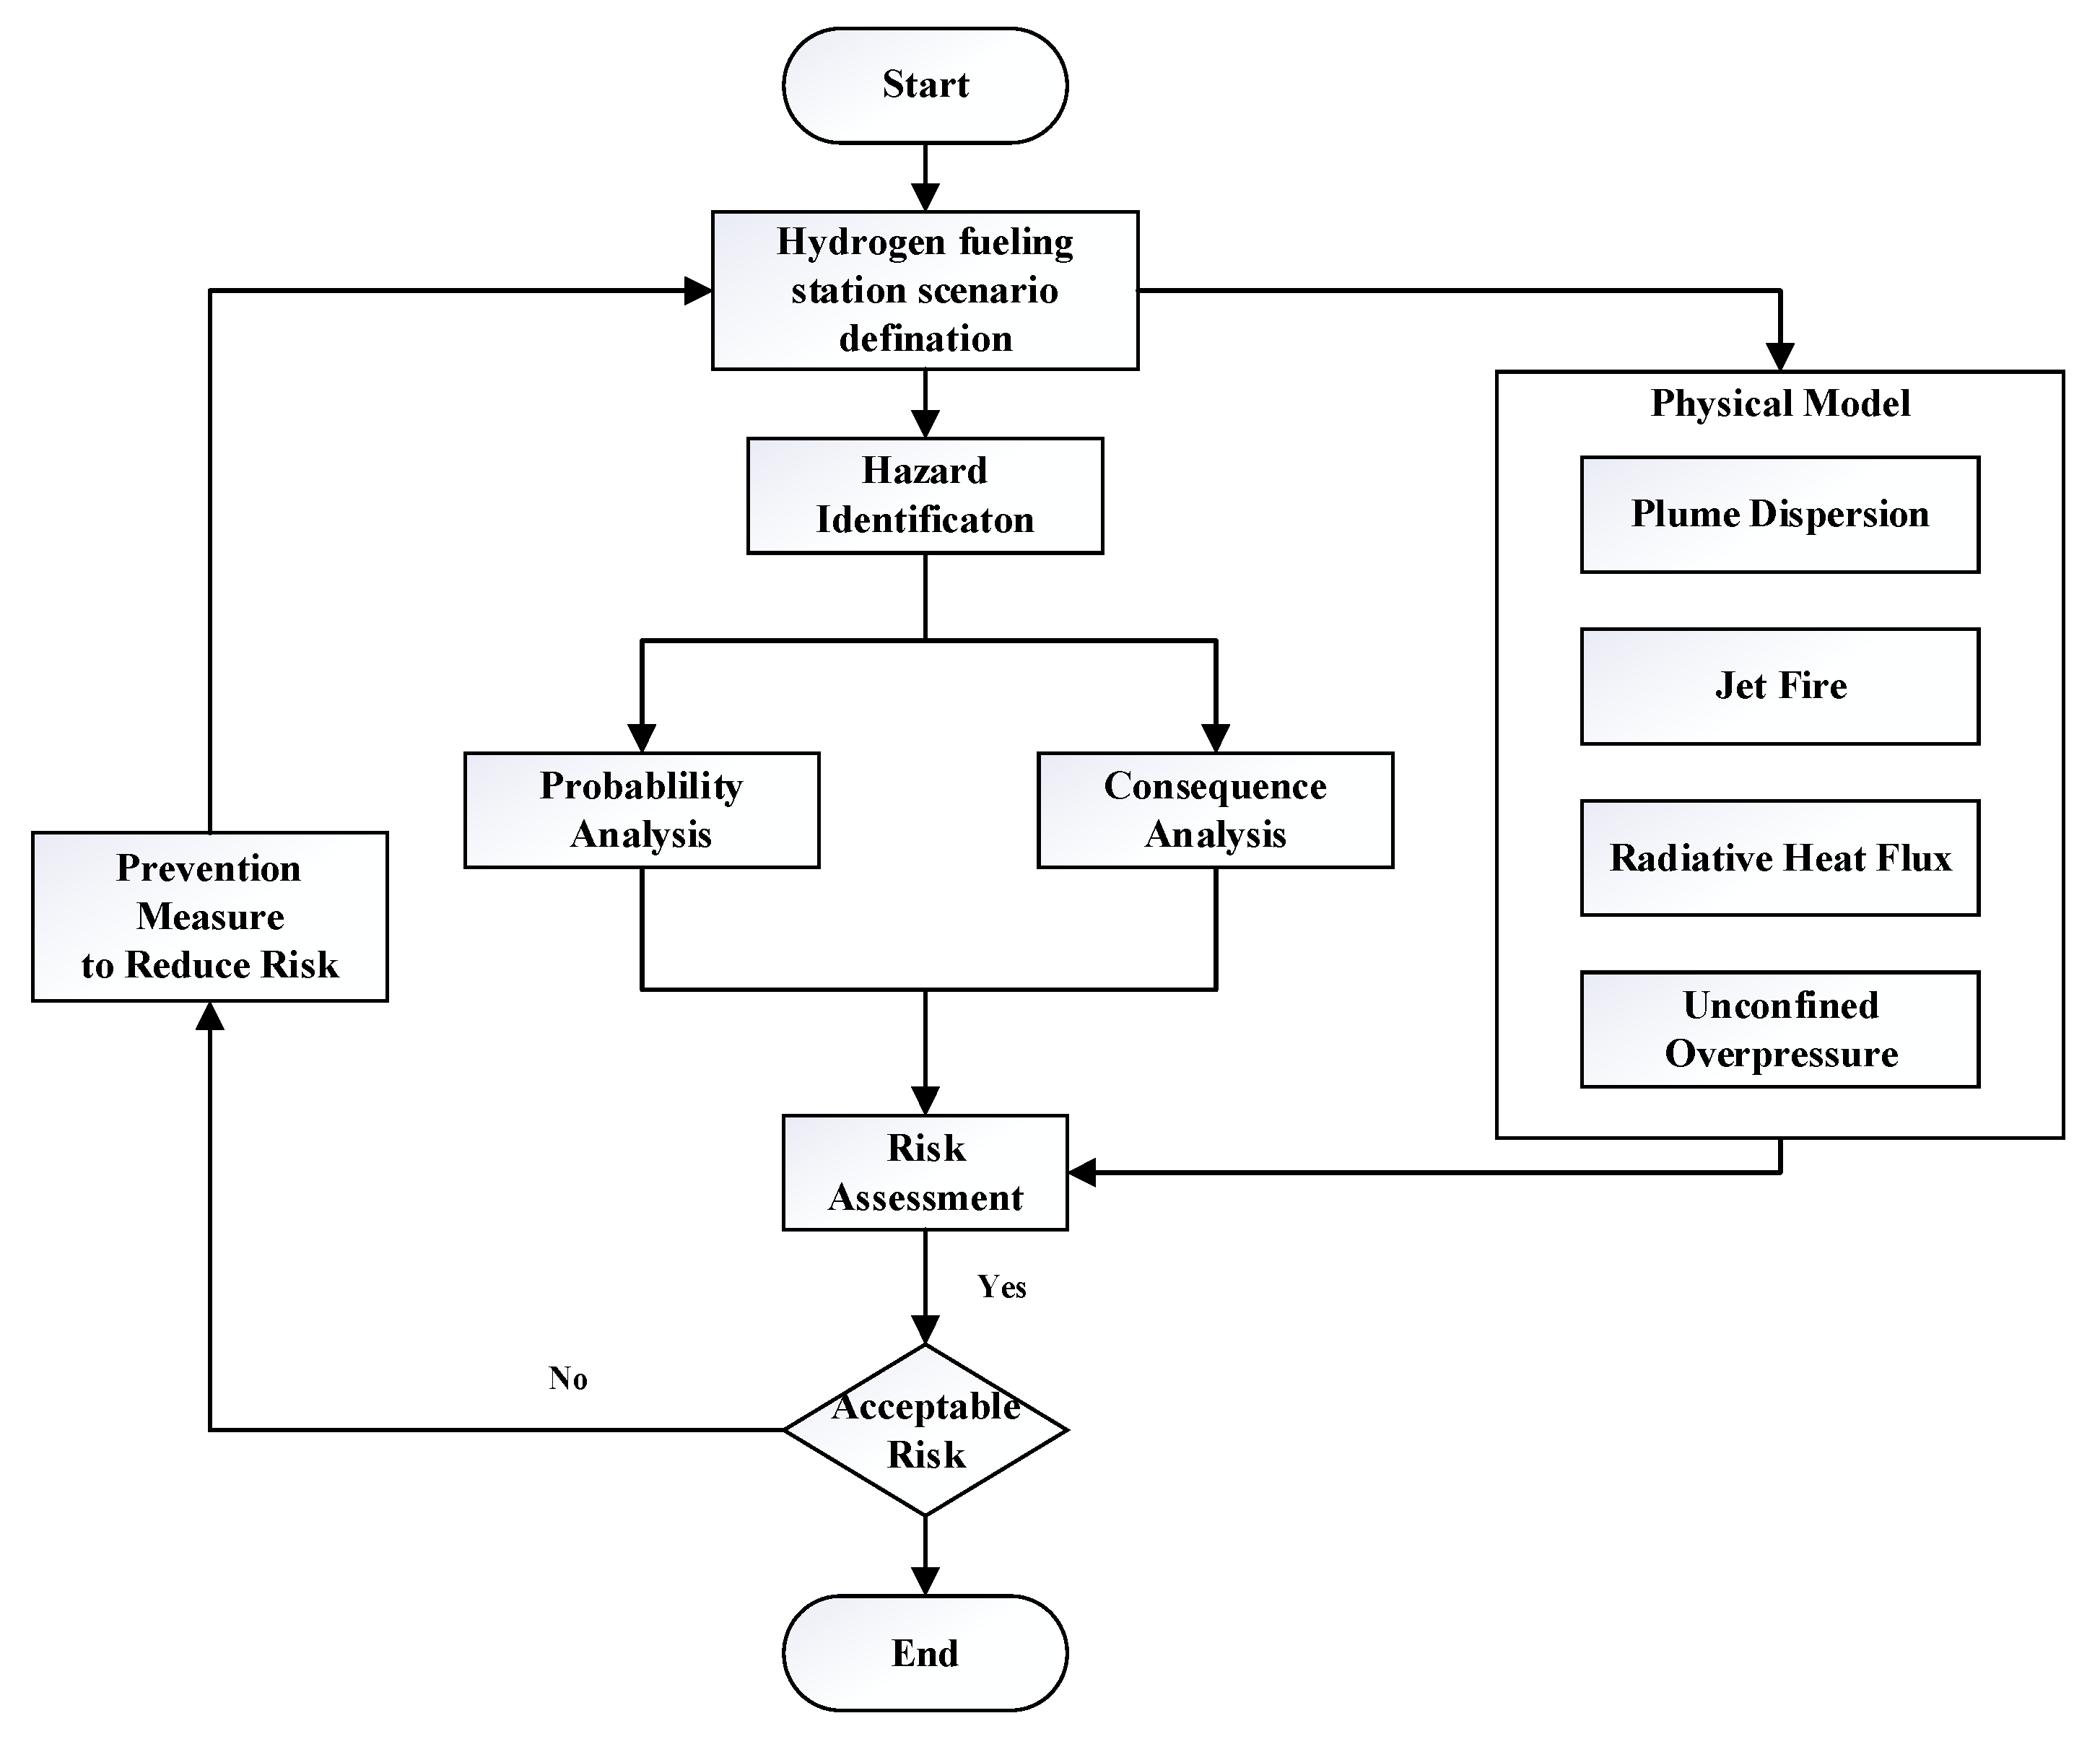
Figure 1. QRA flow chart for the hydrogen fueling station.
Sustainability 14 12420 g001
Figure 2. Hydrogen fueling station process flow and layout.
Sustainability 14 12420 g002
Figure 3. Scenario outcome: (a) Frequencies of scenarios outcome, (b) accident distribution of 0.01%, 0.1%, 1%, or 10% release, (c) accident distribution of 100% release.
Sustainability 14 12420 g003
Figure 4. Cut sets of leak scenarios.
Sustainability 14 12420 g004
Figure 5. Simulated hydrogen plume dispersion in five leak sizes at 45 MPa.
Sustainability 14 12420 g005
Figure 6. Simulated jet flame temperature/trajectory of five leak sizes at 45 MPa.
Sustainability 14 12420 g006
Figure 7. Simulated radiative heat flux distribution for a 6.8 mm leak diameter at 45 MPa.
Sustainability 14 12420 g007
Figure 8. Simulated radiative heat flux distribution for 6.8 mm leak diameter at 45 MPa.
Sustainability 14 12420 g008
Figure 9. Effect area of accidents on the hydrogen fueling station.
Sustainability 14 12420 g009
Table 1. Equipment conditions.
EquipmentQuantityUnitNote
Dispensers2 35 MPa
Compressors2 45 MPa
Vessels18cylinder9 cylinders/group, 0.895 m3/cylinder
Valves55 Including AOC NC, AOC ESD, PV
Instruments41 Including TE, PT
Joints50
Hoses6
Pipes160mEstimated according to the Layout diagram
Filters2
Flanges110
Heat Exchangers1
Table 2. Radiant heat flux harm criteria for people.
Thermal Radiation Intensity q (kW/m2)Degree of Damage
35.0–37.51% lethality in 10 s
25.0 Significant injury in 10 s; 100% lethality in 1 min
12.5–15.0First-degree burn after 10 s; 1% lethality in 1 min
9.50 Second-degree burn after 20 s
4.0–5.0Pain for 20 s exposure; first-degree burn
1.60 No harm from long exposures
Source: Reprinted/adapted with permission from Ref. [Techniques for Assessing Industrial Hazards: A Manual]. 1988, Technica, Ltd. [25].
Table 3. Damage to humans, structures, and equipment from overpressure events.
Overpressure (kPa)Description of Damage
Direct effects on people [26]
13.8Threshold for eardrum rupture
34.5–48.350% probability of eardrum rupture
68.9–103.490% probability of eardrum rupture
82.7–103.4Threshold for lung hemorrhage
137.9–172.450% probability of fatality from lung hemorrhage
206.8–241.390% probability of fatality from lung hemorrhage
48.3Threshold of internal injuries by blast
482.6–1379Immediate blast fatalities
Indirect effects on people [26]
10.3–20.0People knocked down by pressure wave
13.8Possible fatality by being projected against obstacles
55.2–110.3People standing up will be thrown a distance
6.9–13.8Threshold of skin lacerations by missiles
27.6–34.550% probability of fatality from missile wounds
48.3–68.9100% probability of fatality from missile wounds
Effects on structures and equipment [27]
1Threshold for glass breakage
15–20Collapse of unreinforced concrete or cinderblock walls
20–30Collapse of industrial steel frame structure
35–40Displacement of pipe bridge, breakage of piping
70Destruction of buildings; heavy machinery damaged
50–100Displacement of the cylindrical storage tank, failure of pipes
Table 4. Risk indicator results.
ScenarioPLL Value
(Fatalities/
System-Year)
Risk Contribution
0.01%
Release-
Explosion
0.1%
Release-
Explosion
1%
Release-Explosion
10%
Release-Explosion
100%
Release-
Explosion
100%
Release-
Jet Fire
Thermal Radiation Collapse3.175 × 10−50.031%0.005%0.073%4.945%94.932%0.014%
Thermal Radiation Head Impact4.414 × 10−900000100%
Publisher’s Note: MDPI stays neutral with regard to jurisdictional claims in published maps and institutional affiliations.