Abstract
As urban construction has been leaping forward recently, large-scale land subsidence has been caused in Kunming due to the special hydrogeological conditions of the city; the subsidence scope has stretched out, and the subsidence rate has been rising year by year. As a consequence, Kunming’s sustainable development has seriously hindered. The PS-InSAR (Persistent Scatterer Interferometric Synthetic Aperture Radar) and the SBAS-InSAR (Small Baseline Subsets Interferometric Synthetic Aperture Radar) technologies were adopted to process the descending Sentinel-1A data stacks from July 2018 to November 2020 to monitor the land subsidence of Kunming, so as to ensure the sustainable development of the city. Moreover, the causes were analyzed. As revealed by the results, (1) the overall subsidence trend of Kunming was large in the south (Dian lakeside), whereas it was relatively small in the north. The significant subsidence areas showed major distributions in Xishan, Guandu and Jining district. The maximal average subsidence rates of PS-InSAR and SBAS-InSAR were −78 mm/a and −88 mm/a, respectively. (2) The ground Subsidence field of Kunming was analyzed, and the correlation coefficient R2 of the two methods was reported as 0.997. In comparison with the leveling data of the identical period, the root mean square error (RMSE) is 6.5 mm/a and 8.5 mm/a, respectively. (3) Based on the urban subway construction data, geological structure, groundwater extraction data and precipitation, the causes of subsidence were examined. As revealed by the results, under considerable urban subways construction, special geological structures and excessive groundwater extraction, the consolidation and compression of the ground surface could cause the regional large-area subsidence. Accordingly, the monthly average precipitation in Kunming in the identical period was collected for time series analysis, thereby indicating that the land subsidence showed obvious seasonal variations with the precipitation. The results of this study can provide data support and facilitate the decision-making for land subsidence assessment, forecasting and construction planning in Kunming.
1. Introduction
Land subsidence is a local subsidence movement due to consolidation and compression of underground loose strata on the basis of natural factors and human factors, thus resulting in the reduced ground elevation. It is a loss of environment and resources that is difficult to recover [1,2,3]. As urbanization has rapidly expanded, land subsidence has turned out to be a geological disaster hindering urban development and agglomerations [4]. Since the introduction of the 13th Five-Year Plan, Yunnan Province has expedited the construction journey of building a regional international center city based in southwest China that will face the whole nation and impact South and Southeast Asia as part of the active rollout of the national “Belt and Road” development strategy. Land subsidence turned out to be an urgent issue in urban construction. In particular, the main Kunming urban area, i.e., the core area of construction, is considered the most serious area of land subsidence. Accordingly, the effective monitoring of land subsidence in the Kunming city main urban area and its surrounding areas, as well as the spatial-temporal variation causes of land subsidence, can be referenced for the subsequent urban construction and scientific land subsidence prevention and control.
Early studies initiated a few years ago using leveling, total station triangulation, and Global Navigation Satellite System (GNSS) monitoring as well as discrete point-based geodesy methods [5,6,7]. The mentioned conventional geodetic surveys can be used for high-precision subsidence monitoring. However, these surveys have several limitations (e.g., high cost, small monitoring scope, and rigorous requirements for monitoring environment), so large-area monitoring results are difficult to obtain efficiently. In contrast with conventional deformation monitoring methods, Differential Interferometric Synthetic Aperture Radar (DInSAR) [8,9,10] developed rapidly in the past 30 years. It is widely used in urban surface subsidence monitoring [11,12,13], landslide disaster identification [14,15], earthquake deformation monitoring [16,17,18] and other geological disaster fields [19] because of its large space coverage, short revisit period, high spatial resolution, high deformation monitoring accuracy, all-day, all-weather, no personnel to reach the disaster or subsidence area for direct measurement and so on [20,21]. This technology has gradually become one of the indispensable technical means of ground subsidence monitoring. Over the past few years, with several radar satellites launching and data sharing, the monitoring accuracy of InSAR technology has continuously increased. Moreover, data processing methods have been optimized, and coherent target-based temporal InSAR technologies have been proposed successively, PS-InSAR technology [22,23], SBAS-InSAR technology [24], etc. Temporal InSAR technology, by exploiting SAR data stacks for temporal analysis and processing, can effectively overcome the conventional D-InSAR in space-time incoherence errors, atmospheric delay, terrain effect and other aspects, and realize inverse surface deformation in high precision.
Land subsidence has been detected and monitored over the past few years using time-series InSAR [25,26,27,28,29]. Orhan [30] investigated the land subsidence in the Konya city center and its surroundings based on SAR and global navigation satellite system (GNSS) data. In addition, the correlation between the land subsidence observed in the region was examined with land use/land cover changes and groundwater data. Solano-Rojas [31] presented a novel method for extracting signals relating to geotechnical and infrastructure monitoring at individual-building scale in fast-subsiding metropolises through band-pass filtering. Moreover, the usefulness of their method was verified by applying the method to Mexico City. Orhan et al. [32] expanded the InSAR investigation of land subsidence in Karapınar region using a variety of data; GNSS observation data, monthly groundwater level data and InSAR data were adopted to gain more insights into the correlations between groundwater extraction, land subsidence and sinkhole formation in the Karapinar basin. The above research obtained a surface velocity field based on time-series InSAR. The representative studies on land subsidence monitoring in Kunming’s main urban area by adopting time-series InSAR technology are presented below. Zhu et al. [33] utilized a multi-temporal InSAR technique to obtain a decade of times series deformation of Kunming. Shao et al. [34] employed PS-InSAR technique to monitor the land subsidence in Kunming. As revealed by the results, the land subsidence in Kunming was mainly concentrated along the Lake Dian and the southern urban area, and the trend in land subsidence was slowing down. Xiong et al. [35] used SBAS to process 28 sentinel-1A dual polarization images explore the land subsidence in Kunming. As revealed by the results, there was a relatively significant subsidence phenomenon in the Kunming main urban area, and significant subsidence funnel was seriously formed in some areas. The maximal annual average sedimentation rate is −54 mm/a (VV polarization) and −54 mm/a (VH polarization). Jiang et al. [36] employed PS-InSAR and SBAS-InSAR technique to study the surface subsidence of the Kunming main urban area respectively. The results showed that the correlation between the two methods is high, and the maximal annual subsidence rate in 2018–2019 reached −39 mm/a. Time series InSAR technique can conduct high precision land subsidence monitoring in Kunming, whereas the study also showed that the researchers only use temporal InSAR technique to detect subsidence funnel in Kunming urban area. The causes of the spatial-temporal variation in land subsidence in Kunming were comprehensively explored without the inversion of regional subsidence rate, urban subway construction, geological structure, rainfall data and field survey data.
Due to current situation of large-scale urban construction in Kunming city, this study used PS-InSAR and SBAS-InSAR technologies through 69 C-band Sentinel-1A data stacks from July 2018 to November 2020 to study the characteristics of large-scale land surface subsidence in Kunming main urban area, which obtained subsidence scope and accumulated subsidence amount of Kunming main urban areas. It revealed spatial distribution characteristics of ground deformation in Kunming. Then, the accuracy of InSAR results is verified from three aspects of internal precision, external precision and field verification. Lastly, the causes of surface subsidence in Kunming main urban area were explored comprehensively from the perspectives of urban subway construction, fault tectonic activity, groundwater level change and rainfall. A subsidence monitoring and analysis system was proposed. On the one hand, this study overcame the conventional surface subsidence monitoring technology disadvantages and improved the spatial and temporal resolution, which reduced the economic cost significantly. It could realize small deformation accurate monitoring in a wide range of urban areas and provide strong technical support for monitoring surface subsidence in urban areas. On the other hand, this study analyzed the causes of Kunming city ground subsidence from different aspects. A subsidence monitoring and analysis system was established in this study to solve the problems of subsidence reason is not specific and the subsidence trend is not clear in urban areas, which is beneficial to the inversion of the subsidence trend in urban areas.
2. Study Area and Datasets
2.1. Study Area
Kunming (102°33′13″ E~102°59′16″ E; 24°44′12″ N~25°11′25″ N) is situated in the central Yunnan-Guizhou Plateau, bordering Lake Dian in the south, as well as surrounded by mountains on the other three sides. Kunming acts as the frontier and gateway of China to Southeast Asia, South Asia and even the Middle East, Southern Europe and Africa, exhibiting unique geographical advantages. It connects the coastal areas of Guizhou and Guangxi in the east, facing Sichuan and Chongqing in the north, Thailand and Cambodia in the south, Myanmar, India and Pakistan in the west. The altitude of Kunming is approximately 1891 m. The overall terrain is high in the north and low in the south, progressively descending form north to south. Besides, the region has a subtropical-plateau monsoonal climate. As impacted by the warm and humid airflow in the southwest of the Indian Ocean, the sunshine is long, the frost period is short, and the annual average temperature is 15 °C. The annual precipitation is 1450 mm, and the precipitation is concentrated in May to October, taking up nearly 85% of the annual precipitation. From November to the next April is the dry season, taking up only about 15% of the annual precipitation.
The Kunming main urban area is located in what was a fault basin of the Late Cenozoic, where loose sedimentary layers are broadly developed. On the whole, it comprises lacustrine silt and clay with multi-layer silt, peat and lignite layers [37]. Given the geological boreholes, the quaternary sedimentary phase transition is complicated vertically and horizontally. Delta deposits are dominant in the northeast and lacustrine deposits in the southwest. The soil structure stratum comprised alternating soft and hard layers, interbedded aquifer and aquifer, interlaced high compressibility soil and low compressibility soil.
As revealed from the hydrogeological conditions of Kunming main urban area, the Kunming soil stratum is characterized by soft structure, low consolidation degree and high compressibility. Considerable urban construction in this area can easily cause foundation vertical displacement variations, thereby posing the risk of large-scale engineering construction collapse. Thus, this study selected Chenggong, Guandu, Xishan, Panlong, and Wuhua Districts and the northern part of Jinning District as the study area (Figure 1).
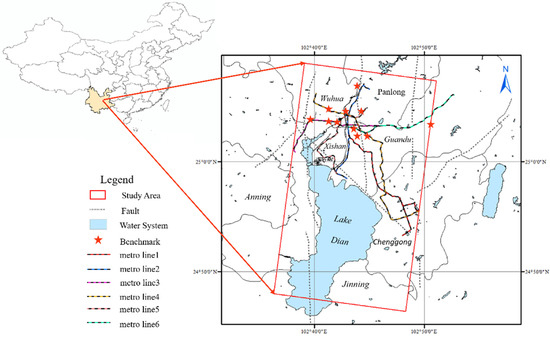
Figure 1.
Schematic diagram of the study area.
2.2. Datasets
In this study, 69 C-band Sentinel-1A images downloaded by ESA acted as research data. The imaging lasted from July 2018 to November 2020, under the polarization mode of VV polarization, the wavelength of 5.63 cm, as well as the revisit period of 12 days. Furthermore, DEM data with 30 m resolution provided by Japan Space Agency were selected for eliminating the effect of topographic relief. Table 1 lists the basic parameters of satellite data.

Table 1.
Basic parameters of satellite data.
3. Methodology
3.1. PS-InSAR Method
The basic principle of PS-InSAR technology [23] is to adopt SAR datasets (generally over 20) covering the identical area to detect stable point targets not affected by temporal and spatial baseline based on a statistical analysis of the amplitude and phase information stability in time series. The mentioned stable point targets are likely to include artificial buildings, exposed rocks, artificial angle reflectors and others, which are termed PS points as almost not affected by speckle noise in time-series SAR images and still maintaining stable scattering after a long time interval. The geometric size of PS points is significantly smaller than the SAR datasets’ spatial resolution unit, whereas their backscattering coefficients dominate the echo signal in the whole resolution unit, which are independent of the spatial baseline and show good coherence [38]. According to time-series datasets, even if no interference fringes can be seen on a single interferogram, the whole interference phase can be obtained from PS points phase information by interpolation or fitting.
The PS-InSAR technology primarily focuses on the spatially dispersed PS points, and the image in the time-series dataset with N single-look complex SAR images is expressed as . The interferogram comprises the i and k SAR images, expressed . * represents complex conjugate. The target is assumed as the reference point, so the interference phase will be determined by noise differences between the target and the reference point , atmospheric disturbance, deformation, and elevation. Phase difference attributed to elevation and linear deformation difference of the two targets is denoted in the following:
and
In Equations (1) and (2), and are the difference between target and in elevation and deformation rate, respectively. and represent the space baseline and time baseline between SAR image and , respectively, perpendicular to the radar sight line. represents the SAR incident angle; denotes the oblique distance between the target and the satellite; represses the radar signal wavelength.
In the classical PS-InSAR technique, the elevation and subsidence rate of the target are estimated by maximizing the temporal coherence of [39]:
In Equations (3) and (4), is the number of interferogram; is the obtained differential interference phase (the flat part and rough terrain phase have been removed); is the elevation-related part phase of Equation (1); is the topographic deformation phase related part of Equation (2).
Surface deformation consists of linear and nonlinear deformation phases:
In Equation (5), is a nonlinear form variable. Equation (4), the maximum factor is known as the temporal coherence, the time coherence of target can approximate expression for phase deviation factor of residual function . Lastly, the variance of elevation and deformation rate estimated with the use of PS-InSAR, i.e., the accuracy index and with phase deviation , the difference between interferogram geometry and time baseline ( and ), as well as the number of interferometers M satisfy the following [40]:
and
As expressed in Equations (6) and (7), the accuracy of the elevation and deformation rates obtained from PS-InSAR is considered a function of temporal coherence and spatio-temporal baseline distribution. Such a model is not correlated with interference combination, so its expression applies to all time-series InSAR image analysis techniques.
3.2. SBAS-InSAR Method
SBAS-InSAR refers to time-series InSAR analysis developed by Berardino, Lanari et al. in accordance with a variety of strategies of PS-InSAR [24,41]. First, the time-series radar interference datasets were integrated to generate several short-space baseline interferograms that are capable of overcoming spatial de-correlation [24]. Subsequently, the chosen GCP points are applied in terms of denoising and orbit refining. Lastly, the deformation rate was obtained with the use of the singular value decomposition (SVD) method, and the SAR datasets separated using large spatial baselines were connected to up-regulate the observed data’s time sampling rate. SAR data processing is elucidated below:
- (1)
- It obtained SAR images in the identical area arranged in chronological order , selecting one image as the master image, and registered other SAR images on the master image. SAR image generates differential interferogram, and satisfies .
- (2)
- In terms of the differential interferogram obtained according to SAR image obtained from slave image and mater image (), the pixel interference phase with azimuth direction coordinate and range direction coordinate is written as follows:
In Equation (8), ; λ represents the signal central wavelength; and denote the cumulative shape variables of the phase at and for the radar sight direction line . denotes the participating phase within the differential interferogram. The DEM added to differential interference is assumed to have high accuracy and can largely remove the topographic phase, so the differential interferogram has small residual topographic information, which is negligible. denotes the atmospheric delay phase; represents coherent noise. Without considering noise phase, residual terrain phase, or atmospheric delay phase, Equation (8) is simply expressed in the following:
- (3)
- For generating the subsidence sequence that achieves physical significance, the product of the average phase velocity and time of two acquisition times expresses the phase in Equation (9):
The interferogram’s phase value is:
The velocity integral in the respective period on the time interval of the main and auxiliary images is written as the matrix form:
Equation (12) represents an matrix. Matrix may have rank deficiency since the small baseline sets employ multi-master image strategy. The generalized inverse matrix of matrix is established with SVD method, as an attempt to yield the minimal velocity vector norm solution. Lastly, the shape variable of the respective period is acquired by velocity integration in the respective period.
3.3. Data Processing
This study was primarily based on SARscape software and 69 Sentinel-1A images. The specific experimental processing included SBAS interference processing and PS interference processing.
3.3.1. SBAS Interference Processing
- (1)
- Data preprocessing: reading 69 original images and clipping the study area using vector files.
- (2)
- Connection diagram and connection pair image generation: the super master image was the image dated 5 November 2018. The max normal baseline was set to 2%, and the max temporal baseline threshold was set to 60 days. Lastly, 316 image pairs were generated, as depicted in Figure 2a.
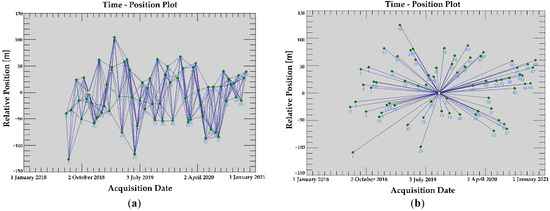 Figure 2. Spatiotemporal baseline distribution. (a,b) are SBAS-InSAR and PS-InSAR spatiotemporal baseline distribution, respectively.
 - (3)
- Interferometric workflow: 316 image pairs were conducted interferometric procession. Coregistration, interferogram generation, interferogram flattening, filtering and phase unwrapping were carried out. Coregistration all image pairs was conducted with the super master image to prepare for orbit refinement, re-flattening and SBAS inversion. The unwrapping method selected in this study was minimum cost flow. The advantage of this method was that better results could be obtained when the unwrapping was difficult due to large areas of low coherence or other factors limiting growth. Goldstein was selected as the filtering method.
- (4)
- Orbit refinement and re-flattening: This was adopted for estimating and removing the residual phase. Ground control points (GCPs) were employed for correcting SAR data because of inaccurate DEM geographic positioning or inaccurate satellite orbit. Criteria for GCP selection are elucidated below: (1) Selecting the area without residual terrain fringe; (2) Selecting a region without deformation, unless the deformation rate of that point is known; (3) Selecting the point without phase jump; (4) The number of selected points should be more than 20. A total of 50 GCPs were selected in this study.
- (5)
- First inversion of SBAS: this step serves as the core of inversion, estimating deformation rate and residual terrain phase, and optimizing the input interferograms through secondary unwrapping.
- (6)
- The second inversion of SBAS: The residual phase of the SBAS second unwrapping interferograms was separated into low-pass phase and high-pass phase. The low-pass filter and high-pass filter are employed to filter the residual phase to obtain nonlinear deformation. The linear deformation phase and non- linear deformation phase are added together to obtain accurate surface deformation information.
- (7)
- Geocoding: the results of surface deformation were projected onto the geographic coordinate system. In this study, the results were projected onto the vertical direction. A total of 2,535,786 stable points, namely SDFP points, were obtained in this experiment.
3.3.2. PS Interference Processing
- (1)
- Data preprocessing: Data preprocessing was the same as SBAS processing.
- (2)
- Connection diagram generation: Likewise, the super master image was the image on 5 November 2018, and the connection diagram was depicted in Figure 2b. The max temporal baseline was 60 days and the min temporal baseline was 12 days.
- (3)
- Interferometric workflow: 69 SAR images were processing by coregistration, flattening and differential interferometric. 1,295,860 effective stable PS points were seleteded out by amplitude deviation index. Most of these PS points were distributed in buildings, Bridges, etc.; Lake and green areas were almost no PS points.
- (4)
- PS first inversion: the residual topography and the displacement rate were obtained to flatten the synthetic interferogram. The main method was based on the identification of a certain number of Persistent scatterers, which should be stable (change less than 1 mm) and can be detected by SAR antenna.
- (5)
- PS second inversion: in this step, the atmospheric phase was removed for obtaining the final rate of deformation.
- (6)
- Geocoding.
4. Results and Analyses
4.1. Time-Series Land Subsidence
Since the deformation rate in the Line of Sight (LOS) direction is the surface deformation rate projection in the radar sight line, any surface deformation can be expressed by the deformation in the North-South (SN), East-West (EW) and vertical (U) components [42]. As revealed by the geometric relationship between radar side-view imaging, LOS deformation and surface deformation observed by InSAR, the vertical deformation contribution rate to LOS direction exceeds 90% regardless of orbit ascending or descending [43]. Since InSAR observation results are most sensitive to vertical surface deformation, the LOS deformation rate field determined in this study was employed as the analysis data of Kunming deformation trend. As decipted in Figure 3, the Sentinel-1A radar data covering the study area were processed using SBAS-InSAR and PS-InSAR. Subsequently, the results obtained by the two InSAR technologies are underwent Kriging interpolation by ArcGIS. The continuous spatial deformation rate diagram of LOS to the same point in Kunming main urban area from July 2018 to November 2020 was obtained. In Figure 3, the deformation rate was positive, thereby demonstrating that the surface displacement moved in the direction of the satellite, and the surface was uplifted. Under the displacement, the ground moved away from the direction of the satellite and showed subsidence.
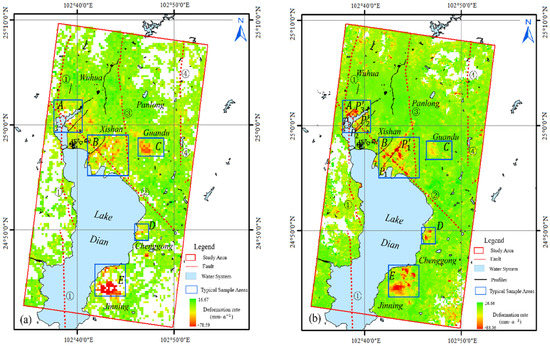
Figure 3.
Deformation rate of the study area. (a,b) are results of PS-InSAR and SBAS-InSA processing respectively. ①~④ are Puduhe fault, Chenggong-Fumin fault, Heilongtan-Guandu, Baiyi-Hechong fault, respectively.
As depicted in Figure 3, the land subsidence covered a large area with uneven spatial distribution in the study area. In addition, the land subsidence centers in the study area were mainly concentrated in the northeast, east, southeast of Lake Dian and central Kunming. The areas with relatively serious subsidence refer to A, B, C, D and E. Area A was located near Daguan Park in Xishan District, including Zongshuying Street and Ma Street. The maximal annual subsidence rate monitored by PS and SBAS was −78 mm/a and −88 mm/a, respectively. Area B was located in Guandu District along the eastern coast of Lake Dian, which has developed into a continuous subsidence area stretched out to the urban center, with Liujia Street, Guandu Street and Yiliu Street involved. In the above area, the maximal annual subsidence rate was −59 mm/a and −67 mm/a. Area C was located in Xiaobanqiao Street near Guangwei Overpass in Guandu District, and the maximal annual subsidence rate was −31 mm/a and −27 mm/a, respectively. Area D was located in Luojia Village, Tujia Village and Zhonghe Village, Dayu Street, Chenggong District, and the maximal annual subsidence rate was −34 mm/a and −51 mm/a. The difference between the maximal annual subsidence rate obtained by the two monitoring methods in this area was −18 mm/a, probably because the subsidence area was largely distributed in farmland. The PS points were relatively sparse. Area E was located in Xinjie Street near No.8 Middle School of Jinning County, with the maximal annual subsidence rate of −54 mm/a and −56 mm/a, respectively. In the study area, only Panlong District was relatively stable with relatively small subsidence, and the average annual Subsidence rate was lower than −10 mm/a.
4.2. InSAR Accuracy Assessment
This study verified the reliability of InSAR subsidence monitoring results from three aspects. First, internal coincidence accuracy [44] was used to verify the consistency of experimental PS and SBAS results. Second, the reliability of InSAR was verified and compared in accordance with the leveling results. Third, field sampling survey verified the accuracy of monitoring results.
- (1)
- Internal coincidence accuracy verification analysis
In Figure 3, the maximal annual subsidence rate maps obtained by PS and SBAS were, respectively, −78 mm/a and −88 mm/a, with a difference of 10 mm/a, thereby demonstrating that serious surface subsidence exists in the study area. The location and range of the subsidence area identified by the two methods are consistent. To further verify the reliability of the two methods based on the experimentally achieved results, the cross-comparison method was adopted to verify the results. In that process, 532 identical points were randomly extracted from the subsidence rate maps generated by employing the PS-InSAR and the SBAS-InSAR respectively. The correlation coefficient diagram was drawn by applying the average annual subsidence rate of PS as the horizontal axis and with the average annual subsidence rate of SBAS as the vertical axis (Figure 4). The correlation coefficient R was 0.998, R2 was 0.997, thereby demonstrating that the experimentally achieved results in this study have high correlation and consistency.
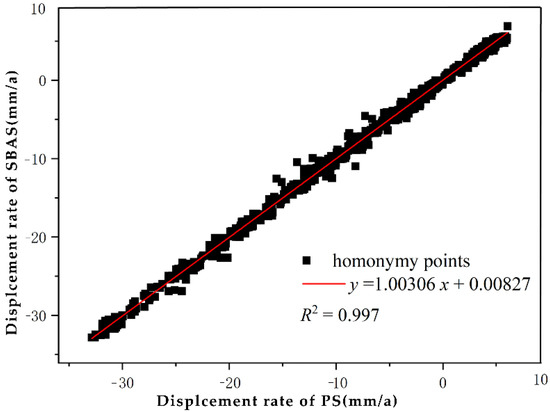
Figure 4.
Correlation coefficient diagram of annual average Subsidence rate of PS and SBAS.
Notably, the number of PS points in the research area obtained by PS-InSAR technique were 1,295,860, and the number of SDFP points obtained by SBAS-InSAR were 2,535,786. In this study, 532 corresponding points were selected randomly, which had the characteristics of small number and centralized distribution. Therefore, the calculated correlation coefficient was close to 1. It was not representative, which only indicates that the results obtained by PS-InSAR and SBAS-InSAR were relatively consistent. In the experiment, it was found that the correlation coefficient decreases nonlinearly with the increase of the corresponding points number involved in the calculation. We will be discussed in the future experiments.
- (2)
- Comparison and verification with leveling results
InSAR measurements show line of sight deformation, whereas conventional leveling measurements show vertical deformation. In order to verify the monitoring results of PS-InSAR and SBAS-InSAR, the monitoring data of 12 level points at the same time were obtained, as depicted in Figure 1. With the leveling point as the center of the circle, the InSAR subsidence point in the 30 m radius buffer was extracted. After the extraction subsidence was divided by ( as the incident angle), the average subsidence was determined and compared with the leveling measurement result, and the root mean square error (RMSE) was introduced to assess the verification accuracy. The is determined by Equation (13) [20]:
where, denotes the deformation rate difference between the deformation rate at the -th leveling point and InSAR monitoring results; expresses the number of test sites.
Table 2 lists the comparison results of the leveling survey and InSAR average deformation rate. According to Table 2, the deformation rate root mean square error of the leveling monitoring point and the PS and SBAS subsidence point are 8.5 mm/a and 6.7 mm/a respectively, and the maximal deviation is less than 15 mm/a. The deviation ratio in (10, 15) mm/a was nearly 10%. The above results suggest that PS and SBAS monitoring results exhibit high reliability.
Table 2.
The average subsidence rate comparison between leveling data and InSAR.
- (3)
- Field investigation
To more specifically verify the location and scope of the identified subsidence area, subsidence area B, close to the downtown of Kunming, was selected to conduct field investigation for verifying the accuracy of the experimentally achieved results. Figure 5 is a photo taken on the spot. In the area connected by subsidence centers in Figure 3, house wall cracking (Figure 5a), house tilt (Figure 5b) and road foundation deformation cracking (Figure 5c) were caused in the field, and the trend of deterioration continued, thereby demonstrating that InSAR results exhibit high monitoring accuracy.
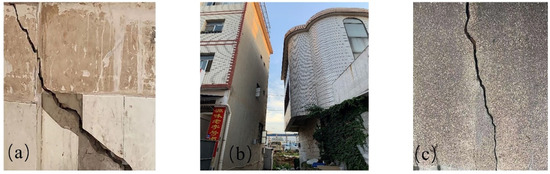
Figure 5.
Field photos. (a–c) A house wall crack, house tilt and road foundation deformation cracking caused by the subsidence, respectively.
5. Discussion
5.1. Impact Analysis of Ground Subsidence and Urban Subway Construction
Subway is known as another landmark of urban modernization. Kunming metro was built in 2008. Table 3 lists the construction and operation time of each subway line. In 2017, all six lines running through the Kunming main urban area and gradually expanded to Anning, Songming, Yiliang, Jining, Yangzong and other counties and urban areas. The rapid subway construction and the line network coverage may aggravate the ground subsidence according to subway line. Based on SBAS-InSAR experimentally achieved results, the monitoring results within 500 m along the subway line were extracted (Figure 6), and the evolution characteristics of land subsidence along the subway network under construction in Kunming were analyzed. As depicted in Figure 6, there were different degrees subsidence along Line 1 and branch line. The maximal annual subsidence rate was −14 mm/a, which was located at Xiaodong Village Station. The first phase of Metro Line 2 was opened in 2014 (from the Northern coach Station to South Ring Road Station), with a maximal annual subsidence rate of −14 mm/a, which was located between Sijiaying station and the northern coach station. The second phase of Line 2 (South Ring Road station to Baofeng Village Station) was fully constructed in 2015 and is expected to open in 2022. The phase II project of Line 2 under construction was 12.7 km long and built along Lake Dian, passing through continuous subsidence areas, among which the most serious subsidence is the section from Baofeng Village station to Guangfu Road, with the maximal annual subsidence rate of −73 mm/a. Line 3 represents a completed running through Kunming city’s east-west direction, with 23.4 km length in total and relatively stable overall. There is a slight subsidence between Liangjiahe Station and municipal gymnasium Station, with the maximal annual subsidence of −12 mm/a. The maximal subsidence area of Line 3 is located near the eastern coach station, and the maximal annual subsidence is −16 mm/a. Metro Line 4 connects northwest and southeast of Kunming. There are four significant subsidence areas along the line, from northwest to southeast, located at the starting stations Jinchuan Road Station, Guangwei Station, Gucheng Station and Kunming South Railway Station. The corresponding maximal annual subsidence rate is −24 mm/a, −26 mm/a, −11 mm/a and −14 mm/a. Line 5 is under construction. As impacted by construction and train cyclic load operation, uneven ground surface subsidence occurs as well. The subsidence area of Line 5 is mainly located between Dianchi International Convention and Exhibition Center and Fuhai in Liujia Street, with the maximal annual subsidence rate of −67 mm/a. Metro Line 6 in the study area has been stable since it was put into operation. Only one point of subsidence was detected in the eastern coach station, and the maximal annual settlement was −16 mm/a.
Table 3.
Timetable for construction and operation of Kunming subway lines.
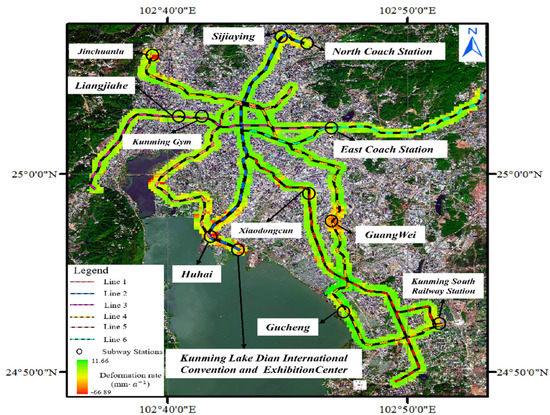
Figure 6.
Deformation rate within 500 m buffer of Kunming metro line.
5.2. Analysis of the Land Subsidence Impact and Fault Tectonic Activity
Kunming was located in late Cenozoic downfaulted basin with a complicated structure. It covers four major fault zone surrounding distribution, i.e., the Kunming Baiyi-Hengchong faults in eastern and central Heilongtan-Guandu faults, as well as west Pudu river and north west of Chenggong-Fuming fault (Figure 3). The fault is the surrounding potential earthquake source area in Kunming, as well as one of the factors of land subsidence that cannot be ignored. According to existing research, compared with linear urban land subsidence, subway and expressway, the crustal deformation in fault zone has its particularity, thereby suggesting that the small deformation magnitude and the remarkably slow change. The active intensity of most faults is several million meter per year, and the maximal exceeds a dozen million meter [43]. The Chenggong-Fumin fault with serious land subsidence was selected as the research object, and the cross-sectional lines perpendicular to the Chenggong-Fumin fault zone were made (Figure 3b), and the cross-sectional map perpendicular to the fault zone was created (Figure 7). The intersection of the blue vertical line and the section line in the figure represent the position of the fault line and the subsidence rate on the cross-sectional map. As depicted in Figure 7, the current vertical crustal deformation rate was relatively high in the near Chenggong-Fumin fault area and the maximal annual subsidence rate was −70 mm/a, thereby demonstrating significant tectonic movement in the study area is, especially controlled by the Chenggong-Fumin fault. According to existing studies on land subsidence, seismicity and tectonic movement in Kunming city [26,45], Since the late Cenozoic, the stress field in the Kunming urban area was dominated by the northward compressive stress, and the tensile stress was generated in the basin area bounded by the Puduhe fault. On that basis, the five blocks of Xishan, Puji, Sheshan, Longtan and Baiyi, are controlled and pulled northward successively by the Heilongtan–Guandu fault and Baiyi Hengchong fault. As impacted by the different degree in the consolidation fault zone, the distance of fault block pulling out was not identical. The longest block was Heilongtan, and the nearest block was Sheshan, thereby forming a tectonic type area of uplift and subsidence in the basin. The fault subsidence extent was inconsistent, and the extent of fault subsidence was large in the south and relatively small in the north. From the distribution of surface subsidence, the subsidence areas were all located in the southern urban area accordance with the Lake Dian, i.e., areas A, B, C, D and E marked in the blue rectangle in Figure 3.
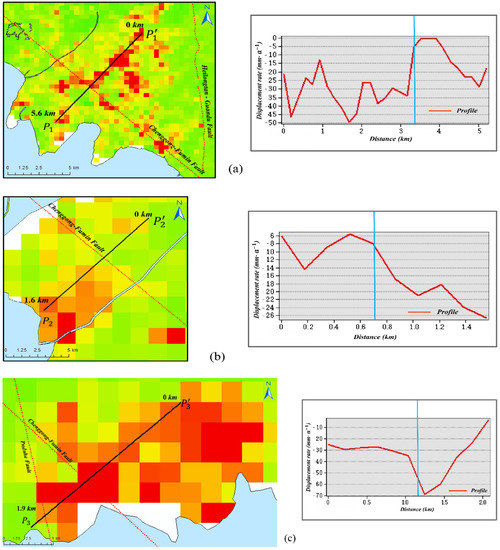
Figure 7.
Velocity and cross-section diagram of fault in the study area. (a–c) are plots of displacements along profiles , and , respectively.
5.3. Impact Analysis of Ground Subsidence and Groundwater Extraction
Given the survey, the groundwater extracted in the area mainly contained pore water, karst water and fissure water. It was primarily employed for industrial, construction, domestic, etc. As April 2021, Kunming has been using overall 1711 underground wells (i.e., 1498 cold water wells and 213 hot water wells). Cold water wells were largely distributed in five districts (i.e., Chenggong, Guandu, Xishan, Panlong and Wuhua districts), and hot water wells had the major distributions in Guandu District and Xishan District. Since 2008, Kunming city has issued a series of regulations and documents to strengthen the protection, utilization and management of groundwater. On the whole, 441 cold water wells have been closed (e.g., 369 in the main urban area of Dianchi Basin). Although the groundwater utilization has slowed down to a certain extent, groundwater is still over-utilized. The statistical table of groundwater level changes in the study area (Table 4) was obtained the collation of historical information from the environmental monitoring stations in Yunnan Province, and the corresponding groundwater exploitation sites in the blocks are shown in Figure 8a. In the early 1980s, the burial depth of the hot water level was 4~6 m, and the single well gushing water volume was 1000~1700 m3/d. However, the current water level is generally lower than the water level when the well was completed, and the average burial depth of the water level has increased to 11~25 m; the maximum decline value is more than 35 m, the average decline rate is 1.80 m/a, and the maximum is 4.59 m/a [46]. The groundwater exploitation and water level landing funnels in Kunming over the years confirmed that there was a clear correlation between ground subsidence and the continuous decline of groundwater levels [37]. Since the groundwater exploitation data could not be obtained, we used the groundwater data released by NASA to obtain groundwater data for the same period, and analyzed four regional subsidence feature points. The point distribution of the four feature points () is illustrated in Figure 8a. The results of the analysis are shown in Figure 8b, and the cumulative subsidence values of the four points have obvious correlation with the seasonal changes of groundwater level. In addition, Kunming was located in the crustal active zone, covering the intermountain basin, valley basin pores, fractures, karst water area with a wide range of carbonate rock and karst caves distributed and with funnels scattered all over the city. The underground confined water in the bedrock exhibits a certain supporting function. Under the excessive exploitation of groundwater and the soil weight pressure, the bedrock is easy to lose its support, thereby causing several geological disasters (e.g., ground collapse, foundation subsidence and earthquake).
Table 4.
The statistics for the exploitation of groundwater for different blocks.
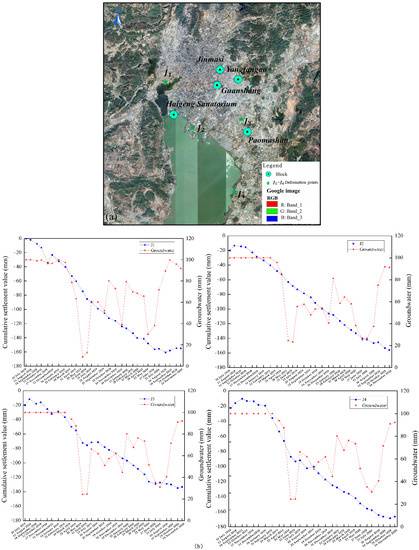
Figure 8.
Analysis diagram of ground subsidence and groundwater extraction. (a) is the location map of Groundwater exploitation site and four feature points (). (b) is the analysis results.
5.4. Impact Analysis of Land Subsidence and Rainfall
Kunming is in a low-latitude plateau with a complex and diverse topography and a large terrain height difference. Obvious vertical and horizontal differences in climate have been identified. The annual precipitation can be divided into dry and wet seasons in terms of time distribution. The rainy season is from May to October, with about 85% of the annual precipitation. The dry season from November to April accounts for only 15% of the annual precipitation. To explore the correlation between land subsidence rule and rainfall in Kunming, this study selected five feature points distributed in vital subsidence areas in the subsidence rate map obtained by SBAS technology for analysis and statistics. The point distribution of the five feature points () is illustrated in Figure 9.
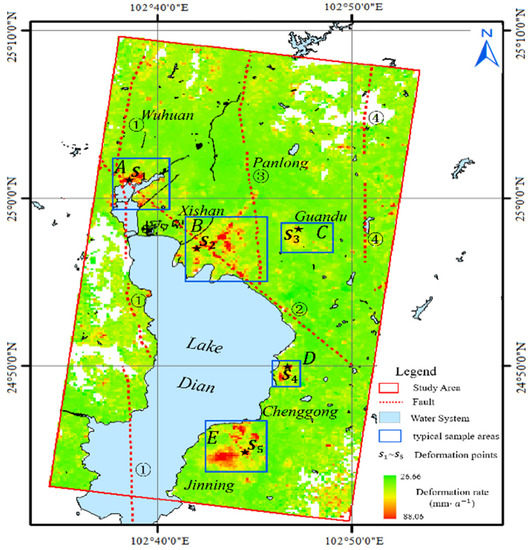
Figure 9.
Distribution map of feature points.
The precipitation data from July 2018 to November 2020 in the study area were acquired from China Meteorological Data Network (http://data.cma.cn/, accessed on 21 August 2021). The time-series values for feature points and monthly precipitation data in the study period are listed in Table 5. The time-series subsidence values of the five feature points in the study period were compared with the monthly average precipitation (Figure 10). According to the figure, the subsidence time-series of the five feature points showed a nonlinear decline with seasonal variations, and there was continuous ground subsidence at point during the whole study period. In November 2018, the precipitation in Kunming city was 0, and the subsidence value of that month achieved an extreme value of −34.4 mm. Over time, the cumulative subsidence rate reached the maximal of −160.7 mm in August 2020, and then the subsidence slowed down. From July 2018 to January 2019, and rose first and then subsided, during which the overall subsiding amount was relatively small. Subsequently, they continued to subside. In the rainy season of 2019, the subsiding rate slowed down and then continued to subside. From June to November 2020, the subsiding tended to be gentle. As depicted Figure 10, the period when the selected subsidence feature points decreased in the five vital subsidence areas corresponded to the rainy season with the maximal precipitation, thereby demonstrating that precipitation is inversely correlated with land subsidence. This is because rainfall is capable of penetrating into the ground through the soil and replenishing the groundwater level. With the rise of the groundwater level and the increase in the soil water content, the support of bedrock was improved, thereby effectively down-regulating the subsidence rate of the ground. In spring and winter, however, drought and little rain, soil water content decreased, groundwater extraction increased, groundwater level declined, bedrock lost support again, thereby intensifying land subsidence.
Table 5.
Subsidence times series of ~ feature points and monthly average rainfall data.
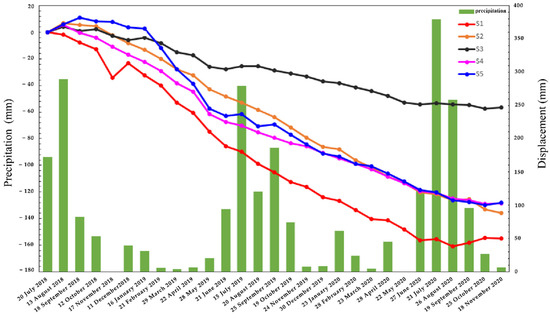
Figure 10.
Correlation between the time sequence of Subsidence feature points and monthly average rainfall.
6. Conclusions
With the development of urbanization, land subsidence has become one of the most prominent geological disasters in Kunming city. Land subsidence has caused significant damage to houses, roads, pipelines and other types of infrastructure. In this study, two time-series InSAR techniques were used to invert the time-series deformation of the Kunming main urban area from July 2018 to November 2020. Then, the accuracy of the time-series InSAR technology was verified using three methods: cross-comparison, comparison with the level data of the same period and field investigation. Finally, combined with time-series deformation, groundwater use survey data and rainfall data, this study analyzed the causes of land subsidence in the Kunming main urban area from four aspects of urban subway construction, geological structure, groundwater use and rainfall comprehensively. It established the monitoring and analysis system of urban land subsidence. Based on this study, the following conclusions are drawn:
- (1)
- The deformation results achieved by applying PS-InSAR and SBAS-InSAR techniques were consistent. There were numerous significant subsidence areas, mainly distributed in Xishan District, Guandu District and Jinning County. In the study period, the maximal annual subsidence rates identified by the two methods were −78 mm/a and −88 mm/a, respectively. The overall subsidence trend was large in the south (along the Lake Dian) and relatively small in the north. Moreover, cross-comparison verification was adopted to verify the InSAR monitoring results reliability, and the correlation coefficient of the two methods was 0.997. Compared with the identical period leveling data, root mean square error (RMSE) reached 8.5 mm/a and 6.7 mm/a, respectively. Through the field sampling investigation, the two InSAR techniques were verified with high correlation and reliability.
- (2)
- The ground subsidence of Kunming city is correlated with subway construction, geological structure and groundwater extraction. Kunming tectonic movement is significant, especially under the control by Chenggong-Fuming fault in North West. Under the special geological structure condition, considerable urban construction altered the original foundation stress state. With the increase in the load of the foundation and the excessive exploitation underground confined water in bedrock, the underground water level decreased, which lost their support for the foundation. Compression consolidation of soil under the double action of self-weight and external load induced regional ground subsidence.
- (3)
- The surface subsidence of Kunming city showed seasonal variations with rainfall. The flood season lasts from May to October. Moreover, the rainfall could replenish the soil water content and groundwater level effectively, and the land subsidence rate decreased. From November to following year April, the drought and lack of rain increased water consumption and increased land subsidence rate.
In this study, the land subsidence mechanism in Kunming city during the study period was proved qualitatively and quantitatively. The application value can be summarized according to two aspects. First, we overcame traditional surface subsidence monitoring technology disadvantages and improved the spatial and temporal resolution, which significantly reduced the economic costs. It can realize small-deformation accurate monitoring in various urban areas and provide strong technical support for monitoring surface subsidence in urban areas. Second, the causes of Kunming city ground subsidence were analyzed in this study from different aspects. A subsidence monitoring and analysis system was established in this study to solve the problems of subsidence reason is not specific and the subsidence trend is not clear in urban areas, which is beneficial to the inversion of the subsidence trend in urban areas. However, two problems in this study that should be discussed in subsequent studies. First, when the PS-InSAR and SBAS-InSAR technologies were adopted to verify the internal coincidence accuracy, too few corresponding points were selected. Distribution of corresponding points were concentrated relatively and not distributed evenly in the whole research area. The calculated correlation coefficient was close to 1, which should be corrected in subsequent studies. Second, in the process of data processing, atmospheric correction is not carried out. The influence of atmosphere on experimental results is ignored, which should be taken into account in future studies.
Author Contributions
Investigation, B.X., D.Z. and Z.Z.; formal analysis, B.X.; validation, B.X., J.Z. and Z.Z.; software, B.X. and D.Z.; methodology, B.X. and W.X.; Conceptualization, B.X. and J.Z.; resources, J.Z.; project administration, D.L.; supervision, J.Z. and D.L.; visualization, B.X. and D.Z.; writing—review and editing, B.X. and D.L.; writing—original draft preparation, B.X.; data curation, J.Z.; funding acquisition, J.Z. All authors have read and agreed to the published version of the manuscript.
Funding
This study was funded by Natural Science Foundation of China, grant number 41761081, 42161067.
Institutional Review Board Statement
Not applicable.
Informed Consent Statement
Not applicable.
Data Availability Statement
Not applicable.
Acknowledgments
Three arc-seconds SRTM DEM were freely downloaded from the website http://rmw.recordist.com/index.html, accessed on 10 May 2021. Thanks to ESA for its Sentinel-1A data from July 2018 to November 2020 and China Meteorological Data Network (http://data.cma.cn/, accessed on 1 April 2020 ) for its monthly precipitation data from July 2018 to November 2020.
Conflicts of Interest
The authors declare no conflict of interest.
References
- Strozzi, T.; Wegmuller, U.; Tosi, L.; Bitelli, G.; Spreckels, V. Land subsidence monitoring with differential SAR interferometry. Photogramm. Eng. Remote Sens. 2001, 67, 1261–1270. [Google Scholar]
- Xu, J.Q.; Ma, T.; Lu, Y.K.; Bai, W.M.; Zhao, S.H. Land subsidence monitoring in north Henan plain based on SBAS-InSAR technology. J. Jilin Uni. (Earth Sci.) 2019, 49, 1182–1191. [Google Scholar] [CrossRef]
- Dong, S.C.; Zhong, Y.H.; Hu, H.; Huang, L.L. Ground subsidence monitoring during 2015–2018 in Changzhou based on times series InSAR method. J. NanJing Unvi. (Natrual Sci.) 2019, 55, 370–380. [Google Scholar] [CrossRef]
- Xu, Q.; Pu, C.H.; Zhao, K.Y.; He, P.; Zhang, H.Y.; Liu, J.L. Time series InSAR monitoring and analysis of spatiotemporal evolution characteristics of land subsidence in Yan’an new district. Geom Inf Sci Wuhan Univ. 2021, 46, 957–969. [Google Scholar] [CrossRef]
- Gong, L.X.; Zhang, J.F.; Guo, Q.S. Measure groundwater pumping induced subsidence with D-InSAR. IEEE Int Symp Geosci Remote Sens. 2005, 7, 25–29. [Google Scholar] [CrossRef]
- Luo, X.G.; Wang, J.; Xu, Z.; Zhu, S.; Meng, L.S.; Liu, J.K.; Cui, Y. Dynamic analysis of urban ground subsidence in Beijing based on the permanent scattering InSAR technology. J. Appl. Remote Sens. 2018, 12, 026001. [Google Scholar] [CrossRef]
- Wu, Q.; Jia, C.T.; Chen, S.B.; Li, H.Q. SBAS-InSAR Based Deformation Detection of Urban Land, Created from Mega-Scale Mountain Excavating and Valley Filling in the Loess Plateau: The Case Study of Yan’an City. Remote Sens. 2019, 14, 1673. [Google Scholar] [CrossRef]
- Zebker, H.A.; Goldstein, R.M. Topographic mapping from interferometric synthetic aperture radar observations. J. Geophys. Res. 1986, 91, 4993–4999. [Google Scholar] [CrossRef]
- Perna, S.; Wimmer, C.; Moreira, J.; Fornaro, G. Airborne DInSAR time series at X-band. IEEE Int. Symp. Geosci. Remote Sens. 2010, 2868–2871. [Google Scholar] [CrossRef]
- Buonanno, S.; Zeni, G.; Fusco, A.; Manunta, M.; Marsella, M.; Carrara, P.; Lanari, R. A GeoNode-Based platform for an effective exploitation of advanced DInSAR measurements. Remote Sens. 2019, 11, 2133. [Google Scholar] [CrossRef]
- Carnec, C.; Fabriol, H. Monitoring and modeling land subsidence at the Cerro Prieto geothermal Field, Baja California, Mexico, using SAR interferometry. Geophys. Res. Lett. 1999, 26, 1211–1214. [Google Scholar] [CrossRef]
- Xia, Y.; Kaufmann, H.; Guo, X.F. Landslide monitoring in the Three Gorges area using D-InSAR and corner reflectors. Photogramm. Eng. Remote Sens. 2004, 70, 1167–1172. [Google Scholar] [CrossRef]
- Lubitz, C.; Motagh, M.; Wetzel, H.U.; Kaufmann, H. Remarkable urban uplift in Staufen im Breisgau, Germany: Observations from TerraSAR-X InSAR and leveling from 2008 to 2011. Remote Sens. 2013, 5, 3082. [Google Scholar] [CrossRef]
- Dong, J.; Zhang, L.; Tang, M.G.; Liao, M.S.; Xu, Q.; Gong, J.Y. Mapping landslide surface displacements with time series SAR interferometry by combining persistent and distributed scatterers: A case study of Jiaju landslide in Danba, China. Remote Sens. Environ. 2018, 205, 180–198. [Google Scholar] [CrossRef]
- Li, M.H.; Zhang, L.; Shi, X.G.; Liao, M.S.; Yang, M.S. Monitoring active motion of the Guobu landslide near the Laxiwa hydropower station in China by time-series point-like targets offset tracking. Remote Sens Environ. 2019, 221, 80–93. [Google Scholar] [CrossRef]
- Bayik, C. Deformation analysis of 2020 mw 5.7 Karliova, Turkey, earthquake using DInSAR method with different incidence angle SAR data. Arab J. Geosci. 2021, 14, 273. [Google Scholar] [CrossRef]
- Tang, X.W.; Guo, R.M.; Xu, J.Q.; Sun, H.P.; Chen, X.D.; Zhou, J.C. Probing the Fault Complexity of the 2017 Ms7.0 Jiuzhaigou earthquake based on the InSAR Data. Remote Sens. 2021, 13, 1573. [Google Scholar] [CrossRef]
- Li, Y.J.; Li, Y.S.; Hu, X.P.; Liu, H.Q. Fault geometry and mechanism of the Mw 5.7 Nakchu earthquake in Tibet inferred from InSAR observations and stress measurements. Remote Sens. 2021, 13, 5142. [Google Scholar] [CrossRef]
- Yang, C.S.; Zhang, Q.; Zhao, C.Y.; Ji, L.Y. Small baseline bubset InSAR technology used in Datong ground subsidence, fissure and fault zone monitoring. Geomat. Inf. Sci Wuhan Univ. 2014, 39, 945–950. [Google Scholar] [CrossRef]
- He, X.F.; Gao, Z.; Xiao, R.Y.; Luo, H.B.; Feng, C. Monitoring and analysis of subsidence along Lian-Yan railway using multi-temporal Sentinel-1A InSAR. Acta Geodaetica et Cartographica Sinica 2021, 50, 600–611. [Google Scholar] [CrossRef]
- Zhu, B.Y.; Yao, F.Y.; Sun, J.W.; Wang, X. Attribution analysis on land subsidence feature in Hexi area of Nanjing by InSAR and geological data. Geomat. Inf. Sci. Wuhan Univ. 2020, 45, 442–450. [Google Scholar] [CrossRef]
- Ferretti, A.; Prati, C.; Rocca, F. Nonlinear subsidence rate estimation using permanent scatterers in differential SAR interferometry. IEEE Trans Geosci Remote Sens. 2000, 5, 2202–2212. [Google Scholar] [CrossRef]
- Ferretti, A.; Prati, C.; Rocca, F. Permanent scatterers in SAR interferometry. IEEE Trans Geosci Remote Sens. 2001, 39, 8–20. [Google Scholar] [CrossRef]
- Berardino, P.; Fornaro, G.; Lanari, R.; Sansosti, E. A new algorithm for surface deformation monitoring based on small baseline differential SAR interferograms. IEEE Trans. Geosci. Remote Sens. 2002, 40, 2375–2383. [Google Scholar] [CrossRef]
- Zhou, C.F.; Gong, H.L.; Chen, B.B.; Li, J.W.; Gao, M.L.; Zhu, F.; Chen, W.F.; Liang, Y. InSAR time-series analysis of land subsidence under different land use types in the eastern Beijing plain, China. Remote Sens. 2014, 9, 380. [Google Scholar] [CrossRef]
- Hu, B.; Chen, J.Y.; Zhang, X.F. Monitoring the land subsidence area in a coastal urban area with InSAR and GNSS. Sensors 2019, 19, 3181. [Google Scholar] [CrossRef]
- Yalvac, S. Validating InSAR-SBAS results by means of different GNSS analysis techniques in medium- and high-grade deformation areas. Environ Monit Assess. 2020, 192, 120. [Google Scholar] [CrossRef]
- Hakim, W.L.; Achmad, A.R.; Lee, C.W. Land subsidence susceptibility mapping in Jakarta using functional and meta-ensemble machine learning algorithm based on time-series InSAR data. Remote Sens. 2020, 12, 3627. [Google Scholar] [CrossRef]
- Hussain, M.A.; Chen, Z.L.; Shoaib, M.; Shah, S.U.; Khan, J.K.; Ying, Z. Sentinel-1A for monitoring land subsidence of coastal city of Pakistan using Persistent Scatterers InSAR technique. Sci. Rep. 2022, 12, 5294. [Google Scholar] [CrossRef]
- Orhan, O. Monitoring of land subsidence due to excessive groundwater extraction using small baseline subset technique in Konya, Turkey. Environ Monit Assess. 2021, 193, 174. [Google Scholar] [CrossRef]
- Solano-Rojas, D.; Wdowinski, S.; Cabral-Cano, E.; Osmanoğlu, B. Detecting differential ground displacements of civil structures in fast-subsiding metropolises with interferometric SAR and band-pass filtering. Sci. Rep. 2020, 10, 15460. [Google Scholar] [CrossRef]
- Orhan, O.; Oliver-Cabrera, T.; Wdowinski, S.; Yalvac, S.; Yakar, M. Land subsidence and its relations with sinkhole activity in Karapınar region, Turkey: A multi-sensor InSAR time series study. Sensors 2021, 21, 774. [Google Scholar] [CrossRef]
- Zhu, W.; Li, W.L.; Zhang, Q.; Yang, Y.; Zhang, Y.; Qu, W.; Wang, C.S. A decade of ground deformation in Kunming (China) revealed by multi-temporal synthetic aperture radar interferometry (InSAR) technique. Sensors 2019, 19, 4425. [Google Scholar] [CrossRef]
- Shao, J.M.; Li, J.P.; Lu, H.J. Application of PS-InSAR technology in ground subsidence monitoring of Kunming. J. Henan Univ. Urb. Constr. 2017, 26, 45–49. [Google Scholar] [CrossRef]
- Xiong, P.; Zuo, X.Q.; Li, Y.F.; You, H. Application of dual-polarized Sentinel-1 data to subsidence monitoring in Kunming. Prog. Geophys. 2020, 4, 1317–1322. [Google Scholar] [CrossRef]
- Jiang, N.Q.; Zuo, X.Q.; Wang, Z.H.; You, H.; Zhao, Y.H. Monitoring land settlement in the main urban area of Kunming based on PS-InSAR and SBAS-InSAR. J. Guizhou Univ. (Natural Sci). 2020, 37, 72–78. [Google Scholar] [CrossRef]
- Xue, C.D.; Liu, X.; Li, B.Z.; Meng, G.T.; Li, F. Mechanism analysis of land subsidence in Kunming city area. Chin. J. Geol. Hazard Control 2004, 15, 47–53. [Google Scholar] [CrossRef]
- Perissin, D.; Prati, C.; Engdahl, M.E.; Desnos, Y.L. Validating the SAR wavenumber shift principle with the ERS Envisat PS coherent combination. IEEE Trans. Geosci. Remote Sens. 2006, 44, 2343–2351. [Google Scholar] [CrossRef]
- Foroughnia, F.; Nemati, S.; Maghsoudi, Y.; Perissin, D. An iterative PS-InSAR method for the analysis of large spatio-temporal baseline data stacks for land subsidence estimation. Int. J. Appl. Obs. Geoinformation. 2019, 74, 248–258. [Google Scholar] [CrossRef]
- Colesanti, C.; Ferretti, A.; Novali, F.; Prati, C.; Rocca, F. SAR monitoring of progressive and seasonal ground deformation using the permanent scatterers technique. IEEE Trans. Geosci. Remote Sens. 2003, 41, 1685–1701. [Google Scholar] [CrossRef]
- Lanari, R.; Mora, O.; Manunta, M.; Mallorquí, J.; Berardino, P.; Sansosti, E. A small-baseline approach for investigating deformations on full-resolution differential SAR interferograms. IEEE Trans. Geosci. Remote Sens. 2004, 42, 1377–1386. [Google Scholar] [CrossRef]
- Yu, S.Y.; Yang, Y.Y.; Zhang, P.F.; Sun, J.; Luo, J.J. Monitoring Land Subsidence and Fault Activity in Hefei City Based on MT-InSAR. J. Geod. Geodyn. 2020, 41, 398–402. [Google Scholar] [CrossRef]
- Qu, C.Y.; Dan, X.J.; Zhang, G.H.; Xu, X.B.; Song, X.G.; Zhang, G.F.; Liu, Y.H. The research progress in measurement of fault activity by time series InSAR and discussion of related issues. Seismol. Geol. 2014, 36, 731–748. [Google Scholar]
- Liu, Q.; Yue, G.S.; Ding, X.B.; Yang, K.; Feng, G.C.; Xiong, Z.Q. Temporal and Spatial Characteristics Analysis of Deformation Along Foshan Subway Using Time Series InSAR. Geomat. Inf. Sci. Wuhan Univ. 2019, 7, 1099–1106. [Google Scholar]
- Ding, X.F.; Zhang, G.D. An analysis of the geologic condctions of Haigeng geothermal well in Kunming, Yunnan. Yunnan Geol. 2019, 38, 238–243. [Google Scholar]
- Zhou, D.Y.; Zuo, X.Q.; Zhao, Z.F. Constructing a large-scale urban land subsidence prediction method based on neural network algorithm from the perspective of multiple factors. Remote Sens. 2022, 14, 1803. [Google Scholar] [CrossRef]
Publisher’s Note: MDPI stays neutral with regard to jurisdictional claims in published maps and institutional affiliations. |
© 2022 by the authors. Licensee MDPI, Basel, Switzerland. This article is an open access article distributed under the terms and conditions of the Creative Commons Attribution (CC BY) license (https://creativecommons.org/licenses/by/4.0/).