Article

Research on Urban Greenway Alignment Selection Based on Multisource Data

1
College of Landscape and Architecture, Zhejiang A&F University, Hangzhou 311300, China
2
Zhejiang Provincial Key Laboratory of Germplasm Innovation and Utilization for Garden Plants, Hangzhou 311300, China
*
Author to whom correspondence should be addressed.
Sustainability 2022, 14(19), 12382; https://doi.org/10.3390/su141912382
Submission received: 27 July 2022 / Revised: 26 August 2022 / Accepted: 23 September 2022 / Published: 29 September 2022
(This article belongs to the Section Sustainable Urban and Rural Development)

Abstract

:
At present, people’s growing need for a beautiful ecological environment needs to be met. As a high-quality ecological product, greenways help improve the living environment and promote green and coordinated development. How to scientifically and rationally plan greenway routes and expand the green ecological network has become an important issue for the sustainable development of high-density built-up areas. Therefore, this study determines the suitability evaluation system of urban greenway alignment selection based on spatial constructiveness, greenway accessibility, resource attractiveness and public demand through factor analysis. Taking Xixi Wetland to South Lake in Yuhang District as an example, combining urban multi-source data and GIS spatial analysis methods, all routes suitable for greenway construction in the study area were determined, and four excellent greenway routes were initially identified through manual correction. Subsequently, the PSO-BP neural network model was trained using 172 greenway samples to obtain a greenway alignment suitability evaluation model with an accuracy of more than 96%, which was used for subsequent greenway alignment optimization. The above four preliminary greenway routes are substituted into the PSO-BP model to obtain the optimal greenway routes in the study area. The results show that there are 17 indicators in 4 levels and 8 dimensions in the urban greenway route selection potential model, among which two indicators, public cycling and running demand, have a greater weight and should be highly considered in the route selection assessment. The optimal planned route for the greenway start from Guangfu Temple entrance of Xixi Wetland, follow the roadside green belt and Yuhangtang River greenway to South Lake. The study obtained the best planning route for the greenway from Xixi Wetland to South Lake in Yuhang District, which is a new practice of landscape garden planning and design supported by multisource data and new technologies, with a view to providing a reference for the preferential selection of urban greenway routes in similar high-density built-up areas.

1. Introduction

With the continuous development of society, people’s need for a beautiful ecological environment is increasing, and the demand for leisure and recreation space is gradually increasing [1]. The construction of high quality habitat environment has become the main task of the current urban development stage. In the context of the continuous expansion of urban built-up area, green space has become a scarce resource at present [2]. A spatial mismatch has formed between the expanding hard interface, the rapidly increasing urban population and the citizens’ urgent need for leisure and recreation. Greenways, as high-quality public ecological products with small footprint, strong connectivity and wide coverage, are an important means to alleviate the shortage of green space in cities. As an important carrier for residents to share urban ecological space, greenways help to enhance and reshape urban environmental space, contribute to the development of high-quality habitat, and enhance citizens’ sense of access and well-being. In this context, high-quality greenway development has become the main theme of urban renewal [3,4]. The urban greenway in this study refers to a green corridor in the high-density built-up area of the city, relying on rivers, roads, mountains and other buildable spaces, linking important natural and man-made landscapes in the region, with functions of recreation, leisure and fitness, cultural exchange.
At present, the construction of some greenways suffers from a small radiation of comprehensive benefits, planning does not adequately meet the existing needs of residents, and a lack of humanistic care [5,6]. A scientific and reasonable greenway selection mechanism is an important prerequisite for achieving high-quality greenway construction [7]. At this stage, most greenway planning starts from a top-down perspective, with the government coordinating and design institutes leading, ignoring the importance of public demand in the construction of greenways [8], resulting in a low utilization rate of greenways and low public access and satisfaction. Therefore, in the complex and compact urban built environment, it is necessary to conduct in-depth research on the selection of greenway routes from multiple dimensions, such as systemic, human-oriented, characteristic and economic aspects, to enhance the scientific nature of urban greenway planning, promote the coordinated development of spatial greenways and promote the construction of urban ecological livability. As the primary link in greenway construction, the degree of refinement and rationality determines the efficiency of the comprehensive value transformation of the greenway [9,10].
In the current study, urban greenway route selection studies mostly focus on policy orientation [11], recreation resources [12,13], ecological protection [14,15], traffic accessibility [16,17], but less studies focus on the diversified needs of the public. Most of the studies on route selection at this stage are focused on the suitability of a single element and lack of comprehensive control of multiple elements, which has not formed a mature mechanism of greenway selection and is not conducive to the planning of greenways in complex urban environments. Therefore, in the urban high-density built environment, it is necessary to conduct in-depth research on the selection of greenways from multiple dimensions, such as systemic, human-oriented, characteristic, and economic, to improve the scientific nature of urban greenway planning, promote the coordinated development of green space, and promote the construction of urban ecological livability.
A study of the literature reveals that, the research on greenway selection is mainly focused on macroscopic large scale such as urban clusters [18,19] and villages [20,21,22], while there is a lack of research on greenway selection for urban high-density built-up areas. As a linear open space, greenways in urban core areas have multiple values in ecology, economy, recreation and social interaction, and can enhance the frequency of green travel of residents [23,24], which is an important corridor to promote sustainable urban development. Therefore, it is necessary to thoroughly study the mechanism of greenway selection in urban high-density built-up areas.
Currently, the greenway selection is based on multi-factor suitability evaluation, combined with GIS spatial analysis technology to carry out research [25,26]. In the acquisition of index information, most of them are conducted by questionnaire or interview, which is not easy to obtain data and has poor timeliness. In the construction of the evaluation model, the index weights are mostly obtained through expert scoring, which is relatively single and subjective, and is not conducive to the generalization of the evaluation model. With the continuous development of information technology, urban planning based on big data analysis has become a research hotspot in recent years [27,28]. However, in the field of landscape gardening, the research and practice of big data have just started. The introduction of big data makes up for the previous problems of limited access to data and the lack of analysis techniques in terms of accuracy, making it possible to fine-tune the evaluation of urban greenway alignment selection. The scholars have carried out a lot of practice in the fields of construction conditions [29], accessibility [30] and landscape beauty [31] through big data combined with GIS spatial analysis to assist greenway planning and design through spatial visualization and digital expression. At present, there are still shortages in the research of big data in urban greenway selection, and there are few explorations at the level of public demand, and most of them are oriented to commuting and travel demand, and there is a lack of research on the mechanism of greenway selection under the integration of multiple elements. Therefore, a refined element analysis based on multi-source data should be conducted to improve the scientific and rational evaluation of greenway route suitability.
In August 2022, Hangzhou designated the “Xixi Wetland to South Lake section” as the latest main urban area, and its greenway construction is typical and exemplary for high-density built-up areas. The scientific layout of the greenway route helps to enhance the functions of the greenway such as leisure tour, green travel, social culture, sports and fitness.
Therefore, this study takes the section of high-density built-up area from Xixi Wetland to South Lake in Yuhang District as an example, with a view to enriching the planning ideas of greenways in high-density urban core areas. It also uses multi-source data and PSO-BP neural network training models to make up for the shortcomings of traditional quantitative analysis in terms of accuracy, enhance the accuracy of suitability evaluation, and promote the development of landscape gardening in a digital context.

2. Materials and Methods
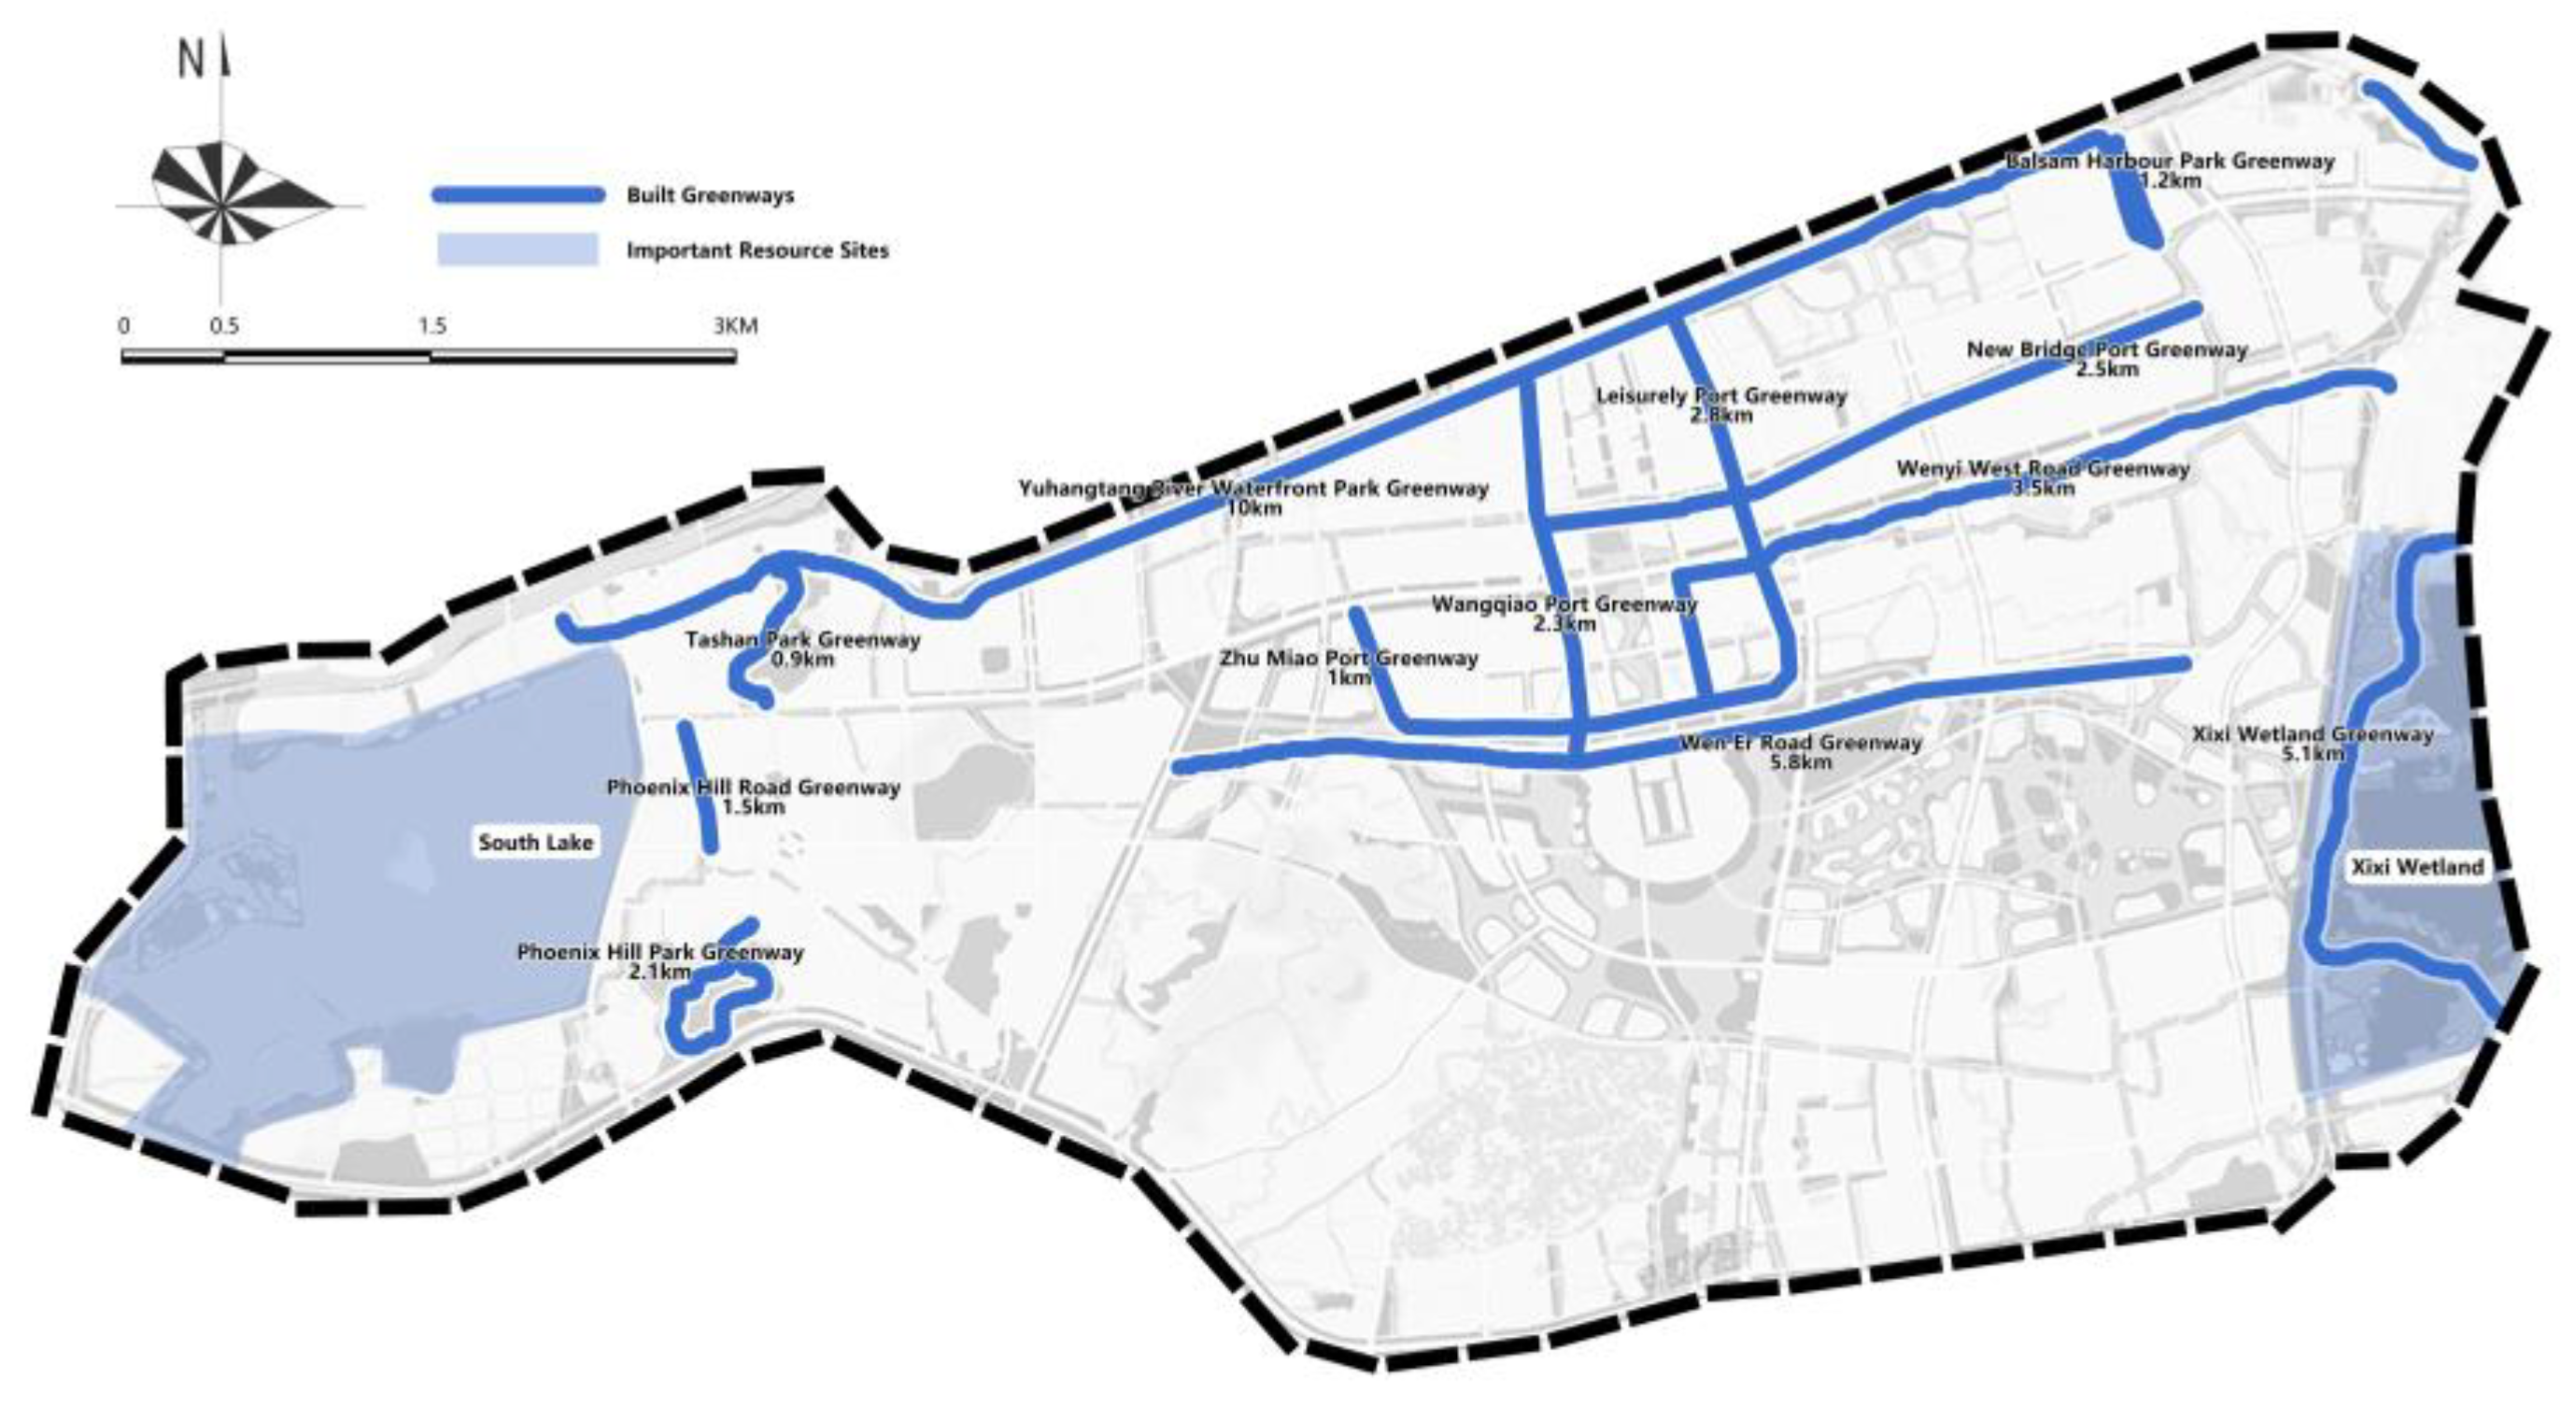
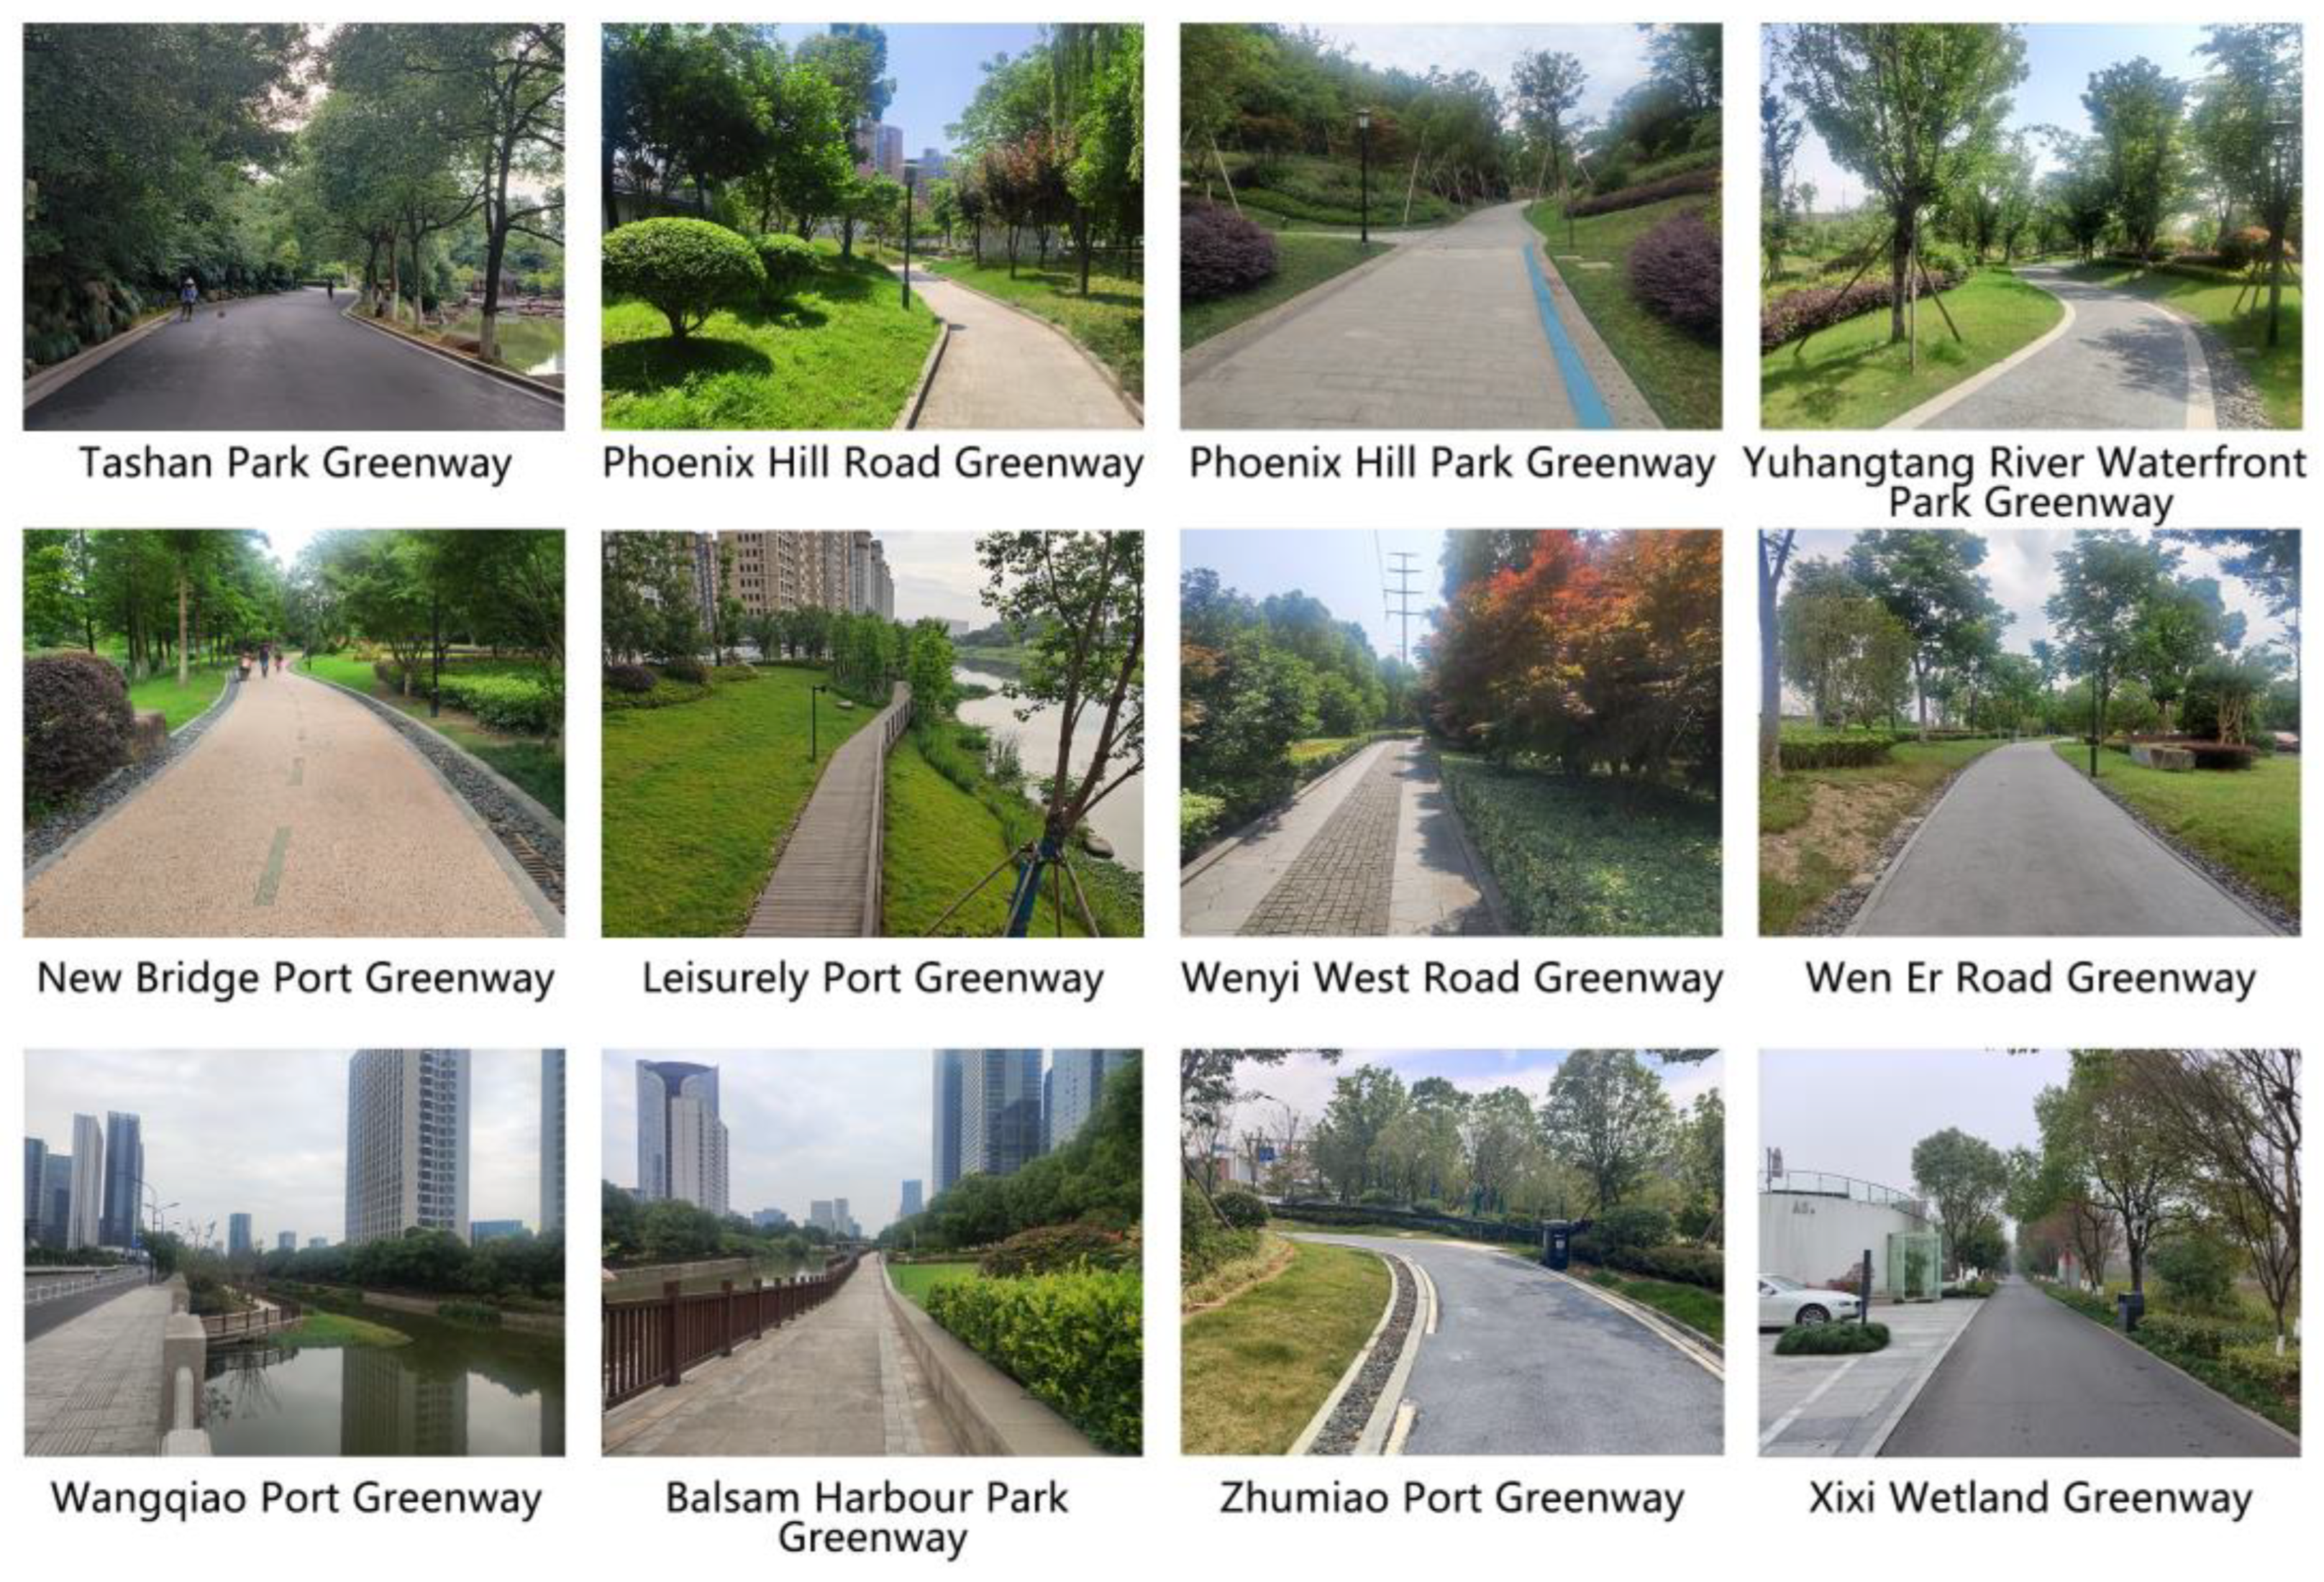
2.1. Study Area

The section from Xixi Wetland to Nanhu in Yuhang District (119.907–120.064° E, 30.244–30.313° N) is classified as one of the newest main urban areas of Hangzhou, and is located at the southern end of the Hangjiahu Plain, with rich landscape resources and an advantageous location. The study area is characterized by high built-up density, poorly connected existing greenways, and quality to be improved, and is a typical urban high-density built-up area, whose greenway route planning is exemplary. Through expert interviews and field surveys, it was found that 12 greenways have been built in the study area, which is presented in Figure 1, totaling 38.7 km. The greenways are mainly concentrated in the core area of the Future Science and Technology City, and there are breakpoints in the east–west connection. The current status of the built greenway is shown in Figure 2.

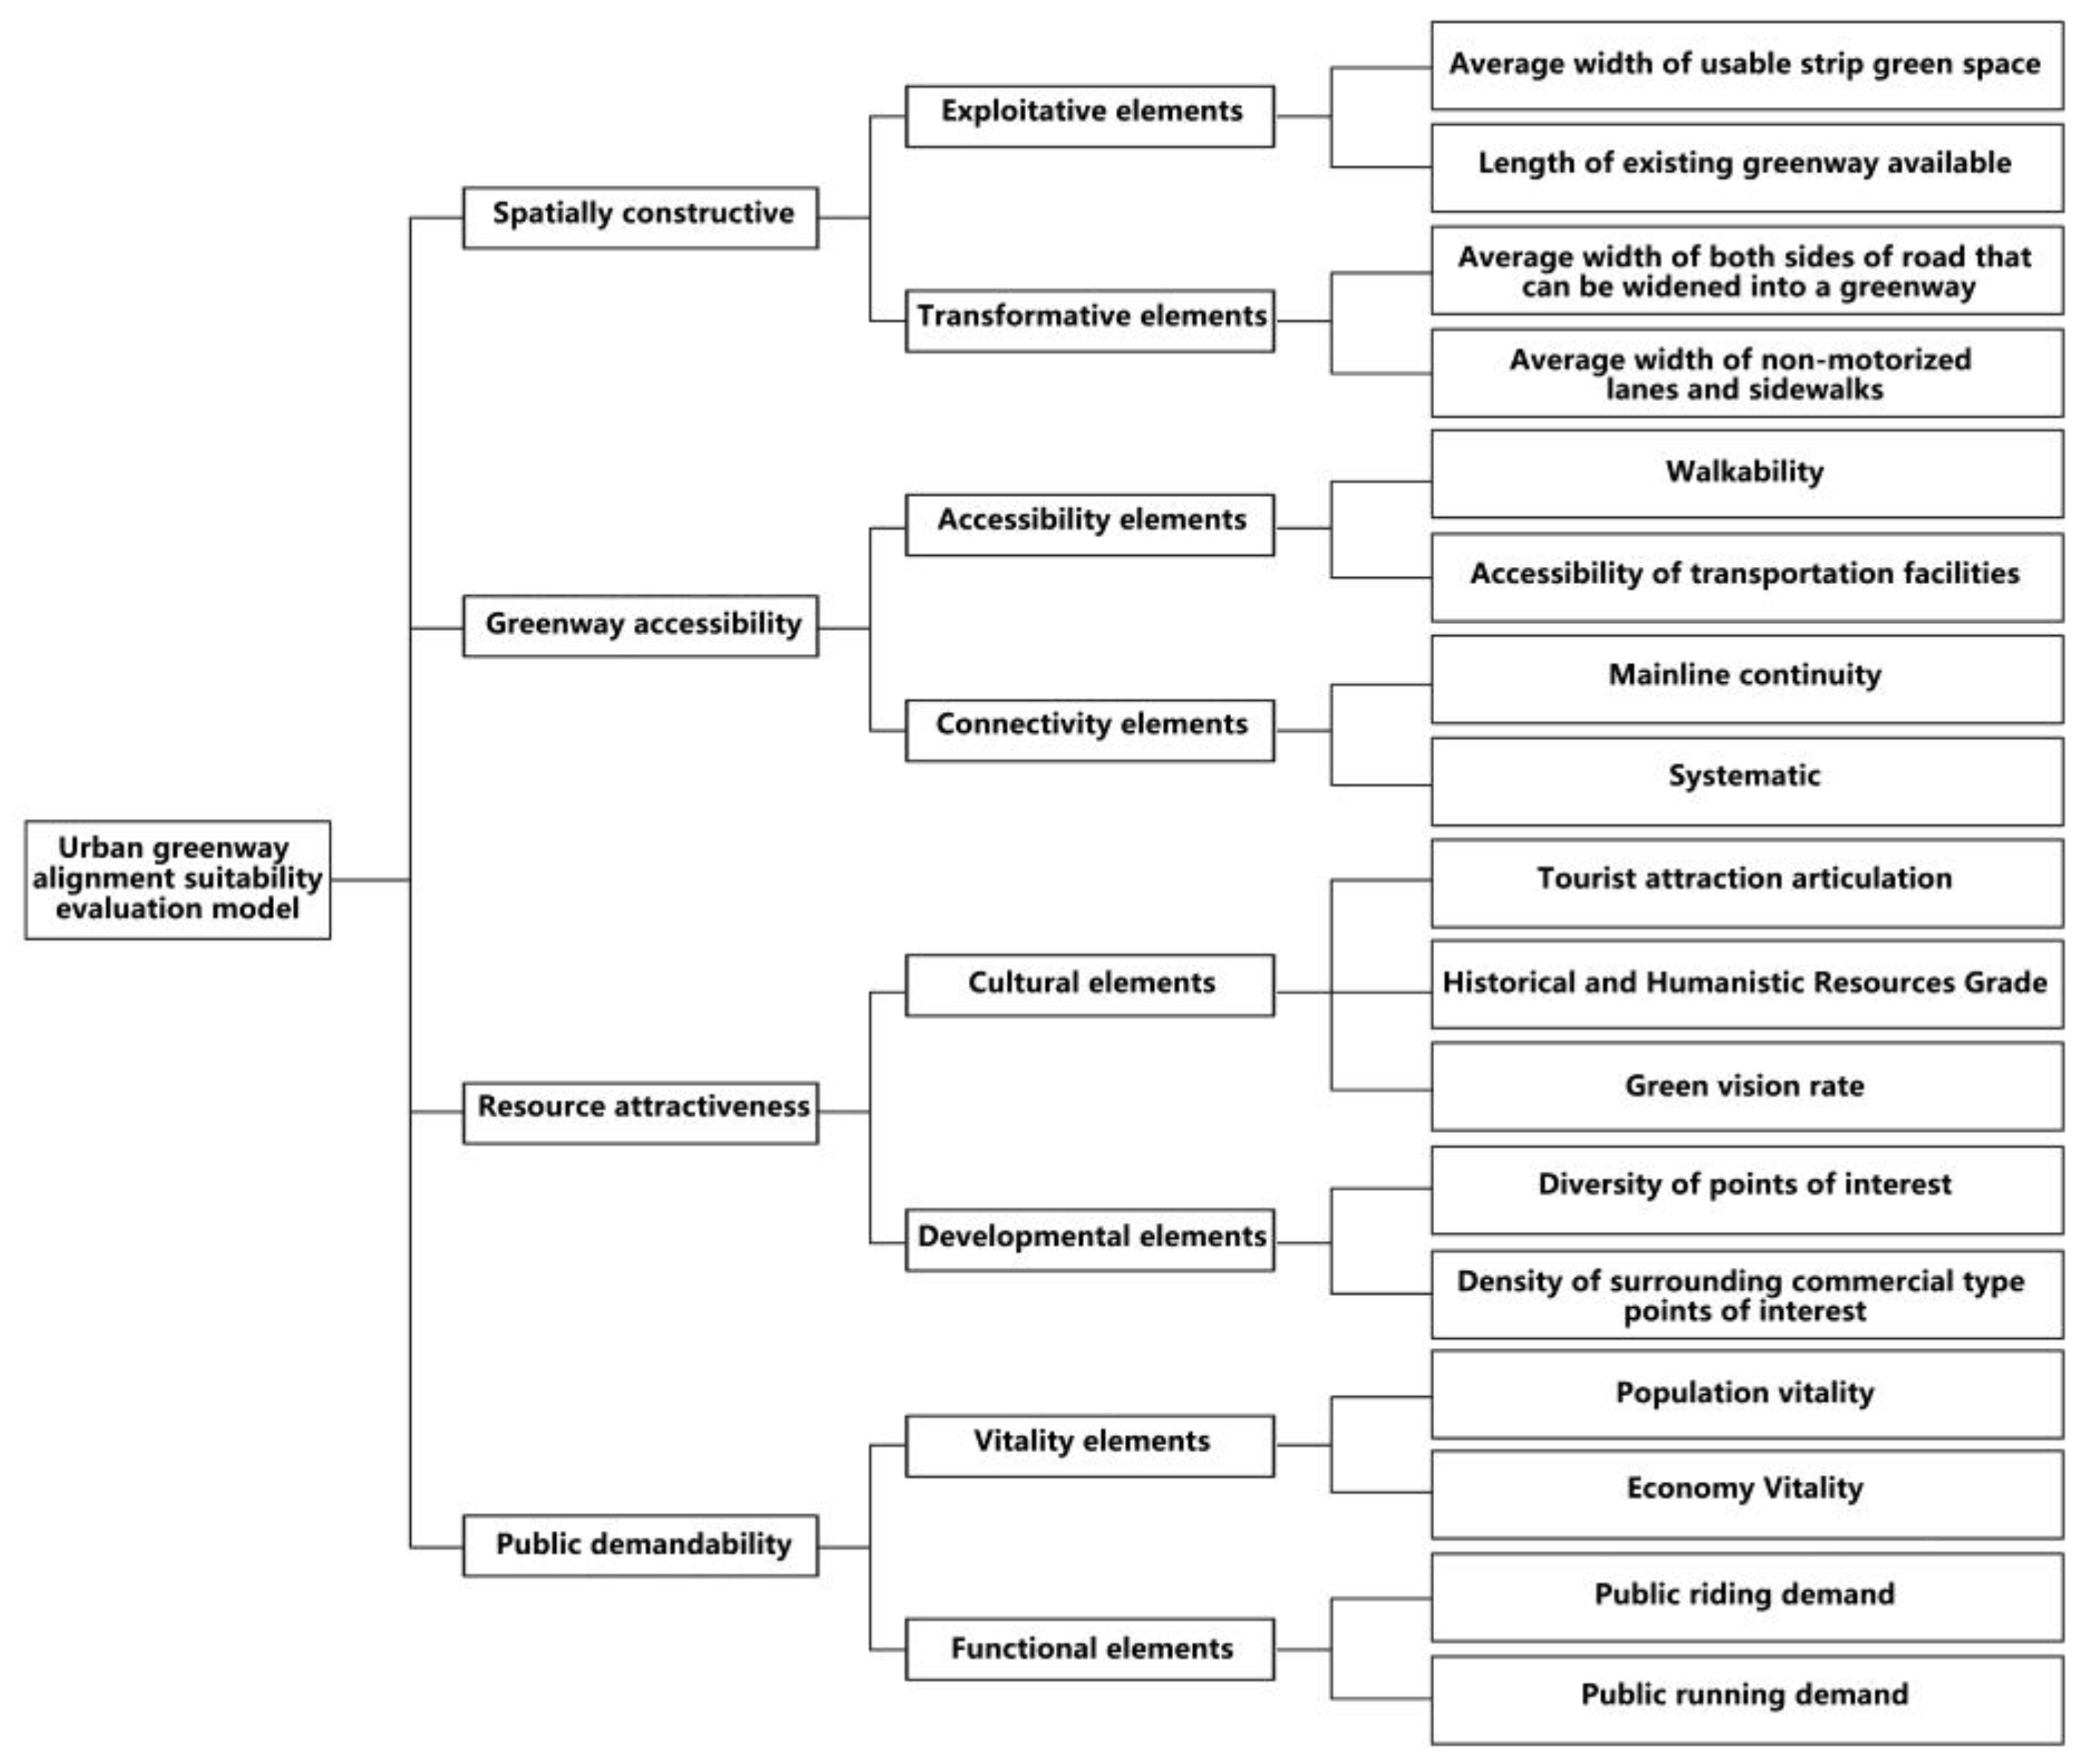
2.2. Evaluation Model Construction of Urban Greenway Selection Potential

At this stage, most of the greenway selection is carried out by constructing a suitability evaluation model, and the science and completeness of the selection elements in the evaluation model is an important basis for the study. In order to scientifically and effectively identify the factors influencing the suitability of urban greenway selection, this paper obtained 57 papers on the topic of “greenway selection” based on CNKI database according to the statistical method of literature information, among which 17 papers were on the topic of “selection suitability evaluation” [11,12,13,14,16,17,20,25,30,31,32,33,34,35,36,37,38]. The content of the route suitability evaluation system in these 17 papers was studied, and the frequency of specific factors was calculated by combining synonyms of the influencing factors to obtain the set of influencing factors of urban greenway route selection (as Table 1). According to the landscape gardening planning and design ideas, combined with the principle of “systematic continuity” in the “Guidelines for Greenway Planning and Design”, the main line continuity (the degree of tandem with existing greenways) and the length of existing greenways that can be directly used were selected as the influencing factors in the study of the suitability of urban greenway selection.
Based on the 21 influencing factors from the literature combined with the innovative selection of 2 influencing factors, a pre-survey was conducted based on these 23 influencing factors, and 126 randomly invited greenway users to fill in the questionnaire and collect the respondents’ agreement on the influence of each factor on the selection of greenway routes for factor analysis. The KMO value was 0.847, and the Bartlett’s sphericity test was much less than 0.01. Therefore, there was correlation between the variables and the factor analysis was valid. According to the results of the factor analysis, the factors in which the variance of the common factor was less than 0.6 were excluded, namely the six items of regional building density (0.279), natural resource area (0.424), human resource preservation (0.536), the number of surrounding industrial-type points of interest (0.444), the number of surrounding public facility-type points of interest (0.400), and vegetation diversity (0.353). The final selection of 17 urban greenway route selection impact factors. Subsequently, the research was re-conducted according to the 17 influencing factors identified in the initial screening, and the KMO and Bartlett tests were conducted on the research data through SPSS software, and the KMO value was 0.804 and the significant p value was 0.000, which shows that the correlation among the variables is obvious and satisfies the conditions of factor analysis. Subsequently, exploratory factor analysis was performed on the data, and a common factor variance table was obtained. It can be seen that the minimum value of common factor variance is 0.610 for diversity of interest points and the maximum value is 0.834 for accessibility of transportation facilities, both of which are greater than 0.6, indicating that each indicator has a significant influence on each other, and therefore they are all retained.
Combined with the realistic development of the high-density built-up area of the city, 17 route selection factors were finally determined around four types of resource orientation: spatial constructiveness, greenway accessibility, resource attractiveness and public demand (Figure 3) to achieve the effectiveness and relevance of the element selection.

2.3. Multisource Data

2.3.1. Data Source

This study uses multi-source data for greenway alignment suitability analysis, which can be divided into three categories according to the different ways of data acquisition: planning data provided by the government, data crawled by open platforms, and manually acquired data, and divided into 14 sub-categories according to the specific applications of the data (as shown in Table 2).

2.3.2. Data Calculation Method

According to the different ways of calculating indicators in the evaluation system of urban greenway alignment suitability, the processing of research data can be divided into the following eight categories.
(1) Government provides processing of relevant planning data
The relevant measurement involves three dimensions, spatial constructiveness, greenway accessibility and resource attractiveness, and is carried out in eight aspects: width of strip green space, length of existing greenway available, average width of widenable surrounding road sections, average width of nonmotorized road sidewalk, mainline continuity, systemic aspect, tourist attraction articulation and historical and humanistic resource rating. The calculation method is shown in Table 3.
(2) Road Network Data
The correlation measure was carried out for the dimension of greenway accessibility in terms of both walkability and accessibility of transportation facilities.
Pedestrian accessibility, that is, the section of the degree of penetration, reflects the potential of the surrounding pedestrians to choose the route as the access route; the higher the degree of choice that the section is, the higher the frequency of pedestrians crossing, the stronger the accessibility, and the higher the suitability of greenway construction. sDNA (spatial design network analysis) is a new practice of spatial syntactic analysis tools, and line analysis by weighted dyadic topology can effectively fit spatial studies at the town scale [39,40]. Therefore, the centerline of the Open Street Map road network was used as the basis, 800 m of daily walking was selected as the radius of the network analysis [41], and the travel potential of the road section was calculated using sDNA. Subsequently, the ArcGIS natural breakpoint method was used to classify the accessibility of the road section into five levels and assign a score of 1-5; the higher the intermediary intermediate is, the higher the score of the road section. The total sample score is calculated based on the score of each road segment to obtain the accessibility evaluation.
The accessibility of transportation facilities, meaning the shortest distance from the planned greenway to bus and subway stations, reflects the convenience of accessing public transportation services on the road section. The shorter the articulated interchange distance is, the more easily the green slow walking system is accepted by the public and the higher the utilization rate of the greenway. Therefore, the data of bus stops in the study area were obtained from the Hangzhou Open Data Platform, a fishing net was established in 500 m units, the shortest distance from 1478 demand points to the stops was calculated by using the ArcGIS network analysis tool to establish the OD cost matrix, and the time cost was calculated at a walking speed of 80 m/min to construct a fishing net map of the accessibility of transportation facilities in the study area. Finally, the accessibility was divided into five levels by the natural fracture method, and the accessibility of transportation facilities was evaluated by superimposing analysis with samples and assigning scores (1–5) to the levels.
(3) Street View Image Data
The correlation measure was developed for the indicator of the green vision rate, which reflects the visual quality of the street landscape and the overall landscape beauty of the greenway through the green vision rate of the sample surroundings. The streetscape photos covering the study area were obtained through field surveys, and a full convolutional neural network model with 81.4426% accuracy provided by the High Performance Computing Laboratory (CUG.HPSCIL) was used to segment the visual semantics of the streetscape images, identify features such as vegetation, buildings, sky, and roads, and calculate the percentage of green elements among them to obtain the sample green view rate. The higher the green vision rate is, the higher the landscape value and the greater the recreational appeal to users [42].
(4) POI Data
The correlation measurement was carried out for the dimension of resource attractiveness in terms of the diversity of points of interest and the density of surrounding commercial-type points of interest.
Diversity of points of interest includes the richness of 7 types of points of interest around the greenway: dining, shopping, science, education and culture, accommodation, health care, sports and leisure, and living services. The higher the richness is, the better the mix of facilities in the area, and the easier it is to meet the diverse needs of users. Therefore, the data of 17,550 POIs covering the study area were collected in the open platform of Gaudet Map, and the total number of POIs covered by each cell of the sample was calculated using a normal walk of 6 min and 500 m as the radius of the cell. The ArcGIS entropy index was subsequently applied to measure the sample cell mixture [43] to obtain the sample point-of-interest diversity evaluation(see Equation (1)).
D i = i = 1 R p i × ln p i
p i refers to the share of the ith point-of-interest type in the region in the total number, and R refers to the total number of point-of-interest types. The larger the diversity index D i , the higher the regional point-of-interest mix and the more easily the diverse needs of residents are satisfied.
The density of surrounding commercial types of interest points includes the distribution of shopping, dining, sports and leisure types of interest points around the greenway. The greater the density is, the greater its shopping and entertainment attraction, and the overall attraction value of the greenway increases with it. Therefore, 10,662 commercial service class POI data covering the study area were collected on the Gaode Map open platform, and the ArcGIS kernel density tool was used to combine the sample data to obtain the commercial service class point of interest density evaluation by assigning values from 1–9.
(5) Nighttime lighting data
The correlation measure was developed for the indicator of regional population vitality, which represents the value of population activity in the area around the greenway, which is closely related to the amount of public demand. The higher the vitality value of the route is, the greater the demand for public use and the greater the need for greenway construction. Nighttime lighting data are widely used in population spatialization studies for their comprehensive reflection of human activities [44,45,46]. The NPP/VIRS and LJ1-01 nighttime light data were collected for pre-experiments, and the April 2022 NPP/VIRS data with high accuracy and timeliness in the study area were finally selected. The preprocessed nighttime light data were geographically aligned with the road network, and the sample population vitality values were obtained by raster multiplication and sample overlay assignment.
(6) Merchant hours of operation data
The relevant measure is the regional economic vitality, which represents the ability to sustain the economic development of the area around the greenway, reflecting the endogenous strength and resilience of the region. Data on the hours of operation of merchants can reflect the economic vitality of the street, and the higher the vitality value of the route is, the greater the likelihood of its greenway economic development. The information of 3012 businesses in the study area was obtained through Python, and the data of business hours of each store were aggregated to the adjacent streets through stacking analysis after establishing the road section buffer to obtain the evaluation of the economic vitality of the sample.
(7) Riding path data
The relevant measurement was carried out for the indicator of public riding demand, that is, thinking from the perspective of public participation and people-oriented, and calculating the degree of public demand for the cycling function of the greenway. Strava, a popular sports social software package, has been widely used in the study of cyclist demand preferences by visualizing cycling trajectories through techniques such as path rasterization and normalization [47]. Therefore, the study area 2021 Strava platform ride heat data were collected and overlaid with the sample for analysis to determine the sample ride demand values.
(8) Running Preference Data
The relevant measurement was carried out for the indicator of public running demand, i.e., the degree of demand of the surrounding citizens for the running function of the greenway, and the higher the intensity of demand is, the higher the necessity of construction of the route. In recent years, Keep running data have been widely used in the study of resident demand [20,42]. According to the prospectus of Keep, as of February 2022, the number of users exceeded 300 million, with over 40 million monthly active users, and the running preference data are representative. Therefore, the sample running demand values were determined by overlaying the KEEP running track thermal data with the sample.

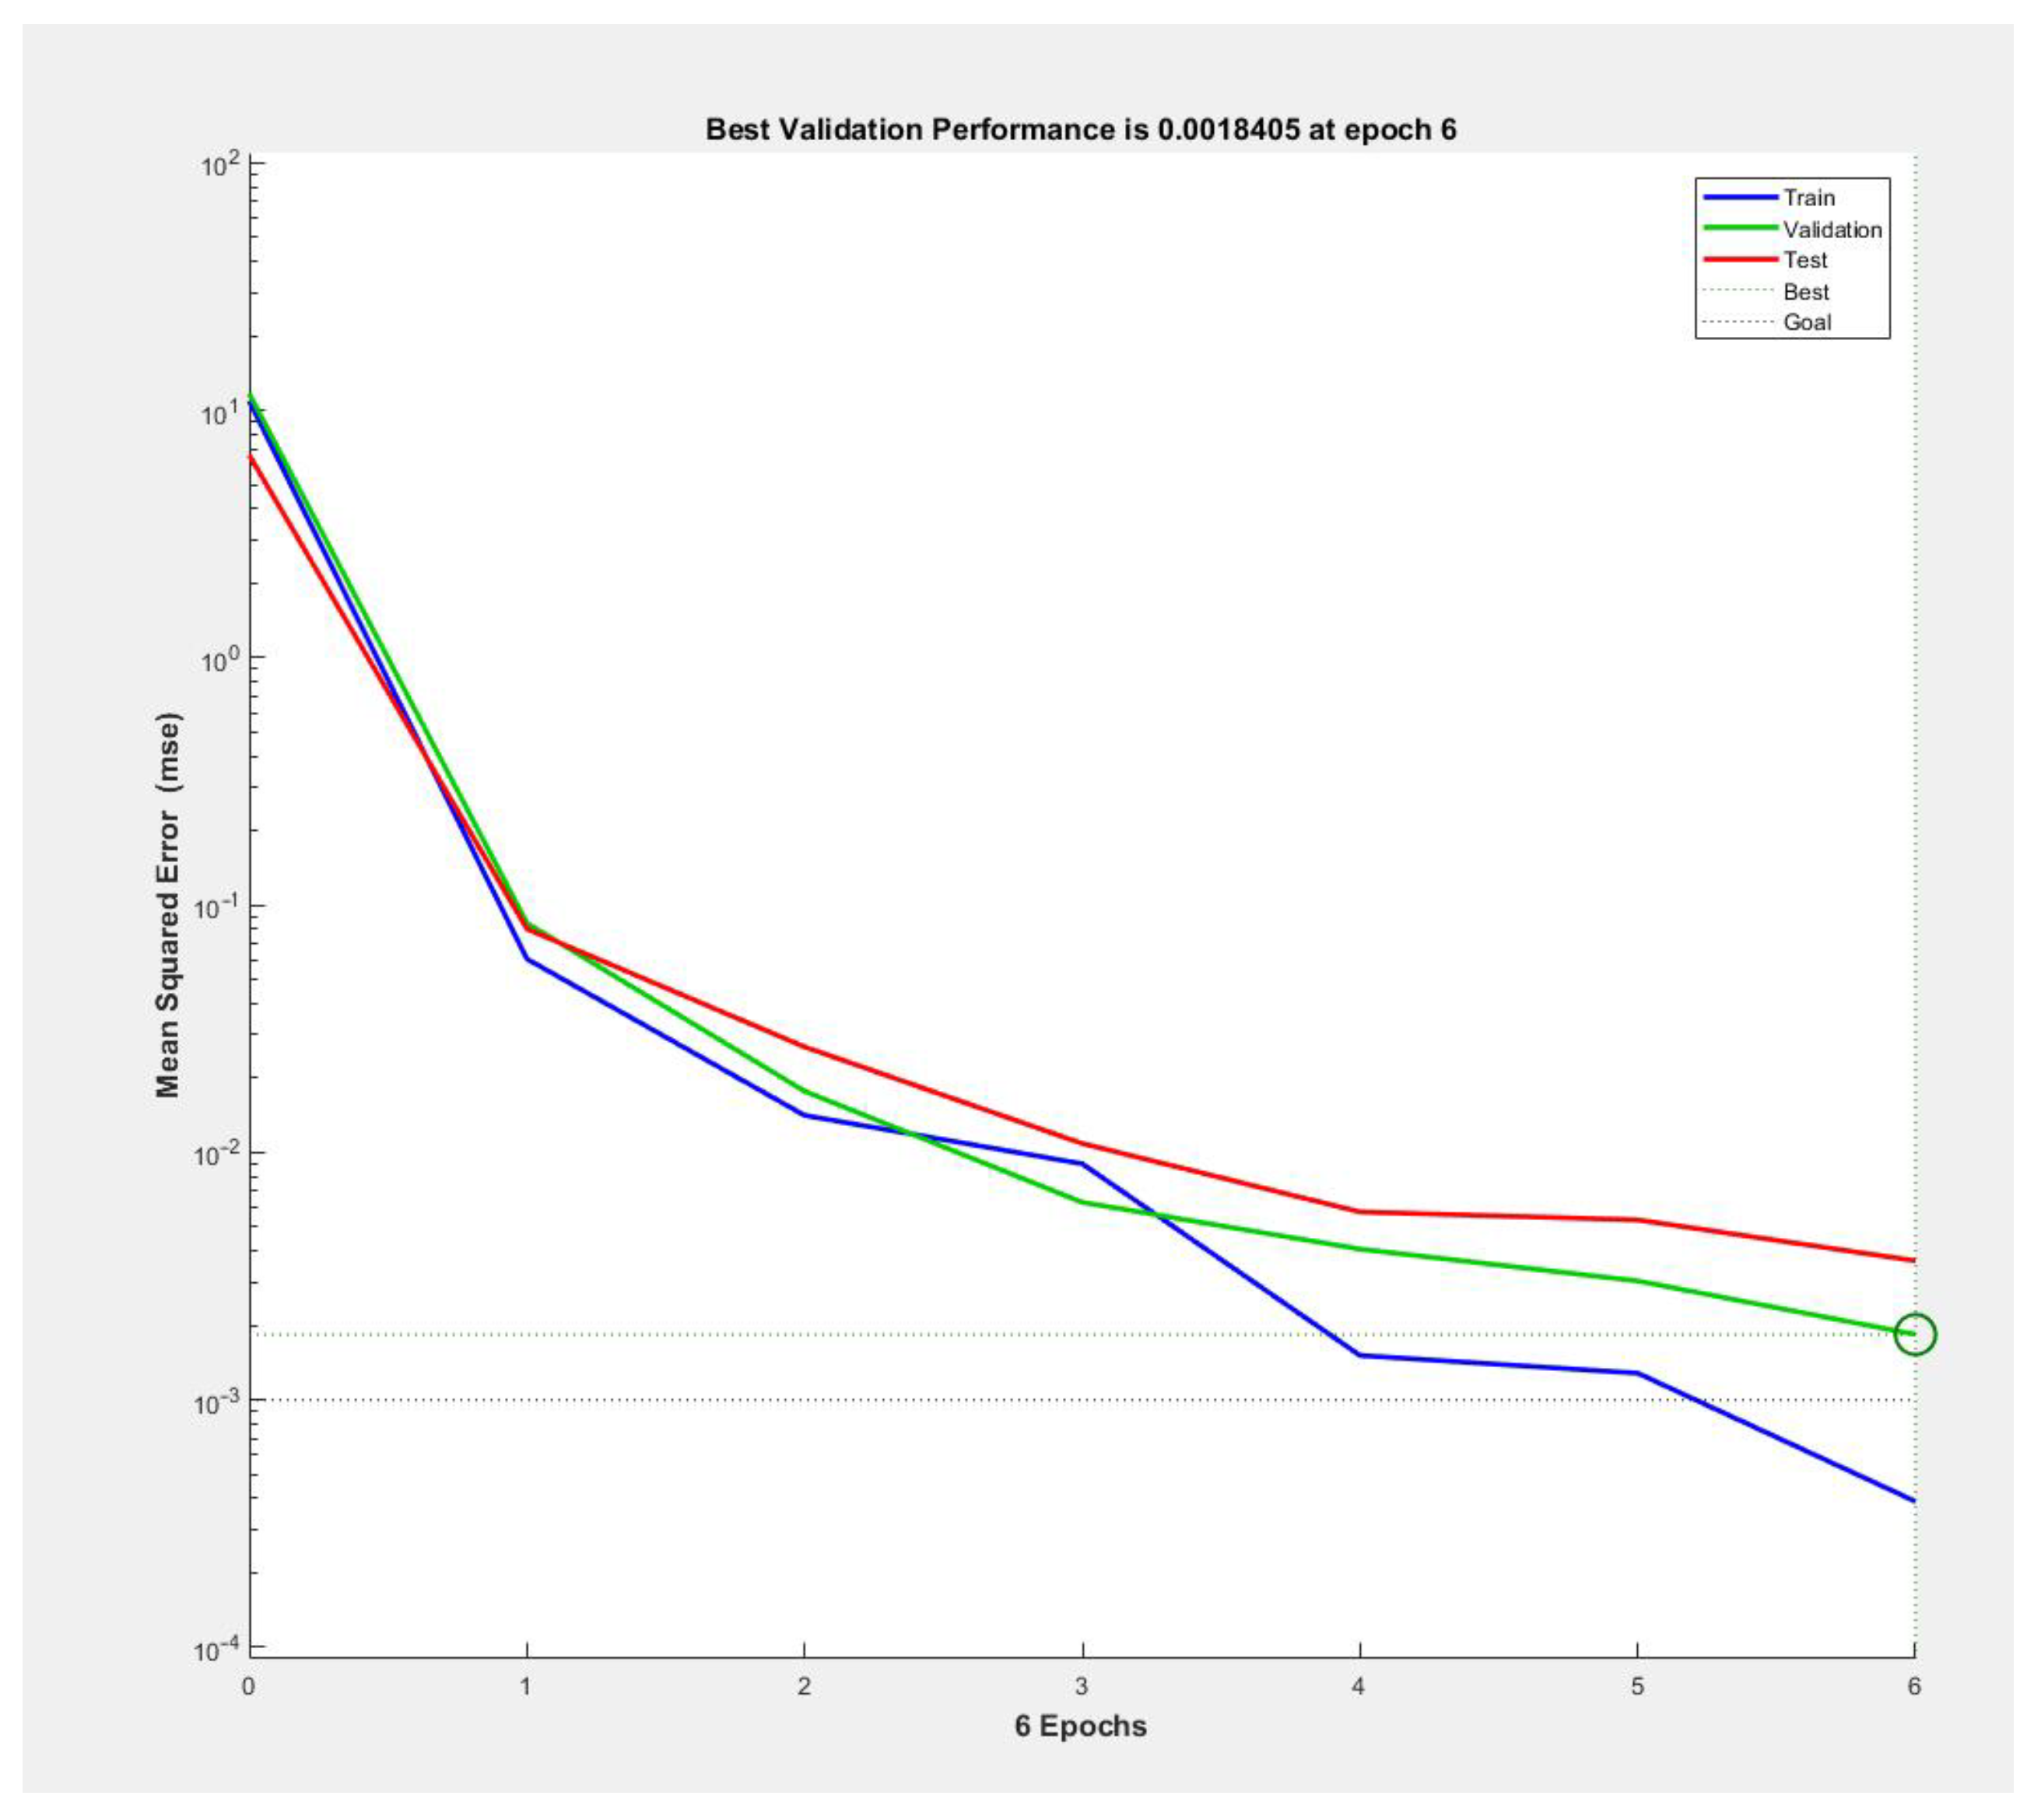
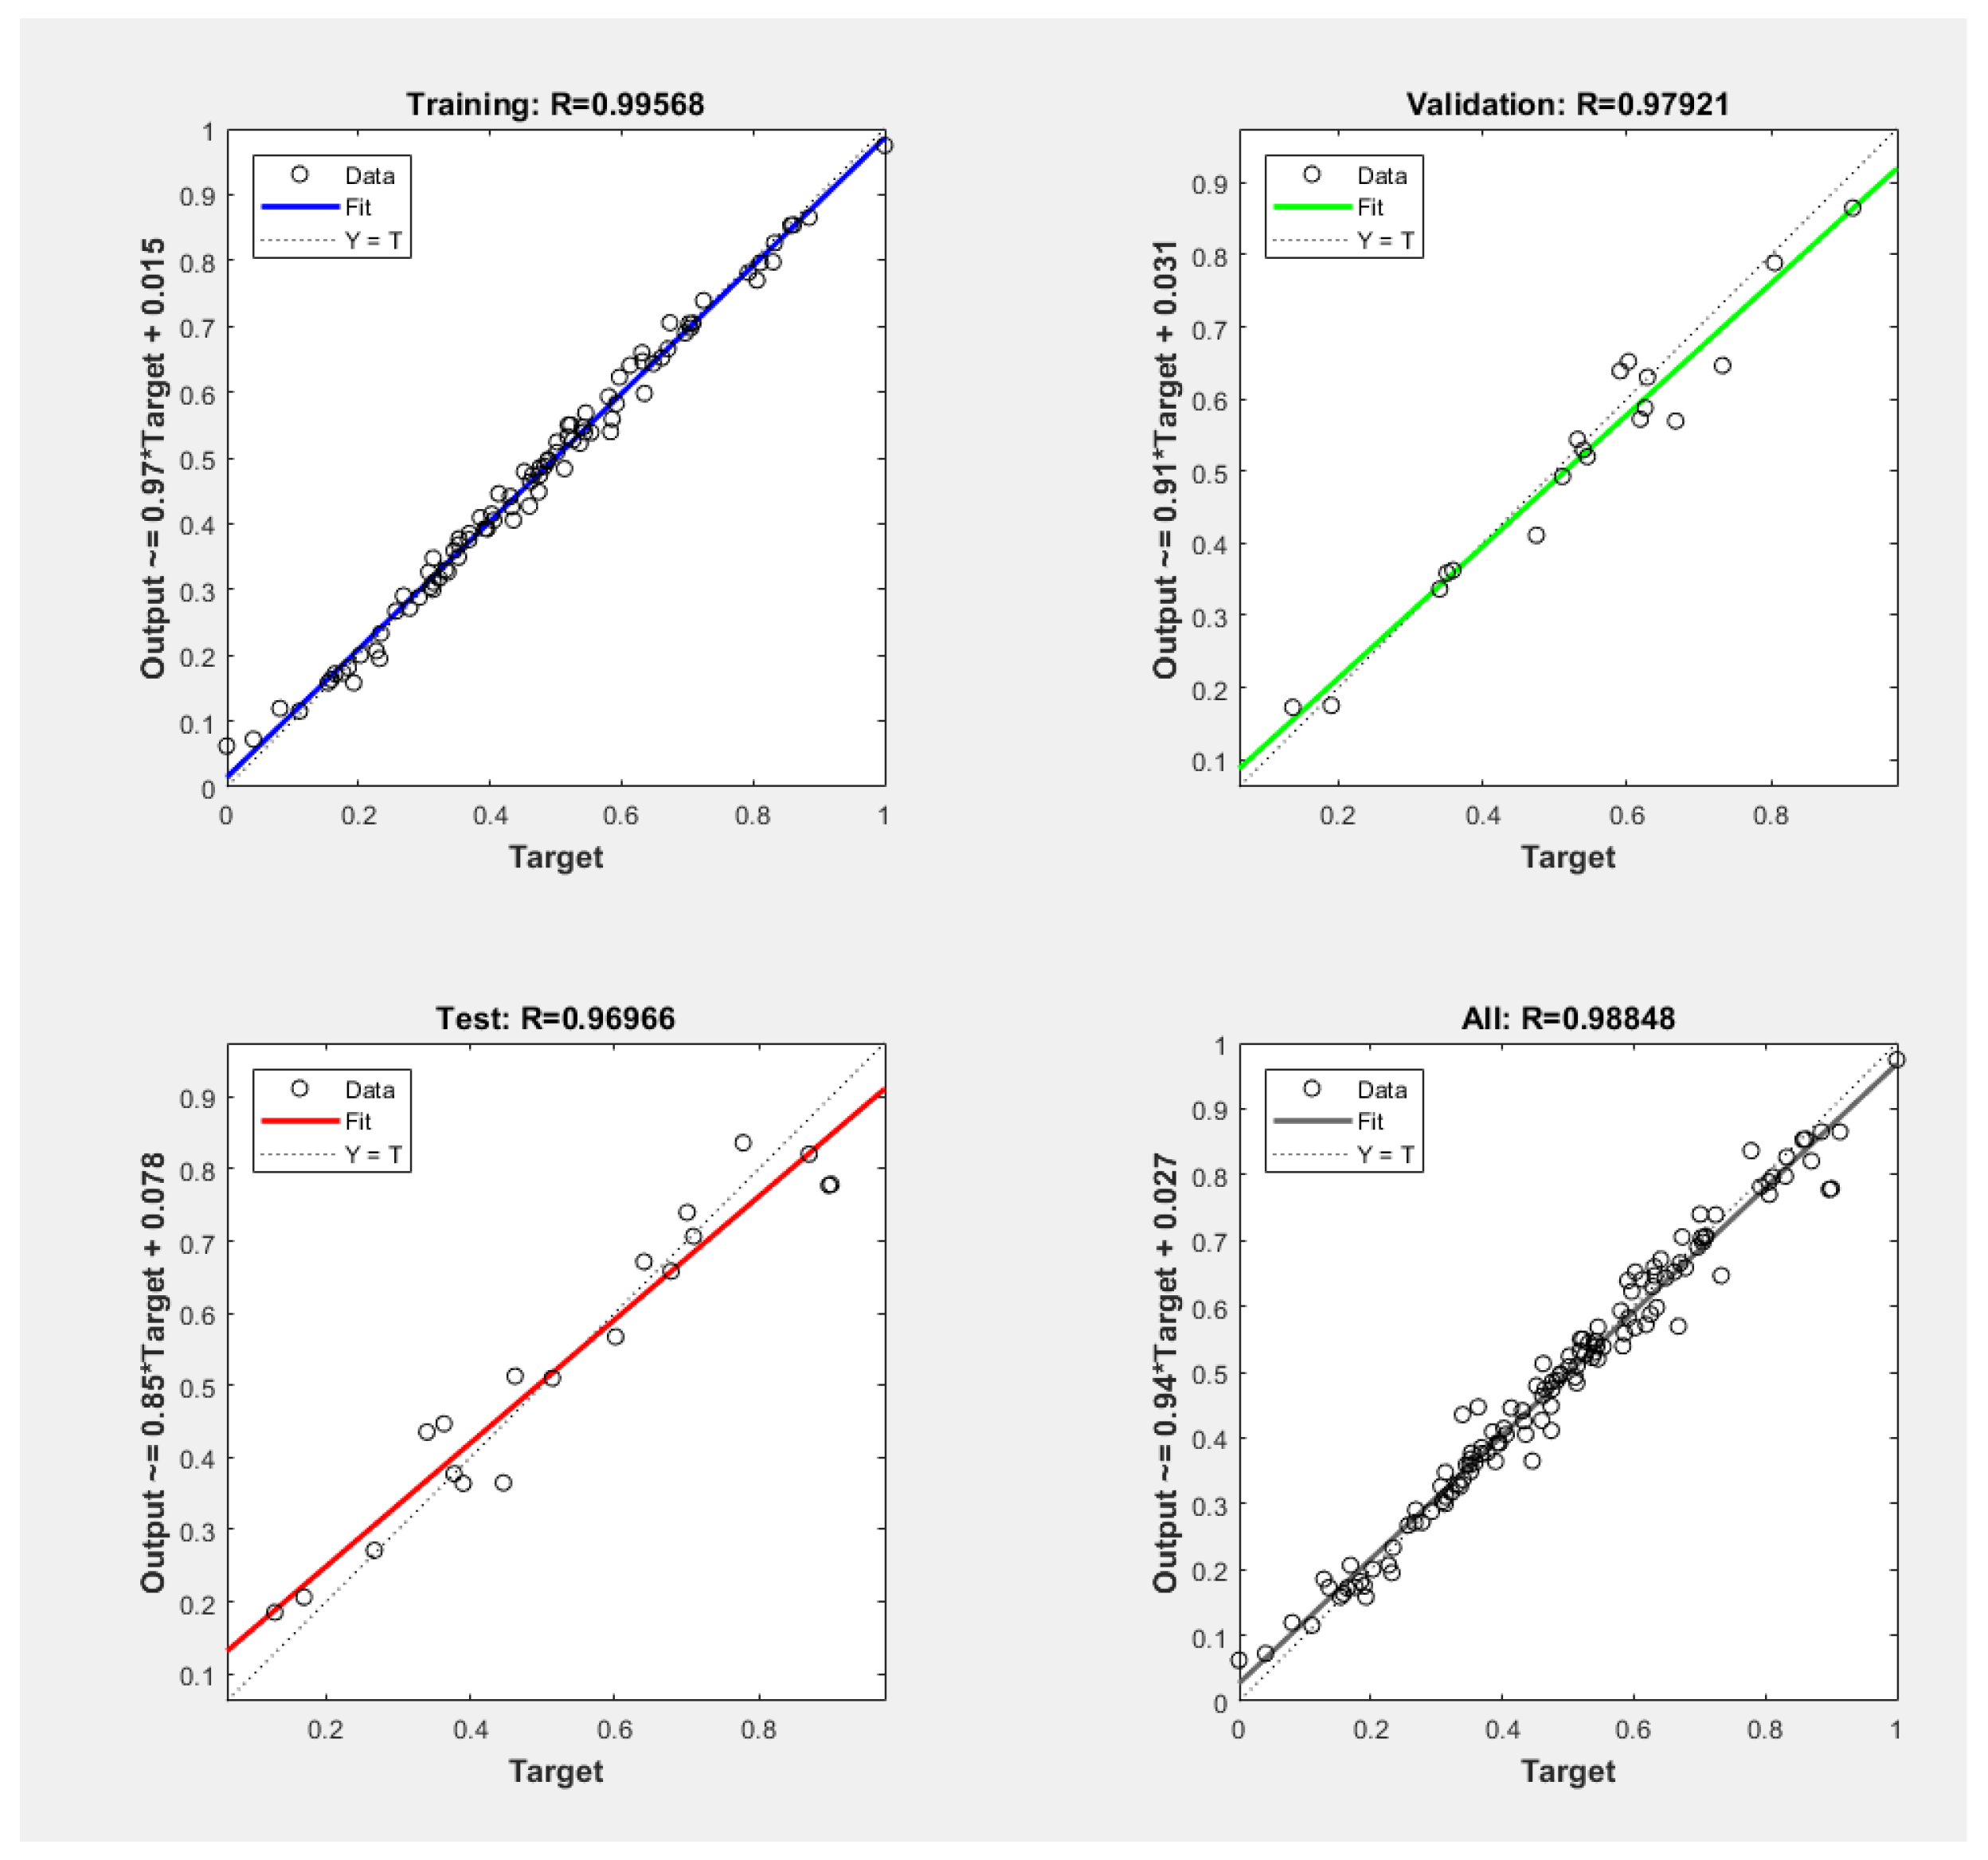
2.4. Evaluation of Greenway Alignment Suitability Based on PSO-BP Neural Network Model

BP neural network is a feedforward network by error back-propagation algorithm proposed by Rumelhart and McCelland [48], which regulates parameters by the feedback effect of error self-correction and continuously adjusts the weights and thresholds under the back-propagation effect to finally obtain a prediction model with the minimum sum of squared errors. The use of neural network algorithms to explore data laws has become a trend in urban research and is widely used in the fields of geological hazard prediction [49], biological yield estimation [50], and material quality assessment [51], the use in the direction of landscape gardening is still rare.
BP neural networks can analyze the relationship between input and output layers in an integrated manner, and can analyze the implied connections between elements with maximum rationality and accuracy in the face of nonlinearity. Although it has the advantages of high accuracy and high realism, BP neural network also has the problems of poor training effect due to the difficulty of network structure and parameter setting; slow learning convergence speed and easy to fall into local extremes.
The PSO particle swarm optimization algorithm is a new intelligent algorithm proposed with reference to the predatory behavior of birds. Each problem solution is considered as a bird in the search space, called a “particle”, and each particle has a fitness value determined by the optimized function, and then the optimal solution is found by multiple iterations. In each iteration, the particle continuously updates its position and velocity through the two extremes of the individual and population optimal solutions until the optimal solution is found [52].
A large number of studies have demonstrated that the introduction of the PSO algorithm for parameter search can help improve the situation that BP neural networks fall into local extremes when finding the optimal parameters, and also help improve the comprehensive performance of the algorithm [53,54]. In this research, the BP neural network input-hidden-output structure is firstly constructed and the PSO algorithm is applied for iterative optimization search. After finding the sequence of optimal values, it is substituted into the BP neural network, and the backward error is calculated for the training samples, and the weights and thresholds are continuously optimized until the optimal solution is found, and the urban greenway alignment suitability evaluation model is output for subsequent research sample evaluation.
The reasonableness of training samples is closely related to the accuracy of neural network models, and the appropriate number of samples and diverse sample types are the keys to the improvement of the generalization ability of the model. According to Widrow’s thumb rule, it is known that the network error is less than 10% when the number of training samples is 10 times the number of weights of the neural network. Therefore, to ensure the accuracy of the neural network model, this paper uses the information from field research and open platform crawling in the study area as the data for this experiment, and after interviewing with greenway planners and designers, a total of 172 groups of sample information containing various types of urban greenways such as water-dependent, mountain-dependent, road network-dependent, and composite greenways, involving 17 indexes and a total of 2924 data were selected. And 20 experts and practitioners in landscape architecture, urban and rural planning and other related fields were invited to evaluate the construction suitability of the 172 samples and determine the training sample score.
The structure of BP neural network is three layers of input-hidden-output, and there is no unified standard for the selection of the number of hidden layers, but according to the literature, it is known that the neural network with three-layer structure can realize the construction of nonlinear continuous functions with high accuracy, and too many hidden layers will instead increase the complexity of the network and reduce the convergence speed. Therefore, the number of hidden layer layers is determined to be 1 in this study.
In this paper, the trial-and-error method is used to determine the number of nodes in the hidden layer of the model, and the range of the number of hidden nodes is determined by referring to the empirical formula (see Equation (2)), where X denotes the number of input neurons, Y denotes the number of output neurons, and a is a constant between 0 and 10. The optimal value of the number of hidden neurons in this paper is finally determined to be 14 through several model training and debugging.
Z = X + Y + a
Combining the open source code of BP neural network and PSO particle swarm optimization, a PSO-BP neural network model was constructed on the Matlab data processing platform, and 172 sets of sample data were substituted into the model for training. To ensure the stability and generalization ability of the evaluation model, 70% of the data were randomly selected as training samples and 30% as validation and testing samples.
As can be seen from the convergence of network training, the number of network iterations training up to 6 times, the changes in the validation set and the test machine tend to be consistent, and the error gradually stabilizes, at which time the validation error is 0.0018405 (as shown in Figure 4).
According to the training results of the network, the correlation coefficient R values of the training set, validation set, test set and integrated sample set are 0.99568, 0.97921, 0.96966 and 0.98848. The fitting of the integrated sample shows that the training result of the network model is excellent and the accuracy of the model is 96% (Figure 5). The model can be applied to subsequent greenway alignment suitability evaluation studies.

3. Results

3.1. Analysis of Factors Influencing Greenway Alignment Selection

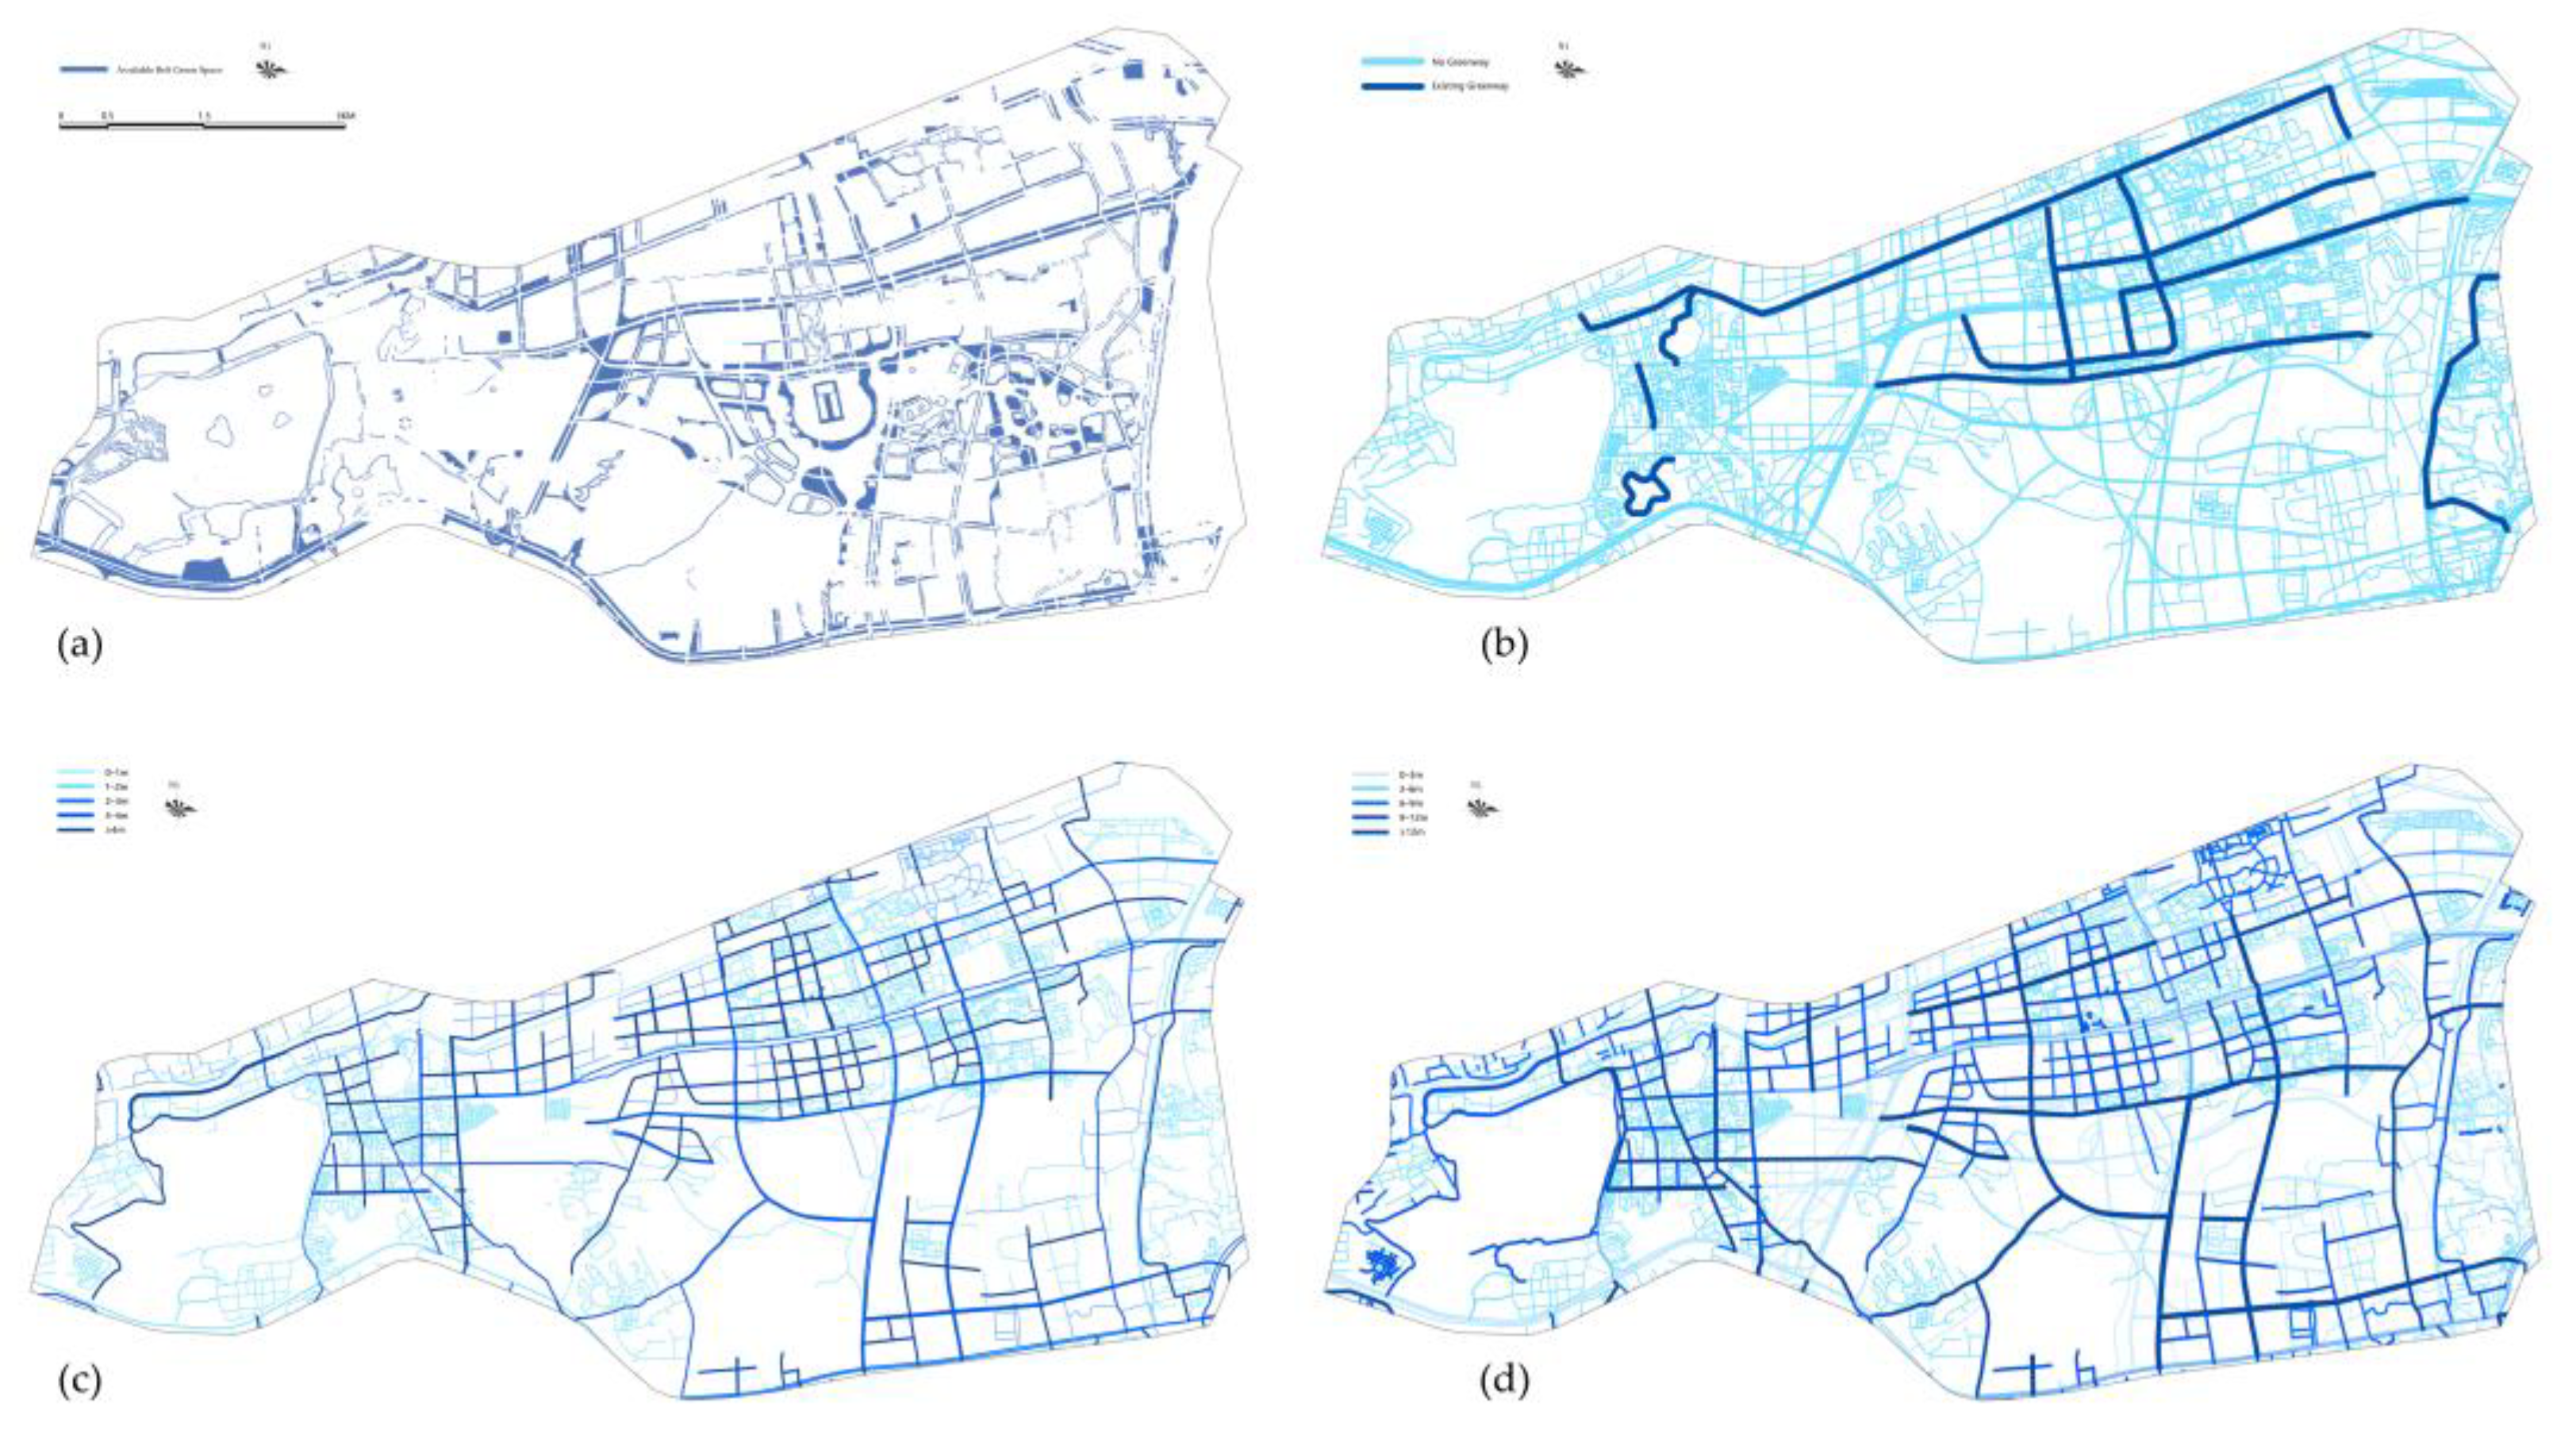
3.1.1. Analysis of Spatial Constructive Route Selection Factor

According to the planning information provided by the government, the spatial constructiveness of regional greenways was analyzed on four levels based on OSM road network data, the current land use map and the current situation of green space distribution from the average width of available strip green space, available existing greenways, the average width of both sides of the road that can be widened into greenways, and the average width of non-motorized roads and sidewalks (Figure 6).
The study area is rich in available strip green space, with the widest strip green space distributed along West Wenyi Road and West Wenyi Road (40–45 m). The area west of Chengdong Road near Nanhu is densely built up, and the width of the strip green space is narrower (5–10 m). The current greenway in the region is mainly concentrated in Yuhangtang River, Wenyi West Road and Wenyi West Road, and the overall east-west greenway is not well connected, and there are breakpoints. Both sides of the road can be widened to the average width of the greenway, i.e., the total width from the edge of the sidewalk to the street building of the road section that can borrow the greenery on both sides of the road to build the greenway. Yuhangtang River and Chengdong Road have a wide range of buildable areas. The width available for widening in most areas is 1–3 m. The widest average width of non-motorized roads and sidewalks in the region is around the South Lake and the wetland of Mengxi Water Township (>12 m), which can effectively promote the transformation of greenway space.

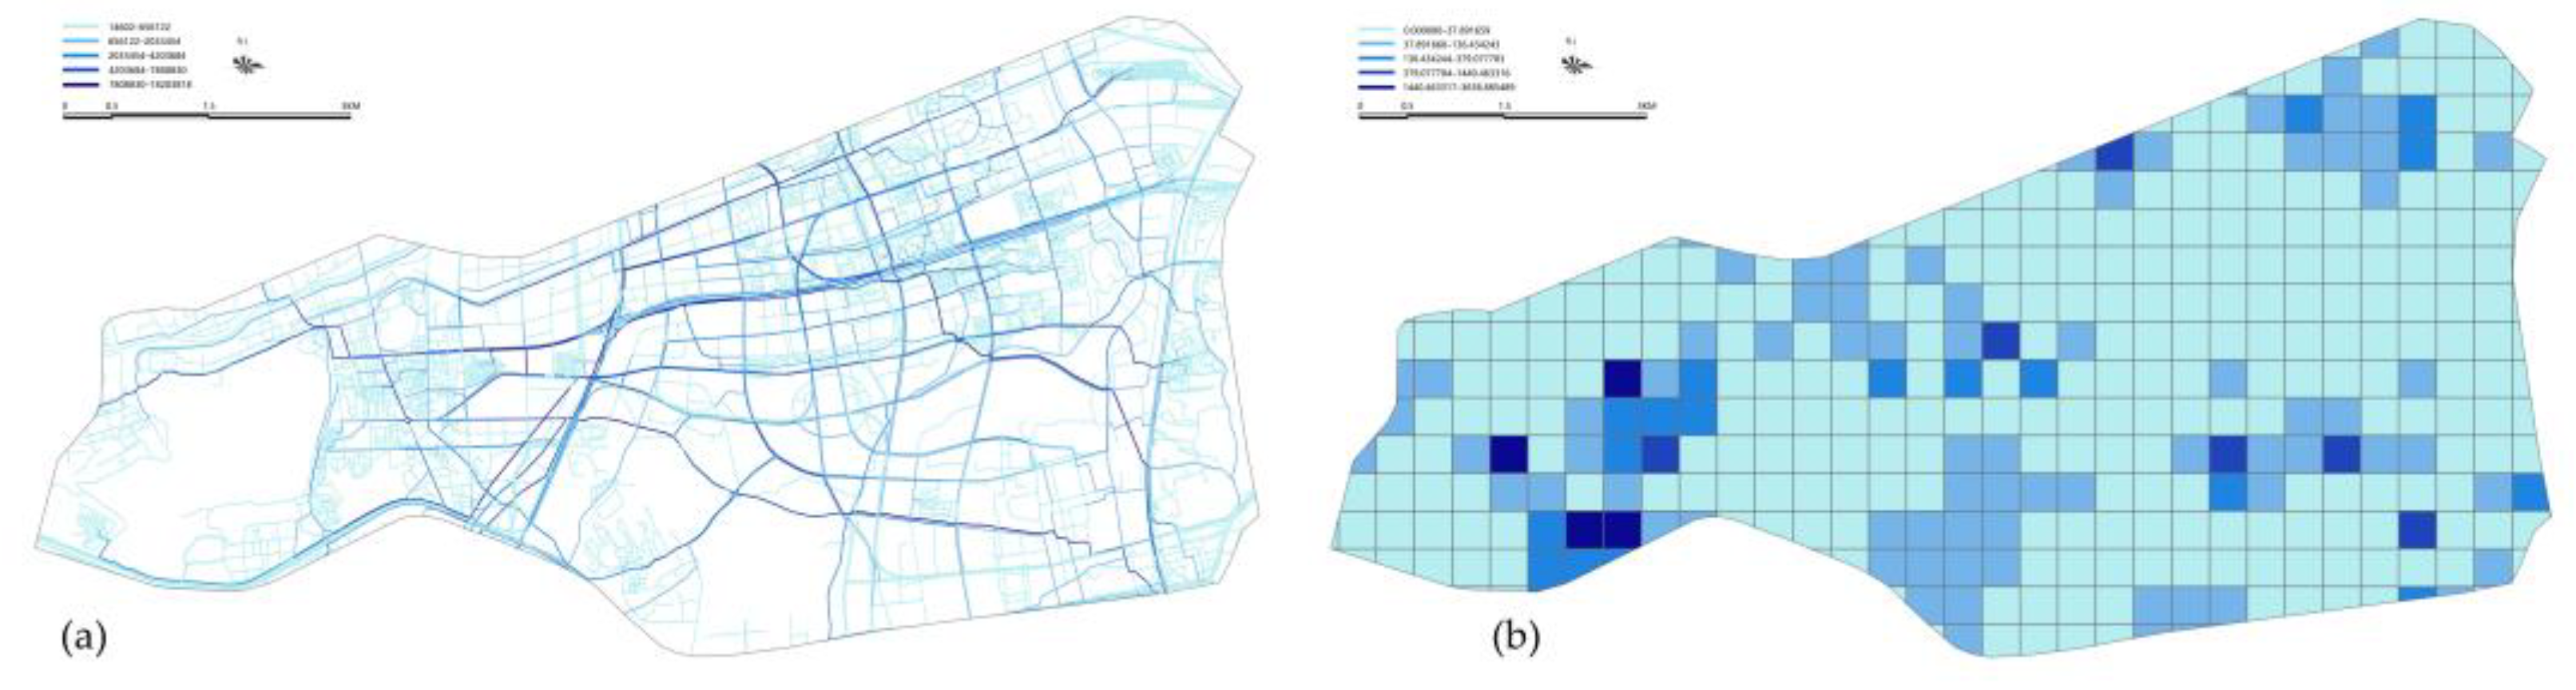
3.1.2. Analysis of Greenway Accessibility Route Selection Factors

The study combining OSM road network data and bus stop distribution data to analyze street walkability and traffic accessibility (Figure 7). Influenced by the surrounding residential areas, the study area with strong pedestrian accessibility is the section along Wenyi West Road and Yuhangtang River. Bus stops are concentrated in the Phoenix Hill community and around the Future Science and Technology City, so the two places have better bus accessibility and are conducive to interchange connections.
Meanwhile, two other aspects that affect greenway accessibility are mainline continuity (the crosstalk between the planned greenway and the existing greenway) and systemic (the number of breakpoints to be crossed by the greenway). These two types of data cannot be obtained by mere calculation and need to be analyzed in conjunction with the planned greenways. Therefore, these two types of indicators are considered as influencing factors for the manual correction of the planned greenway. Mainline continuity is a positive indicator, the higher the tandem of the planned greenway and the existing greenway, the more suitable the greenway route is for construction. Systematicity is a negative indicator, the higher the number of breakpoints to be crossed by the planned greenway, the lower the suitability of the greenway route.

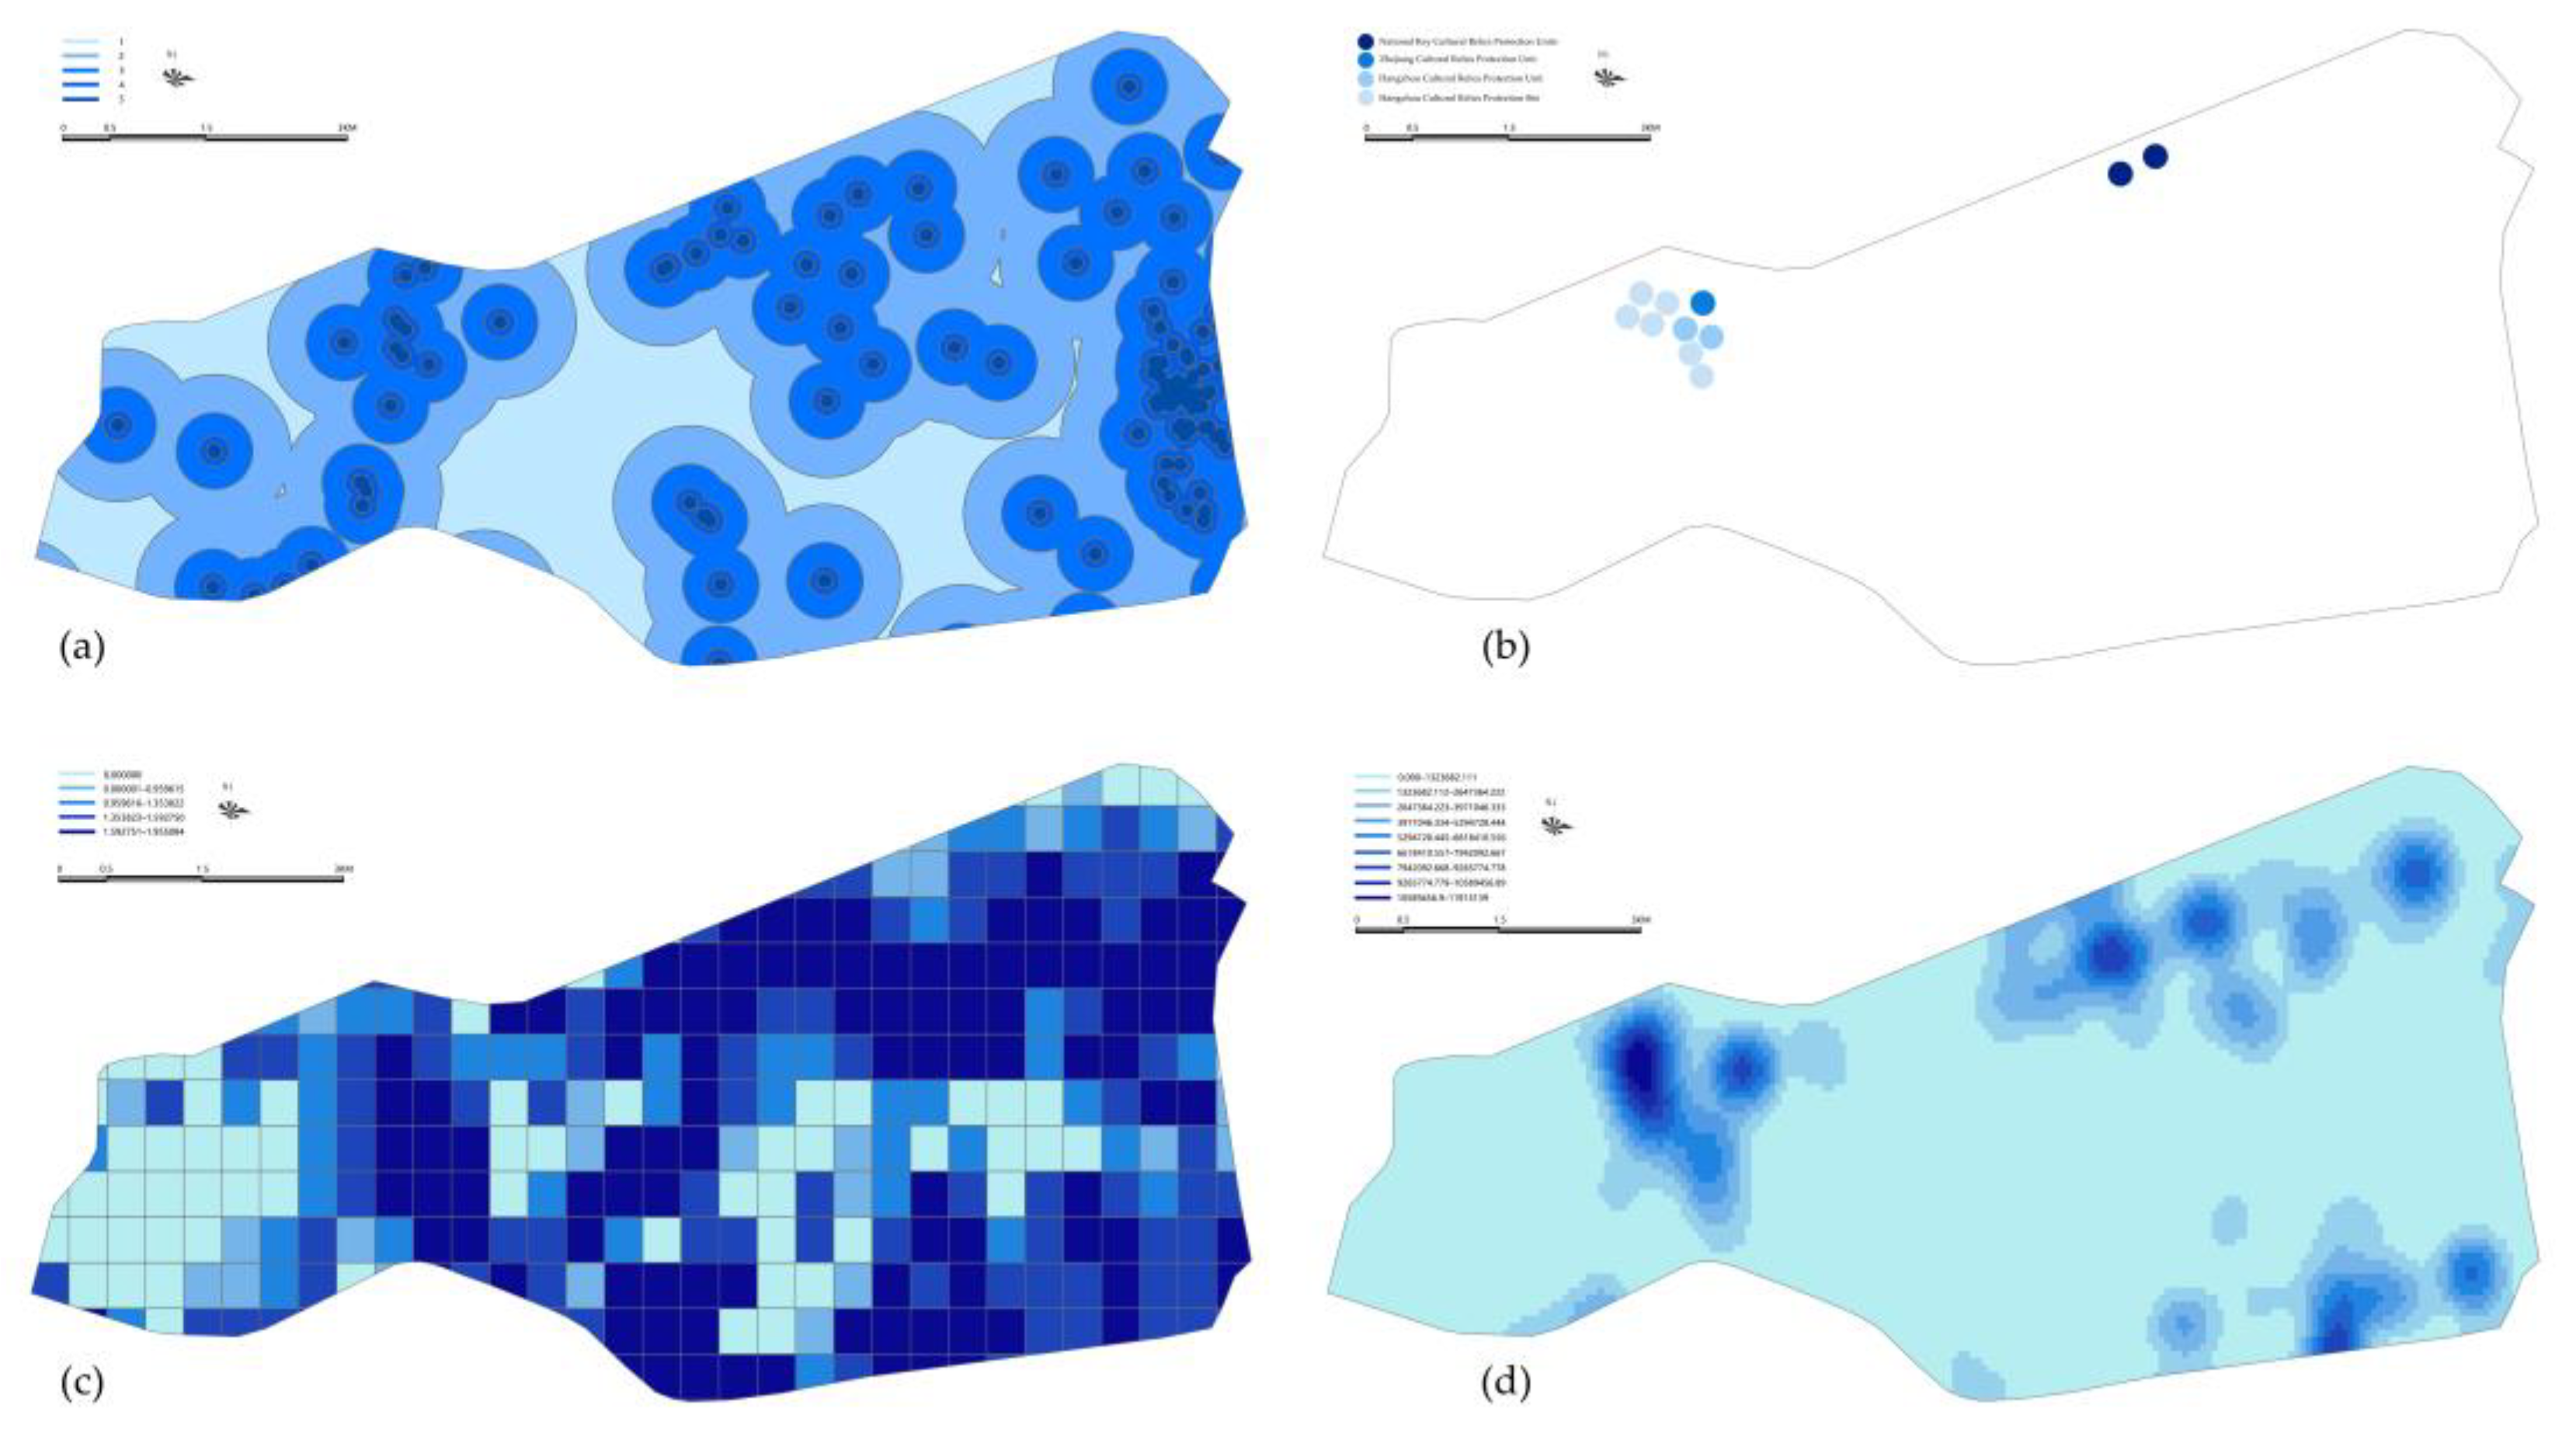
3.1.3. Analysis of the Resource Attractiveness Route Selection Factors

Based on the POI data, historical and cultural resources distribution map, the study area was analyzed for the articulation of tourist attractions, historical and humanistic resources level, diversity of points of interest and density of surrounding commercial-type points of interest (Figure 8). The region is rich in natural resources and there are many options for excursions. According to the planning information provided by the government, it is known that the three parts of the region with better scenic resources are South Lake, Mengxi Waterfront Wetland and Xixi Wetland. There are 13 cultural relics protection units (points) at all levels in the study area, including: 2 national cultural protection units, 1 provincial cultural protection unit, 2 municipal-level cultural protection units and 6 municipal-level cultural protection points. The distribution location of historical and cultural resources is mainly concentrated around Yuhangtang River and Tashan Park. The high mixture of points of interest in the area provides visitors with a variety of recreational tour options. Commercial points of interest are mainly concentrated around Future Science and Technology City and Tower Hill Park.
In addition, the green view rate is also an important factor affecting the suitability of greenway planning. The higher the green aspect ratio, the more beautiful the view people can enjoy. Because of the excessive amount of work involved in the study area, the green aspect ratio was used as an important step in the later manual correction of the preferred route.

3.1.4. Analysis of the Public Demand Route Selection Factors

Population vitality, economic vitality, public cycling preference, and running preference in the study area were analyzed based on NPP/VIRS nighttime lighting data, Meituan merchant business hours data, Strava sports software cycling preference data, and Keep sports software running preference data (Figure 9). The nighttime lighting data shows that the population in the study area is mainly concentrated in the Future Science and Technology City and the South Lake area. The high economic vitality along Yuhangtang Road, Wenyi West Road, Shishan Road and Fenghuang Mountain Road reflects the high potential of regional construction. Study area has a large public demand for cycling along Wen Er Xi Road and Phoenix Hill Road. And the road sections with greater public preference for running are along the South Lake Loop and Yuhangtang River.

3.1.5. Preliminary Determination of Greenway Routes through Comprehensive Analysis

Based on the above 14 data sets, the above data were aggregated by means of layer overlay and manually corrected by combining 3 types of data, namely mainline continuity, systemic and green view rate, to obtain 4 preliminary screening lines for the suitability of greenway selection from Xixi Wetland to South Lake section (Figure 10).

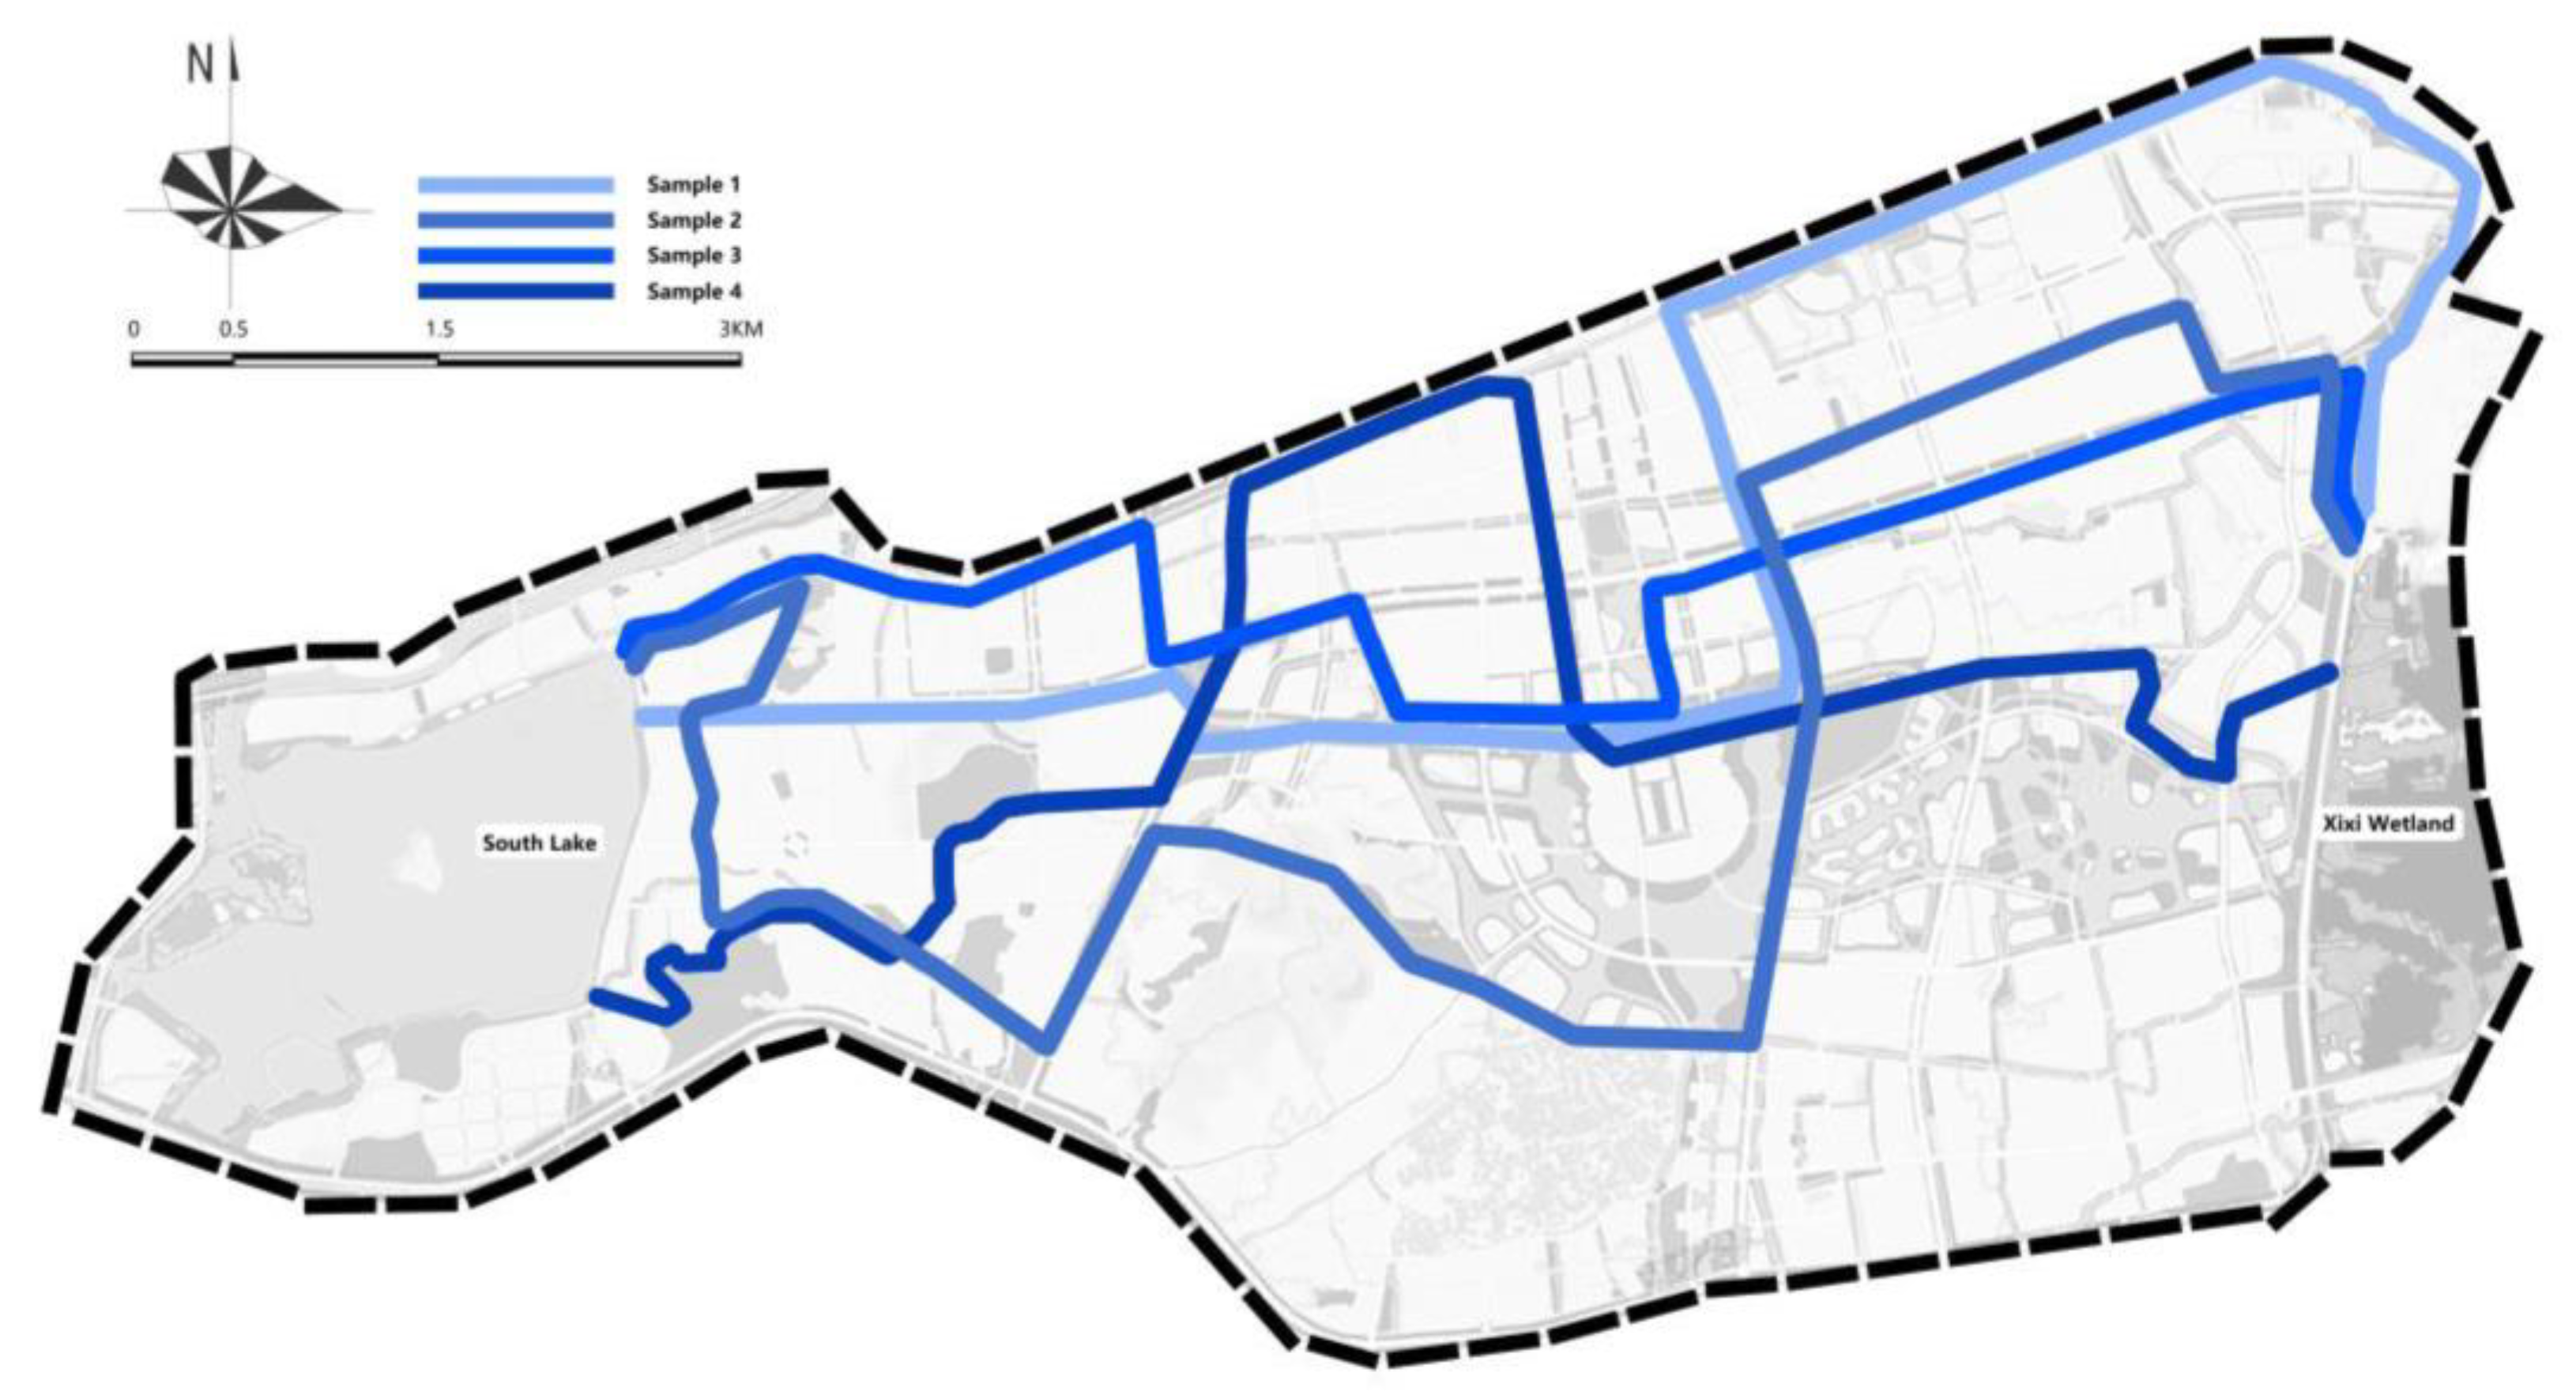
3.2. Greenway Route Comparison

The suitability prediction analysis of the four study samples using the PSO-BP model constructed above yielded the highest suitability for sample three, as shown in Table 4.
Based on the results, Sample 3 has the highest overall value and is the optimal greenway route plan for the wetland–lake chain section. The recommended greenway route starts from the Guangfu Temple entrance of the Xixi Wetland, follows the green space of Visiting Stream Road to Wenyi West Road, and turns westward to Yuhang Central Park by relying on the original Wenyi West Road greenway. And then southward along Chuangming Road to Gexiang Road, westward along Wenyi Road greenway to Zhumiao Port turn to Wenyi West Road. Then travel along Wenyi West Road to Jinxing Second Road, along the roadside green belt of Jinxing Second Road to Yuhangtang River, relying on the original Yuhangtang River greenway across Tongji Road to South Lake. The program line mainly relies on the river construction, the total length of 14.820 km, including relying on the original greenway (Wenyi West Road Greenway 3.500 km, Wenyi Road Greenway 1.626 km, Zhu Miao Port Greenway 1.000 km, Yuhang Tang River Waterfront Park Greenway 3.509 km) a total length of 9.625 km. The greenway path Xixi Wetland, Yuhang Central Park, Mengxi Water Township Wetland, Tower Hill Park, South Lake Park, with beautiful scenery and outstanding ecological landscape features of the lake chain.

4. Discussion

4.1. Implications for Urban Greenway Alignments Development

(1) Making the most of existing conditions helps the economy of greenway construction.From the research results, the spatial constructive factors are closely related to the suitability of greenway construction. Among them, the width of the directly available strip green space and the length of the existing greenway are the key indicators affecting the economy and implementation ability of greenway construction, and their addition to the effect of greenway construction should not be neglected. High-density built-up areas should fully rely on the existing greenway resources of the site, according to local conditions, save investment, improve the efficiency of land use and enhance the rationality of construction.
(2) Enhanced accessibility helps improve greenway utilization. According to the survey, the main line of greenway continuity, systemic aspect, walking, and accessibility of transportation facilities affect its frequency of use. On the basis of the construction of existing greenways in the region, the connection between greenways should be strengthened to improve the overall access efficiency. The planning line and the connection of the surrounding transportation facilities should be considered to create a convenient and accessible, comfortable green line open space.
(3) Increased resource attractiveness helps boost greenway impact. The survey results indicate that both landscape and recreational resources have a positive attraction effect on greenways. In the planning of greenway routes, emphasis should be placed on the cascading of attractions and the coverage of multiple points of interest to enhance the comprehensive attractiveness of greenways and give full play to their social and cultural functions.
(4) Greenway construction should focus on the diversified needs of the public. Under different construction environments, a comprehensive understanding of user needs can add rationality to greenway route planning and help enhance the utilization rate of greenways. According to the analysis of the results, public running and cycling demand is an important factor influencing user satisfaction, and the design of the route should focus on examining the degree of demand of its sports and fitness functions.

4.2. Comparison of Traditional Index Evaluation Method and BP Model Evaluation

This paper introduces multi-source urban big data to sort out public demand for travel, running and cycling, and combines new technologies such as GIS spatial analysis and image semantic recognition to process data information, which helps scientific and refined analysis of the influencing factors of greenway selection, and is a new exploration of landscape garden design in the context of digital development. On the basis of a clear evaluation system, the evaluation model is built by using BP neural network under PSO particle swarm optimization, which is a new practice of machine learning algorithm in the field of greenway route selection suitability evaluation. It is more scientific, systematic and objective than the traditional hierarchical analysis method to obtain index weights and thus calculate suitability. However, the study is not purely data-supported and exists mainly in two aspects. One is that the data types obtained for indicators such as running preference data and cycling preference data are in the form of text or pictures, which cannot be directly implemented in GIS for layer overlay, so expert interviews and manual calibration were introduced to determine the routes during the initial screening of greenway routes. The second is that in the sample of BP neural network training model, the suitability of greenway route construction needs to be determined by expert scoring, which will affect the planning of greenway routes to some extent and reduce the observability of the study. How to reduce the subjectivity in the selection of greenway routes is a problem that needs to be studied in depth in the future.

4.3. Evaluation Systems Need to Be Adapted to Local Conditions

This study is based on the common problems of urban greenway planning, but there are development differences in different countries, and issues such as land use and future development direction are also factors that cannot be ignored in the planning of route selection. Therefore, the suitability evaluation system of greenway selection should still be appropriately adjusted according to the characteristics of each region in specific practice. The results of this study need to be verified and refined by future research.

5. Conclusions

This study combines urban development needs and people’s demands, draws on domestic and international greenway planning and route selection methods, and explores the suitability evaluation method of urban greenway route selection by using literature research method, field survey method, web open big data crawling method, GIS spatial analysis method, and BP neural network method under PSO particle swarm optimization as a guide.
The key factors influencing the selection of urban greenways from the perspective of landscape garden planning are clarified, and the key factors influencing the evaluation of the suitability of urban greenway selection in a high-density built-up environment are clarified. With the assistance of SPSS technology, based on the principles of urban greenway selection, four levels of urban greenway selection suitability evaluation: spatial constructiveness, greenway accessibility, resource attractiveness, and public demand were determined to achieve optimal screening of each index. An evaluation system for the suitability of urban greenway selection was constructed to provide a scientific basis for the planning and selection of greenways in high-density built-up areas of similar cities.
Based on this evaluation model, multi-source data and new technological methods are used to quantify the suitability of each element and construct a research data set. On the basis of this evaluation system and data set, 172 sets of sample data were randomly divided into two parts of 70% training samples and 30% validation and test samples with the support of MATLAB data processing platform, and substituted into the BP neural network under PSO particle swarm optimization for training. The results show that the validation and test set curves converge after 6 iterations of the urban greenway route selection model network, and the best validation error is 0.0018405. It is known that this model has 96% accuracy through the fitting of the integrated samples, and the model prediction has high stability and accuracy.
From the perspective of landscape garden planning, four samples of greenway alignment selection in the study area were selected for simulation and suitability assessment, and the prediction results showed that the suitability of sample 1 was 2.7304, sample 2 was 2.5079, sample 3 was 2.9913, and sample 4 was 2.6950. Finally, the best selection of greenway from Xixi Wetland to South Lake is the planning line of Sample 3, which starts from the entrance of Guangfu Temple in Xixi Wetland, relying on the green belt on the road side of Visiting Creek Road, the green belt on the road side of Wenyi West Road, the green belt on the road side of Chuangming Road, the green belt on the road side of Wenyi Road, the green belt on the road side of Jinsing II Road and the green belt of Yuhangtang River to South Lake.

Author Contributions

Conceptualization, J.L. and X.W.; Data curation, J.L.; Formal analysis, J.L.; Investigation, J.L.; Methodology, J.L. and X.W.; Supervision, X.W.; Visualization, J.L.; Writing—original draft, J.L.; Writing—review & editing, J.L. and X.W. All authors have read and agreed to the published version of the manuscript.

Funding

This research received no external funding.

Institutional Review Board Statement

Not applicable.

Informed Consent Statement

Not applicable.

Data Availability Statement

The data presented in this study are available on request from the corresponding author.

Conflicts of Interest

The authors declare no conflict of interest.

References

  1. Fang, H.; Xiu, S. Practice and Consideration of Landscape Architecture Discipline on City Chief Designer System in the New Era. J. Chin. Landsc. Arch. 2021, 37, 13–17. [Google Scholar]
  2. Zhang, Y.; Ong, G.X.; Jin, Z.; Seah, C.M.; Chua, T.S. The effects of urban greenway environment on recreational activities in tropical high-density Singapore: A computer vision approach. Urb. For. Urb. Green. 2022, 75, 127678. [Google Scholar] [CrossRef]
  3. Xie, B.; Yi, L.; Zheng, Y. Casual evaluation of the effects of a large-scale greenway intervention on physical and mental health: A natural experimental study in China. J. Urb. For Urb. Green. 2022, 67, 127419. [Google Scholar] [CrossRef]
  4. Xu, B.; Shi, Q.; Zhang, Y. Evaluation of the Health Promotion Capabilities of Greenway Trails: A Case Study in Hangzhou, China. J. Landsc. 2022, 11, 547. [Google Scholar] [CrossRef]
  5. Huang, R.; Tian, Q.; Zhang, Y.; Wu, Y.; Li, Z.; Tang, Z.; Zhou, A. Response of Leaf Functional Traits of Landscape Plants to Urban Green Space Environment in Lanzhou, China. J. For. 2022, 13, 682. [Google Scholar] [CrossRef]
  6. Zhao, Z.; Gan, H.; Qian, X.; Leng, J.; Wang, Y.; Wu, P. Riverside Greenway in Urban Environment: Residents’ Perception and Use of Greenways along the Huangpu River in Shanghai, China. J. Int. J. Environ. Res. Public Health 2021, 18, 1120. [Google Scholar] [CrossRef] [PubMed]
  7. He, L.; AN, Y. Study on Urban Greenway Improvement Strategies from the Perspective of Landscape Justice. J. Landsc. Res. 2021, 13, 1–3. [Google Scholar]
  8. Chen, L.Y.; Tan, S.H.; Yang, C.; He, Q.X. Research on the Evaluation of Urban Greenway Environmental Recreation Satisfaction from the Perspective of Perceived Value: A Case Study of Jiulongpo Greenway in Chongqing. J. Chin. Landsc. Arch. 2022, 38, 76–81. [Google Scholar]
  9. Ding, C.; Ma, J.; Zhu, N. Research on Comprehensive Evaluation of Urban Greenway Based on AHP. J. For. Eng. 2020, 36, 81–90. [Google Scholar]
  10. Liu, W.H.; Yu, R.H. Regional Greenway Planning Practice and Innovative Exploration from the Perspective of Territorial Space Governance: A Case Study on Chengdu Tianfu Greenway Qihe Greenbelt. J. Urb. Rural Plan. 2021, 13, 91–98. [Google Scholar]
  11. Kun, L. Study on the Planning and Construction Strategies of Greenways in Metropolitan Areas: A Case Study of Greenways in Xuhui District, Shanghai. J. Urb. Plan. Forum 2018, 62, 77–85. [Google Scholar]
  12. Li, F.; Zhang, Y.; Li, X. Discussion on Urban Greenway System Construction Methods and Theories Based on Landscape Resources Protection—With Lengshuijiang Greenway Planning as the Example. J. Chin. Landsc. Arch. 2014, 30, 51–54. [Google Scholar]
  13. Yang, M.; Shi, H.C.; Xu, W. A Research on Waterfront Greenways Route Selection in Wuhan East Lake Based on the GIS Technology. J. Arch. Cult. 2015, 12, 174–175. [Google Scholar]
  14. Carlier, J.; Moran, J.; Aughney, T.; Roche, N. Effects of greenway development on functional connectivity for bats. J. Glob. Ecol. Conserv. 2019, 18, 613. [Google Scholar] [CrossRef]
  15. Dong, X.; Liang, Y.; Hou, B.; Chen, L. Research on Greenway Route Selection Method of Urban Agglomeration Based on Resource and Environment Assessment System: Taking Beijing-tianjin-hebei Urban Agglomeration as An Example. J. Urb. Dev. Stud. 2021, 28, 118–127. [Google Scholar]
  16. Li, F.Z.; Li, W.Y.; Li, X. Research on Urban Planning based on Big Data of Bus Smart Card. J. Urb. Dev. Stud. 2015, 22, 27–32. [Google Scholar]
  17. Xiaohui, W. Study of urban greenway selection methods. J. Arch. Des. Manag. 2016, 33, 40–46. [Google Scholar]
  18. Shen, Y.; Huang, M. Research on Fujian Province Greenway Nets Planning System in Provincial Level. J. Northwest. For. Univ. 2014, 29, 227–230. [Google Scholar]
  19. Wang, X.; Wang, Y. Thoughts on Beijing Greenway Network. J. Northwest. For. Univ. 2012, 27, 194–200. [Google Scholar]
  20. Mengting, X.; Wenhui, X. Research on Rural Greenway Planning Based on the Multifunctional Collaborative Evaluation Model. J. Chin. Landsc. Arch. 2021, 37, 86–91. [Google Scholar]
  21. Melicher, J.; Špulerová, J. Application of Landscape-Ecological Approach for Greenways Planning in Rural Agricultural Landscape. J. Environ. 2022, 9, 30. [Google Scholar] [CrossRef]
  22. Li, F.; Ma, X. Study on Plan of Rural Waterfront Greenway in Beijing Based On Valley Economy. J. IOP Conf. Ser. Earth Environ. Sci. 2018, 108, 042121. [Google Scholar]
  23. Wang, Y.; Duan, M.J.; Wang, Q.; Xie, J.F.; Yang, C. Ecological health care effect of healthy greenways in urban community belt parks. J. Landsc. Ecol. Eng. 2022, 18, 247–262. [Google Scholar] [CrossRef]
  24. Ryan, R. Selected Papers from the 6th Fábos Conference on Landscape and Greenway Planning: Adapting to Expanding and Contracting Cities ed. By Richard Smardon (review). J. Landsc. J. Des. Plan. Manag. Land 2022, 40, 115–118. [Google Scholar] [CrossRef]
  25. Chen, X.; Li, L.; Li, T.; Lu, Y. Study of Urban Greenway Planning Based on Multi-source Data Analysis of Spatial Potential and Users Behaviors—The Greenway Route Planning of Haidian District, Beijing. J. Landsc. Arch. Front. 2019, 7, 50–65. [Google Scholar] [CrossRef]
  26. Tang, Z.; Ye, Y.; Jiang, Z.; Fu, C.W.; Huang, R.; Yao, D. A Data-Informed Analytical Approach to Human-Scale Greenway Planning: Integrating Multi-Sourced Urban Data with Machine Learning Algorithms. J. Urb. For. Urb. Green. 2020, 56, 126871. [Google Scholar] [CrossRef]
  27. Hunter, R.F.; Adlakha, D.; Cardwell, C.; Cupples, M.E.; Donnelly, M.; Ellis, G.; Gough, A.; Hutchinson, G.; Kearney, T.; Longo, A.; et al. Investigating the physical activity, health, wellbeing, social and environmental effects of a new urban greenway: A natural experiment (the PARC study). J. Int. J. Behav. Nutr. Phys. Act. 2021, 18, 142. [Google Scholar] [CrossRef]
  28. Balbi, M.; Croci, S.; Petit, E.J.; Butet, A.; Georges, R.; Madec, L.; Caudal, J.; Ernoult, A. Least-cost path analysis for urban greenways planning: A test with moths and birds across two habitats and two cities. J. Appl. Ecol. 2020, 58, 632–643. [Google Scholar] [CrossRef]
  29. Kamrowskazaluska, D. Impact of AI-Based Tools and Urban Big Data Analytics on the Design and Planning of Cities. J. Land 2021, 10, 1209. [Google Scholar] [CrossRef]
  30. Zacharias, J. Addressing Global Climate Change with Big Data-Driven Urban Planning Policy. J. Int. J. E-Plan. Res. 2021, 10, 1–16. [Google Scholar] [CrossRef]
  31. Wang, B.; Xu, D. Evaluation of the Suitability of Recreational Greenway Selection Based on Urban Road: Case Study of Jishou Old City. J. Jishou Univ. 2020, 41, 90–96. [Google Scholar]
  32. Ye, Y.; Huang, R.; Zhang, L.Z. Human-centered urban design supported by multi-source data and deep learning: An example of urban greenway planning on both sides of Suzhou River in Shanghai. J. Landsc. Arch. 2021, 28, 39–45. [Google Scholar]
  33. Li, H. Analysis on Greenway Route Selection Method of Mesoscale Region Based on Multi-objective Perspective: A Case of Fengxian District of Shanghai. J. Shanghai Urb. Plan. Rev. 2019, 29, 84–89. [Google Scholar]
  34. Miller, W.; Collins, M.G.; Steiner, F.R.; Cook, E. An approach for greenway suitability analysis. J. Landsc. Urb. Plan. 1998, 42, 91–105. [Google Scholar] [CrossRef]
  35. Conine, A.; Xiang, W.; Young, J.; Whitley, D. Planning for multi-purpose greenways in Concord, North Carolina. J. Landsc. Urb. Plan. 2004, 68, 271–287. [Google Scholar] [CrossRef]
  36. Linehan, J.; Gross, M.; Finn, J. Greenway planning: Developing a landscape ecological network approach. J. Landsc. Urban Plan. 1995, 33, 179–193. [Google Scholar] [CrossRef]
  37. Hoşgör, Z.; Yigiter, R. Greenway Planning Context in Istanbul-Halic: A Compulsory Intervention into the Historical Green Corridors of Golden Horn. J. Landsc. Res. 2011, 36, 341–361. [Google Scholar] [CrossRef]
  38. Liu, Y.X.; Gu, Y.; Hu, Y.K. Evaluation and Guidance and Control Strategy for Community Greenway Route Selection from the Perspective of Environmental Justice. J. Landsc. Des. 2021, 20, 30–35. [Google Scholar]
  39. Song, X.; Tao, Y.; Pan, J.; Xiao, Y. A Comparison of Analytical Methods for Urban Street Network: Taking Space Syntax, sDNA and UNA as Example. J. Urban Plan. Forum 2020, 64, 19–24. [Google Scholar]
  40. Chen, P.Y.; Hong, L.P.; Jie, Q.; Ji, G. Application of Space Syntax Sdna IN Small Town Urban Design: Taking Nanjing Guli New Town as an Example. J. Dev. Small Cities Towns 2022, 40, 87–98. [Google Scholar]
  41. Badrinarayanan, V.; Kendall, A.; Cipolla, R. SegNet: A Deep Convolutional Encoder-Decoder Architecture for Image Segmentation. J. IEEE Trans. Pattern Anal. 2017, 39, 2481–2495. [Google Scholar] [CrossRef] [PubMed]
  42. Ye, Y.; Zhang, L.Z.; Yan, W.T.; Zeng, W. Measuring Street Greening Quality from Humanistic Perspective: A Large-scale Analysis Based on Baidu Street View Images and Machine Learning Algorithms. J. Landsc. Arch. 2018, 25, 24–29. [Google Scholar]
  43. Zhong, T.; Lü, G.; Zhong, X.; Tang, H.M.; Ye, Y. Measuring Human-Scale Living Convenience through Multi-Sourced Urban Data and a Geodesign Approach: Buildings as Analytical Units. J. Sustain. Basel 2020, 12, 4712. [Google Scholar] [CrossRef]
  44. Zhi, Q.; Chen, J.; Fu, Y.; Guo, B. The Multi-Center Spatial Structure in the Guangdong-Hong Kong-Macao Greater Bay Area Urban Agglomeration Based on Luojia1-01 Nighttime Light Data and POI Data. J. Singap. J. Trop. Geogr. 2022, 42, 444–456. [Google Scholar]
  45. Li, F.; Yan, Q.; Zou, Y.; Liu, B. Extraction Accuracy of Urban Built-up Area Based on Nighttime Light Data and POI: A Case Study of Luojia 1-01 and NPP/VIIRS Nighttime Light Images. J. Geo. Inf. Sci. Wuhan Univ. 2021, 46, 825–835. [Google Scholar]
  46. Wang, X.; Ning, X.; Zhang, H.; Wang, H.; Hao, M. Population spatialization by integrating LJ1-01nighttime light and Wechat positioning data——taking Beijing city as an example. J. Sci. Surv. Mapp. 2022, 47, 173–183. [Google Scholar]
  47. Sun, Y. Research on Characteristics of Urban High Frequency Cycling Route and Design Strategy Based on Open Data; Harbin Institute of Technology: Harbin, China, 2021. [Google Scholar]
  48. Rumelhart, D.E.; Hinton, G.E.; Williams, R.J. Learning representations by back-propagating errors. J. Nat. 1986, 323, 533–536. [Google Scholar] [CrossRef]
  49. Wei, M.K.; Hu, X.B.; Yuan, H.X. Residual displacement estimation of the bilinear SDOF systems under the near-fault ground motions using the BP neural network. J. Adv. Struct. Eng. 2022, 25, 552–571. [Google Scholar] [CrossRef]
  50. Cui, R.; Liu, Y.; Fu, J. Estimation of winter wheat biomass using visible spectral and BPbased artificial netural networks. J. Spectrosc. Spectr. Anal. 2015, 35, 2596–2601. [Google Scholar]
  51. Liang, M.F.; Hu, C.J.; Yu, R.; Wang, L.X.; Zhao, B.F.; Xu, Z.Y. Optimization of the Process Parameters of Fully Mechanized Top-Coal Caving in Thick-Seam Coal Using BP Neural Networks. J. Sustain. 2022, 14, 1340. [Google Scholar] [CrossRef]
  52. Li, S.J.; Fan, Z.Y. Evaluation of urban green space landscape planning scheme based on PSO-BP neural network model. J. Alex. Eng. J. 2022, 61, 7141–7153. [Google Scholar] [CrossRef]
  53. Li, H.Y.; Li, X.H.; Zhao, D. PSO-BP Neural Network Grade Prediction Model Based on Bagging Ensemble Learning. J. Phys. Conf. Ser. 2018, 1069, 012103. [Google Scholar] [CrossRef]
  54. Li, M.; Hao, H.; Zhang, A.M.; Song, Y.; Liu, Z.; Zhang, X. Modeling of mechanical properties of as-cast Mg-Li-Al alloys based on PSO-BP algorithm. J. China Foundry 2012, 9, 119–124. [Google Scholar]
Figure 1. Study area scope.
Sustainability 14 12382 g001
Figure 2. Current status of built greenways.
Sustainability 14 12382 g002
Figure 3. Urban greenway alignment suitability evaluation index system.
Sustainability 14 12382 g003
Figure 4. Best validation error curve.
Sustainability 14 12382 g004
Figure 5. Model training predictive correlation regression.
Sustainability 14 12382 g005
Figure 6. Spatial constructive route selection influence factor analysis. Usable strip green space (a). Existing greenway available (b). Average width of both sides of road that can be widened into a greenway (c). Average width of nonmotorized lanes and sidewalks (d).
Sustainability 14 12382 g006
Figure 7. Greenway accessibility route selection influence factor analysis. Walkability (a). Accessibility of transportation facilities (b).
Sustainability 14 12382 g007
Figure 8. Attractive distribution of resources route selection influence factor analysis. Tourist attraction articulation (a). Historical and humanistic resource grade (b). Point-of-interest diversity (c). Density of surrounding commercial type points of interest (d).
Sustainability 14 12382 g008
Figure 9. Public demand route selection influence factor analysis. Population vitality (a). Economic vitality (b). Public riding demand (c). Public running demand (d).
Sustainability 14 12382 g009
Figure 10. Sample greenway illustration of the wetland–lake chain section.
Sustainability 14 12382 g010
Table 1. Summary of factors influencing the selection of urban greenways.
Name of Impact FactorFactor PropertiesFrequency of Occurrence/%
WalkabilityAccessibility10.10
Accessibility of transportation facilitiesAccessibility8.08
Area building densityPublic Demand6.06
Regional population densityPublic Demand6.06
Regional Economic DynamicsPublic Demand3.03
Riding NeedsPublic Demand2.02
Running NeedsPublic Demand1.01
SystematicSpatially constructive3.03
Regional ribbon green space widthSpatially constructive5.05
Both sides of the road can be widened to the width of the greenerySpatially constructive5.05
Width of sidewalks and non-motorized pathsSpatially constructive4.04
Green VisionResource attractiveness8.08
Natural Resource AreaResource attractiveness2.02
Tourist attraction articulationResource attractiveness5.05
Historical and Humanistic Resources GradeResource attractiveness2.02
Human Resource Preservation DegreeResource attractiveness2.02
Diversity of points of interestResource attractiveness11.11
Density of surrounding commercial-type points of interestResource attractiveness6.06
Density of points of interest in the peripheral industry categoryResource attractiveness2.02
Density of points of interest in the surrounding public facilities categoryResource attractiveness3.03
Vegetation diversityResource attractiveness5.05
Table 2. Research main data and sources.
Data CategoryName of DataData TypeData Source
Planning data from the governmentYuhang District Greenway and Park Three-Year Action Plan (2022–2024)Text, imagesYuhang District Government Department
Yuhang District Land Use Status MapImage
Hangzhou 14th Five-Year Plan for Greenway Construction and DevelopmentText, images
Yuhang District Green Space System PlanningText, images
Yuhang District Cultural Relics Distribution StatusText, images
Open platform crawling dataYuhang bus stop distribution statusVectorHangzhou Open Data Platform
Road Network DataVectorOpen street map
POI DataVectorGaode Map
Nighttime lighting dataGridNPP/VIRS official website
Merchant hours of operation dataTextMeituan takeaway network
Riding path dataImageStrava Sports Recording Software
Running Preference DataImageKeep exercise recording software
Data obtained by manual researchStreet View Image DataImageField Research
Yuhang District Greenway StatusImageField Research
Table 3. Government planning data calculation methodology.
IndicatorsCalculation Method (Unit)
Average width of usable strip green spaceCalculation of the total area of strip green space involved in the planned route/total length of strip green space (m)
Length of existing greenway availableCalculation of the total length of planned routes that overlap with built greenways/total length of planned greenways (%)
Average width of both sides of road that can be widened into a greenwayCalculation of the total width of the sidewalk to the street building/section length (m) for the section of the planned greenway that needs to borrow the greenery on both sides of the road to build a greenway
Average width of nonmotorized lanes and sidewalksCalculation of the total width of the sidewalk and nonmotorized roadway/total length of the roadway (m) for the section of the planned greenway that needs to borrow sidewalk or nonmotorized roadway construction
Mainline continuityCalculation of the number of planned routes linked in tandem with established greenways in the study area/total number of established greenways in the region (%)
Systematic aspectCalculation of the number of breakpoints in the planned route that must be solved by bridging, borrowing, etc. (pcs)
Tourist attraction articulationCalculation of the number of natural and human attractions connected by the planned route (pcs)
Historical and Humanistic Resource GradeAccording to the national cultural preservation unit: 3 points, provincial cultural preservation unit: 2 points, municipal cultural preservation unit: 1 point, and municipal cultural preservation point: 0.5 points to calculate the planning line tandem of historical and humanistic resource comprehensive total score (points)
Table 4. Sample Prediction Results.
Sample 1Sample 2Sample 3Sample 4
score2.73042.50792.99132.6950
Publisher’s Note: MDPI stays neutral with regard to jurisdictional claims in published maps and institutional affiliations.

