Abstract
The development of tourism in historical villages has a certain impact on the native environment, which leads to visitors occupying community public spaces relatively frequently. The design of rural public spaces, especially in relation to the street network’s spatial configuration, significantly affects how villagers interact with one another. This research investigated the influence of street network space on the regional social interaction preferences of rural community populations by applying space syntax theory. Three typical villages in southern Anhui, China, were the subject of an observation analysis of social behaviors and pedestrian volumes on street networks. Using a segment model, it was possible to determine seven spatial configuration attributes of streets, including depth to the village entrance (DtoE), connectivity, curvature, the normalized angle choice (NACH) and integration (NAIN) with two radii. A considerable joint effect of street spatial type and spatial layout attributes on the regional social interaction preferences of rural community populations was found by MANOVA and stepwise regression analysis. The sampled community tends to engage in social activities in branch streets, and the pedestrian volume contained 67.1% of all the observed people in the street networks. Streets’ spatial attributes with lower NACH or NAIN levels (less usability or accessibility) and higher DtoE or curvature levels (more privacy or deformation) have greater influences on community pedestrian volumes. Regarding street type, the in-between space was found to have the most significant effect on the pedestrian volume of the branch streets, which are the preferred zones of community populations in the context of social activities.
1. Introduction
The preservation of historic heritage and the sustainable reorganization of tourist spaces has become a common agenda of urbanists [1,2,3]. However, there is also a glaringly evident conflict between the native environment and tourism development. In developing countries [4], especially in rural areas far away from cities, the original environment of many traditional villages has been damaged by extensive tourism development due to a lack of professional spatial planning for tourism and heritage protection funds. Due to the pressure of population growth and the pursuit of local economic goals, the tourist population often occupies the social activity space of the community population [5]. Therefore, analyzing the spatial factors affecting pedestrian preferences can help reveal the association between rural street networks and the social activities of communities and improve the sustainable reorganization of tourist spaces.
The term “street vitality” is generally used to represent the intensity of human activities in an urban street network, and the term is widely used in the field of urban spatial planning and design. As early as the beginning of the 20th century, several studies began emphasizing the importance of street vitality. Some scholars believe that in a vibrant street network, streets should adapt to each other in terms of length, functional mix, spatial layout, pedestrian volume and building density [6,7]. Other contemporary researchers have suggested that the factors affecting street vitality may include the detailed texture of street spaces, the humanity scale and street connectivity [8]. The impact of urban open space on street vitality from the perspective of social interaction has also been an active topic of research [9].
Currently, it is commonly known that a variety of elements can make people’s activities in urban street networks easier [10,11]. According to previous studies, the accessibility of street space is one of the key factors promoting pedestrian preference and social interactions [12,13,14]. Social activities are more likely to occur when street space is more accessible [15]. Moreover, the different spatial types of urban street networks play an important role in promoting social activities [16], and they are of important value in promoting outdoor activities for children and the elderly [17,18]. In addition, as the morphological attributes of street space [19], sidewalk width [20], landscape characteristics [21] and sight connection values [22] change, pedestrian preference related to the street network also changes.
Recently, further data have emerged suggesting that characteristics of spatial arrangement may also encourage social activities in urban street networks [23,24]. As a street’s spatial configuration attributes can provide a clear spatial positioning system for outdoor design factors, such as mini-squares, recreational fitness equipment and other supporting facilities, they can lead to necessary structural suggestions for the design of urban open spaces. Therefore, quantitative analyses of spatial configuration attributes can provide valuable guidance for urban designers aiming to improve the utilization of street networks. Space syntax has been widely used to quantitatively analyze the spatial characteristics of urban street networks [25,26]. In space syntax, a detailed city space can be shaped as an axis, and the morphological attributes of urban space can be analyzed mathematically [16]. In this context, some exploratory studies have revealed a relationship between the spatial configuration attributes of a given region and social interactions. Soares et al. researched the possible links between campus layout frameworks and social activities [27]. Can and Health found that in-between spaces are important for long-term activities and social behaviours [28]. Zerouati and Bellal took residential communities of different spatial types as examples to point out that social activities are related to spatial connectivity, finding that social interactions are significantly higher in the least-connected areas [29]. In addition to urban ground spaces, the development of tourism has also influenced the design of urban underground projects. With the improvement in the utilization of urban underground spaces, tourism promotes the optimization of the urban underground spaces’ layout while making use of this underground network’s spaces [30], thus reducing the carbon dioxide emissions of the city [31].
The pertinent research, however, mostly focuses on the general use of the urban network’s spaces. The association between spatial configuration attributes and social interactions in rural contexts remains in question. Moreover, relevant studies have not extended the relationship between urban open spaces and outdoor activities, especially the association between sustainable design and rural public space design embodied therein. Previous studies have shown that pedestrian preference is often positively correlated with the frequency of social activities [32,33,34]. Therefore, this study explored the connection between pedestrian volumes and the spatial configuration attributes of street networks to expose the social activities’ influencing variables in rural contexts. The method of measurement used for people’s social activities, pedestrian volumes and space syntax analysis is presented in Section 2. Section 3.1 and Section 3.2 investigate the distributions of social activities, pedestrian preferences and spatial attributes of street networks. In Section 3.3, variance analysis and regression analysis are used to show the association between street network spaces and residents’ social activities in tourist villages.
2. Methodology
2.1. Study Cases
This study was carried out in three tourist villages (Yuliang village, Tangyue village and Gaoyang village) in She County, southern Anhui, China (Figure 1). The three villages are distributed across different areas of She County with different environments: the village of Yuliang was founded in the Tang Dynasty, is located close to the Xin’an River and covers an area of approximately 8.2 hm2; the village of Tangyue was founded in the Southern Song Dynasty near the market center and covers an area of approximately 7.1 hm2; and the village of Gaoyang was founded in the Southern Tang Dynasty and is located in the mountainous part of northern She County, covering an area of approximately 6.3 hm2. The cases selected in this study are listed in Chinese Famous Towns and Villages in History and Culture, which is issued by the Ministry of Housing and Urban-Rural Development of the People’s Republic of China, and their native environments have been preserved relatively well. Moreover, the three villages are all tourist hot spots, with large numbers of historical heritage sites, and each exhibits an obvious phenomenon in which the tourist population occupies the social interaction spaces of the community population during holidays.
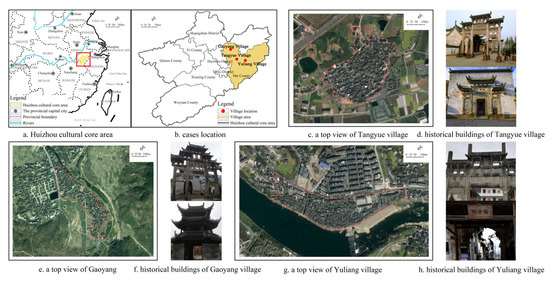
Figure 1.
Geographic areas, village plans and historical heritage sites of the studied villages.
2.2. Data Acquisition and Processing
With the rapid development of big data technology, numerous data acquisition and visualization methods have been applied to urban public space research [35,36,37]. Previous studies have shown that multisource big data analysis is usually relatively suitable for large-scale urban public space analysis at the macro level [38,39]. However, this approach requires networking through mobile devices, and many elderly people and children do not have access to mobile phones or computers. Moreover, some remote rural areas are not covered by the internet; thus, big data analyses fail to obtain detailed information on human activities in these areas. Therefore, traditional on-site observation is more suitable for studying human activities in microscale spaces such as rural villages. On-site observation method is frequently employed to assess people’s behavior in local public spaces in both urban and rural environments [40,41,42].
2.2.1. Observations of Social Interactions in the Street Networks of Villages
A snapshot observation is a space syntactic observation tool that is used to record the activities of stationary or moving people in a specified space [29]. This method can provide an understanding of such a space from the aspects of activity type, the distribution of people in space and the movement of people. The observed objects of this study were divided into three categories: children, adults and elderly people, and the observed people belonged to the community population. As the street networks of traditional villages are complicated, we selected some of them for observation. The observed social activities were divided into two categories: a personal group, which included talking, shopping and playing with ≤2 people, and a social group, which included the above activities with ≥3 people. These activities were recorded on an observation map. Each activity was replaced with a specific color, and different groups of people were replaced with different symbols. Each person was represented by a symbol, and the interactive groups were represented by lines. Each village was observed for 2 days, and each day was divided into two periods, namely, from 9 to 10 am and from 3 to 4 pm. The objective of the observation period was to determine the community populations’ preferred zones of social activity.
2.2.2. Measurements of the Pedestrian Volume in the Street Networks of Villages
In this study, the movements of the sampled community population were observed for one week, and each sample was observed for two days. The observation periods were 9 to 10 am, 1 to 2 pm and 4 to 5 pm. For safety reasons, observations were not made at night. To ensure the integrity and continuity of the data, the observation space we selected comprised combined spaces, namely, the streets, which included the main road leading outside the village, the branch streets, which connected the residential area to the main road, and the in-between spaces, which connected the houses to the branch streets. The observation site was the intersection of streets of different types, with a total of 10 observations.
Based on the observation method used, we measured the number of pedestrians passing through each intersection within a certain time period. The number of pedestrians at the intersections of the in-between spaces and branch streets was the second-order pedestrian volume (PV-II), and the number of pedestrians at the intersections of the branch streets and main roads was the first-order pedestrian volume (PV-I). Each person observed continuously for 5 min from one observation point and then moved to the next observation point until the observation round was completed. At the beginning of the next round of observation, each observer started from the final observation point of the last round in reverse order to reduce the statistical error caused by different observation sequences.
In the calculation, each observation point represented the pedestrian volume of the observation section. For example, the intersection of a section of branch streets and a section of a main road served as an observation point, and the observation value corresponding to this observation point represented the PV-I of this section. To facilitate statistical calculations, if multiple sections of branch streets intersected with a section of a main road, the average value of the multiple observation points was taken to represent the PV-I of this section. Therefore, in the street network, each observation point corresponded to the pedestrian volume of a certain section of a certain type of street. The average of the sum of the observed values of each section of a certain type was the total average pedestrian volume of that street type. According to the calculation, the average pedestrian volume of an observation point corresponding to one observation and the total average pedestrian volume of an observation point were obtained successively, as shown in Figure 2.
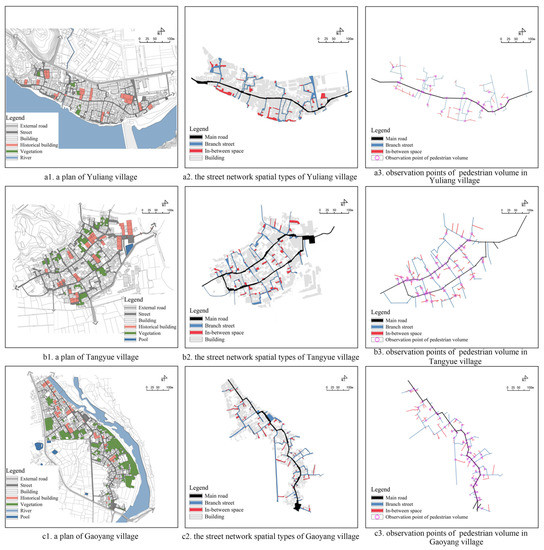
Figure 2.
Plans, street network spatial forms and observation points of the villages.
The formula is as follows
Equation (1) denotes the average pedestrian volume of one observation at an observation point, where i is a certain observation period, j is one observation in a certain observation period, k is a certain observation point, n is the number of observation points and pv is the sum of the pedestrian volume corresponding to an observation point.
Equation (2) represents the total average pedestrian volume at a certain observation point, where n1 is the observation period and n2 is the total number of observations within a certain observation period.
2.2.3. Spatial Configuration Attributes of the Street Networks of Villages
As a theoretical tool to analyze space, space syntax has both quantitative and qualitative advantages related to revealing the relationship between human behavior and the built environment [43]. In space syntax, the spatial structure of an actual street network can be represented by a “segment map”, so the quantitative measurement of the spatial configuration attributes of street networks can be realized through a segment model. In this study, the complex street networks of villages were modeled with a series of continuous segments. Four variables included in the segment analysis and one spatial parameter that represented the curved street networks were analyzed in this study:
- Depth represents the topological distance between a starting node and the terminal node in a system, and it is a basic measure of space syntax [44]. In addition, after the connection angle between nodes in a spatial network is considered, angular depth is used to determine the shortest distance between them [45]. In this study, the metric step depth (MSD) calculated by following the shortest angular path between nodes is used to evaluate the shortest distance from a starting node to the village entrance (DtoE).
- Connectivity reflects the number of nodes in a system that are directly connected to the starting node. After the weight of the turn angle is added (0 = 0°, 0.5 = 45°, 1 = 90°), angular connectivity can relatively accurately describe the spatial relationship between nodes. In this study, the calculation of spatial connectivity followed the rules of angular connectivity.
- Integration represents the accessibility of a spatial node [46]. A higher integration value indicates that the corresponding spatial node is more accessible in the system. Normalized angle integration (NAIN) can be used to compare the accessibility of spatial systems at different scales [47] and analyze the local integration of a system through different calculating radii to reveal the association between people’s activity and spatial systems [48,49]. According to the range of studied village scales, two radii of 100 and 500 m were used in this study to indicate walking accessibility. The calculation of NAIN is demonstrated in Formula (3)where NC is the total number of nodes, and TD is the total angular depth of a node in a system.
- Choice is used to measure the availability of nodes in a system, and it reflects the potential of each node to be selected as the shortest path [50]. The higher the choice value of a spatial node is, the more easily it can be used in the system. This study uses the normalized angle choice (NACH) with a similar calculation radius (R) (100 and 500 m) as that of NAIN to represent the usability of street network’s spaces. The calculation of NACH is demonstrated in Formula (4)where CH is the angular choice value of a node, and TD is the total angular depth of that node in a system.
- Curvature describes the street form based on the degree of curvature of the street network, where the term straight refers to the absence of curvature. Therefore, curvature can be used to identify the degree of street network deformation exhibited by a village. It is represented by the ratio of the number of axial lines to the number of streets [51]. Therefore, the curvature of a zigzag street is higher than that of a straight street when the number of streets is equal, as shown in Formula (5)where L is the number of axial lines in a given street network A, and S is the number of streets in the network.
3. Results
3.1. Social Interactions and Pedestrian Preference Observed in the Street Network
During the snapshot observation, a total of 175 people in the observation zones of the three villages were observed, as shown in Table 1. Social groups were more active than personal groups (79, 45%), according to the higher percentage of participants (96, 55%). Yuliang village had the fewest social contacts (42, 24%), and 18 people (18.7%) participated in 4 (16%) social groups. In Tangyue village, 25 people (26%) participated in 7 (28%) social groups out of a total of 55 people (31.4%), while the total number of social contacts (78, 44.6%), the number of people (53, 55.2%) participating in social groups and the number of social groups (14, 56%) were the greatest in Gaoyang village. It was observed that although the social intensities differed, most of the social activities took place in branch street spaces with lower visual integration in the street network (Figure 3), indicating that the more irregular a space was, the more conducive it was to the development of social activities.

Table 1.
Number of social interaction activities and people observed in the three villages.
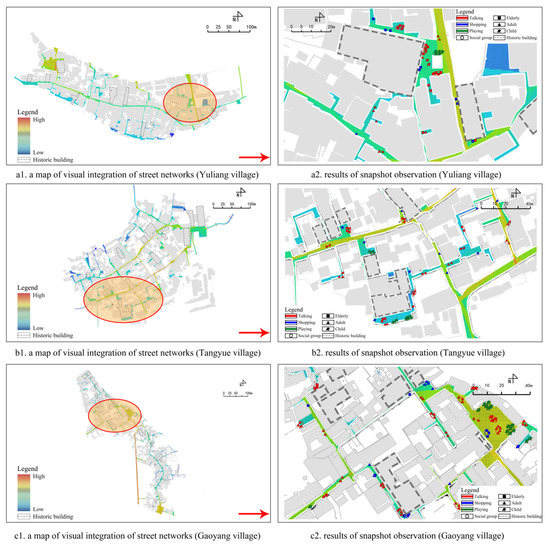
Figure 3.
Snapshot observation results.
Since pedestrian volume is often positively correlated with the frequency of social activities, the pedestrian volume in the street network spaces of the three villages was calculated, and we verified whether branch street spaces were the real socially preferred area of the community population by comparing the pedestrian volumes of streets with different spatial types. The observation results show that PV-I is lower than PV-II for all three villages (Table 2). A total of 2793 people were observed in Yuliang village over two days, including 1053 people (40%) corresponding to PV-I and 1740 people (60%) corresponding to PV-II. In Tangyue village, a total of 3085 people were observed over two days, including 1059 people (34%) corresponding to PV-I and 2026 people (66%) corresponding to PV-II. The overall population (3070) of Gaoyang village observed over two days included 831 people (30%) corresponding to PV-I and 2239 (70%) corresponding to PV-II.
Table 2.
Number of pedestrians observed in the three villages.
By measuring the pedestrian volume in the street network and presenting the results of each observation point in the form of kernel density, it was found that there were more pedestrians in branch streets (Figure 4). Among the seven high-density areas formed by Yuliang village, six were located in the branch street area, and one was located in the intersection area between the branch streets and the main road. In Tangyue village, we identified five high-density areas, and three were located near branch streets, while two were located in the intersection area of the branch streets and the main road. In Gaoyang village, the high-density areas were mainly scattered across the south of the village, while the other two high-density areas were located in the middle and northern parts of the village. Then, the observation results were compared with the space syntax simulation results. As shown in Figure 4, the pedestrian volume of the branch streets was similar to that of the main road, and it was even higher than that of the main road in some sections. As the main road is the primary pathway leading out of the village, it is generally a mixed space for people and vehicles, and the participation of noncommunity populations is not excluded from the traffic groups. Therefore, the simulation results are similar with the observation results, indicating that community populations tend to conduct social activities in branch street spaces.
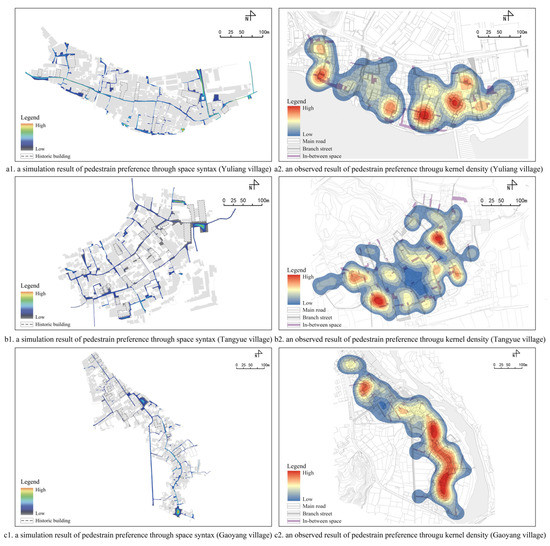
Figure 4.
Comparison of simulated results (left) with observed results (right).
3.2. Spatial Configuration Characteristics of Street Networks
Figure 5 displays the distribution of seven configurational attributes, including depth to village entrances (DtoE), connectivity, the NACH (R = 100/500 m), NAIN (R = 100/500 m) and curvature for three different spatial street network types. Some tendencies were similar across the three villages. The DtoE values were found to be higher in the in-between spaces and the branch streets than in the main road because the distance between the street space and the village entrance is relative to these values. However, connectivity was found to be lower in the in-between spaces than in the branch streets or main roads because fewer pathways are connected to one another in these areas. Usability and accessibility are represented by the NACH and NAIN, respectively. It was demonstrated that the calculation radius (R) had a considerable impact on both variables. When a small radius (R = 100 m) was employed, the computed values showed local walking behavior (<5 min), which resulted in higher values in the high-density pathway (branch streets and in-between spaces) network areas. With an increase in the radius (R = 500 m, approximately 8–10 min walk), long pathways that connected the entrances of villages, for instance, the main road directly linked to the gate of a village, produced higher NACH and higher NAIN.

Figure 5.
Comparison of three spatial types of configurational attributes.
The differences in location across the three types of street space led to significant differences (p < 0.05 in two-sample t-test) in all of the spatial attributes, as depicted in Figure 6a–c. In terms of global space (R = 500 m), larger connectivity, NACH and NAIN values and smaller DtoE and curvature values were found in the main roads than in the branch streets and in-between spaces because main roads are more usable and accessible in the street network. As the radius decreased, the spatial configuration attributes of the street network changed. With small radii, the pathway density inside the villages mostly determined the NACH and NAIN (R = 100 m). As a result of their denser and more intricate pathway networks, branch streets and in-between spaces may have higher average values. Moreover, different radii indicate different travel purposes. In a rural context, when walking distances are greater than 500 m, more trips are taken for activities outside the village. Therefore, the main road, which is closer to the gate of the village and has a straighter shape and greater availability and accessibility, is the preferred pathway to reach the outside of the village. When walking less than 100 m, people’s travel purposes mainly comprise local activities (shopping, social interactions and entertainment) in their villages. Therefore, branch streets or in-between spaces with greater deformation and privacy that are close to home are people’s preferred pathways.
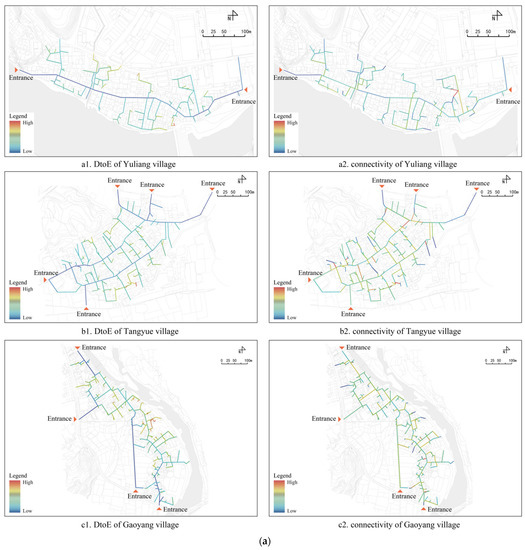
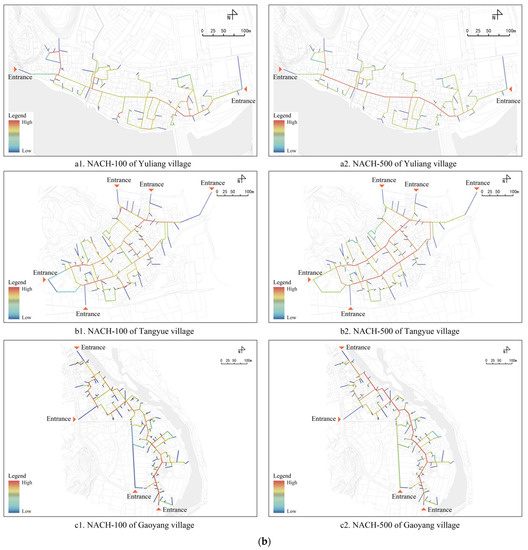
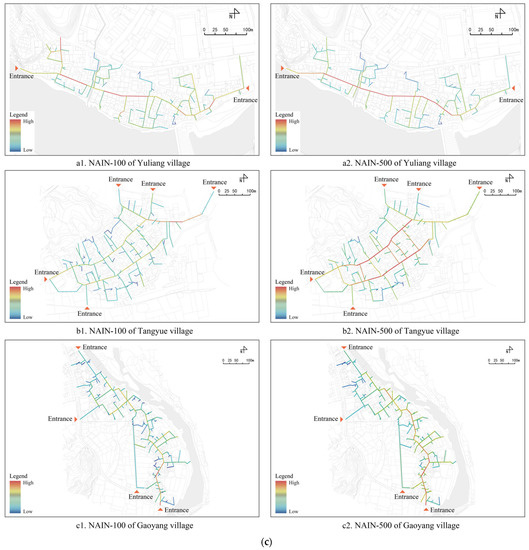
Figure 6.
(a) Distribution of spatial configuration attributes (DtoE and connectivity) of three villages. (b) Distribution of spatial configuration attributes (NACH-100 and NACH-500) of three villages. (c) Distribution of spatial configuration attributes (NAIN-100 and NAIN-500) of three villages.
As shown in Figure 6a–c, there was no independent relationship between any of the seven spatial configuration variables. To learn more about the connections between these attributes, a correlation study was conducted. The results shown in Table 3 demonstrate that two NACH and two NAIN indices were highly correlated (Pearson coefficient: r ≥ 0.5, Sig. < 0.01). Moreover, the NACH and NAIN indices were all weakly correlated with the same radius (r > 0.2, Sig. < 0.05). Moreover, curvature and the two NACH indices were significantly correlated (r > 0.3, Sig. < 0.01). Spatial locations in the village were represented by DtoE and connectedness, respectively, as were their connections to the local pathway network. Although they had low negative correlations with NAIN-100 (r > 0.3, Sig. < 0.01), they were mostly independent of the other attributes.
Table 3.
Results of a correlation analysis between the spatial configuration attributes.
3.3. Relationship between the Space Characteristics and Pedestrian Volume of Street Networks
A multivariate analysis of variance (MANOVA) was applied to detect the associations between the pedestrian volume (MPV-I or MPV-II) and spatial configuration attributes (DtoE, connectivity, curvature, NACH and NAIN with two radii) of the street network. The results (Table 4) showed that all seven spatial attributes had significant influences on the pedestrian volume of the street network (p < 0.05). The partial eta square () indicates the effect size of each factor. As shown in Table 4 and Figure 7, the effects of DtoE (0.118) and NAIN-500 (0.123) on MPV-I were found to be much more significant than those of DtoE (0.047) and NAIN-500 (0.05) on MPV-II. Moreover, the effects of connectivity (0.006), NACH-100 (0.032), NAIN-100 (0.08) and curvature (0.02) on MPV-I were much less significant than those of connectivity (0.176), NACH-100 (0.214), NAIN-100 (0.186) and curvature (0.105) on MPV-II. In contrast to the pedestrian activity on the main road, which is intended for traffic, most social interaction activities were found to take place in the denser and more complex pathways of branch streets; thus, the impacts of NACH and NAIN with a larger street radius on MPV-II were weaker, while the impacts of connectivity, curvature, NACH and NAIN with a smaller radius were more significant.
Table 4.
MANOVA of the street spatial configuration attributes on pedestrian volume in the street networks.
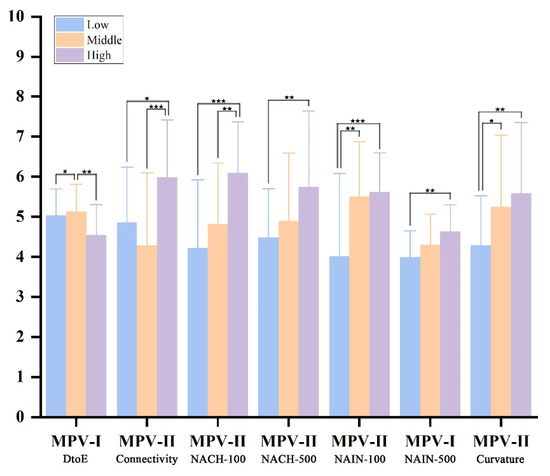
Figure 7.
Effect of street spatial configuration attributes on pedestrian volumes (*, ** and *** represent significance at the 0.05, 0.01 and 0.001 levels, respectively).
The different spatial forms of the street network served as control variables in the second stage of the analysis, which used regression analysis to identify the relationship between the street’s spatial configuration attributes and pedestrian volume. A stepwise algorithm was used to minimize collinearity due to a substantial correlation between the spatial configuration attributes.
A significant joint influence of the street’s spatial configuration attributes (DtoE, the NACH, NAIN and curvature) on pedestrian volume in the street network was found, as shown in Table 5. Small VIFs for all the predictors (<1.5) indicated that there was no significant collinearity. On the basis of space features, all five regression models were significant (p < 0.01) in explaining the pedestrian volume of the street network.
Table 5.
Stepwise regression of the pedestrian volume with spatial characteristics.
For the pedestrians in the branch streets, which are primarily intended for interactions or traffic (MPV-II), a significant influence of the spatial characteristics was found with a high percentage of explained variance (33.2–70.8%). For the pedestrians on the main road, which is mainly intended for traffic (MPV-I), 7.2–14.5% of the variance was explained by the street network’s spatial configuration attributes. By examining the different types of street space, we revealed the influence of the main road’s spatial attributes, along with the proportion of explained variance (12.7%), on MPV-I; however, no significant effect of the main road’s spatial attributes on MPV-II was found. For the branch street spaces, the influence of their spatial attributes on MPV-I was revealed along with the proportion of explained variance (14.5%), and 33.2% of the variance was explained by the effect on MPV-II. Moreover, the influence of the in-between space’s configurational attribute on MPV-I was revealed to have the lowest proportion of explained variance (7.2%), while that on the on MPV-II had the highest proportion of explained variance (70.8%).
It can be seen that the effects of different street spatial types on the pedestrian volumes in the two areas are different. For main roads, NAIN-500, which denotes global accessibility, was found to have a more significant impact on MPV-I. For branch streets, NAIN-500 and DtoE were found to have more significant influences on MPV-I, where the impact of DtoE was negative. Moreover, NAIN-100, which denotes local accessibility, and NAIN-500 were shown to have significant effects on MPV-II, of which the impact of NAIN-500 was negative. Moreover, regarding the in-between space, DtoE was found to have a negative influence on MPV-I, while NACH-100 (local usability), NAIN-100 and curvature, which indicate the degree of space deformation, were shown to have the greatest positive effects on MPV-II.
In all five models, only the in-between spaces with smaller radii for the NACH and NAIN were found to have a highly significant effect (B = 5.218–7.467, p < 0.001) on pedestrian volumes in the branch streets (MPV-II), which are preferred areas of the community population in terms of social interaction activities.
4. Discussion and Conclusions
By examining three tourist villages in the Huizhou area, China, this study investigated the association between street network spatial attributes and the community population’s pedestrian preferences using the space syntax tool. Moreover, the influence of street network spaces on the regional social interaction preferences of rural community populations was explored.
The examined street network spatial attributes (DtoE, the NACH, NAIN and curvature) were found to have a joint influence on pedestrian preferences. The results showed that more pedestrian volume can be found in branch streets (social activities preference areas) with relatively low levels of walking accessibility (NAIN) and the highest deformation (curvature). While main roads have the highest levels of walking accessibility (NAIN) and usability (NACH) in rural contexts, roads located close to village entrances (DtoE) are not effective in promoting social interaction activities among community populations. In contrast, in-between spaces with the lowest levels of walking accessibility (NAIN) and usability (NACH) and relatively high levels of deformation (curvature) that are located far from village entrances (DtoE) tend to enhance community residents’ social interactions.
The results of this study suggest that village street networks have an impact on people’s activities. The lower choice, connectivity and integration and higher depth and curvature of in-between spaces were identified as influential space factors for the social activity preference areas of community populations, which is different from the situation in urban contexts [12,13,14,15]. Lower integration, choice and connectivity and greater depth to entrances lead to less visitor accessibility. In contrast, a lower depth to a person’s own house and higher curvature lead to more privacy and the lower cost of use for community populations, preventing possible interruptions. Therefore, branch street spaces are likely to be preferred by community populations for social interactions.
Inspired by the study of urban open space, this paper applies the association between urban open space and social activities in the rural context, and obtains different results from those of urban studies, which is meaningful. The present findings can be used to inform the design and planning of rural tourism to improve the situations of visitors who often interrupt the social interactions of community populations. First, the findings of this study lead to recommendations for designing open spaces and street networks in rural areas. Street space type and pathway configuration were shown to determine the accessibility of social interaction zones. To enhance social activities in general, more open spaces should be planned near in-between spaces and spaces connected to less-accessible pathways to reduce the cost of use for community populations. To decrease interruptions from visitors, social interaction zones should be connected to pathways with less accessibility and more curvature to improve space privacy. Therefore, the lower the relative accessibility of a rural street network is, the more conducive it is to the development of community social interactions. In addition, by using Depthmap software, more thorough optimization of street networks can be carried out. On the other hand, the results of this study can be applied to improve the spatial distribution of support facilities, such as benches, tables, and entertainment and fitness facilities. During the design phase, pathways and areas that are more conducive to social interaction can be identified through an analysis of spatial attributes. To accommodate the needs of social interactions, more support facilities should be built.
However, there are still some limitations in this paper. On the one hand, compared with the numerous traditional villages in the Huizhou area, this study only selected three typical samples, which may lead to some deviation in the results due to the small size. On the other hand, field observations are often limited by the weather and time, so they cannot be conducted continuously. Therefore, the results may deviate from the real situation to some extent. Despite its limitations, this study adds to our understanding of the association between street networks and social interactions in rural contexts. Subsequent studies can further improve the credibility of the research conclusions by expanding the sample size and introducing cases from different zones. Moreover, big data analysis can be introduced into the study of rural spaces to enhance the efficiency and reliability of such research with diversified analysis methods.
Author Contributions
Conceptualization, J.D.; Data curation, Z.G.; Formal analysis, Z.G.; Funding acquisition, J.D.; Investigation, Z.G.; Methodology, J.D. and S.M.; Resources, J.D.; Software, Z.G.; Supervision, J.D.; Visualization, Z.G.; Writing—original draft, Z.G.; Writing—review & editing, J.D. and S.M. All authors have read and agreed to the published version of the manuscript.
Funding
This research was funded by the Arts Project of the National Social Science Foundation of China (NO. 18CG197).
Institutional Review Board Statement
Not applicable.
Informed Consent Statement
Not applicable.
Data Availability Statement
Data is contained within the article.
Acknowledgments
The authors wish to acknowledge Wang Zihan, Wang Ruming, Shen Xin, Xu Yujie, Fan Wenwei, Zhang Li, Meng Rui, Xin Lingling, He Menglong and Xing Weiwei for their help with site observation.
Conflicts of Interest
The authors declare no conflict of interest.
References
- Hayllar, B.; Griffin, T.; Edwards, D. City Spaces-Tourist Places: Urban Tourism Precincts; Routledge: London, UK; New York, NY, USA, 2008. [Google Scholar]
- McKercher, B.; Ho, P.; Cros, D. Relationship between tourism and cultural heritage management: Evidence from Hong Kong. Tour. Manag. 2005, 26, 539–548. [Google Scholar] [CrossRef]
- Wang, Y.; Bramwell, B. Heritage protection and tourism development priorities in Hangzhou, China: A political economy and governance perspective. Tour. Manag. 2012, 33, 988–998. [Google Scholar] [CrossRef]
- Li, M.; Wu, B.; Cai, L. Tourism development of World Heritage sites in China: A geographic perspective. Tour. Manag. 2008, 29, 308–319. [Google Scholar] [CrossRef]
- Yu, R.; Liang, L.; Li, D.; Zhu, H.; Zhu, S. Tourism population invasion, succession and the spatial order recombination of ancient village—A case study of Hongcun village. Econ. Geogr. 2013, 33, 165–170. (In Chinese) [Google Scholar]
- Delafons, J. The New Urbanism: Toward an architecture of community. Cities 1994, 11, 342–343. [Google Scholar] [CrossRef]
- Jacobs, J. The Death and Life of Great American Cities; Vintage: New York, NY, USA, 1992. [Google Scholar]
- Montgomery, J. Making a city: Urbanity, vitality and urban design. J. Urban. Des. 1998, 3, 93–116. [Google Scholar] [CrossRef]
- Gehl, J. Life between Buildings; Island Press: Covelo, CA, USA, 2003. [Google Scholar]
- Liu, M.; Jiang, Y.; He, J. Quantitative evaluation on street vitality: A case study of Zhoujiadu community in Shanghai. Sustainability 2021, 13, 3027. [Google Scholar] [CrossRef]
- Xu, X.; Xu, X.; Guan, P.; Ren, Y.; Wang, W.; Xu, N. The cause and evolution of urban street vitality under the time dimension: Nine cases of streets in Nanjing City, China. Sustainability 2018, 10, 2797. [Google Scholar] [CrossRef]
- Bielik, M.; König, R.; Schneider, S.; Varoudis, T. Measuring the Impact of Street Network Configuration on the Accessibility to People and Walking Attractors. Netw. Spat. Econ. 2018, 18, 657–676. [Google Scholar] [CrossRef]
- Fang, K.; Wang, X.; Chen, L.; Zhang, Z.; Furuya, N. Research on the correlation between pedestrian density and street spatial characteristics of commercial blocks in downtown area: A case study on Shanghai Tianzifang. J. Asian Archit. Build. Eng. 2019, 18, 233–246. [Google Scholar] [CrossRef]
- Lamíquiz, P.; López-Domínguez, J. Effects of built environment on walking at the neighbourhood scale. A new role for street networks by modelling their configurational accessibility? Transp. Res. Part A Policy Pract. 2015, 74, 148–163. [Google Scholar] [CrossRef]
- Lee, S.; Yoo, C.; Seo, K. Determinant factors of pedestrian volume in different land-use zones: Combining space syntax metrics with GIS-based built-environment measures. Sustainability 2020, 12, 8647. [Google Scholar] [CrossRef]
- Yström, A.; Agogué, M. Exploring practices in collaborative innovation: Unpacking dynamics, relations, and enactment in in-between spaces. Creat. Innov. Manag. 2020, 29, 141–145. [Google Scholar] [CrossRef]
- Aminpour, F.; Bishop, K.; Corkery, L. The hidden value of in-between spaces for children’s self-directed play within outdoor school environments. Landsc. Urban Plan. 2020, 194, 103683. [Google Scholar] [CrossRef]
- Tsolidis, G.; Kostogriz, A. ‘After hours’ schools as core to the spatial politics of ‘in-betweenness’. Race Ethn. Educ. 2008, 11, 319–328. [Google Scholar] [CrossRef]
- Kang, C. Measuring the effects of street network configurations on walking in Seoul, Korea. Cities 2017, 71, 30–40. [Google Scholar] [CrossRef]
- Ozbil, A.; Gurleyen, T.; Yesiltepe, D.; Zunbuloglu, E. Comparative Associations of Street Network Design, Streetscape Attributes and Land-Use Characteristics on Pedestrian Flows in Peripheral Neighbourhoods. Int. J. Environ. Res. Public Health 2019, 16, 1846. [Google Scholar] [CrossRef]
- Ewing, R.; Hajrasouliha, A.; Neckerman, K.; Purciel-Hill, M.; Greene, W. Streetscape Features Related to Pedestrian Activity. J. Plan. Educ. Res. 2015, 36, 5–15. [Google Scholar] [CrossRef]
- Hajrasouliha, A.; Yin, L. The impact of street network connectivity on pedestrian volume. Urban Stud. 2014, 52, 2483–2497. [Google Scholar] [CrossRef]
- Sheng, Q.; Wan, D.; Yu, B. Effect of Space Confifigurational Attributes on Social Interactions in Urban Parks. Sustainability 2021, 13, 7805. [Google Scholar] [CrossRef]
- Huang, B.; Chiou, S.; Li, W. Accessibility and street network characteristics of urban public facility spaces: Equity research on parks in Fuzhou City based on GIS and space syntax model. Sustainability 2020, 12, 3618. [Google Scholar] [CrossRef]
- Baran, P.; Rodríedguez, D.; Khattak, A. Space syntax and walking in a New Urbanist and suburban neighbourhoods. J. Urban Des. 2008, 13, 5–28. [Google Scholar] [CrossRef]
- Ozbil, A.; Peponis, J.; Stone, B. Understanding the link between street connectivity, land use and pedestrian flows. Urban Des. Int. 2011, 16, 125–141. [Google Scholar] [CrossRef]
- Soares, I.; Yamu, C.; Weitkamp, G. The relationship between the spatial configuration and the fourth sustainable dimension creativity in university campuses: The case study of Zernike campus, Groningen, the Netherlands. Sustainability 2020, 12, 9263. [Google Scholar] [CrossRef]
- Can, I.; Heath, T. In-between spaces and social interaction: A morphological analysis of Izmir using space syntax. J. Hous. Built Environ. 2016, 31, 31–49. [Google Scholar] [CrossRef]
- Zerouati, W.; Bellal, T. Evaluating the impact of mass housings’ in-between spaces’ spatial configuration on users’ social interaction. Front. Archit. Res. 2020, 9, 34–53. [Google Scholar] [CrossRef]
- Ren, Y.; Chen, W.; Chen, X. Application of the BP Neural Network Model in the Coordinated Development of Tourism Economic Networks in the Guangdong-Hong Kong-Macao Greater Bay Area. Comput. Intell. Neurosci. 2022, 2022, 3726696. [Google Scholar] [CrossRef]
- Sun, L.; Leng, J. Research on influencing factors of travel in underground space based on multi-source data: Spatial optimization design for low-carbon travel. Energy Build. 2021, 253, 111524. [Google Scholar] [CrossRef]
- Hoehner, M.; Ramirez, B.; Elliott, B.; Handy, S.; Brownson, R. Perceived and objective environmental measures and physical activity among urban adults. Am. J. Prev. Med. 2005, 28, 105–116. [Google Scholar] [CrossRef]
- Jung, H.; Lee, S.; Kim, H.; Lee, J. Does improving the physical street environment create satisfactory and active streets? Evidence from Seoul’s Design Street Project. Transp. Res. Part D Transp. Environ. 2017, 50, 269–279. [Google Scholar] [CrossRef]
- Lee, J. Understanding volume and correlations of automated walk count: Predictors for necessary, optional, and social activities in Dilworth Park. Environ. Plan. B Urban Anal. City Sci. 2019, 48, 331–347. [Google Scholar] [CrossRef]
- Guo, X.; Chen, H.; Yang, X. An evaluation of street dynamic vitality and its influential factors based on multi-source big data. Int. J. Geo-Inf. 2021, 10, 143. [Google Scholar] [CrossRef]
- Kan, Z.; Kwan, M.; Liu, D.; Tang, L.; Chen, Y.; Fang, M. Assessing individual activity-related exposures to traffic congestion using GPS trajectory data. J. Transp. Geogr. 2022, 98, 103240. [Google Scholar] [CrossRef]
- Li, X.; Qian, Y.; Zeng, J.; Wei, X.; Guang, X. The Influence of Strip-City Street Network Structure on Spatial Vitality: Case Studies in Lanzhou, China. Land 2021, 10, 1107. [Google Scholar] [CrossRef]
- Li, X.; Li, Y.; Jia, T.; Zhou, L.; Hijazi, I.H. The six dimensions of built environment on urban vitality: Fusion evidence from multi-source data. Cities 2022, 121, 103482. [Google Scholar] [CrossRef]
- Chen, Z.; Yan, S.; Qing, H.; Fei, S. Spatially explicit assessment on urban vitality: Case studies in Chicago and Wuhan. Sustain. Cities Soc. 2018, 40, 296–306. [Google Scholar]
- Mu, B.; Liu, C.; Mu, T.; Xu, X.; Tian, G.; Zhang, Y.; Kim, G. Spatiotemporal fluctuations in urban park spatial vitality determined by on-site observation and behavior mapping: A case study of three parks in Zhengzhou City, China. Urban For. Urban Green. 2021, 64, 127246. [Google Scholar] [CrossRef]
- Cao, J.; Kang, J. Social relationships and patterns of use in urban public spaces in China and the United Kingdom. Cities 2019, 93, 188–196. [Google Scholar] [CrossRef]
- Lipovská, B.; Štěpánková, R. Assessing observation methods for landscape planning practice in rural villages. Curr. Urban Stud. 2013, 1, 102–109. [Google Scholar] [CrossRef]
- Hillier, B.; Hanson, J. The Social Logic Of Space; Cambridge University Press: Cambridge, UK; New York, NY, USA, 1984. [Google Scholar]
- Bafna, S. Space syntax: A brief introduction to its logic and analytical techniques. Environ. Behav. 2003, 35, 17–29. [Google Scholar] [CrossRef]
- Hillier, B.; Iida, S. Network effects and psychological effects: A theory of urban movement. In Proceedings of the Fifth Space Syntax Symposium, Delft, The Netherlands, 13–17 June 2005. [Google Scholar]
- Hillier, B. The genetic code for cities: Is it simpler than we think? In Proceedings of the Complexity Theories of Cities Have Come of Age, Delft, The Netherlands, 24–27 September 2009.
- Hillier, B.; Yang, T.; Turner, A. Normalising least angle choice in Depthmap and how it opens new perspectives on the global and local analysis of city space new perspectives on the global and local analysis of city space. JSP Syntax 2012, 3, 155–193. [Google Scholar]
- Al-Sayed, K.; Turner, A.; Hillier, B.; Iida, S.; Penn, A. Space Syntax Methodology; Bartlett School of Architecture-UCL: London, UK, 2018. [Google Scholar]
- Esposito, D.; Santoro, S.; Camarda, D. Agent-based analysis of urban spaces using space syntax and spatial cognition approaches: A case study in Bari, Italy. Sustainability 2020, 12, 4625. [Google Scholar] [CrossRef]
- Turner, A. Angular analysis. In Proceedings of the 3rd International Symposium on Space Syntax, Atlanta, GA, USA, 7–11 May 2001. [Google Scholar]
- Omer, I.; Zafrir-Reuven, O. The development of street patterns in Israeli cities. J. Urban Reg. Anal. 2015, 7, 113–127. [Google Scholar] [CrossRef]
Publisher’s Note: MDPI stays neutral with regard to jurisdictional claims in published maps and institutional affiliations. |
© 2022 by the authors. Licensee MDPI, Basel, Switzerland. This article is an open access article distributed under the terms and conditions of the Creative Commons Attribution (CC BY) license (https://creativecommons.org/licenses/by/4.0/).