Article

Exploring the Nexus of Renewable Energy, Ecological Footprint, and Economic Growth through Globalization and Human Capital in G7 Economics

1
Department of Agricultural Economics, Ferdowsi University of Mashhad, Mashhad 9177948974, Iran
2
Department of Agricultural Economics, University for Development Studies, Tamale P.O. Box TL1350, Ghana
3
Department of Management Science and Engineering, School of Management Engineering, Zhengzhou University, 100 Kexkue Blvd, Zhongyuan District, Zhengzhou 450001, China
4
Department of Operations Research and Business Intelligence, Wroclaw University of Science and Technology, 50-370 Wroclaw, Poland
5
Faculty of Electrical Engineering, Wroclaw University of Science and Technology, 50-370 Wroclaw, Poland
*
Author to whom correspondence should be addressed.
Sustainability 2022, 14(19), 12227; https://doi.org/10.3390/su141912227
Submission received: 24 August 2022 / Revised: 14 September 2022 / Accepted: 21 September 2022 / Published: 27 September 2022
(This article belongs to the Section Resources and Sustainable Utilization)

Abstract

:
This study used panel simultaneous equations models with a generalized method of moments (GMM) estimator to examine the three-way linkages between ecological footprint (EFP), renewable energy consumption (REC), and income in the Group of Seven (G7) countries over the period 1990–2018. The outcomes of this study demonstrate a two-way association between gross domestic product (GDP) and renewable energy. The findings confirm the presence of a bidirectional link between outcome and ecological footprint, as well as between EFP and renewable energy. The results of this study demonstrate that improving human capital positively and significantly effects income, environmental quality, and REC. Ecological footprint is not significantly impacted by economic and social globalization, whereas the impact of financial globalization is negative and significant. Trade openness is positively and significantly connected with REC and income, which could contribute to reducing environmental deterioration. In conclusion, we make policy recommendations that are based on the findings of the study.

1. Introduction

Today, we confront significant challenges due to nonrenewable energy use, which stimulates economic growth but harms the environment [1,2]. Historically, industrialized nations have contributed a sizable portion of global emissions due to their over-reliance on fossil fuels, leading to a poor ecological footprint [3]. Invariably, ecological footprint compromises of the notion of sustainable development. Hence it is crucial to hasten the energy transition to solve these problems. The world has agreed (Ratification of treaties) that developing clean energy as inputs for development is emergent [4]. Despite revolutionary efforts to adopt renewable technologies, some advanced economies remain steadfast in using fossil fuel energies for supposedly faster growth. These paradigms instigate concerns for academia to investigate how best to abate the consequences on the environment. While addressing such a puzzle, pertinent questions arise: (i) What is the situation in G7 economies? (ii) Does renewable energy abate ecological footprint? (iii) What is the consequence of globalization within this energy-environment-economic debate? (iv) What is the role that human capital plays in abating ecological footprint? (v) What are the gaps in the literature. The ideas are expanded below chronologically.
The G7 economies were selected as a representative sample because, on average, they accounted for nearly 36% of the world’s total energy, which has a major environmental consequence [5]. This is because the G7 countries are advanced industrialized nations with rigorous growth policies. However, the environmental Kuznets curve appears to hold true for most G7 nations, with the United States being regarded as the world’s second-largest polluter behind China [6]. Be as it is, actions and policies have been implemented to ensure environmental sustainability and economic prosperity. Nonetheless, the results are not robust, and studies produce contradictory conclusions affecting environmental policy, necessitating further studies [7,8]. Therefore, a comprehensive empirical investigation of the G7 scenario is crucial since many G7 nations have demonstrated dedication and long-term sustainability goals. From another perspective on the G7 discussion on improving the environment, the literature has mostly ignored the issues of energy transitions, globalization, and human capital [9,10]. Also, because the G7 economies are polarized on the future EFP and carbon neutrality, it is now necessary to examine the factors that might easily contribute to reaching the desired environmental quality. Additional traditional G7 standards have also come under fire for placing a limit on permissible emissions, which makes the goal of zero-neutrality challenging to achieve. Alternative research is, therefore, essential in this Economic bloc to simplify policies. Also, our work will be a novelty in accessing the relationship between green energy, environmental impact, and economic expansion via globalization and human capital.
Secondly, most literature turns to ignore the synergy between Sustainable Development Goal 7 (SDG 7) and Sustainable Development Goal 13 (SDG 13). Thus, promoting the use of clean energy bolsters the reduction of climate change. The Kyoto Protocol [11] represented a significant turning point in promoting the use of renewable energy by establishing legally enforceable requirements to abate pollution [12]. It has been evident in recent years that renewable energy sources may be leveraged to develop green and sustainable energy systems [13,14]. The fastest-growing energy source in the world is anticipated to be clean energy [15,16]. However, increasing investment in these energy transitions is associated with economic progress. It is unclear from the material that is currently available whether more economic growth benefits the usage of low-carbon energies or the opposite [17,18]. The energy transition is a route that will see the current energy shift from fossil-based to zero-carbon [19]. At its core is the need to decarbonize emissions that are associated with energy to limit environmental damage. However, renewable energy technologies are relatively new and have yet to achieve cost-effective levels [20,21]. Given the high cost, only high-income, industrialized nations are projected to adopt renewable energy early as alternative energy, unlike developing countries, which are more advantageous with the resources but lack the finance and technical know-how [22]. As a result, we rely on the G7 countries, which are all highly advanced and consume the biggest proportion of renewable energy [23]. The following facts, among others, are driving the growing interest in renewable energy: (i) As it is renewable, plentiful, and can be generated everywhere, contemporary clean energy provides an option to reduce petroleum reliance. (ii) Renewable energy reduces poverty and increases rural employment in developing and undeveloped nations. (iii) Renewable energy may be transferred to useable thermal energy, electricity, and fuels for power generation. (iv) Renewable energy cuts CO2 emissions. (v) It enhances energy security by replacing fossil fuels.
Thirdly, globalization has resulted in economic progress across countries and significantly influenced humanity’s socioeconomic, ecological, and political aspects. Making it relevant in the debate of every nation’s sustainable development discussion; frivolously carried out globalization-driven industrial growth could harm the environment [24]. Even while there are advantages for humanity due to globalization, there are also adverse side effects that go along with it. According to Jakob [25], although globalization hastens structural change and supports developmental processes, it also raises serious problems, particularly with the issue of declining environmental quality; although, research into the mechanisms through which globalization affects environmental deterioration is prevalent. The results differ between techniques and study populations. Some research, for example, shows that globalization causes pollution. See Acheampong [26], Acheampong et al. [27], and Onifade et al. [28]. In contrast, other research found that globalization reduces pollution [24,29]. However, in a world where globalization is evident, further queries are needed to understand the role that globalization plays within the debate of the energy-environment debacle.
This research includes the human capital in the energy-environment nexus since the current literature contends that human capital might be crucial to the sustainability pivot [30,31]. Previous research provides undeniable proof that human capital boosts economic growth [32,33]. However, studies on the link between human capital and the environment have received little attention in the prior literature, yet education may impact the environment via various routes [34,35,36]. Again, new studies emphasize the need to put people at the center of all transitions to clean power and resolution to fight a poor ecological footprint [37,38]. According to Kirschbaum and Soretz [39], human capital development enhances environmental quality by lowering the use of fossil fuels without harming economic growth. Similarly, Sarkodie et al. [40] demonstrate how we may minimize the use of fossil fuels in developmental processes by improving human capital, which is highly beneficial for sustainability. Human capital is crucial in the income-environment nexus because they immediately increase environmental quality, according to Bilgili et al.’s [41] theory. According to existing studies, human activity and education may help identify and mitigate the causes and effects of ecological footprint. However, this research differs from the surrounding literature in that it contends that studying the function of human capital in sustainable development is insufficient. However, policy should be centered on making human capital a focal point for environmental improvement.
Lastly, several literature gaps are associated with the aforementioned index. First, an identified shortcoming is often the use of CO2 to measure environmental degradation [42,43,44,45,46]. However, it has been discovered that this proxy does not reflect the whole of human activity and it is not comprehensive enough to represent the environment concerns. Based on this shortcoming, the ecological footprint is used to assess environmental deterioration and sustainability [47]. Additionally, the SDGs stress the need to protect biodiversity and preserve ecosystems to promote fair human and economic progress. Hence our study also responds to this call by integrating the role of globalization and human capital to understand the dynamism that they bring to the relationship between energy transitions and environmental stewardship.
The primary purpose of this study is to serve as a foundation for informing international communities and emerging nations on how to effectively direct their economic trajectory in order to avoid succumbing to the environmental Kuznet curve. This study also aims to investigate the potential impact of human capital and RE on environmental conservation in the G7 as a protocol within the SDG. While there has been an increase in the literature on REC-EFP-GDP for single countries and panels of countries in recent years, no study has explored the nexus of environmental degradation, REC, and income by a simultaneous equations model. Hence, this study aims to bridge this research gap by examining three-way linkages between our variables of interest for G7 countries from 1990 to 2018. The current study makes three contributions. First, this is the first study to examine the causal link between REC and growth—ecological footprint for the nations under consideration. Secondly, our study employs panel simultaneous equations models with a GMM method, in light of the possible endogeneity issue in the estimated models; this endeavor is exceptionally supportive and original in obtaining more dependable and robust results than previous research. Thirdly, we examine the effect of economic, financial, and social globalization, as well as human capital on the variables of concern.
Following the premise from this research, the following portions of the study are organized logically, with relevant studies described in Section 2 under the label ‘literature review’. The empirical methodology and results that are used are described in Section 3 and Section 4, respectively, while the conclusion and applicable policies are offered in Section 5.

2. Literature Review

Recent studies show that income is closely related to energy consumption. Among all types of energy, REC is one of the most noticeable energy types because of its compatibility with the environment. Hence, in recent years, one of the most intriguing research topics has been the study of the relationship between ecological footprint, income, and renewable energy. There are three study branches in the available literature on this issue.
The first subsection has considered the economic-environment nexus. Most research has found a link between GDP and ecological footprint. For example, Danish et al. [48] employed the autoregressive distributive lag (ARDL) method to examine the linkage of GDP and environmental quality from 1971 to 2014. Their results indicated that GDP raises environmental degradation in BRICS countries. Hussain et al. [49] also found a similar relationship between income and ecological footprint in Thailand. The study of Ahmad et al. [50] used panel data to confirm a positive link between economic output and EFP in emerging economies from 1984 to 2016. Using the Quantile ARDL model, Ikram et al. [51] also uncovered a bidirectional causality between output and EFP in Japan. Likewise, the results revealed that there is positive connection between income and EFP both in the long- and short-term. In the case of Nigeria, Udemba [52] investigated the impact of income on environmental quality using an econometrics approach. The results of this study indicated one-way causality from GDP to EFP. As a result, an increase in output causes a decrease in the quality of the environment. Also, Addai et al. [53] recorded a unidirectional causality running from income to the ecological footprint in Eastern Europe. However, some findings contradict the previously results. Akram et al. [54] and Ozcan et al. [55] have reported that income affects the EFP of developing countries. Nevertheless, economic output decreases the environmental degradation. Similarly, Mrabet et al. [56] used the ARDL to explore the nexus between economic output and ecological footprint in Qatar. According to their findings, environmental degradation is decreased by economic growth. In Turkey, Imamoglu [57] revealed that economic output boosted the environmental quality over the period from 1970 to 2014, using the FMOLS and DOLS approaches. In addition, Additionally, Baz et al. [58] assessed the impact of income on environmental quality using a nonlinear approach in Pakistan. The results showed that there is no causality between the environmental degradation and economic output. The same outcomes were shown by Wang et al. [59] for China and Kasman and Duman [60] for new EU member and candidate countries.
The second strand focuses on the connection between REC and GDP. The relationship between these variables has been investigated in this section using a variety of techniques. The literature shows inconsistent outcomes for these techniques. Some studies show a positive link between REC and economic output, while others show a negative link. For instance, Ivanovski et al. [61] used a non-parametric model to examine the time-varying effects of renewable energy consumption on economic growth in OECD and non-OECD countries for the period 1990–2015. Their estimates indicate that renewable energy consumption exerts a positive impact on economic growth in OECD and non-OECD countries. In the USA, Bulut et al. [62] found that renewable energy consumption promotes economic growth. Inglesi-Lotz [63] evaluated the impact of REC on GDP in OECD countries using a panel data model. They revealed that REC has a positive association with income during the period from 1990 to 2010. In another study on OECD, Apergis and Payne [64] also found that there is a positive connection between the two variables. This finding is confirmed by Sadorsky [65], who observed the same relationship for emerging economy countries in a FMOLS context. Shahbaz et al. [66] reported that renewable energy consumption boosted GDP in Pakistan during the period of 1972–2011. Bhattacharya et al. [67] utilized the FMOLS and DOLS estimators to analyze the impact of REC on income in the top 38 countries. According to the conclusions, REC had a positive association with economic output between 1991 and 2012. Tiwari [68] found a positive response to output in response to REC shock in India using the structural VAR approach. Tugcu et al. [69] used the ARDL to evaluate the nexus between economic growth and renewable energy in G7 countries. They discovered that in Canada, France, Italy, and the United States, there is no causative link between economic progress and REC, however, in Japan and the United Kingdom, there is bidirectional causation between economic output and renewable energy. Cho et al. [70] examined the REC linkage with economic progress using the multivariate panel vector error correction model in developed and less-developed countries. They concluded that in developed countries, renewable energy is not a key factor in economic growth while economic growth is positively related to REC. On the contrary, for less-developed countries, REC play a critical role in promoting GDP and economic growth causes an increase in REC.
The third branch examines the nexus between REC, income, and EFP. Indeed, according to numerous studies, income is a significant factor in REC and EFP. On the other hand, REC plays a substantial role in promoting output and mitigating the growth of CO2 emissions. Hence, it is necessary to examine the nexus between the three variables by taking into account their simultaneous relationship. Nathaniel and Khan [71] scrutinized the nexus between environmental degradation, economic output, and REC energy in the ASEAN countries using a dataset from 1990 to 2016. Their empirical study showed that REC declines the ecological footprint, and income contributes to environmental degradation. In the case study of European Union countries, Alola et al. [17] also discovered a negative interaction between GDP and EFP as well as a positive interaction between renewable energy and environmental sustainability using a PMG model over the period from 1997 to 2014. In the case of Turkey, Sharif et al. [72] reported that renewable energy is negatively related to EFP in the long run. Also, the findings indicated that GDP boosts environmental degradation both in the short-run and long-run. Additionally, Radmehr et al. [73] evaluated the nexus between environmental quality, growth, and REC in the context of a spatial econometrics model by using data from 1995 to 2014. They found out that the nexus between EFP and income, and between REC and output is bidirectional. Moreover, the results also confirmed that the link between REC and environmental degradation is unidirectional. Çakmak and Acar [74] employed a GMM panel data model and panel causality analysis to examine the link between REC, growth, and ecological footprint in most oil-producing countries. They conclude that economic output positively influences environmental degradation while REC is not a cause of environmental degradation. A summary of the literature is presented in Table 1.
However, the growing body of research literature indicates that the focus of existing studies is on examining the one-way relationship between the variables of concern and there is a deep research gap in providing a comprehensive analysis that simultaneously evaluates the relationship between the three variables using an efficient econometric tool that can address the endogeneity problem of these variables. Hence, the study aims to fill this research gap by investigating the nexus among the renewable energy consumption, ecological footprint, and economic growth using a simulations equation model in G7 countries.

3. Materials and Methods

3.1. Data

The data that were employed for econometric analysis covers the period 1990–2018 and the G7 countries, namely Canada, France, Germany, Italy, Japan, the United Kingdom (UK), and the United States (USA). The study period was selected based on availability of all the data series. The data that were used in this research were collected from sources of the World Development Indicators (WDI), FRED economic data, Global Footprint Network, Penn World Table version 10.0 (PWT 10.0), and collected from the KOF Globalization Index. Details about research variables and data sources are presented in Table 2. Gross domestic product (GDP) is proxied as economic growth. Oil price (OIL) is considered as a proxy of non-renewable energy prices. In addition, the KOF globalization index is proxied as globalization in the study. Figure 1 depicts a research variable distribution overlay and scatter plot.

3.2. Econometric Approaches

The purpose of this research is to examine the nexus of renewable energy-ecological footprint-economic growth in G7 countries. These three variables are in fact, endogenous. Due to the endogeneity problem, in this case, using traditional single-equation regression analysis to estimate the complex relationship between these three variables may result in biased parameter estimates that render the results of the regression analysis invalid [73,75]. To obtain reliable results, the simultaneous equations (SE) model was used in this study to investigate the complex relationship between these three variables in G7 countries. In this research, to evaluate the impact of three variables of globalization (economic, social, and financial globalization) on the variables of concern, three groups of equations were considered, which will be introduced in the rest of this section.
Based on the theoretical insight of previous studies, the following SE model (Equations (1)–(3)) was developed to explore the income, renewable energy, and environmental quality nexus by considering the social globalization and human capital. It is worth noting that the results of simple linear specification do not appear to produce consistent results. Hence, to address this issue, we employed the log-linear form to examine the nexus of three series.
L n R E C i t = ω 0 + ω 1 i L n E F P i t + ω 2 i L n G D P i t + ω 3 i L n O I L i t + ω 4 i L n S G i t + ω 5 i L n H C i t + ω 6 i L n T O i t
L n E F P i t = λ 0 + λ 1 i L n R E C i t + λ 2 i L n G D P i t + λ 3 i L n N R R i t + λ 4 i L n S G i t + λ 5 i L n H C i t + λ 6 i L n T O i t
L n G D P i t = α 0 + α 1 i L n E F P i t + α 2 i L n R E C i t + α 3 i L n G F C F i t + α 4 i L n S G i t + α 5 i L n H C i t + α 6 i L n T O i t
where the subscripts i = 1, …, 7 shows country, t = 1990, …, 2018 indicates the time period, L n R E C i t , L n E F P i t , and L n G D P i t are renewable energy, ecological footprint, and economic output, respectively. These three variables were considered as endogenous variables. L n O I L i t denotes the oil prices, L n S G i t is social globalization, L n H C i t represents human capital, L n T O i t refers trade openness, L n N R R i t is natural resources rents, and L n G F C F i t denotes capital stock.
Equation (1) investigates the impact of ecological footprint, economic growth, and other variables on renewable energy. Nathaniel and Khan [71] argue that there is a one-way causality from ecological footprint EFP to renewable energy. Radmehr et al. [73] found that the economic growth contributes positively to REC. Hence, it can be expected that the economic growth has a significant contribution to the promotion of REC. Another variable that was taken into account in this study is the oil price. In fact, the price of oil as a proxy for the price of nonrenewable energy can have a positive effect on REC [76]. Social globalization is one of the key explanatory variables that was included in this study. Human capital is likely to increase the REC [77]. Zhang et al. [78] emphasized that trade openness can be an important determinant of REC. Therefore, it is expected that this variable has a positive effect on the REC.
Equation (2) examines the impact of renewable energy, economic growth, and other explanatory variables on ecological footprint. The review of the research literature shows that renewable energy is one of the variables affecting the ecological footprint, so this variable is expected to have an adverse effect on EFP [79]. Ahmad et al. [50] claimed that economic growth is an important and effective variable on ecological footprint. Therefore, an increase in this variable will likely result in increased environmental degradation. Natural resource rents as one of the influencing variables on the environmental degradation is expected to have a positive connection with the EFP [50]. The influence of social globalization on the EFP is also considered in this equation, which has been rarely addressed in earlier studies. According to Langnel et al. [80], human capital has a considerable effect on enhancing environmental quality; hence the effect of this variable on the ecological footprint is expected to be negative. Trade openness is likely to mitigate the ecological footprint [81].
Equation (3) examines the impact of REC, ecological footprint, and other variables on the income. According to a review of the research literature, few studies have examined the effects of EFP on economic output. However, given that environmental degradation can have negative externalities on countries, we can expect the coefficient of this variable to be negative. Radmehr et al. [73] confirmed that an increase in the REC can lead to economic growth, so this variable is likely to have a positive impact on GDP. The capital stock is also considered as one of the main explanatory variables in this study, with a positive expected effect. Social globalization is one of the key explanatory variables that was included in the equation. Matousek and Tzeremes [82] claimed that the human capital has a positive impact on income, so the variable is likely to have a positive impact on dependent variables. Trade openness is another explanatory variable that is expected to promote GDP.
Equations (4)–(6) examine the nexus between REC, EFP, and GDP in a simultaneous equations framework. In these equations, the effect of the economic globalization variable along with other explanatory variables on the variables of concern is evaluated.
L n R E C i t = β 0 + β 1 i L n E F P i t + β 2 i L n G D P i t + β 3 i L n O I L i t + β 4 i L n E G i t + β 5 i L n H C i t + β 6 i L n T O i t
L n E F P i t = φ 0 + φ 1 i L n R E C i t + φ 2 i L n G D P i t + φ 3 i L n N R R i t + φ 4 i L n E G i t + φ 5 i L n H C i t + φ 6 i L n T O i t
L n G D P i t = σ 0 + σ 1 i L n E F P i t + σ 2 i L n R E C i t + σ 3 i L n G F C F i t + σ 4 i L n E G i t + σ 5 i L n H C i t + σ 6 i L n T O i t
Equations (7)–(9) investigate REC, EFP, and GDP nexus in a simultaneous equations framework. In these equations, the effect of the financial globalization variable along with other explanatory variables on the variables of concern is assessed.
L n R E C i t = Υ 0 + Υ 1 i L n E F P i t + Υ 2 i L n G D P i t + Υ 3 i L n O I L i t + Υ 4 i L n F G i t + Υ 5 i L n H C i t + Υ 6 i L n T O i t
L n E F P i t = ρ 0 + ρ 1 i L n R E C i t + ρ 2 i L n G D P i t + ρ 3 i L n N R R i t + ρ 4 i L n F G i t + ρ 5 i L n H C i t + ρ 6 i L n T O i t
L n G D P i t = µ 0 + µ 1 i L n E F P i t + µ 2 i L n R E C i t + µ 3 i L n G F C F i t + µ 4 i L n F G i t + µ 5 i L n H C i t + µ 6 i L n T O i t

3.3. The Estimation Method

The GMM is defined as an estimation technique that is frequently employed in estimating econometric models to investigate multiple-way linkages between variables. In the presence of heteroscedasticity, the coefficients that are estimated by this method are consistent and efficient [73]. The Hansen test was used to analyze the overidentifying constraints and provide some evidence of the validity of the instrumental variables. The null hypothesis of this test is that the used instrumental variables are acceptable. In the present study, we used the GMM to evaluate the three-way relationship between REC, EFP, and income in the G7 countries from 1980 to 2018. Applying the GMM approach in the context of panel data can provide a comprehensive analysis of the linkage between the variables of concern despite the limitation of data access. In addition, this method also addresses the issue of endogeneity of some independent variables [75].

4. Results

4.1. Renewable Energy

In this study, we applied the panel GMM approach to investigate the connection between REC, ecological footprint, and income while accounting for globalization and human capital in G7 economics. Based on the model specification as indicted in Equations (1)–(9), the estimated results are presented in Table 3, Table 4 and Table 5. First, Table 3 displays the results based on Equations (1), (4) and (7) where renewable energy is the dependent variable. For each of the models, globalization indicators are varied to ascertain their mitigation roles. The result, therefore, suggests that GDP exerts a positive influence on REC under all three models. Thus, a percentage increase in economic growth would account for between a 1.25% and 1.80% increase in REC in G7 countries. However, the estimated elasticity is greater under Model 3 when financial globalization is taken into consideration. This result agrees with Omri et al. [76] and Tiba and Belaid [83], but contradicts Alam and Murad [84]. Second, the result suggests that renewable energy consumption responds negatively to ecological footprint under all three models. However, the magnitude of impact varies across the three models with the highest impact recorded under Model 1 when social globalization considered. Specifically, a percentage increase in the ecological footprint would account for between a 2.28% and 2.85% decrease in REC at the 1% level of significance. The result confirms the findings of Liu et al. [85]. Third, oil prices relate positively to renewable energy consumption only under Model 1 at a 1% level of significance when social governance is taken into account. Specifically, a percentage change in oil prices will cause an increase in REC by 0.19%. Further, the results reveal that human capital index and trade openness exert a positive impact on renewable energy consumption under all three models. Interpretively, a percentage increase in human capital index and trade openness would lead to between 2.88% and 4.49% and 0.67% and 1.33%, respectively. With regards the globalization indicators, the results indicate that social, economic, and financial globalization relates negatively to renewable energy consumption in Model 1, 2, and 3, respectively. Interpretively, a percentage change in social, economic, and financial globalization would reduce renewable energy consumption by 2.96%, 1.04%, and 1.78%, respectively.

4.2. Ecological Footprint

Table 4 presents the results from the GMM estimation procedure based on Equations (2), (5), and (8) (i.e., Models 1, 2, and 3). The elasticity estimates are based on the ecological footprint vis a vis income, REC, total resource rent, globalization indicators, human capital index, and trade openness. A cursory inspection of the results reveals that all except social and economic globalization are statistically significant. Specifically, the results reveal that economic growth positively influences ecological footprint under all three models albeit at different magnitudes. Thus, a percentage change in economic growth would account for between 0.29% and 0.35% increase in ecological footprint, signaling a deterioration in environmental quality. This result agrees with Abid et al. [86], Huang et al. [87], and Mehmood [88] who found a decreasing effect on environmental quality via an increase in the ecological footprint. As indicated by Sarkodie and Strezov [89], the environmental deterioration effect of income may be attributed to the effect of traditional technologies on economic productivity through a reduction in energy efficiency. Also, the result reveals that REC exerts a statistically significant negative effect on ecological footprint across all three models. This implies that an increase in the REC by 1% would correspond to a decrease in EFP by 0.29% to 0.25%. This result agrees with Adebayo et al. [90]. Further, the estimated elasticities suggest that total resource rent exerts a positive impact on the ecological footprint across all three models. Further, the estimated elasticity for the total natural resource depicts a positive connection with ecological footprint for all three models. Specifically, percentage increase in natural resources rent would cause a 0.08% increase in EFP across all the models, implying that the total natural resource aggravates environmental pollution. This result confirms the findings of Ahmad et al. [50] but contradicts those of Caglar et al. [91]. Additionally, the result reveals that while human capital index mitigates ecological footprint under all the three models [87,92,93], trade openness improves environmental quality by reducing EFP under two models (i.e., Models 1 and 2) [94,95]. Indeed, the result implies that human capital index and trade openness causes between 0.57% and 0.78% and 0.10 and 0.13% decline in the ecological footprint with every percentage change in each of the former variables. Finally, with regards to the globalization indicators, the results reveal that only financial globalization is statistically significant with a mitigating effect on EFP. This indicates that a percentage increase in financial globalization would account for 0.1% decline in ecological footprint.
Table 4. Panel GMM outputs for Equations (2), (5) and (8).
Dependent Variable (EFP)Model 1Model 2Model 3
Coef.Std. Err.Coef.Std. Err.Coef.Std. Err.
Constant0.4980.5450.4790.663−0.0540.628
LnGDP0.325 ***0.0700.289 ***0.0750.349 ***0.072
LnREC−0.102 ***0.010−0.100 ***0.011−0.110 ***0.012
LnNRR0.079 ***0.0090.080 ***0.0090.081 ***0.009
LnSG−0.1720.162----
LnEG--0.00050.086--
LnFG----−0.100 *0.058
LnHC−0.567 **0.264−0.778 ***0.190−0.670 ***0.183
LnTO−0.095 ***0.040−0.123 **0.059−0.0630.046
Wald chi2 (p-value)0.000-0.000-0.000-
Hansen test (p-value)0.148-0.176-0.203-
Note: *, ** and *** show rejection of the unit root hypothesis at the 10%, 5% and 1% significance levels, respectively.

4.3. Economic Growth

Table 5 represents the estimated results based on Equations (3), (6), and (9). The estimated elasticities are based on the economic impact of our variables of interest in G7 countries. First, ecological footprint exerts a positive impact on income under the three models at a 10% level of significance. This shows that ecological footprint boosts economic growth by increasing the GDP of G7 countries. This result agrees with Udemba [96] and Akinlo and Dada [97]. As expected, and in tandem with the literature on renewable energy, our finding indicates a positive impact of REC on GDP. Thus, a percentage increase in REC corresponds to between a 0.02% and 0.03% increases in economic growth [98,99,100,101]. Further, capital stock is found to be significant for all three models. Specifically, a percentage change in capital stock will account for between 0.37% and 0.38% increase in income. Similarly, TOP is found to exert a positive impact on income, implying that a 1% change in TOP would correspond to between a 0.15% and 0.18% increase in income [102,103]. On the contrary, human capital index promotes economic growth only under Model 3 when financial globalization is taken into account. In line with our result, Shittu et al. [104] observed that human capital index exerts both a positive and negative effect on economic growth, although the negative impact was found to be dominant. On the contrary, Karambakuwa et al. [105] found no statistically significant effect between human capital and economic growth. Finally, the globalization indicators reveal that both social globalization and economic globalization exert a significant positive effect on income at the 1% and 10% significance levels.
Table 5. Panel GMM outputs for Equations (3), (6), and (9).
Dependent Variable (GDP)Model 1Model 2Model 3
Coef.Std. Err.Coef.Std. Err.Coef.Std. Err.
Constant−15.141 ***0.321−14.697 ***0.377−14.846 ***0.360
LnEFP0.092 *0.0500.085 *0.0480.082 *0.049
LnREC0.023 ***0.0070.024 ***0.0070.025 ***0.008
LnGFCF0.374 ***0.0140.376 ***0.0150.383 ***0.015
LnSG0.244 ***0.078----
LnEG--0.075 *0.043--
LnFG----0.0360.029
LnHC−0.0900.1370.1600.1030.190 **0.098
LnTO0.157 ***0.0200.151 ***0.0320.176 ***0.025
Wald chi2 (p-value)0.000-0.000-0.000-
Hansen test (p-value)0.702-0.646-0.714-
Note: *, ** and *** show rejection of the unit root hypothesis at the 10%, 5% and 1% significance levels, respectively.
To get a better perspective on the association between our variables of interest, the authors performed the Dumitrescu and Hurlin Granger non-causality tests, and the results are shown in Table 6. The findings indicate the presence of both unidirectional and bidirectional causal effects between the study variables. For instance, while a bidirectional nexus is found between EFP and GDP, REC and GDP, and globalization indicators and GDP, a unidirectional effect is recorded between OIL and REC, FG and REG, EG and EFP, and TO and EFP.
Figure 2 summarizes the results that were obtained from the simultaneous equations model as well as the panel causality test. Based on this figure, there is a two-way linkage between income and REC. The findings confirm a bidirectional relationship between GDP and EFP. Similarly, there is a two-way relationship between REC and EFP.

4.4. Impulse Response Function

Although the GMM method produces reliable results for assessing the relationship between GDP, EFP, and REC, these methods do not give details about how variables respond dynamically to a single shock from other variables [106,107]. To address this issue, we applied the accumulated impulse response function (IRF). The impulse responses of GDP, renewable energy, and ecological footprint to each other are presented in Figure 3.
The findings indicate that a positive shock within REC results in higher economic growth in the short- and long-term. In terms of an REC shock, it was found that the ecological footprint response is negative in both the short- and long-term. The reaction of REC is negative due to a shock in GDP and its sign does not change in the long-run. The reaction of ecological footprint to GDP shocks is positive in the long- and short-run. The reaction of income to a shock in ecological footprint is insignificant in the short-run and becomes positive after the two years. One can also observe that the REC responds negatively to the shock of EFP in the long-run, while the response of this variable to positive one SD shock within ecological footprint is insignificant in the short-run.

5. Conclusions and Policy Implications

While there has been an increase in the literature on renewable energy-ecological footprint-GDP for single countries and panels of countries in recent years, no study has investigated the nexus of EFP, REC, and income using a simultaneous equations model. Hence, the study aims to fill this research gap by examining the nexus among the variables of concern for G7 countries from 1990 to 2018.
The following is a summary of the research findings and corresponding policy implications.
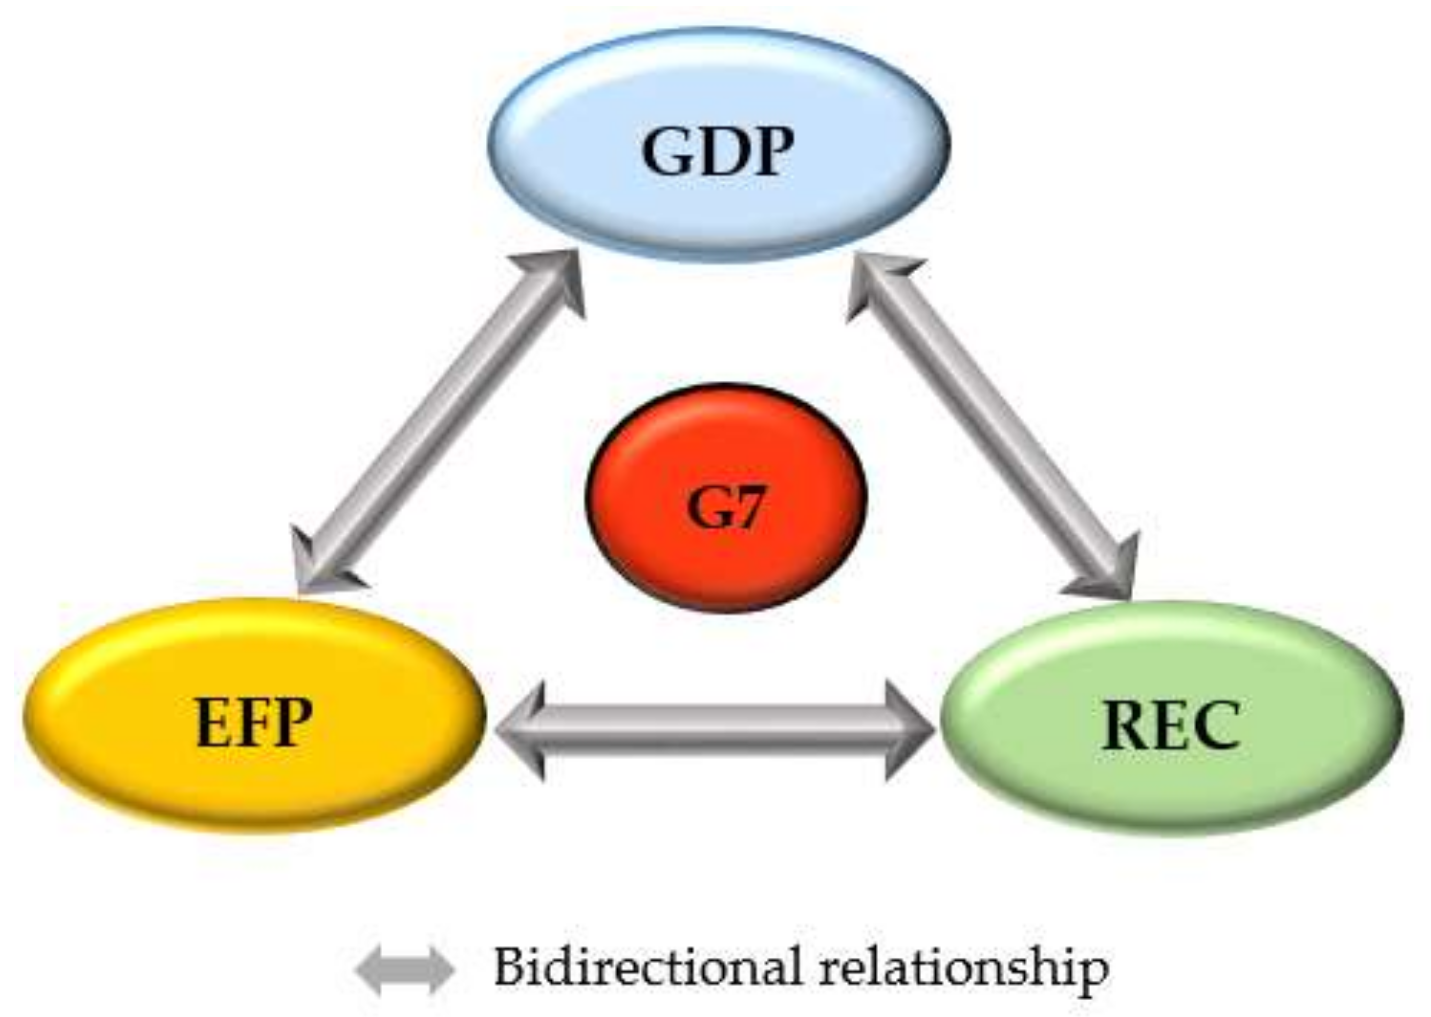
  • This study’s findings confirm a two-way relationship between income and REC. The findings show that REC positively and significantly influences economic growth in the G7 nations, although its impact is lower compared to other variables. These findings show that this kind of energy is not utilized effectively in this group of nations. Therefore, to achieve sustainable economic growth, policymakers should support universities and scientific centers to improve the efficiency of renewable energy consumption.
  • Our empirical findings also demonstrate that there is a unidirectional connection between income and ecological degradation. According to the findings of this study, environmental degradation is significantly and positively impacted by economic output. The reason for this result is most likely the G7 countries’ rapid economic development over the last few decades, which has resulted in the excessive use of natural resources and environmental destruction.
  • It is found that the linkage between REC and EFP is two-way. These findings, to the best of our knowledge, are novel and have not been investigated in any other study. The findings confirm that an increase in the REC causes a reduction in environmental degradation. We recommend that policymakers implement effective policies to enhance incentives for renewable energy consumption. This would reduce the severity of environmental degradation while also ensuring environmental sustainability.
  • According to the findings of the study, trade openness is positively and significantly connected with REC and economic growth, which could contribute to reducing environmental deterioration. Trade openness enables the G7 countries to benefit from the transfer of green technologies among countries, and also provides an opportunity to attract additional capital in the clean energy sector. The policymakers of these group countries should employ the avenue of international trade as an effective way to promote environmental sustainability.
  • The findings of this study revealed that an increase in the price of non-renewable energy has a positive effect on increasing REC. Therefore, policies that raise the cost of using non-renewable energy can be considered by policymakers as an economic tool for increasing the consumption of renewable energy and improving environmental quality.
The present study highlights the nexus between economic growth-environmental degradation-renewable energy consumption at the economic group level. Future studies can analyze these links at the national level to implement policies that are specific to each country.

Author Contributions

Conceptualization, R.R. and S.S.; methodology, R.R. and S.S.; software, R.R. and S.S.; validation, R.R., S.S., E.B.A., E.K.O., E.J. and M.J.; formal analysis, R.R. and S.S.; investigation, R.R. and S.S.; data curation, R.R. and S.S.; writing—original draft preparation, R.R., S.S., E.B.A. and E.K.O.; writing—review and editing, R.R., S.S., E.B.A., E.K.O., E.J. and M.J., supervision, R.R.; project administration, M.J.; funding acquisition, E.J. All authors have read and agreed to the published version of the manuscript.

Funding

This research received no external funding.

Institutional Review Board Statement

Not applicable.

Informed Consent Statement

Not applicable.

Data Availability Statement

Not applicable.

Conflicts of Interest

The authors declare no conflict of interest.

References

  1. Mirza, F.M.; Kanwal, A. Energy consumption, carbon emissions and economic growth in Pakistan: Dynamic causality analysis. Renew. Sustain. Energy Rev. 2017, 72, 1233–1240. [Google Scholar] [CrossRef]
  2. Hezareh, R.; Shayanmehr, S.; Darbandi, E.; Schieffer, J. Energy Consumption and Environmental Pollution: Evidence from the Spatial Panel Simultaneous-Equations Model of Developing Countries; Southern Agricultural Economics Association (SAEA): Birmingham, AL, USA, 2017. [Google Scholar]
  3. Rudolph, A.; Figge, L. Determinants of ecological footprints: What is the role of globalization? Ecol. Indic. 2017, 81, 348–361. [Google Scholar] [CrossRef]
  4. Polcyn, J.; Us, Y.; Lyulyov, O.; Pimonenko, T.; Kwilinski, A. Factors influencing the renewable energy consumption in selected european countries. Energies 2021, 15, 108. [Google Scholar] [CrossRef]
  5. Banday, U.J.; Aneja, R. Energy consumption, economic growth and CO2 emissions: Evidence from G7 countries. World J. Sci. Technol. Sustain. Dev. 2018, 16, 22–39. [Google Scholar] [CrossRef]
  6. Pata, U.K.; Hizarci, A.E. Investigating the environmental Kuznets curve in the five most complex countries: Insights from a modified ecological footprint model. Energy Environ. 2022, 0958305X221120255. [Google Scholar] [CrossRef]
  7. Gyamfi, B.A.; Bein, M.A.; Adedoyin, F.F.; Bekun, F.V. To what extent are pollutant emission intensified by international tourist arrivals? Starling evidence from G7 Countries. Environ. Dev. Sustain. 2022, 24, 7896–7917. [Google Scholar] [CrossRef]
  8. Zhang, W.; Wang, Z.; Adebayo, T.S.; Altuntaş, M. Asymmetric linkages between renewable energy consumption, financial integration, and ecological sustainability: Moderating role of technology innovation and urbanization. Renew. Energy 2022, 197, 1233–1243. [Google Scholar] [CrossRef]
  9. Ahmed, Z.; Le, H.P.; Shahzad, S.J.H. Toward environmental sustainability: How do urbanization, economic growth, and industrialization affect biocapacity in Brazil? Environ. Dev. Sustain. 2021, 24, 11676–11696. [Google Scholar] [CrossRef]
  10. Sadiq, M.; Shinwari, R.; Usman, M.; Ozturk, I.; Maghyereh, A.I. Linking nuclear energy, human development and carbon emission in BRICS region: Do external debt and financial globalization protect the environment? Nucl. Eng. Technol. 2022, 54, 3299–3309. [Google Scholar]
  11. He, R.; Luo, L.; Shamsuddin, A.; Tang, Q. Corporate carbon accounting: A literature review of carbon accounting research from the Kyoto Protocol to the Paris Agreement. Account. Financ. 2022, 62, 261–298. [Google Scholar] [CrossRef]
  12. Dogan, E.; Chishti, M.Z.; Alavijeh, N.K.; Tzeremes, P. The roles of technology and Kyoto Protocol in energy transition towards COP26 targets: Evidence from the novel GMM-PVAR approach for G-7 countries. Technol. Forecast. Soc. Chang. 2022, 181, 121756. [Google Scholar]
  13. Khan, S.A.R.; Godil, D.I.; Yu, Z.; Abbas, F.; Shamim, M.A. Adoption of renewable energy sources, low-carbon initiatives, and advanced logistical infrastructure—A step toward integrated global progress. Sustain. Dev. 2022, 30, 275–288. [Google Scholar] [CrossRef]
  14. Liang, C.; Umar, M.; Ma, F.; Huynh, T.L. Climate policy uncertainty and world renewable energy index volatility forecasting. Technol. Forecast. Soc. Chang. 2022, 182, 121810. [Google Scholar] [CrossRef]
  15. Aleluia, J.; Tharakan, P.; Chikkatur, A.; Shrimali, G.; Chen, X. Accelerating a clean energy transition in Southeast Asia: Role of governments and public policy. Renew. Sustain. Energy Rev. 2022, 159, 112226. [Google Scholar]
  16. Qiao, W.; Li, Z.; Liu, W.; Liu, E. Fastest-growing source prediction of US electricity production based on a novel hybrid model using wavelet transform. Int. J. Energy Res. 2022, 46, 1766–1788. [Google Scholar]
  17. Alola, A.A.; Bekun, F.V.; Sarkodie, S.A. Dynamic impact of trade policy, economic growth, fertility rate, renewable and non-renewable energy consumption on ecological footprint in Europe. Sci. Total Environ. 2019, 685, 702–709. [Google Scholar]
  18. Leonard, A.; Ahsan, A.; Charbonnier, F.; Hirmer, S. The resource curse in renewable energy: A framework for risk assessment. Energy Strategy Rev. 2022, 41, 100841. [Google Scholar] [CrossRef]
  19. Rockström, J.; Gaffney, O.; Rogelj, J.; Meinshausen, M.; Nakicenovic, N.; Schellnhuber, H.J. A roadmap for rapid decarbonization. Science 2017, 355, 1269–1271. [Google Scholar]
  20. Böhringer, C.; Cuntz, A.; Harhoff, D.; Asane-Otoo, E. The impact of the German feed-in tariff scheme on innovation: Evidence based on patent filings in renewable energy technologies. Energy Econ. 2017, 67, 545–553. [Google Scholar] [CrossRef]
  21. Shrimali, G.; Konda, C.; Farooquee, A.A. Designing renewable energy auctions for India: Managing risks to maximize deployment and cost-effectiveness. Renew. Energy 2016, 97, 656–670. [Google Scholar]
  22. Chang, T.; Gupta, R.; Inglesi-Lotz, R.; Simo-Kengne, B.; Smithers, D.; Trembling, A. Renewable energy and growth: Evidence from heterogeneous panel of G7 countries using Granger causality. Renew. Sustain. Energy Rev. 2015, 52, 1405–1412. [Google Scholar]
  23. Paramati, S.R.; Mo, D.; Gupta, R. The effects of stock market growth and renewable energy use on CO2 emissions: Evidence from G20 countries. Energy Econ. 2017, 66, 360–371. [Google Scholar] [CrossRef]
  24. Shahbaz, M.; Khan, S.; Ali, A.; Bhattacharya, M. The impact of globalization on CO2 emissions in China. Singap. Econ. Rev. 2017, 62, 929–957. [Google Scholar] [CrossRef]
  25. Jakob, M. Globalization and climate change: State of knowledge, emerging issues, and policy implications. Wiley Interdiscip. Rev. Clim. Chang. 2022, 13, e771. [Google Scholar] [CrossRef]
  26. Acheampong, A.O. The impact of de facto globalization on carbon emissions: Evidence from Ghana. Int. Econ. 2022, 170, 156–173. [Google Scholar] [CrossRef]
  27. Acheampong, A.O.; Adams, S.; Boateng, E. Do globalization and renewable energy contribute to carbon emissions mitigation in Sub-Saharan Africa? Sci. Total Environ. 2019, 677, 436–446. [Google Scholar] [CrossRef] [PubMed]
  28. Onifade, S.T.; Erdoğan, S.; Alagöz, M.; Bekun, F.V. Renewables as a pathway to environmental sustainability targets in the era of trade liberalization: Empirical evidence from Turkey and the Caspian countries. Environ. Sci. Pollut. Res. 2021, 28, 41663–41674. [Google Scholar] [CrossRef]
  29. Yuping, L.; Ramzan, M.; Xincheng, L.; Murshed, M.; Awosusi, A.A.; Bah, S.I.; Adebayo, T.S. Determinants of carbon emissions in Argentina: The roles of renewable energy consumption and globalization. Energy Rep. 2021, 7, 4747–4760. [Google Scholar] [CrossRef]
  30. Forichon, K. Considering human capital in a multidimensional analysis of fragility. In OECD Development Co-operation Working Papers; OECD Publishing: Berlin, Germany, 2020; pp. 1–51. [Google Scholar]
  31. Gleeson, T.; Cuthbert, M.; Ferguson, G.; Perrone, D. Global groundwater sustainability, resources and systems in the Anthropocene. Annu. Rev. Earth Planet. Sci. 2020, 48, 431–463. [Google Scholar] [CrossRef]
  32. Ahmed, Z.; Asghar, M.M.; Malik, M.N.; Nawaz, K. Moving towards a sustainable environment: The dynamic linkage between natural resources, human capital, urbanization, economic growth, and ecological footprint in China. Resour. Policy 2020, 67, 101677. [Google Scholar] [CrossRef]
  33. Azam, M. Relationship between energy, investment, human capital, environment, and economic growth in four BRICS countries. Environ. Sci. Pollut. Res. 2019, 26, 34388–34400. [Google Scholar] [CrossRef] [PubMed]
  34. Ahmed, Z.; Wang, Z. Investigating the impact of human capital on the ecological footprint in India: An empirical analysis. Environ. Sci. Pollut. Res. 2019, 26, 26782–26796. [Google Scholar] [CrossRef] [PubMed]
  35. Ahmed, Z.; Zafar, M.W.; Ali, S. Linking urbanization, human capital, and the ecological footprint in G7 countries: An empirical analysis. Sustain. Cities Soc. 2020, 55, 102064. [Google Scholar] [CrossRef]
  36. Li, X.; Xiao, L.; Tian, C.; Zhu, B.; Chevallier, J. Impacts of the ecological footprint on sustainable development: Evidence from China. J. Clean. Prod. 2022, 352, 131472. [Google Scholar] [CrossRef]
  37. Alvarado, R.; Deng, Q.; Tillaguango, B.; Méndez, P.; Bravo, D.; Chamba, J.; Alvarado-Lopez, M.; Ahmad, M. Do economic development and human capital decrease non-renewable energy consumption? Evidence for OECD countries. Energy 2021, 215, 119147. [Google Scholar] [CrossRef]
  38. Bayulgen, O. Localizing the energy transition: Town-level political and socio-economic drivers of clean energy in the United States. Energy Res. Soc. Sci. 2020, 62, 101376. [Google Scholar] [CrossRef]
  39. Kirschbaum, B.; Soretz, S. Human Capital, Pollution Control, and Endogenous Growth; Beiträge zur Jahrestagung des Vereins für Socialpolitik 2017: Alternative Geld- und Finanzarchitekturen—Session: Growth, No. G08-V1; Leibniz Information Center for Economics: Leibniz, Austria, 2017; pp. 1–17. [Google Scholar]
  40. Sarkodie, S.A.; Adams, S.; Owusu, P.A.; Leirvik, T.; Ozturk, I. Mitigating degradation and emissions in China: The role of environmental sustainability, human capital and renewable energy. Sci. Total Environ. 2020, 719, 137530. [Google Scholar] [CrossRef]
  41. Bilgili, F.; Ulucak, R.; Koçak, E.; İlkay, S.Ç. Does globalization matter for environmental sustainability? Empirical investigation for Turkey by Markov regime switching models. Environ. Sci. Pollut. Res. 2020, 27, 1087–1100. [Google Scholar] [CrossRef]
  42. Barroso, G.C.; Abril, G.; Machado, W.; Abuchacra, R.C.; Peixoto, R.B.; Bernardes, M.; Marques, G.S.; Sanders, C.J.; Oliveira, G.B.; de Oliveira Filho, S.R. Linking eutrophication to carbon dioxide and methane emissions from exposed mangrove soils along an urban gradient. Sci. Total Environ. 2022, 850, 157988. [Google Scholar] [CrossRef]
  43. Chaudhry, I.S.; Yusop, Z.; Habibullah, M.S. Financial inclusion-environmental degradation nexus in OIC countries: New evidence from environmental Kuznets curve using DCCE approach. Environ. Sci. Pollut. Res. 2022, 29, 5360–5377. [Google Scholar] [CrossRef]
  44. Cornes, C. Effectiveness of Urban Mobility Management Plans to Improve Air Quality. Master’s Thesis, Universitat Politècnica de Catalunya, Barcelona, Spain, 2016. [Google Scholar]
  45. Negussie, E.; de Haas, Y.; Dehareng, F.; Dewhurst, R.; Dijkstra, J.; Gengler, N.; Morgavi, D.; Soyeurt, H.; van Gastelen, S.; Yan, T. Invited review: Large-scale indirect measurements for enteric methane emissions in dairy cattle: A review of proxies and their potential for use in management and breeding decisions. J. Dairy Sci. 2017, 100, 2433–2453. [Google Scholar] [CrossRef] [PubMed]
  46. Shayanmehr, S.; Rastegari Henneberry, S.; Sabouhi, M.; Shahnoushi Foroushani, N. Climate change and sustainability of crop yield in dry regions food insecurity. Sustainability 2020, 12, 9890. [Google Scholar] [CrossRef]
  47. Koseoglu, A.; Yucel, A.G.; Ulucak, R. Green innovation and ecological footprint relationship for a sustainable development: Evidence from top 20 green innovator countries. Sustain. Dev. 2022, 1, 1–13. [Google Scholar] [CrossRef]
  48. Danish, H.S.; Baloch, M.; Mahmood, N.; Zhang, J. Linking economic growth and ecological footprint through human capital and biocapacity. Sustain. Cities Soc. 2019, 47, 101516. [Google Scholar] [CrossRef]
  49. Hussain, H.I.; Haseeb, M.; Kamarudin, F.; Dacko-Pikiewicz, Z.; Szczepańska-Woszczyna, K. The role of globalization, economic growth and natural resources on the ecological footprint in Thailand: Evidence from nonlinear causal estimations. Processes 2021, 9, 1103. [Google Scholar] [CrossRef]
  50. Ahmad, M.; Jiang, P.; Majeed, A.; Umar, M.; Khan, Z.; Muhammad, S. The dynamic impact of natural resources, technological innovations and economic growth on ecological footprint: An advanced panel data estimation. Resour. Policy 2020, 69, 101817. [Google Scholar] [CrossRef]
  51. Ikram, M.; Xia, W.; Fareed, Z.; Shahzad, U.; Rafique, M.Z. Exploring the nexus between economic complexity, economic growth and ecological footprint: Contextual evidences from Japan. Sustain. Energy Technol. Assess. 2021, 47, 101460. [Google Scholar] [CrossRef]
  52. Udemba, E.N. A sustainable study of economic growth and development amidst ecological footprint: New insight from Nigerian Perspective. Sci. Total Environ. 2020, 732, 139270. [Google Scholar] [CrossRef]
  53. Addai, K.; Serener, B.; Kirikkaleli, D. Empirical analysis of the relationship among urbanization, economic growth and ecological footprint: Evidence from Eastern Europe. Environ. Sci. Pollut. Res. 2022, 29, 27749–27760. [Google Scholar] [CrossRef]
  54. Akram, R.; Chen, F.; Khalid, F.; Ye, Z.; Majeed, M.T. Heterogeneous effects of energy efficiency and renewable energy on carbon emissions: Evidence from developing countries. J. Clean. Prod. 2020, 247, 119122. [Google Scholar] [CrossRef]
  55. Ozcan, B.; Tzeremes, P.G.; Tzeremes, N.G. Energy consumption, economic growth and environmental degradation in OECD countries. Econ. Model. 2020, 84, 203–213. [Google Scholar] [CrossRef]
  56. Mrabet, Z.; AlSamara, M.; Hezam Jarallah, S. The impact of economic development on environmental degradation in Qatar. Environ. Ecol. Stat. 2017, 24, 7–38. [Google Scholar] [CrossRef]
  57. Imamoglu, H. Is the informal economic activity a determinant of environmental quality? Environ. Sci. Pollut. Res. 2018, 25, 29078–29088. [Google Scholar] [CrossRef] [PubMed]
  58. Baz, K.; Xu, D.; Ali, H.; Ali, I.; Khan, I.; Khan, M.M.; Cheng, J. Asymmetric impact of energy consumption and economic growth on ecological footprint: Using asymmetric and nonlinear approach. Sci. Total Environ. 2020, 718, 137364. [Google Scholar] [CrossRef]
  59. Wang, S.; Li, Q.; Fang, C.; Zhou, C. The relationship between economic growth, energy consumption, and CO2 emissions: Empirical evidence from China. Sci. Total Environ. 2016, 542, 360–371. [Google Scholar] [CrossRef] [PubMed]
  60. Kasman, A.; Duman, Y.S. CO2 emissions, economic growth, energy consumption, trade and urbanization in new EU member and candidate countries: A panel data analysis. Econ. Model. 2015, 44, 97–103. [Google Scholar] [CrossRef]
  61. Ivanovski, K.; Hailemariam, A.; Smyth, R. The effect of renewable and non-renewable energy consumption on economic growth: Non-parametric evidence. J. Clean. Prod. 2021, 286, 124956. [Google Scholar] [CrossRef]
  62. Bulut, U.; Shahbaz, M.; Vo, X.V. Renewable energy-economic growth nexus revisited for the USA: Do different approaches for modeling structural breaks lead to different findings? Environ. Sci. Pollut. Res. 2022, 29, 30134–30144. [Google Scholar] [CrossRef]
  63. Inglesi-Lotz, R. The impact of renewable energy consumption to economic growth: A panel data application. Energy Econ. 2016, 53, 58–63. [Google Scholar] [CrossRef]
  64. Apergis, N.; Payne, J.E. Renewable energy consumption and economic growth: Evidence from a panel of OECD countries. Energy Policy 2010, 38, 656–660. [Google Scholar] [CrossRef]
  65. Sadorsky, P. Renewable energy consumption and income in emerging economies. Energy Policy 2009, 37, 4021–4028. [Google Scholar] [CrossRef]
  66. Shahbaz, M.; Loganathan, N.; Zeshan, M.; Zaman, K. Does renewable energy consumption add in economic growth? An application of auto-regressive distributed lag model in Pakistan. Renew. Sustain. Energy Rev. 2015, 44, 576–585. [Google Scholar] [CrossRef]
  67. Bhattacharya, M.; Paramati, S.R.; Ozturk, I.; Bhattacharya, S. The effect of renewable energy consumption on economic growth: Evidence from top 38 countries. Appl. Energy 2016, 162, 733–741. [Google Scholar] [CrossRef]
  68. Tiwari, A.K. A structural VAR analysis of renewable energy consumption, real GDP and CO2 emissions: Evidence from India. Econ. Bull. 2011, 31, 1793–1806. [Google Scholar]
  69. Tugcu, C.T.; Ozturk, I.; Aslan, A. Renewable and non-renewable energy consumption and economic growth relationship revisited: Evidence from G7 countries. Energy Econ. 2012, 34, 1942–1950. [Google Scholar] [CrossRef]
  70. Cho, S.; Heo, E.; Kim, J. Causal relationship between renewable energy consumption and economic growth: Comparison between developed and less-developed countries. Geosystem Eng. 2015, 18, 284–291. [Google Scholar] [CrossRef]
  71. Nathaniel, S.; Khan, S.A.R. The nexus between urbanization, renewable energy, trade, and ecological footprint in ASEAN countries. J. Clean. Prod. 2020, 272, 122709. [Google Scholar] [CrossRef]
  72. Sharif, A.; Baris-Tuzemen, O.; Uzuner, G.; Ozturk, I.; Sinha, A. Revisiting the role of renewable and non-renewable energy consumption on Turkey’s ecological footprint: Evidence from Quantile ARDL approach. Sustain. Cities Soc. 2020, 57, 102138. [Google Scholar] [CrossRef]
  73. Radmehr, R.; Henneberry, S.R.; Shayanmehr, S. Renewable energy consumption, CO2 emissions, and economic growth nexus: A simultaneity spatial modeling analysis of EU countries. Struct. Chang. Econ. Dyn. 2021, 57, 13–27. [Google Scholar] [CrossRef]
  74. Çakmak, E.E.; Acar, S. The nexus between economic growth, renewable energy and ecological footprint: An empirical evidence from most oil-producing countries. J. Clean. Prod. 2022, 352, 131548. [Google Scholar] [CrossRef]
  75. Omri, A. CO2 emissions, energy consumption and economic growth nexus in MENA countries: Evidence from simultaneous equations models. Energy Econ. 2013, 40, 657–664. [Google Scholar] [CrossRef]
  76. Omri, A.; Mabrouk, N.B.; Sassi-Tmar, A. Modeling the causal linkages between nuclear energy, renewable energy and economic growth in developed and developing countries. Renew. Sustain. Energy Rev. 2015, 42, 1012–1022. [Google Scholar] [CrossRef]
  77. Khan, Z.; Malik, M.Y.; Latif, K.; Jiao, Z. Heterogeneous effect of eco-innovation and human capital on renewable & non-renewable energy consumption: Disaggregate analysis for G-7 countries. Energy 2020, 209, 118405. [Google Scholar]
  78. Zhang, M.; Zhang, S.; Lee, C.-C.; Zhou, D. Effects of trade openness on renewable energy consumption in OECD countries: New insights from panel smooth transition regression modelling. Energy Econ. 2021, 104, 105649. [Google Scholar] [CrossRef]
  79. Sahoo, M.; Sethi, N. The intermittent effects of renewable energy on ecological footprint: Evidence from developing countries. Environ. Sci. Pollut. Res. 2021, 28, 56401–56417. [Google Scholar] [CrossRef]
  80. Langnel, Z.; Amegavi, G.B.; Donkor, P.; Mensah, J.K. Income inequality, human capital, natural resource abundance, and ecological footprint in ECOWAS member countries. Resour. Policy 2021, 74, 102255. [Google Scholar] [CrossRef]
  81. Destek, M.A.; Sinha, A. Renewable, non-renewable energy consumption, economic growth, trade openness and ecological footprint: Evidence from organisation for economic Co-operation and development countries. J. Clean. Prod. 2020, 242, 118537. [Google Scholar] [CrossRef]
  82. Matousek, R.; Tzeremes, N.G. The asymmetric impact of human capital on economic growth. Empir. Econ. 2021, 60, 1309–1334. [Google Scholar] [CrossRef]
  83. Tiba, S.; Belaid, F. Modeling the nexus between sustainable development and renewable energy: The African perspectives. J. Econ. Surv. 2021, 35, 307–329. [Google Scholar] [CrossRef]
  84. Alam, M.M.; Murad, M.W. The impacts of economic growth, trade openness and technological progress on renewable energy use in organization for economic co-operation and development countries. Renew. Energy 2020, 145, 382–390. [Google Scholar] [CrossRef]
  85. Liu, J.; Ma, C.; Ren, Y.; Zhao, X. Do real output and renewable energy consumption BRICS countries. Energies 2020, 13, 1–18. [Google Scholar]
  86. Abid, M.; Gheraia, Z.; Abdelli, H. Does renewable energy consumption affect ecological footprints in Saudi Arabia? A bootstrap causality test. Renew. Energy 2022, 189, 813–821. [Google Scholar] [CrossRef]
  87. Huang, S.-Z.; Chien, F.; Sadiq, M. A gateway towards a sustainable environment in emerging countries: The nexus between green energy and human Capital. Econ. Res. 2021, 35, 4159–4176. [Google Scholar] [CrossRef]
  88. Mehmood, U. Biomass energy consumption and its impacts on ecological footprints: Analyzing the role of globalization and natural resources in the framework of EKC in SAARC countries. Environ. Sci. Pollut. Res. 2022, 29, 17513–17519. [Google Scholar] [CrossRef] [PubMed]
  89. Sarkodie, S.A.; Strezov, V. A review on environmental Kuznets curve hypothesis using bibliometric and meta-analysis. Sci. Total Environ. 2019, 649, 128–145. [Google Scholar] [CrossRef] [PubMed]
  90. Adebayo, T.S.; Adedoyin, F.F.; Kirikkaleli, D. Toward a sustainable environment: Nexus between consumption-based carbon emissions, economic growth, renewable energy and technological innovation in Brazil. Environ. Sci. Pollut. Res. 2021, 28, 52272–52282. [Google Scholar] [CrossRef] [PubMed]
  91. Caglar, A.E.; Yavuz, E.; Mert, M.; Kilic, E. The ecological footprint facing asymmetric natural resources challenges: Evidence from the USA. Environ. Sci. Pollut. Res. 2022, 29, 10521–10534. [Google Scholar]
  92. Chen, S.; Saud, S.; Saleem, N.; Bari, M.W. Nexus between financial development, energy consumption, income level, and ecological footprint in CEE countries: Do human capital and biocapacity matter? Environ. Sci. Pollut. Res. 2019, 26, 31856–31872. [Google Scholar]
  93. Tiwari, A.K.; Kocoglu, M.; Banday, U.J.; Awan, A. Hydropower, human capital, urbanization and ecological footprints nexus in China and Brazil: Evidence from quantile ARDL. Environ. Sci. Pollut. Res. 2022, 29, 68923–68940. [Google Scholar]
  94. Ali, S.; Yusop, Z.; Kaliappan, S.R.; Chin, L. Trade-environment nexus in OIC countries: Fresh insights from environmental Kuznets curve using GHG emissions and ecological footprint. Environ. Sci. Pollut. Res. 2021, 28, 4531–4548. [Google Scholar]
  95. Usman, M.; Kousar, R.; Yaseen, M.R.; Makhdum, M.S.A. An empirical nexus between economic growth, energy utilization, trade policy, and ecological footprint: A continent-wise comparison in upper-middle-income countries. Environ. Sci. Pollut. Res. 2020, 27, 38995–39018. [Google Scholar] [CrossRef] [PubMed]
  96. Udemba, E.N. Moderation of ecological footprint with FDI and agricultural sector for a better environmental performance: New insight from Nigeria. J. Public Aff. 2022, 22, e2444. [Google Scholar] [CrossRef]
  97. Akinlo, T.; Dada, J.T. Information technology, real sector and economic growth in sub-Saharan Africa: A cross-sectional dependence approach. Qual. Quant. 2022, 1–27. [Google Scholar] [CrossRef]
  98. Aslan, A.; Ocal, O.; Ozsolak, B.; Ozturk, I. Renewable energy and economic growth relationship under the oil reserve ownership: Evidence from panel VAR approach. Renew. Energy 2022, 188, 402–410. [Google Scholar] [CrossRef]
  99. Gyimah, J.; Yao, X.; Tachega, M.A.; Hayford, I.S.; Opoku-Mensah, E. Renewable energy consumption and economic growth: New evidence from Ghana. Energy 2022, 248, 123559. [Google Scholar] [CrossRef]
  100. Wan, Y.; Sheng, N. Clarifying the relationship among green investment, clean energy consumption, carbon emissions, and economic growth: A provincial panel analysis of China. Environ. Sci. Pollut. Res. 2022, 29, 9038–9052. [Google Scholar] [CrossRef]
  101. Wang, Q.; Dong, Z.; Li, R.; Wang, L. Renewable energy and economic growth: New insight from country risks. Energy 2022, 238, 122018. [Google Scholar] [CrossRef]
  102. Kong, Q.; Peng, D.; Ni, Y.; Jiang, X.; Wang, Z. Trade openness and economic growth quality of China: Empirical analysis using ARDL model. Financ. Res. Lett. 2021, 38, 101488. [Google Scholar] [CrossRef]
  103. Oloyede, B.M.; Osabuohien, E.S.; Ejemeyovwi, J.O. Trade openness and economic growth in Africa’s regional economic communities: Empirical evidence from ECOWAS and SADC. Heliyon 2021, 7, e06996. [Google Scholar] [CrossRef]
  104. Shittu, W.O.; Musibau, H.O.; Jimoh, S.O. The complementary roles of human capital and institutional quality on natural resource-FDI—Economic growth Nexus in the MENA region. Environ. Dev. Sustain. 2022, 24, 7936–7957. [Google Scholar] [CrossRef]
  105. Karambakuwa, R.T.; Ncwadi, R.; Phiri, A. The human capital–economic growth nexus in SSA countries: What can strengthen the relationship? Int. J. Soc. Econ. 2020, 47, 1143–1159. [Google Scholar] [CrossRef]
  106. Isaiah Zayone, T.; Henneberry, S.R.; Radmehr, R. Effects of agricultural, manufacturing, and mineral exports on Angola’s economic growth. Energies 2020, 13, 1494. [Google Scholar] [CrossRef]
  107. Radmehr, R.; Rastegari Henneberry, S. Energy Price policies and food prices: Empirical evidence from Iran. Energies 2020, 13, 4031. [Google Scholar] [CrossRef]
Figure 1. Box chart of research data with scatter plot and distribution over.
Sustainability 14 12227 g001
Figure 2. Interaction between the variables of concern.
Sustainability 14 12227 g002
Figure 3. Impulse response functions. Note: The red line shows the confidence interval the 95% confidence interval band that was generated based on 500 Monte Carlo simulations.
Sustainability 14 12227 g003
Table 1. A survey of existing literature.
Author(s)CountryPeriodMethodologyFindings
(a) Income-environmental quality
Danish et al. [48]BRICS countries1971–2014ARDLGDP ⇨ EFP
Hussain et al. [49]Thailand1970–2018ARDLGDP ⇨ EFP
Ahmad et al. [50]Emerging economies1984–2016Panel data techniqueGDP ⇨ EFP
Ikram et al. [51]Japan1965–217QARDLGDP ⇔ EFP
Udemba [52]Nigeria1981–2018ARDLGDP ⇨ EFP
Addai et al. [53]Eastern Europe1998–2017Dumitrescu Hurlin causality approachGDP ⇨ EFP
Akram et al. [54]Developing countries1990–2014Panel quantile regressionGDP ⇨ EFP
Ozcan et al. [55]OECD countries2000–2014Panel VARGDP ⇨ EFP
Mrabet et al. [56]Qatar1980–2011ARDLGDP ⇨ EFP
Mamoglu [8]Turkey1970–2014FMOLS and DOLSGDP ⇨ EFP
Baz et al. [58]Pakistan1971–2014ARDLGDP ≠ EFP
Wang et al. [59]China1990–2012VECMGDP ≠ EFP
Kasman and Duman [60]EU member1992–2010FMOLSGDP ≠ EFP
(b) Renewable energy-income
Ivanovski et al. [61]OECD and non-OECD countries1990–2015Non-parametricREC ⇨ GDP
Bulut et al. [62]USA1977–2019Cointegration methodsREC ⇨ GDP
Inglesi-Lotz [63]OECD countries1990–2010Panel data techniqueREC ⇨ GDP
Apergis and Payne [64]OECD countries1985–2005FMOLSREC ⇨ GDP
Sadorsky [65]emerging economies2005–2030FMOLSREC ⇨ GDP
Shahbaz et al. [66]Pakistan1972–2011ARDLREC ⇨ GDP
Bhattacharya et al. [67]Top 38 countries1991–2012FMOLS and DOLSREC ⇨ GDP
Tiwari [68]India1960–2009Structural VAR approachREC ⇨ GDP
Tugcu et al. [69]G7 countries1980–2009ARDLREC ≠ GDP
Cho et al. [70]Developed and less-developed countries1990–2010Panel vector error correction modelGDP ⇨ REC
(c) Income-renewable energy-environmental quality
Nathaniel and Khan [71]ASEAN countries1990–2016AMGREC ⇨ EFP
GDP ⇨ EFP
Alola et al. [17]EU countries1997–2014PMG modelREC ⇨ EFP
GDP ⇨ EFP
Sharif et al. [72]Turkey1965–2017QARDLREC ⇨ EFP
Radmehr et al. [73]EU countries1995–2014Spatial econometricsGDP ⇔ REC
GDP ⇔ EFP
REC ⇨ EFP
Çakmak and Acar [74]Most oil-producing countries1999–2017GMM panelGDP ⇨ EFP
Note: BRICS: Brazil, Russia, India, China, South Africa, Turkey, FMOLS: Fully-modified ordinary least square, DOLS: Dynamic ordinary least square, QARDL: Quantile auto-regressive distributed lag, PMG: Pool mean group. AMG: Augmented mean group, GMM: Generalized moment estimation method, OECD: Organization for economic co-operation and development, VECM: Vector error correction model, VAR: Vector autoregression.
Table 2. Unit of measurement and sources of the variables.
VariableIndicator MeasurementSource
OILOil price (Spot price of West Texas Intermediate)US dollars per barrelFRED economic data
NRRTotal natural resources rents% of GDPWDI
GDPGross domestic productReal GDP per capita (constant 2015 US$)WDI
TOPTrade openness% of GDPWDI
EFPEcological footprintGlobal hectares per capitaGlobal Footprint Network
RECRenewable energy consumption% of total final energy consumptionWDI
GFCFCapital stockGross fixed capital formation (constant 2015 US$)WDI
HCHuman capital indexYears of schooling and returns to educationPenn World Table
EGEconomic globalizationKOF Globalization Index on economic issuesKOF Globalization Index
FGFinancial globalizationKOF Globalization Index on political issuesKOF Globalization Index
SGSocial globalizationKOF Globalization Index on social issuesKOF Globalization Index
Table 3. Panel GMM outputs for Equations (1), (4), and (7).
Dependent Variable (REC)Model 1Model 2Model 3
Coef.Std. Err.Coef.Std. Err.Coef.Std. Err.
Constant−1.9414.338−10.985 **4.913−14.781 ***4.066
LnGDP1.247 ***0.4151.349 ***0.4741.803 ***0.400
LnEFP−2.849 ***0.406−2.536 ***0.420−2.276 ***0.385
LnOIL0.190 ***0.0770.0710.0700.0650.064
LnSG−2.955 ***1.102----
LnEG--−1.039 **0.534--
LnFG----−1.775 ***0.303
LnHC4.486 ***1.5842.878 **1.3623.345 ***1.155
LnTO0.670 ***0.2310.948 ***0.3811.327 ***0.249
Wald chi2 (p-value)0.000-0.000-0.000-
Hansen test (p-value)0.946-0.741-0.501-
Note: ** and *** show rejection of the unit root hypothesis at the 5% and 1% significance levels, respectively.
Table 6. Dumitrescu and Hurlin Granger non-causality test results.
Null HypothesisW-BarZ-Barp-ValueCausalityDiction
LnEFP ≠ LnGDP5.7868.955 ***0.000Yes<=>
LnGDP ≠ LnEFP3.2581.664 *0.096Yes
LnREC ≠ LnGDP2.4472.707 ***0.006Yes<=>
LnGDP ≠ LnREC2.9173.588 ***0.000Yes
LnGFCF ≠ LnGDP3.0373.811 ***0.000Yes<=>
LnGDP ≠ LnGFCF3.4934.665 ***0.000Yes
LnSG ≠ LnGDP2.2992.431 **0.015Yes<=>
LnGDP ≠ LnSG4.3226.216 ***0.000Yes
LnEG ≠ LnGDP2.3742.570 **0.010Yes<=>
LnGDP ≠ LnEG3.7595.162 ***0.000Yes
LnFG ≠ LnGDP2.4652.741 ***0.006Yes<=>
LnGDP ≠ LnFG3.8395.311 ***0.000Yes
LnHC ≠ LnGDP2.8706.041 ***0.000Yes<=>
LnGDP ≠ LnHC10.75418.248 ***0.000Yes
LnTO ≠ LnGDP3.2461.648 *0.099Yes=>
LnGDP ≠ LnTO5.0824.077 ***0.000No
LnEFP ≠ LnREC2.1352.124 **0.033Yes<=>
LnREC ≠ LnEFP5.8088.995 ***0.000Yes
LnOIL ≠ LnREC6.1819.694 ***0.000Yes=>
LnREC ≠ LnOIL1.1310.2450.806No
LnSG ≠ LnREC6.3419.992 ***0.000Yes<=>
LnREC ≠ LnSG7.95813.017 ***0.000Yes
LnEG ≠ LnREC4.5186.582 ***0.000Yes=>
LnREC ≠ LnEG0.626−0.6990.484No
LnFG ≠ LnREC4.8717.242 ***0.000Yes=>
LnREC ≠ LnFG0.836−0.3060.759No
LnHC ≠ LnREC5.5888.583 ***0.000Yes<=>
LnREC ≠ LnHC8.50014.032 ***0.000Yes
LnTO ≠ LnREC2.1922.231 **0.025Yes<=>
LnREC ≠ LnTO2.4002.619 ***0.008Yes
LnNRR ≠ LnEFP2.3162.462 ***0.013Yes<=>
LnEFP ≠ LnNRR3.5034.683 ***0.000Yes
LnSG ≠ LnEFP4.8057.119 ***0.000Yes=>
LnEFP ≠ LnSG1.4980.9330.350No
LnEG ≠ LnEFP4.5816.700 ***0.000Yes=>
LnEFP ≠ LnEG1.1870.3510.725No
LnFG ≠ LnEFP2.7343.244 ***0.001Yes=>
LnEFP ≠ LnFG0.491−0.9510.341No
LnHC ≠ LnEFP4.0035.618 ***0.000Yes<=>
LnEFP ≠ LnHC4.9577.404 ***0.000Yes
LnTO ≠ LnEFP9.80916.480 ***0.000Yes=>
LnEFP ≠ LnTO1.7691.4390.150No
Note:*, **, and *** respectively, significance at the 10%, 5%, and 1% levels. =>: Unidirectional. <=>: Bidirectional.
Publisher’s Note: MDPI stays neutral with regard to jurisdictional claims in published maps and institutional affiliations.

