Article

Simulating the Impact of the Sustained Melting Arctic on the Global Container Sea–Rail Intermodal Shipping

1
College of Transportation Engineering, Dalian Maritime University, Dalian 116026, China
2
College of Maritime Economics and Management, Dalian Maritime University, Dalian 116026, China
*
Author to whom correspondence should be addressed.
Sustainability 2022, 14(19), 12214; https://doi.org/10.3390/su141912214
Submission received: 10 August 2022 / Revised: 20 September 2022 / Accepted: 21 September 2022 / Published: 26 September 2022
(This article belongs to the Special Issue Green Maritime Logistics and Sustainable Port Development)

Abstract

:
Global warming trends and the rapid reduction of summer Arctic sea ice extent have increased the feasibility of transarctic transport. How the process of glacier melting affects the existing containerized sea–rail shipping network and container flow assignment has become a challenging economic and policy issue. This paper first examines the meteorological influences on glacier melting and the assignment of container flow over the existing sea–rail network. Then, a three-layer simulation framework is constructed, with the upper layer simulating glacier melting based on the raster grid, the middle layer combining a grid and topology analysis to simulate the evolution of the global sea–rail network and the lower layer establishing a concave cost network flow model to simulate the container flow assignment. Finally, we use MicroCity to achieve the dynamic optimization and simulation of global container flow assignment, solving the large-scale sea–rail shipping network traffic assignment problem. The simulation results show that the proposed model and solution algorithm are feasible and effective, revealing the variation of container flow assignment in the global sea–rail shipping network under different Arctic ice melting scenarios. For instance, in the summer of 2050, the Arctic routes will share the global container flows, resulting in a significant reduction of container flows in the Malacca Strait, Suez Canal and Panama Canal.

1. Introduction

Maritime transport is the most important mode of transportation in international trade and is also a key element in promoting international trade and global economic integration [1,2]. According to the United Nations Conference on Trade and Development (UNCTAD), seaborne trade has grown at a compound annual rate of 2.9% over the past 20 years. The total global seaborne trade volume reached 10.7 billion tons in 2020. Meanwhile, container trade volume has been growing annually, reaching 149 million twenty-foot equivalent units (TEUs) in 2020 [3]. The volume of container trade between East Asia, North America and Europe accounts for nearly 40% of the global container trade. At present, liner shipping companies mainly transport between these regions via the Suez Canal and Panama Canal. As the demand for inter-regional trade continues to grow, the navigational problems of traditional waterways are becoming increasingly apparent. Affected by factors such as waiting time for canal passage, canal tolls and capacity limitations, shipping companies are seeking new routes to replace traditional routes. Transarctic routes shorten the spatial distance between regions, and the potential economic and strategic value of the Arctic routes has received widespread attention from the international community [4,5].
Arctic routes consist of two sets of waterways in the Arctic region: the Northern Sea Route (NSR) and the Northwest Passage (NWP). The NSR starts from the Bering Strait in the east and passes through the northern waters of Russia to the Kara Sea in the west, connecting East Asia and Northern Europe. The NWP begins in the Labrador Sea in the east, passes through the Canadian Arctic Islands and ends in the Bering Strait in the west, connecting the Atlantic and Pacific [4]. Compared to traditional routes, the new routes can shorten sailing distances by up to 40%. When overcoming sea ice obstacles, transportation through the Arctic routes is better than traditional routes in terms of time, cost and safety [6].
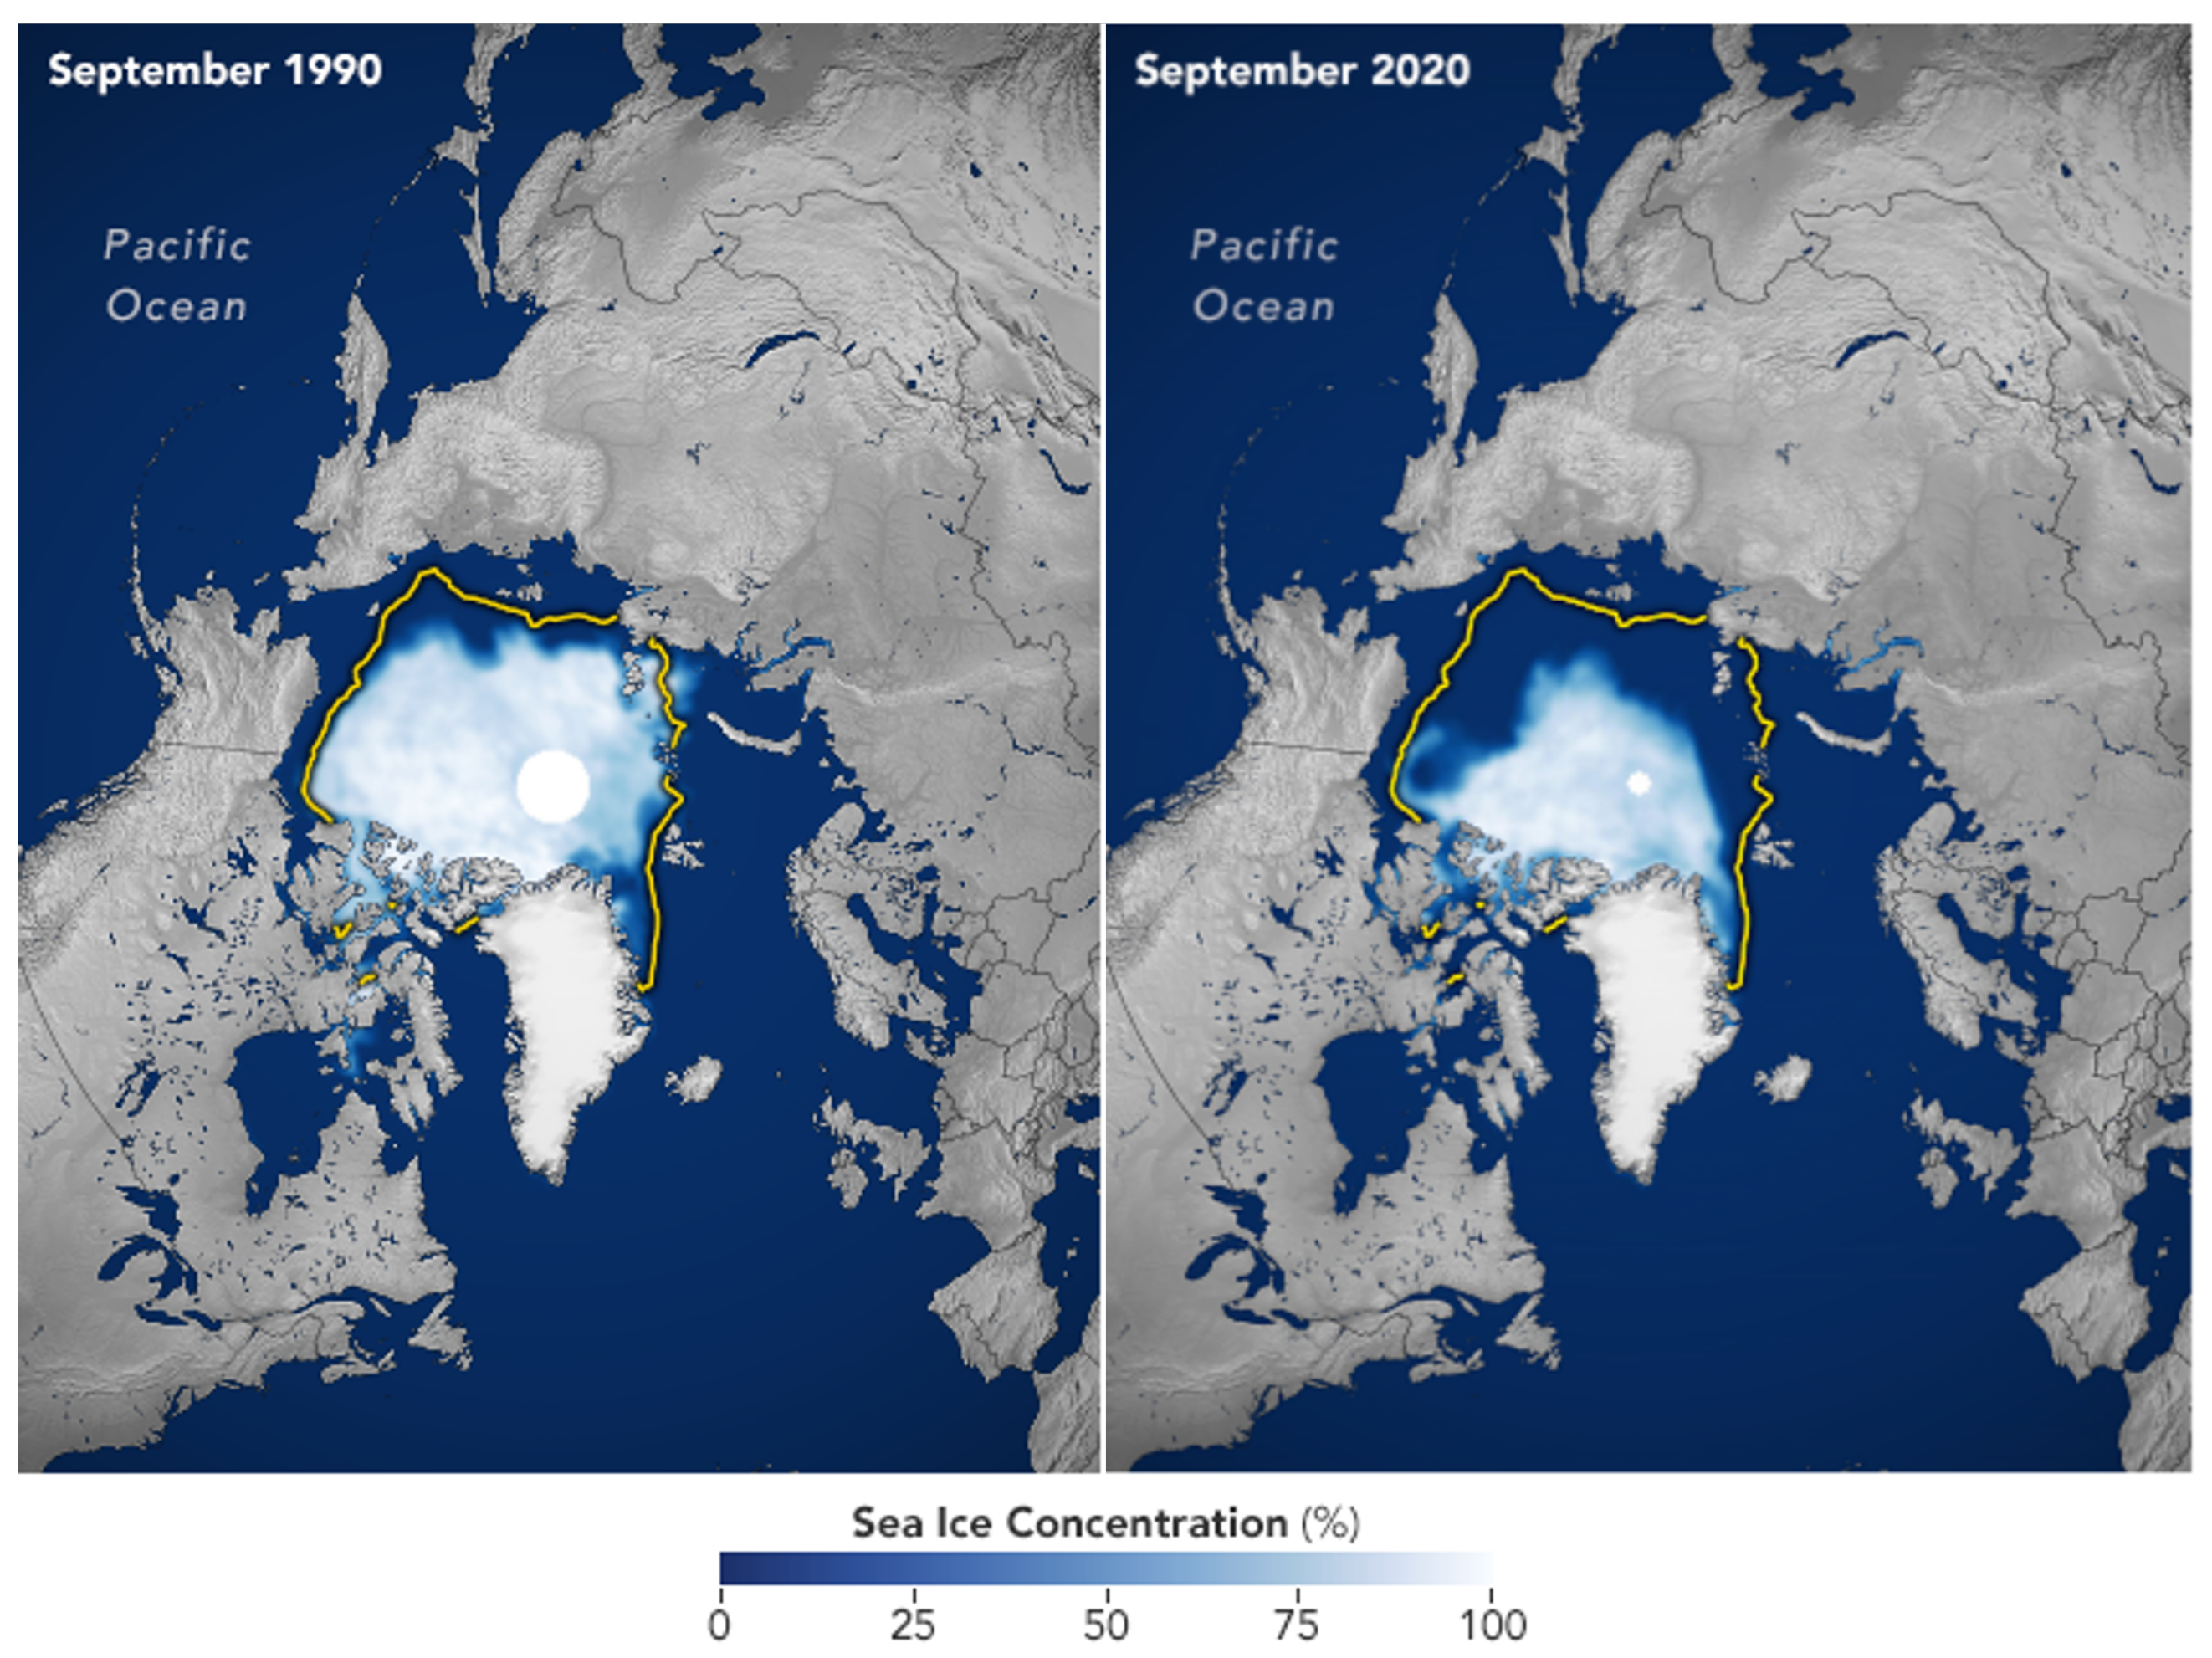
Arctic sea ice melting is continuous and complicated. Satellite mapping shows that Arctic sea ice has exhibited a continuous trend of shrinkage since 1979. Arctic sea ice extent hit record lows several times, and the ice thickness and volume are also decreasing rapidly [7]. The National Snow and Ice Data Center (NSIDC) report indicated that Arctic sea ice shrank to 4.72 million square kilometers on September 16, 2021, ranking in the bottom 2 of the last 15 years of satellite records. Figure 1 shows a comparison of sea ice concentrations in September 1990 and September 2020. Dark blue areas are open water. All icy areas have a sea ice concentration of at least 15%, with the highest concentration in the opaque white areas. The yellow outline shows the median sea ice extent in September as observed by satellites. We can see a significant reduction in Arctic sea ice extent in 2020. In addition, climate scenario simulations show that global warming is amplified in the Arctic [8]. Sea ice melting reduces the albedo of solar radiation in the area, and seawater then absorbs heat more efficiently, thus intensifying the melting of sea ice. Arctic sea ice shrinkage is accelerating due to the combined effects of atmospheric circulation and greenhouse gases [8,9]. Meanwhile, Arctic sea ice changes show seasonal characteristics. About 70% of the floating ice in the Arctic consists of seasonal sea ice that grows rapidly during the winter and melts during the summer. Sea ice extent reaches a yearly maximum in March and then gradually decreases to a yearly minimum in September [10]. The navigable mileage of the Arctic shipping lanes varies under different sea ice conditions constraints. Therefore, it is necessary to examine the sea ice melt trends and the feasibility of Arctic routes under different melt phases.
In recent years, with the continuous improvement and extension of the rail network, the transshipment process between railways and ports has been more convenient, and the volume of sea–rail intermodal transport has gradually been increasing. Sea–rail intermodal transport combines the advantages of both modes and can carry large amounts of cargo with a high network stability [11,12]. After the opening of the Arctic routes, the new routes will be connected to the traditional routes as well as to the rail network, forming a new sea–rail shipping network. The new sea–rail network will increase inter-regional connectivity and facilitate international trade exchanges, which will inevitably cause drastic changes in freight traffic in the network. Considering the risk, emission and cost factors, liner companies will adjust their fleet deployment according to the new route network and choose more economical transportation methods [13,14,15]. The problem of Arctic sea–rail container assignment is worth studying, both from an economic and stability point of view. As pointed out earlier, with the continuous reduction of sea ice extent, the Arctic shipping lanes are gradually revealed. Changes in the shipping lanes affect the shipping network and the assignment of freight demand in the network, so it is essential to analyze the changes in the sea–rail intermodal network and the container flow assignment in the context of Arctic ice melting.
Studies on Arctic routes began at the end of the last century and have focused on the history of Arctic navigation, the climate of the Arctic region and international laws related to Arctic navigation [4,5]. Until the last decade, studies on the economic value of transarctic transport have emerged, addressing the economic feasibility of Arctic routes and their impact on the economy and trade [6,16]. Arctic navigation will change the structure of the maritime network, which will affect freight flows in the network. However, few have considered the impact of Arctic navigation on the container flows in the shipping network. Therefore, this study is motivated to narrow the research gap by answering the following questions: (1) How will the container flows in the global sea–rail shipping network change with the opening of the Arctic routes? (2) Considering the impact of continued sea ice melt on the navigability of the Arctic shipping lanes, what are the trends in container flows on the routes? Hence, the paper aims to examine the impact of continued Arctic ice melt on global container sea–rail network and the container flows in the network. First, we simulate the melting of Arctic glaciers by 2050 using sea ice data from three Coupled Model Intercomparison Project 5 (CMIP5) models under the medium forcing emission scenario (Representative Concentration Pathway (RCP) 4.5). Then, with the melting of sea ice, new navigable shipping lanes are emerging in the Arctic. The new shipping routes can be combined with the existing maritime and rail networks to form a new container sea–rail intermodal network. Finally, we simulate the assignment of container flows in the global sea–rail intermodal network with a concave cost network flow model and solve it with the shortest path algorithm.
Our contribution to the existing literature is mainly twofold. On the one hand, it is one of the few studies in the field of global container transport research that considers the Arctic routes to construct a containerized sea–rail network with global coverage. Moreover, although existing studies have examined the economic feasibility of the Arctic routes, there has been little exploration of freight traffic along the Arctic routes. Our study innovatively considers the Arctic ice melt-based container flow assignment problem to analyze the changes in container flows due to network changes. On the other hand, carriers will choose more economical modes of transportation and adjust their business strategies in the face of new route networks. Our study can provide theoretical implications for carriers. Meanwhile, the calculation results reveal the future trend of freight traffic, which can provide a basis for decision-making for the future planning and development of ports and the country.
The remainder of this paper is organized as follows. Section 2 reviews the literature on Arctic routes and on the container flow assignment. Section 3 presents a simulation framework to analyze the impact of sea ice melt on the global containerized sea–rail network and the assignment of container flows. Section 4 presents the numerical analysis results and discussion. The final section lists conclusions and suggestions for future research.

2. Literature Review

In this section, we first review the research on Arctic routes in Section 2.1. Section 2.2 provides an overview of relevant studies on container flow assignment problems. Finally, we list the differences between current and existing studies.

2.1. Arctic Routes

The Arctic region is covered with snow and ice all year round and the low-temperature environment restricts maritime traffic. The exploration of navigable conditions for the Arctic is the basis for further analysis of transarctic transport’s feasibility and economic value [7]. Arctic navigation factors include meteorological, hydrological and facility conditions. Among them, sea ice is considered essential in limiting the opening and commercial exploitation of Arctic shipping lanes [9]. Available monitoring data show that Arctic sea ice continues to melt with no apparent pattern and that there are significant interannual differences in the distribution of sea ice in the Arctic shipping lanes. Sea ice has great variability and uncertainty, and the literature has monitored and simulated the modeling of sea ice extent and thickness. Because of the large temperature difference between summer and winter in the Arctic, it is highly unlikely that the Arctic routes will be navigable before the mid-21st century, so scholars prefer to study the summer sea ice extent of the Arctic. The methods used include statistical models, sea-ice–ocean models and atmosphere–ocean general circulation models. Furthermore, linear regression models can be used, using past observations for statistical or training purposes and then predicting future sea ice conditions [10,17].
Among existing studies on sea ice changes and the navigability of Arctic shipping lanes, Lefebvre and Goosse [18] further confirmed the possibility of the Arctic routes by analyzing the change of sea ice area in the 21st century using several atmosphere–ocean general circulation models (AOGCMs). Laliberté et al. [19] used 42 models and 91 simulations of the CMIP5 forced Representative Concentration Pathways (RCP) 8.5 to examine changes in sea ice areas between June and October. The results showed that eastern Arctic waters will experience a more extended period of ice-free conditions earlier in the century. Jahn et al. [20] argued that accurately predicting an ice-free summer in the Arctic was complex, considering the effects of uncertainties in sea ice volume, trends, area, extent and thickness. Considering that transarctic transport is influenced by changes in temperature, seawater temperature, wind direction and wind speed, Zhang et al. [21] evaluated the development of transarctic transport on the basis of mining big data.
The existence of sea ice creates routing difficulties and increases navigation risks. Numerous studies have considered the impact of different ice scenarios on the economic viability of the Arctic. Sibul and Jin [6] focused on environmental parameters, assessing the impact of three factors—ice thickness, ice conditions and ice class—on the cost of transarctic transport. Xu et al. [22] discussed a seasonal NSR/SCR-combined shipping service pattern. The model considered changes in sea ice extent, which was more reasonable for assessing Arctic container shipping. Cheaitou [23] analyzed the impact of ice thickness changes on the economic and environmental attractiveness of the NSR. In studies considering the impact of sea ice melt on trade, Bensassi et al. [16] predicted the changes in future Arctic sea ice extent by using CMIP5 and discussed the impact of climate change and distance shortening on international trade.

2.2. Container Flow Assignment

In recent years, many scholars have studied the problem of assigning container traffic to single-mode and multimode networks [24]. Shibasaki and Kawasaki [25] constructed an international containerized cargo network assignment model and applied it to analyze three countries in South Asia to analyze the impact of logistics policy changes on network flows. Rosell et al. [26] developed a combined mode-split/traffic assignment model to assess the share of freight traffic between train–road modes, using the European rail network as an example. In the study of applying assignment solutions to maritime networks, Bell et al. [27] proposed a global maritime container assignment model, considering sailing time, service frequency and port capacity effects on full and empty container flow assignment. Bell et al. [28] presented a cost-based container allocation model to minimize container handling costs, container rental and inventory costs. Song and Dong [29] considered a joint optimization problem of freight assignment and empty container repositioning in the planning of a shipping network with multiple service routes, multiple deployed vessels and multiple regular voyages. Sun and Zheng [30] established a cargo flow assignment model with a concave function as the objective function to analyze the cargo flow assignment of empty and loaded containers in the global shipping network. Lin and Huang [31] developed a model to analyze the international liner shipping network and estimate the changes in container flows under different scenarios to predict future maritime network development trends. Ozcan et al. [32] took a Turkish liner shipping agency as their object of study to investigate its shipment assignment and vessel scheduling problems. A mixed-integer linear programming model was developed and solved with a two-stage algorithm. With the gradual depth of research, some scholars pointed out that the container flow assignment problem referred to a series of container transport activities, including container loading and unloading, transport between different routes or combined transport between different modes of transport, etc. [33,34].
However, most studies on container flow assignment are based only on existing maritime networks, and only a few scholars have considered new shipping networks in the context of Arctic navigation. Lin and Chang [35] constructed a time-network-based model to analyze the NSR ship routing and freight assignment problem and developed a Lagrangian relaxation based decomposition algorithm. Zeng [36] analyzed the market share of the NSR, SCR and railway transport between China and Europe using a multi-indicator logit model and discussed the trend of NSR market share under different scenarios.

2.3. Summary

Existing studies have mainly focused on assessing historical sea ice data trends or discussed Arctic routes’ navigation feasibility and economic value. Although the issue of container assignment has attracted much attention, few scholars have discussed container assignment after the opening of the Arctic routes. Moreover, sea ice melting is gradually improving the navigation conditions in the Arctic, and the effects are sustained. Few studies have analyzed the impact of changes in sea ice extent on the shipping network pattern and container flow in the shipping network. Moreover, existing studies have only explored the impact of the Arctic routes on container flows in the current maritime network without considering the changes in container flows in the inland transportation network. This paper aims to focus on the assignment of container flows in the global sea–rail intermodal network under the changing ice conditions in the Arctic region. Based on the analysis of the influencing factors of sea ice melting and the existing sea–rail intermodal network, a simulation framework of container flow assignment in the shipping network is established. By simulating the assignment of container flows, we explore the changes in the global sea–rail intermodal network and container flows under the influence of Arctic ice melt. The findings will not only bring direct economic benefits to shipping companies but also provide a basis for decision-making for future planning and development of ports and countries.

3. Methodology

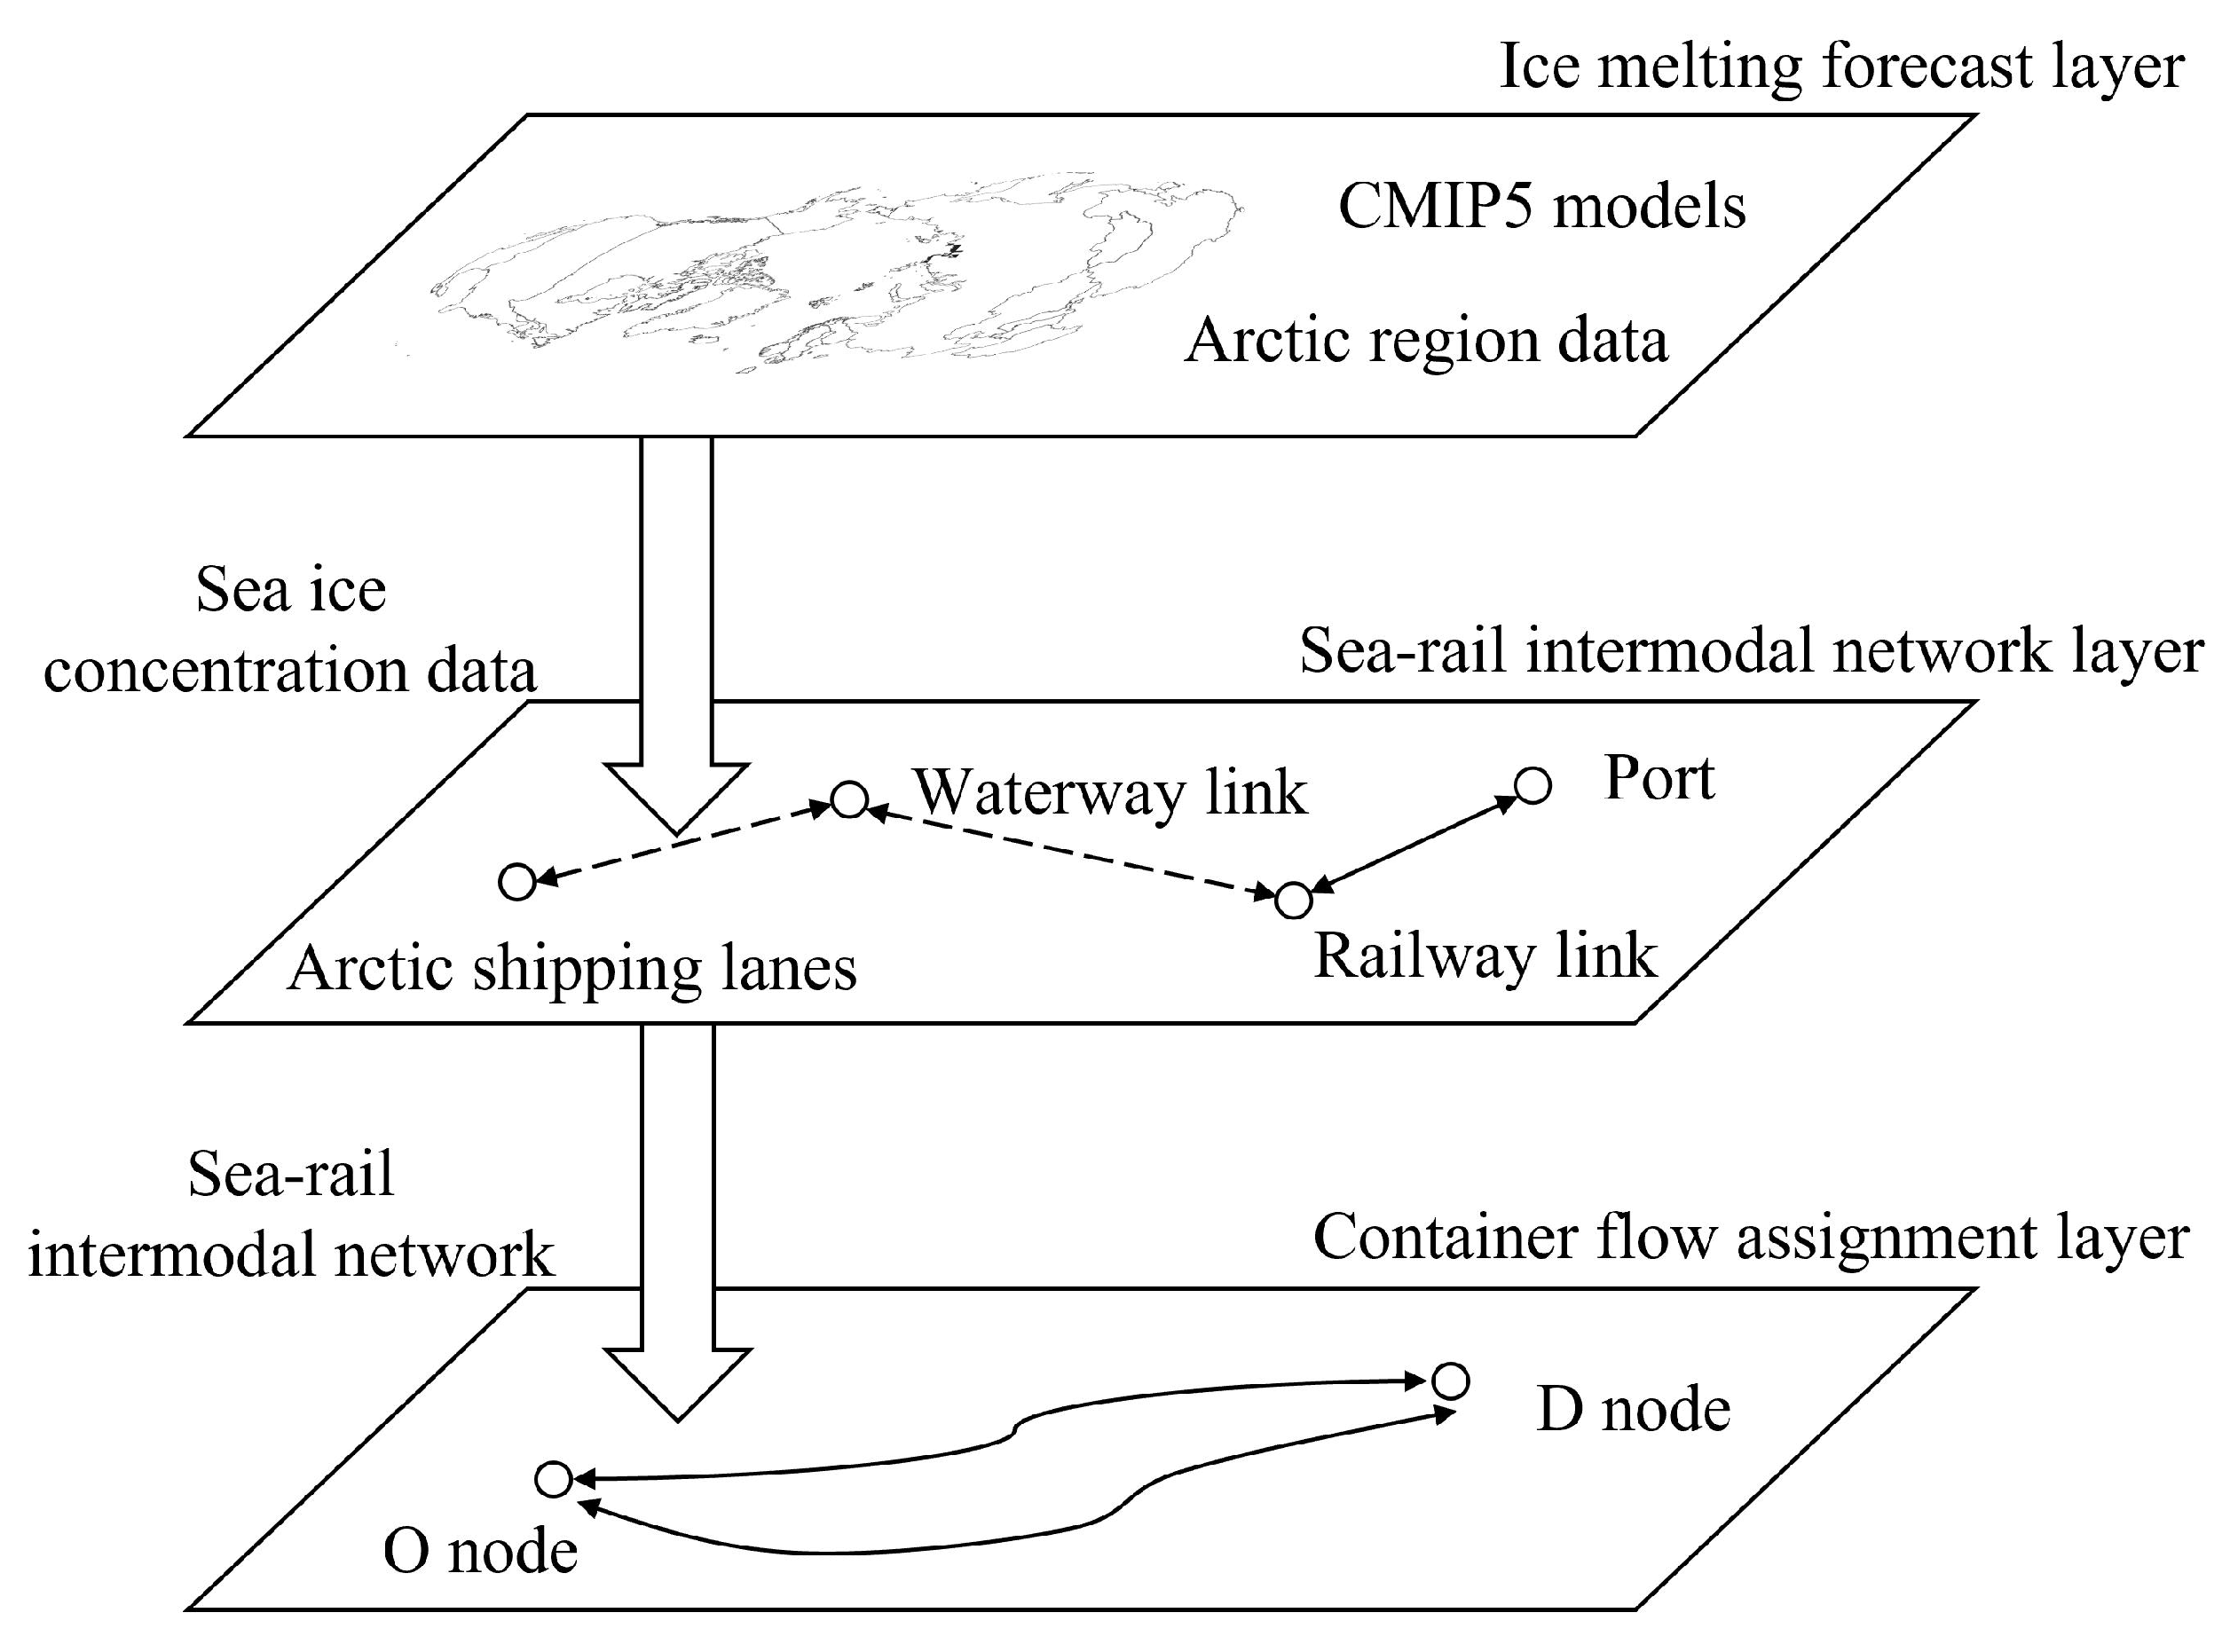
In this section, we propose a simulation framework to analyze how global container flows are assigned after the Arctic navigation. Figure 2 shows the framework structure, containing three layers. In the upper layer, we estimate the future Arctic sea ice concentration based on the atmosphere–ocean coupled models of CMIP5. The obtained sea ice concentration data are transferred to the middle layer as input information to determine whether the transarctic shipping lanes are covered by sea ice. The sea ice melting gradually reveals the shipping lanes and changes the shipping network. In the middle layer, we can get a new global sea–rail intermodal network considering sea ice extent changes. We construct a concave cost network flow model in the lower layer to minimize the total transportation costs. By assigning container demand to the new global sea–rail intermodal network, changes in container flow assignment in the context of Arctic ice melt can be assessed.

3.1. Ice Melting Forecast

Arctic sea ice melting is a complex process. Considering the coupling relationship between sea ice and atmosphere, we estimated the Arctic climate with the help of the CMIP database in this module. The fifth phase of the International Coupling Model Comparison Program has carried out climate analysis under different scenarios through several global atmosphere–ocean coupled models (AOGCMs) in 35 countries, including future short-term climate change projections (to 2035) and future long-term climate change projections (to 2100–2300) [7]. This paper adopted the global AOGCMs mentioned in the Fifth Assessment Report of the Intergovernmental Panel on Climate Change (IPCC AR5) as the prediction model for Arctic ice melting.
The AOGCM consists of three parts: atmospheric circulation model, the sea ice circulation model and the coupler, which can well reflect the dynamic process of heat exchange between atmosphere and ocean as well as the formation and melting cycle of sea ice. Thus, when using the AOGCMs to study the distribution of ice and snow on the sea surface, it is not only necessary to consider the energy conversion between the sea ice surface and the atmosphere but also the influence of the sea–air flow on the ice and snow, the melting of the sea ice itself and the formation of new ice.
The Representative Concentration Pathways (RCPS) are the emission scenario developed by the IPCC AR5, which was developed to combine climate, atmospheric circulation, carbon emissions and socioeconomic factors to provide a specific analysis of the impacts of climate change in the Arctic [37]. This paper used the RCP 4.5 typical emission scenario and selected sea ice concentration data from three AOGCMs in CMIP5, MRI-CGCM3, ACCESS1-3 and CNRM-CM5.
Based on the sea ice concentration data output from each model prediction, the dividing line between Arctic seawater and sea ice cover was further determined. To reduce the prediction model error, this paper used the boundary between seawater and sea ice determined by more than 50% of the selected models as the standard and finally determined the edge of sea ice extent.

3.2. Sea–Rail Intermodal Network

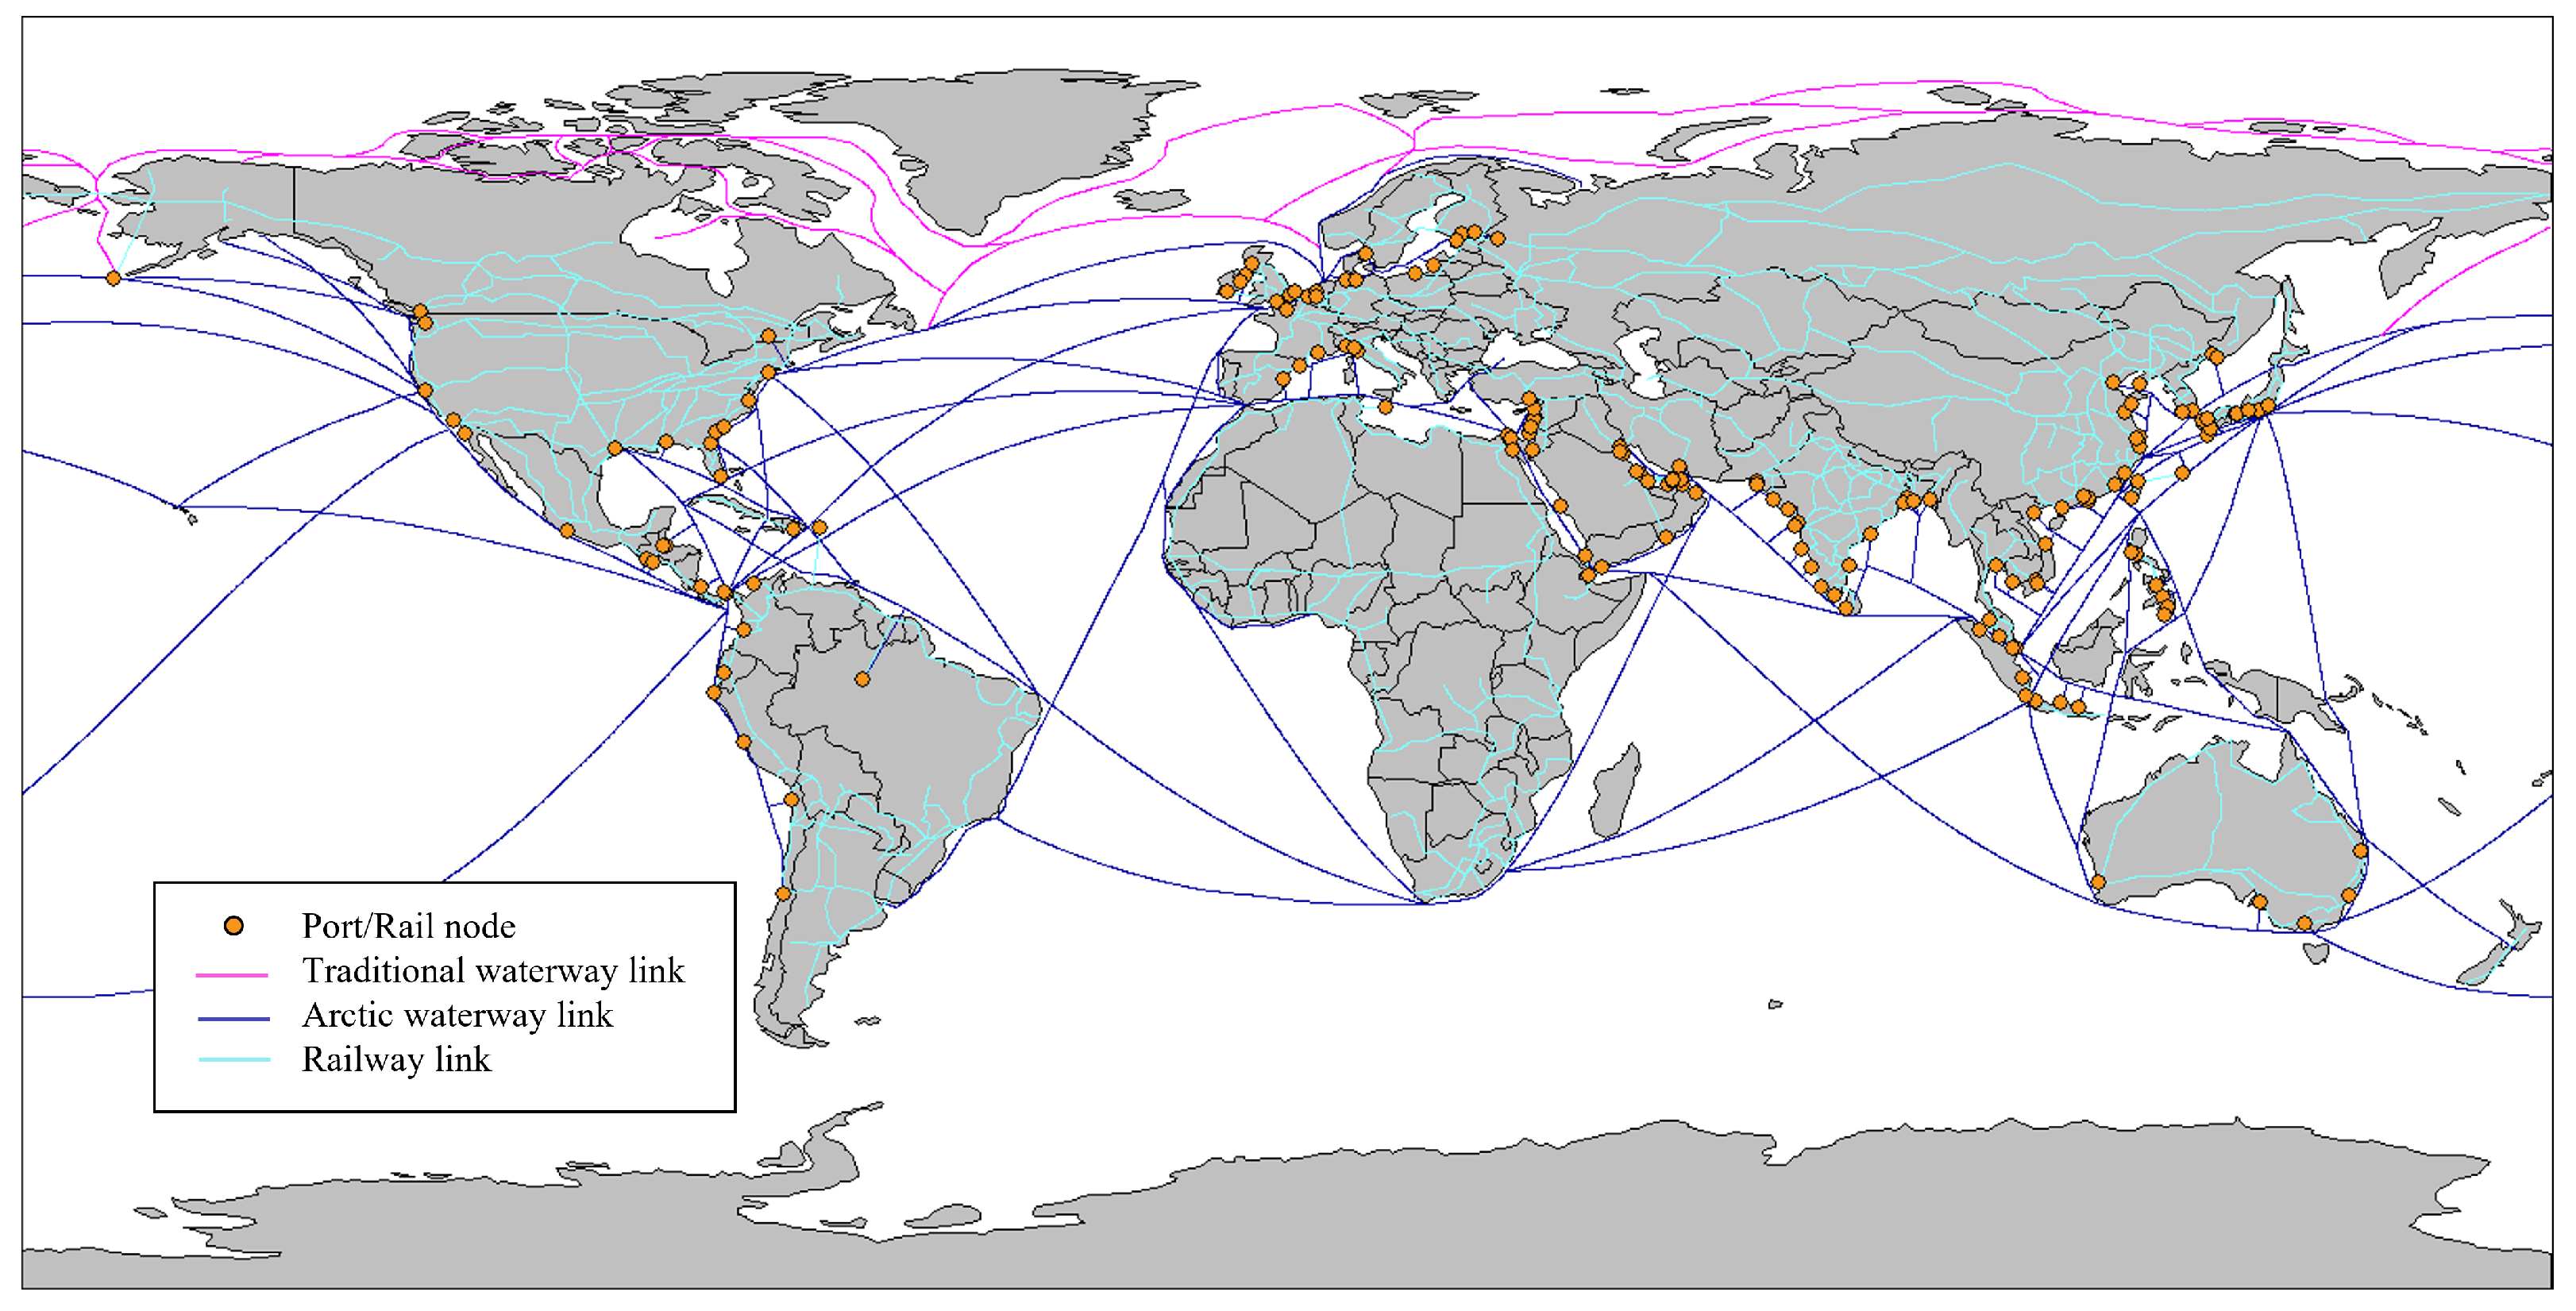
To optimize and simulate the assignment of container flows in the global sea–rail intermodal network, we used Microcity to connect the maritime network with the rail network. The network consisted of transport links and port nodes. Some ports had rail transit stations, which were the basis for connecting maritime and rail networks. In addition, the NSR and the NWP were also added to the global sea–rail intermodal network. Then, the entire network was topologically processed to obtain the specific path distance between nodes. To avoid the error between the calculated path distance on the plane and the actual path distance, we used the radian formula to refine the distance data further. Finally, container demand between global ports was obtained from a shipping company, and subsequently, the container demand, shipping distance, passing capacity and other related data of major ports were stored in the global sea–rail intermodal network correspondingly. Since the container flow assignment model considered not only the flow assignment of full containers but also the flow assignment of empty containers, a two-way container shipping network covering both eastbound and westbound was established. Figure 3 shows the constructed global container sea–rail intermodal network containing the NSR and the NWP. To easily distinguish the routes, different colors are set for different links of the container shipping network, with pink indicating the trans-Arctic links, dark blue indicating the traditional waterway links and light blue indicating the railway links.

3.3. Container Flow Assignment

3.3.1. Problem Description

Arctic routes provide new transport channels for international trade exchanges. Shipping companies can choose Arctic routes for cargo transportation, which will cause changes in cargo flows in the shipping network. To analyze the assignment of global container flows after the opening of Arctic routes, we established a sea–rail intermodal network container flow assignment model from the perspective of transportation cost and aimed at the minimum cost of the whole transportation process for path selection. The model not only considered meeting the cargo demand but also considered the problem of empty container repositioning due to the unbalanced cargo demand between regions.
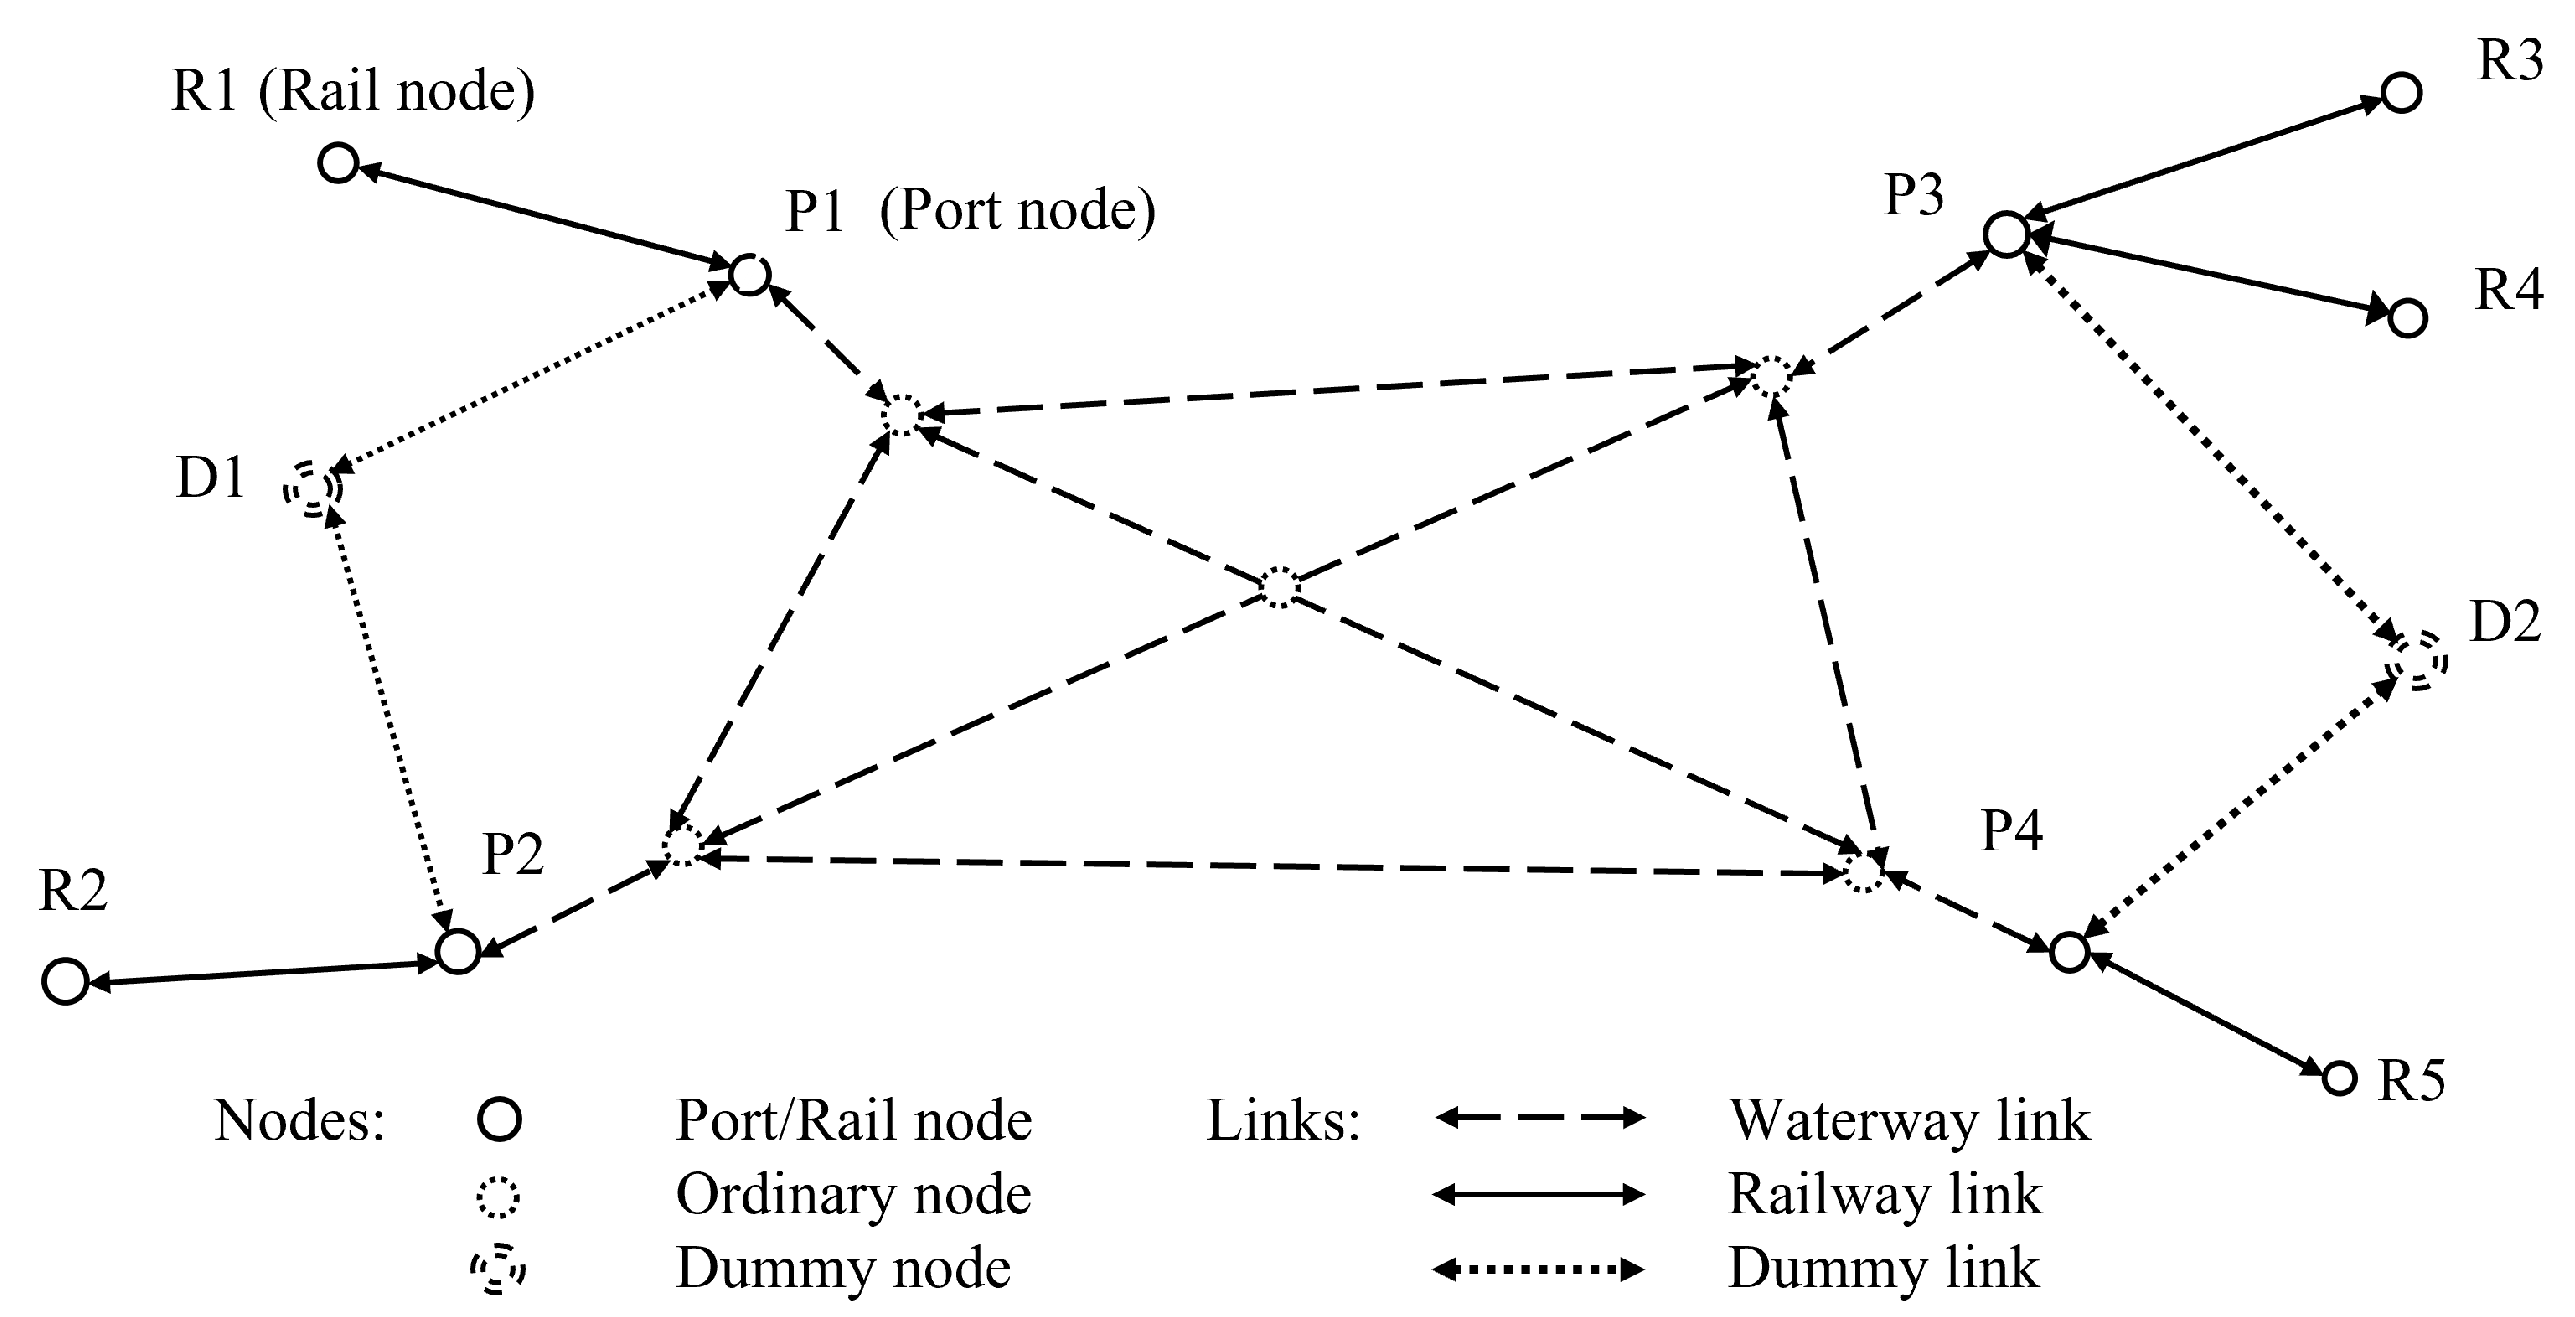
We constructed a global container sea–rail intermodal network consisting of maritime and rail networks, and its abstract network is shown in Figure 4. Topologically, the shipping network was described by a graph, denoted by G ( V , A ) . V indicates the set of nodes and A indicates the set of links in the network. There were three types of nodes: port nodes, ordinary nodes and dummy nodes. It was assumed that the ordinary nodes were the intersections of navigable waterways. Each port node was linked to an ordinary node via a waterway link. Some of the port nodes had transshipment rail nodes within them, and these ports were the linking points between the maritime network and rail network. The full container demands originated and terminated at port nodes. Considering the imbalance between container supply and demand in the network, we added dummy nodes as supply and demand points for excess empty containers to solve the problem of empty container repositioning. The set of links included waterway links, railway links and dummy links. Waterway links connected various ports. Dummy links connected ports and dummy empty container surplus or deficit nodes.
For a better understanding, an an example is given of a shipping network with 10 container demands from port 1 (P1) to port 4 (P4) and 15 container demands from port 2 (P2) to port 3 (P3), respectively. After the container transportation demand is met, port 1 and port 2 will experience empty container demand, while port 3 and port 4 will generate excess empty containers. Thus, empty containers need to be repositioned. The remaining empty containers will be concentrated in dummy node 2 through the dummy link, and all empty container demand will be concentrated in dummy node 1. Thus, the normal OD demand from dummy node 2 to 1 is established. We set the capacity of links D1-P1 and P4-D2 to 10 and the capacity of links D1-P2 and P3-D2 to 15.
To simplify the problem, we propose the following assumptions in this study: (1) It is assumed that the liner shipping company does not have its fleet, and all the ships used for transport come from the charter market. (2) Container types include twenty-foot and forty-foot equivalent unit containers. Full and empty containers are transferred throughout the network to meet the fixed demand between various port nodes. (3) The shipping costs mainly include capital cost and voyage cost. Specifically, charter costs, fuel costs during the voyage and container handling costs are calculated. In the rail network, railway freight is mainly considered. The cost of the dummy link is assumed to be zero. In addition, the transshipment costs of the nodes are not considered. (4) Each link has a capacity limit. The demand of the port determines the capacity of the waterway links connecting to the ports. The capacity of other waterway links is assumed to be very large. The capacity of the dummy links is set to the corresponding excess or shortage of the container volume.

3.3.2. Mathematical Model

For discussion convenience, we summarize the notations used in this paper in Table 1 below.
Before presenting the mathematical formulation, we first established the network’s cost functions for the waterway and railway links.
Shipping costs in the maritime network include costs incurred during voyages and costs incurred in ports. The model proposed in this paper considered the cost of loading and unloading containers at the port, including both full containers and empty containers. In addition, the voyage cost and charter cost were also considered. c i j ( · ) is the charter cost function of the link ( i , j ) , v i j ( · ) is the voyage cost function of the link ( i , j ) . The shipping costs C 1 in the network can be expressed as:
C 1 = ( i , j ) A c i j k f K f y f x i j f + k e K e y e x i j e + ( i , j ) A v i j k f K f y f x i j f + k e K e y e x i j e + ( i , j ) A k f K f h i j f x i j f + ( i , j ) A k e K e h i j e x i j e
Compared to shipping costs, rail costs are much simpler. Since national governments generally set railway freight rates, the principles of calculating the cost of railway costs are uniform. Total freight is the product of container freight rate, weight billed and mileage. Similarly, full containers and empty containers are considered in the railway network. The rail costs C 2 in the network can be expressed as:
C 2 = ( i , j ) A ¯ R i j f x i j f d i s i j + ( i , j ) A ¯ R i j e x i j e d i s i j
The container flow assignment problem can be formulated as follows:
min C 1 + C 2
j x i j f x j i f = d i f , i v , k f K f
j x i j e x j i e = d i e , i v , k e K e
k f K f y f x i j f + k e K e y e x i j e u i j , ( i , j ) B
x i j f 0 , ( i , j ) B
x i j e 0 , ( i , j ) B
d i f = q i f , if i = r O q r f , if i = s D 0 , otherwise
d i e = q i e , if i = r O q r e , if i = s D 0 , otherwise
The objective function (3) is the sum of the shipping cost and the railway cost of container shipping. Equations (4) and (5) ensure that each node flow is conserved. Equation (6) limits the container flow of each link to its maximum passing capacity. Equations (7) and (8) restrict the decision variable to be non-negative. Equations (9) and (10) indicate that the node surplus at the origin and destination ports should meet the port’s container demand.

3.4. Solution Method

Based on the shortest path cargo flow assignment method, this paper regarded the transportation cost on each path as impedance and changed the path impedance of different transportation modes, then realized the cargo flow assignment of the global container shipping network. The shortest path cargo flow assignment method is not constrained by conditions such as geographical limitations and path capacity. It usually assigns the cargo flow demand between all ports to the corresponding shortest path of the cargo flow in the shipping network. The shortest path cargo flow assignment method is more convenient and faster than the mathematical model cargo flow assignment method in dealing with large-scale shipping networks’ cargo flow assignment problems. In addition, this method is consistent with the empirical fact that trains and ships on railways and waterways mostly choose the shortest route for transportation.
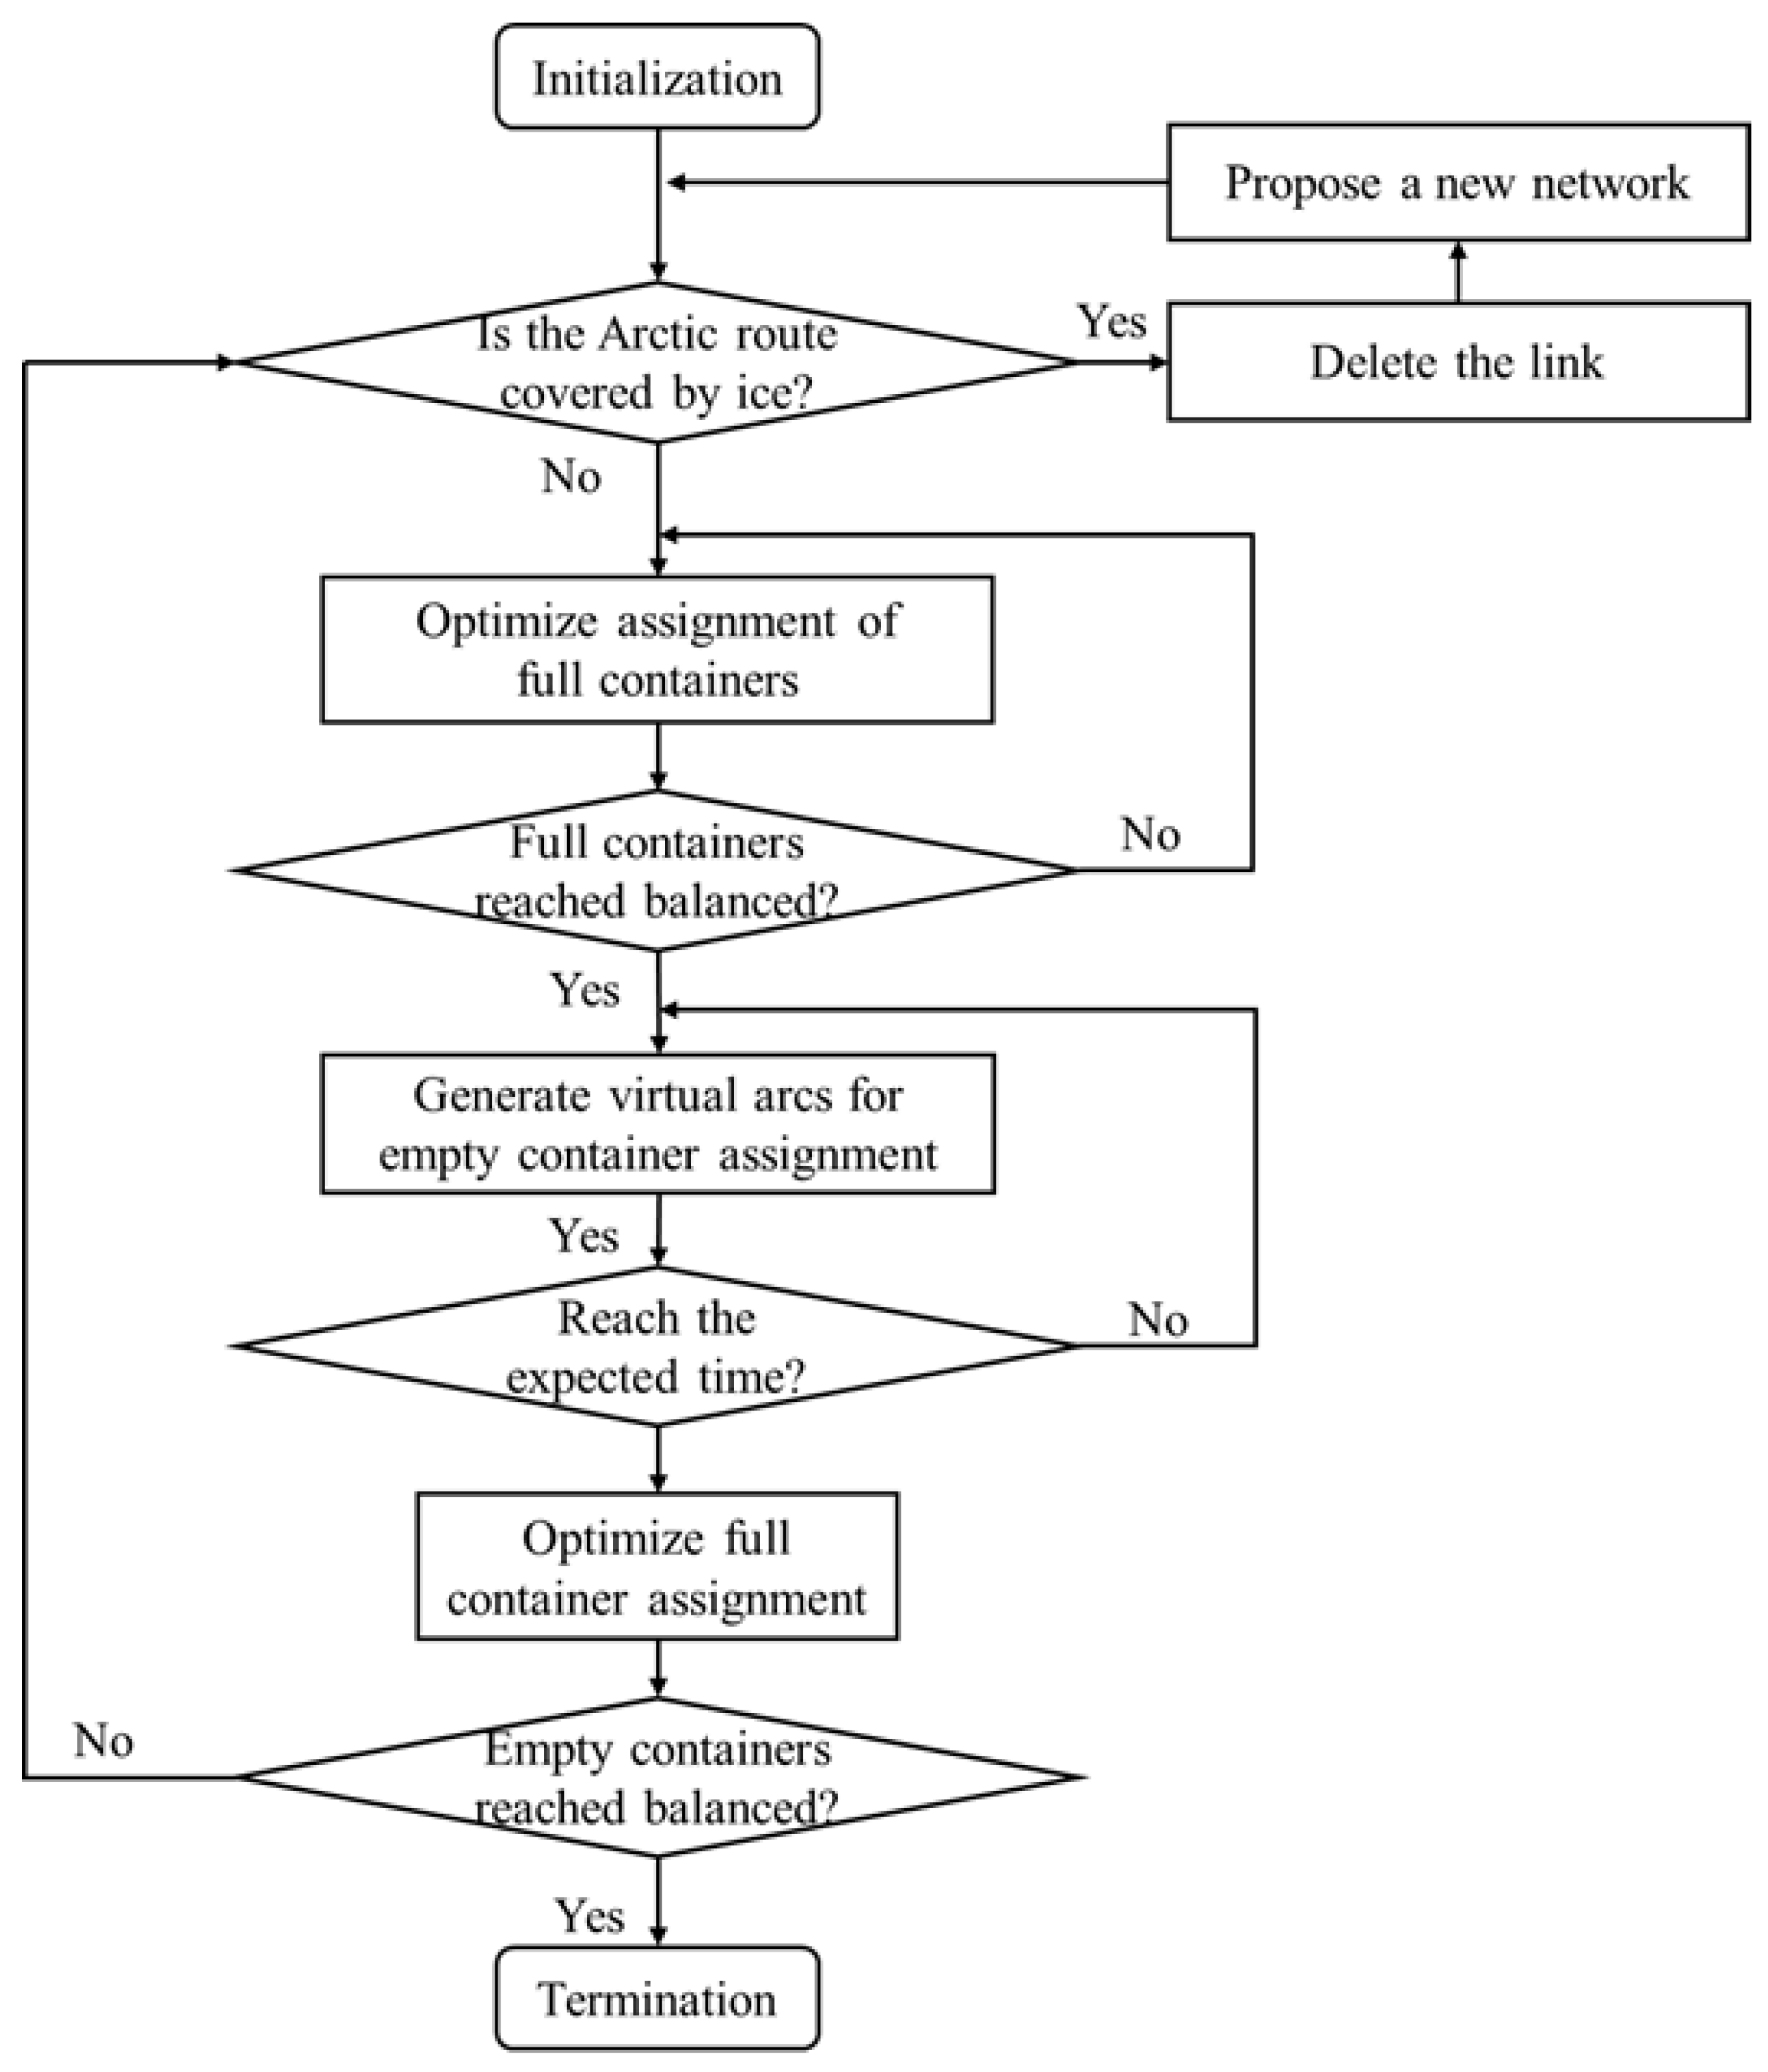
The planning and simulation of the container flow assignment of the network were carried out in line with the specific process design shown in Figure 5.
Step 0: Establish a global container shipping network based on the current shipping network and container demand between ports. In the initial step of the simulation, the Arctic sea ice extent in March 2020 is used as the initial state, and the time interval is six months. Based on the temporal variation of Arctic ice melt, the system generates Arctic Sea ice extent every six months based on the predicted data.
Step 1: Determine whether the Arctic route is covered by sea ice based on the sea ice extent. If the Arctic route is blocked, go to Step 2. Otherwise, it is proved that the Arctic route is navigable and repeat Step 1 until all Arctic routes are reviewed. Then, go to Step 3.
Step 2: When the Arctic route is covered by sea ice and is not navigable, this route is deleted, and a new container shipping network is generated.
Step 3: Based on the established model, the flow assignment is performed separately for full containers and empty containers. When the demand for empty and full containers reaches equilibrium among all ports, the result of container flow assignment under Arctic sea ice extent is output, and then go to Step 4.
Step 4: Determine whether the forecast period is reached (September 2050). If the expected time is not reached, return to Step 0. Otherwise, terminate the procedure and report the results.

4. Numerical Examples

4.1. Data Collection and Processing

4.1.1. Sea Ice Forecast

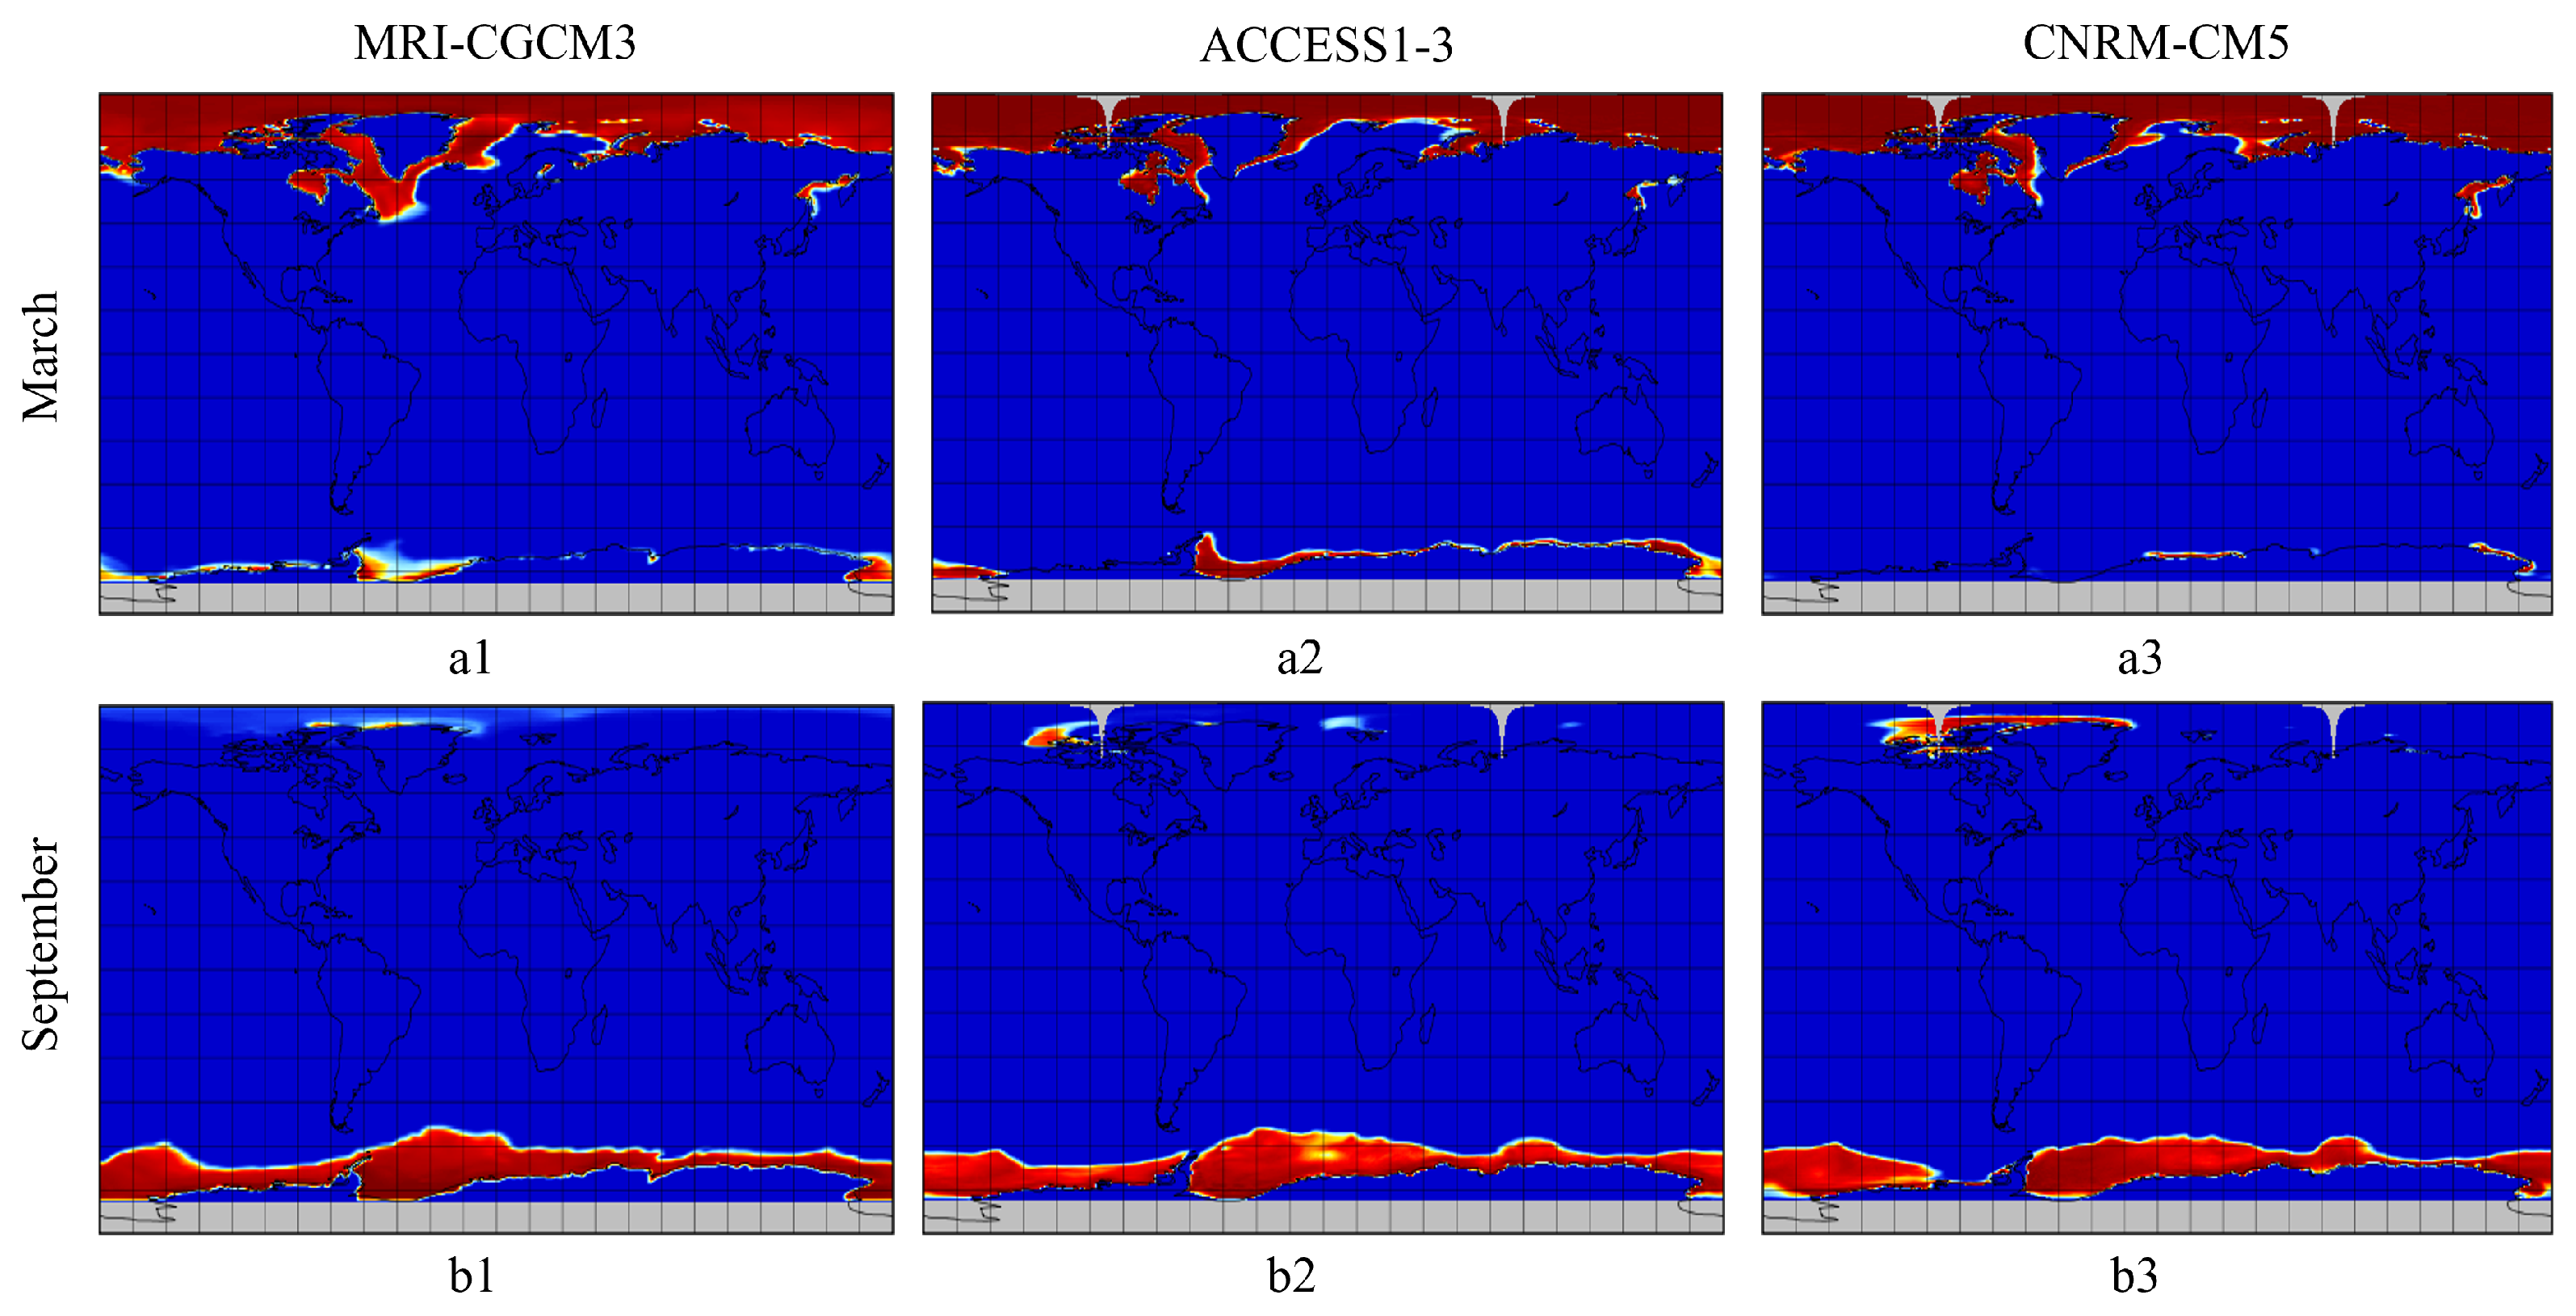
Arctic sea ice concentration was processed in the form of gridded data, and the models applied were MRI-CGCM3, ACCESS1-3 and CNRM-CM5. This paper selected 2020, 2030 and 2050 as the forecast time for analysis. Moreover, to compare the ice melt in different seasons in the Arctic, March and September were selected as the observation periods in winter and summer, respectively. To facilitate data processing, this paper addressed sea ice concentration in the form of gridded data. By establishing the horizontal and vertical coordinates of longitude and latitude, the earth’s surface was divided into 360 × 360 grids. Since the sea ice concentration was the ratio of the sea ice coverage area in a single network cell to the total area of the entire grid, the data value ranged from 0 to 100, with 0 representing no sea ice coverage and 100 representing complete sea ice coverage.
We use Microcity combined with the three models of MRI-CGCM3, ACCESS1-3 and CNRM-CM5 for the prediction. Sea ice concentration generated different colors based on a linear relationship. It can be observed from Figure 6 that the results of sea ice cover predicted by different models are similar, but there are still differences. Taking the prediction results for September 2050 as an example, the simulation results using the MRI-CGCM3 model show a narrow ice extent in the Arctic, while the simulation results using the CNRM-CM5 model show a much larger extent.
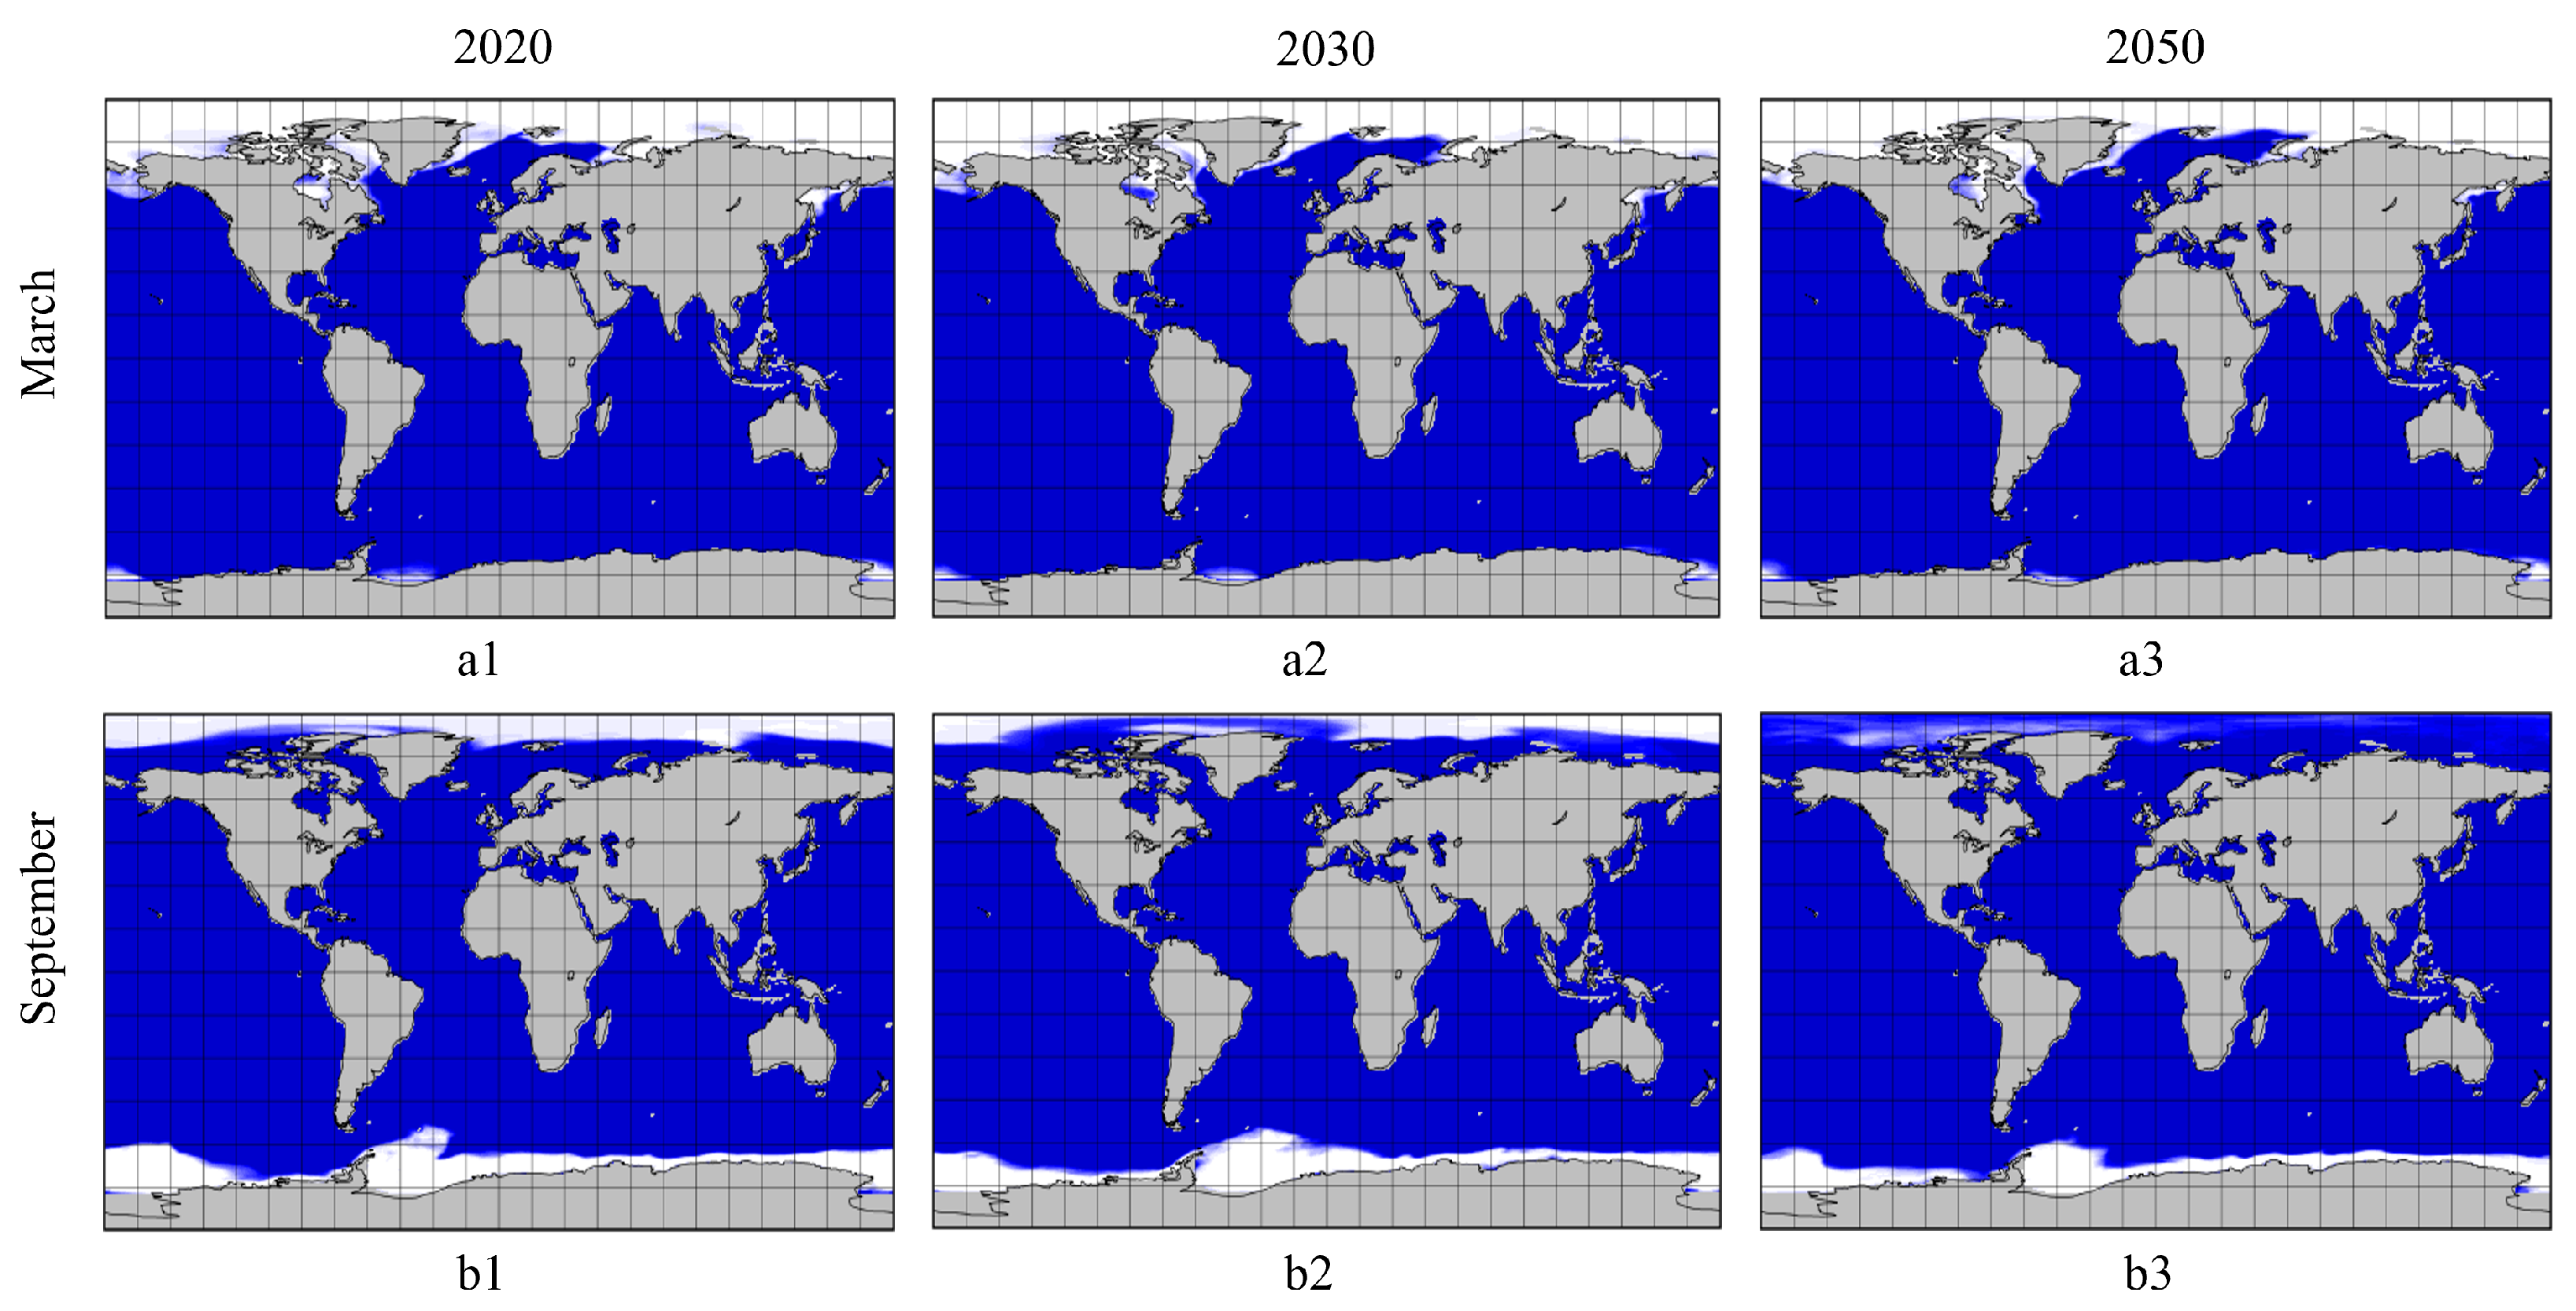
To reduce the error, the results of the three models were comprehensively processed and we selected the results reflected in more than 50% of the models as the standard. The sea ice concentration of 15% was used as the boundary between the presence or absence of sea ice [38]. Comparing b1 and b3 in Figure 7, it can be found that compared to 2020, the sea ice extent in the Arctic area in 2050 was significantly reduced and the navigable area was expanded.
It can be seen from the results that the extent of Arctic sea ice will gradually shrink in the future. Although the winter ice situation represented by March changed little and the Arctic region will still be covered by ice and snow in the future, the ice and snow around Greenland will disappear in summer. The ice in Russia’s northern seas is disappearing, and by 2050, Russia’s northern seas could meet navigable conditions for Arctic routes. Therefore, from the perspective of geographical conditions, the opening of the Arctic routes in the future is feasible and will have a non-negligible impact on the assignment of cargo flows in the global container shipping network.

4.1.2. Transportation Costs

The sea–rail intermodal network includes waterway and railway links, so the container transportation cost is also composed of maritime and rail costs.
Considering the limitation of the Panama Canal waterway, we uniformly chose Panamax container ships as the carriers in the shipping network. We took a 5000 TEU ship as a sample ship with a gross tonnage of 53,453 t, a length of 294.1 m, a draft of 13.5 m and a main engine power of 55,917 kW. The ship had an economic ship speed of 20 knots and a maximum ship speed of 22 knots [39]. The main engine fuel consumption rate was fixed at 185 (g/KWh). Other relevant data were calculated under full load conditions. Container shipping cost is mainly divided into capital cost, operating cost and voyage cost. The capital cost is the charter cost of the shipping company and was set at USD 19,000 per day [39]. Referring to the operating and management costs of the Panama Canal, the operating cost was assumed to be USD 5000 per day. In the voyage cost, we mainly calculated fuel cost and port charges. Fuel cost is related to fuel price and fuel consumption, and the fuel consumption depends on the ship’s speed and its main engine parameters. According to the Bunker Index, the average price of the set fuel IFO 380 is USD 400 per ton. Port charges include all costs incurred by the ship in entering and leaving the port, channel and berthing. We focused on container handling costs, which vary from port to port. To simplify the calculation, we assumed a uniform price of USD 50 per TEU [40].
Compared to maritime transport, the cost of rail freight is simpler to calculate. The rail cost of container transportation can be defined as the product of container freight rate, weight and mileage. The mileage is the shortest path between two nodes of the rail network. Since container freight rates are related to the mileage within the country, they may vary among different countries. We classified each country by continent and set different container freight rates for different continents. To facilitate the calculation, we converted the weight of the container according to its dimensional standards. The weight of a twenty-foot container is 22 tons, and the weight of a forty-foot container is 27 tons.

4.2. Results Analysis

4.2.1. Impact of Arctic Routes on Flow Assignment

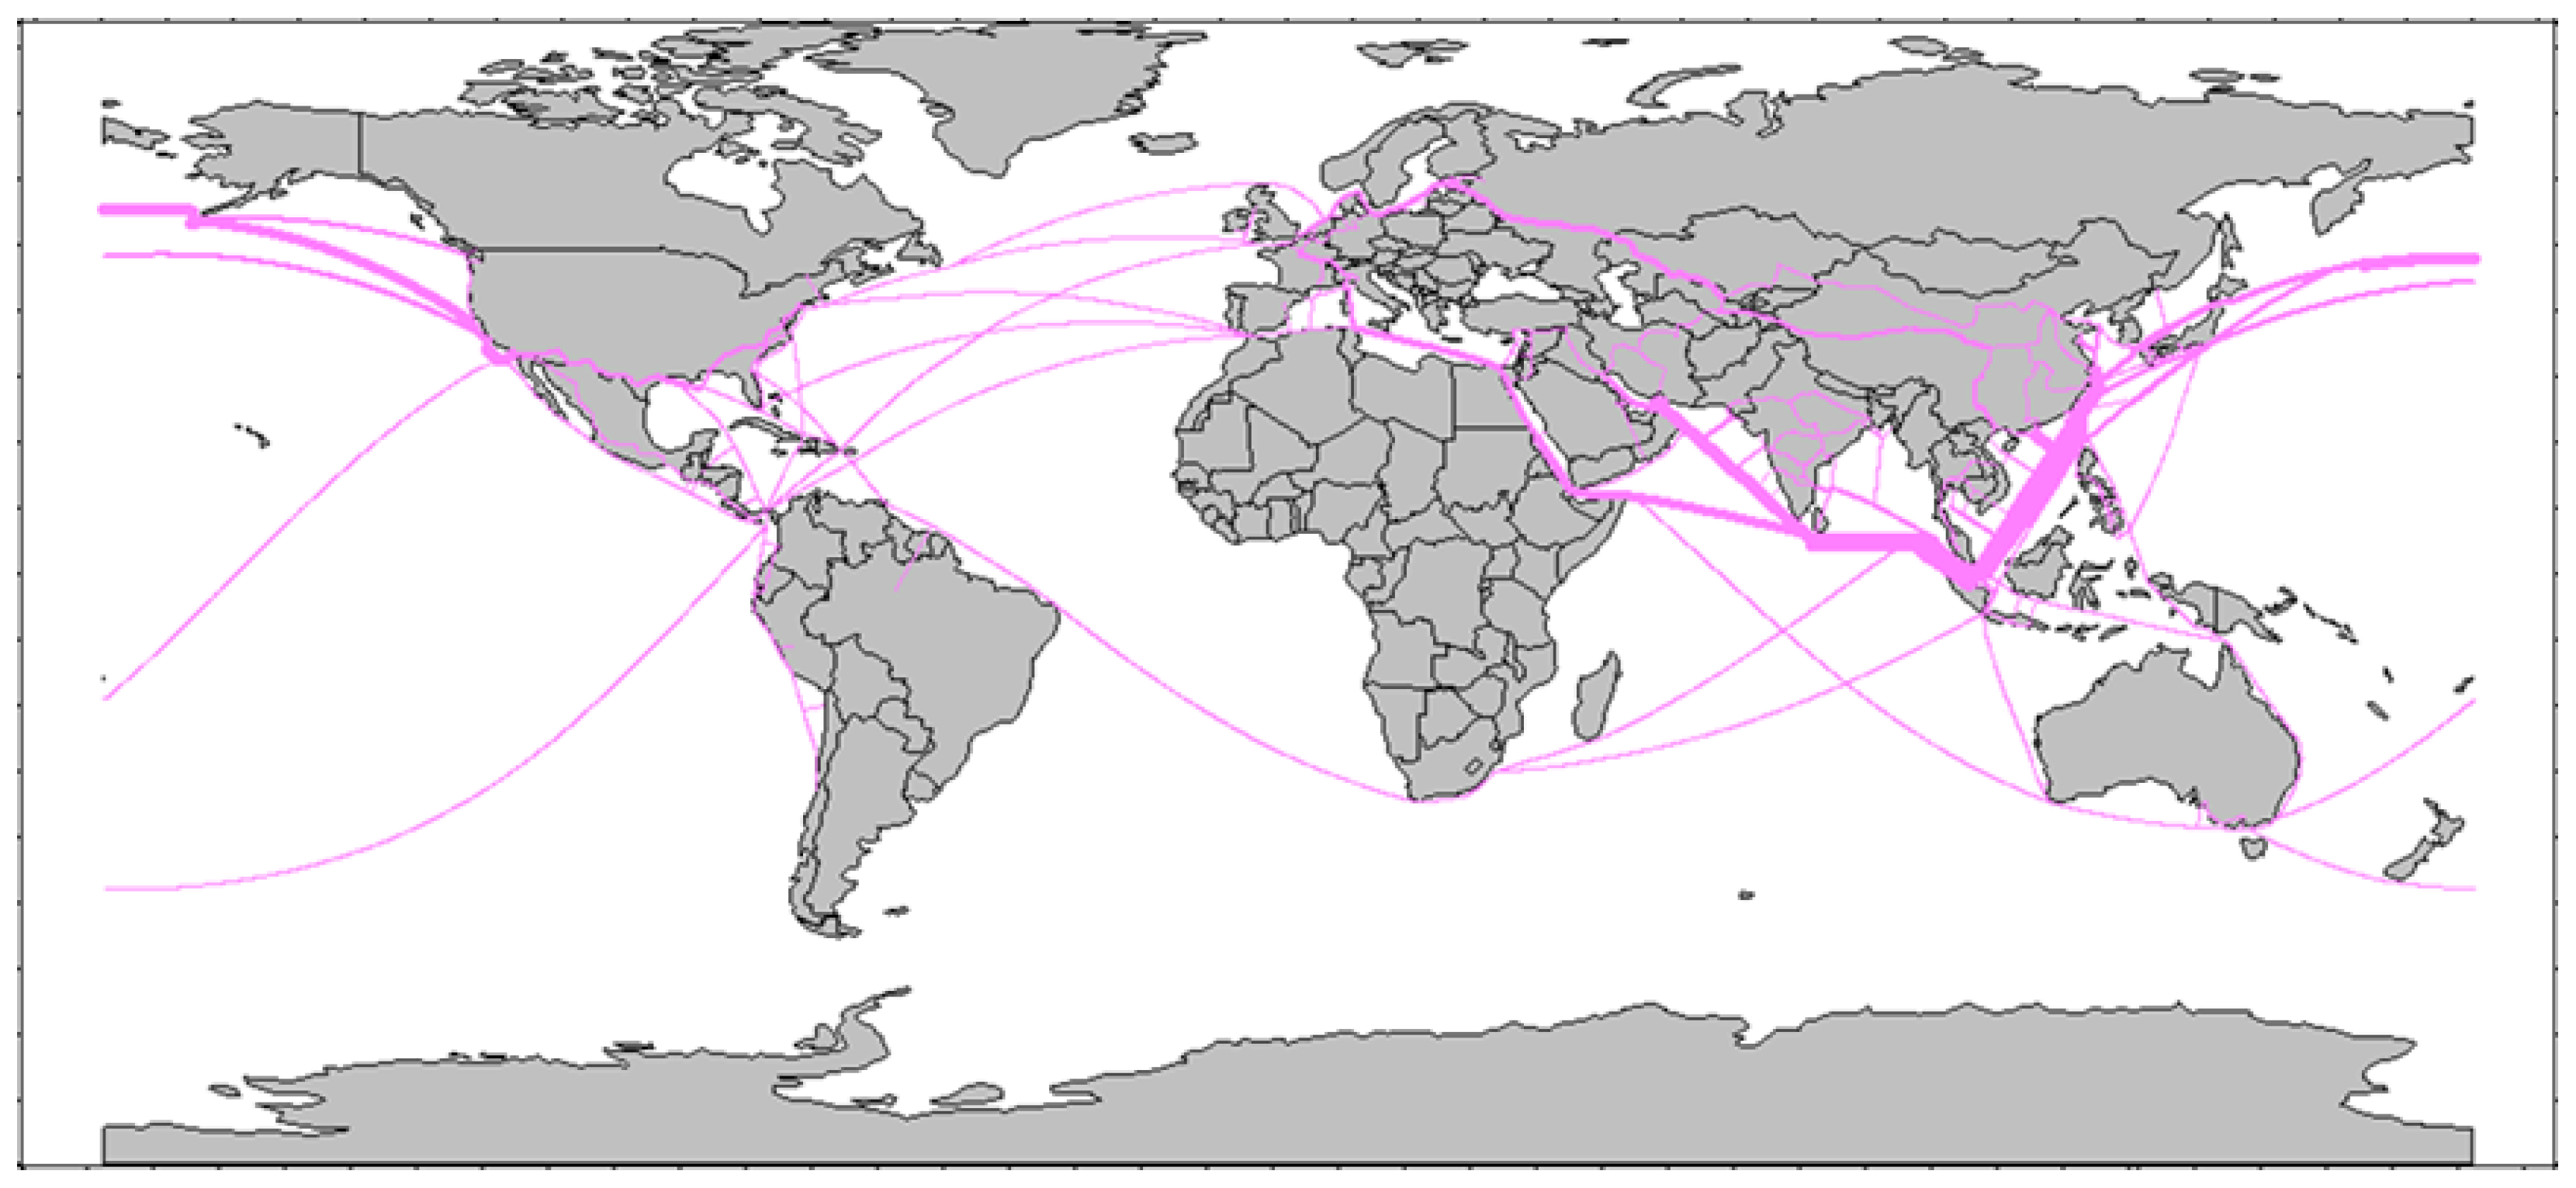
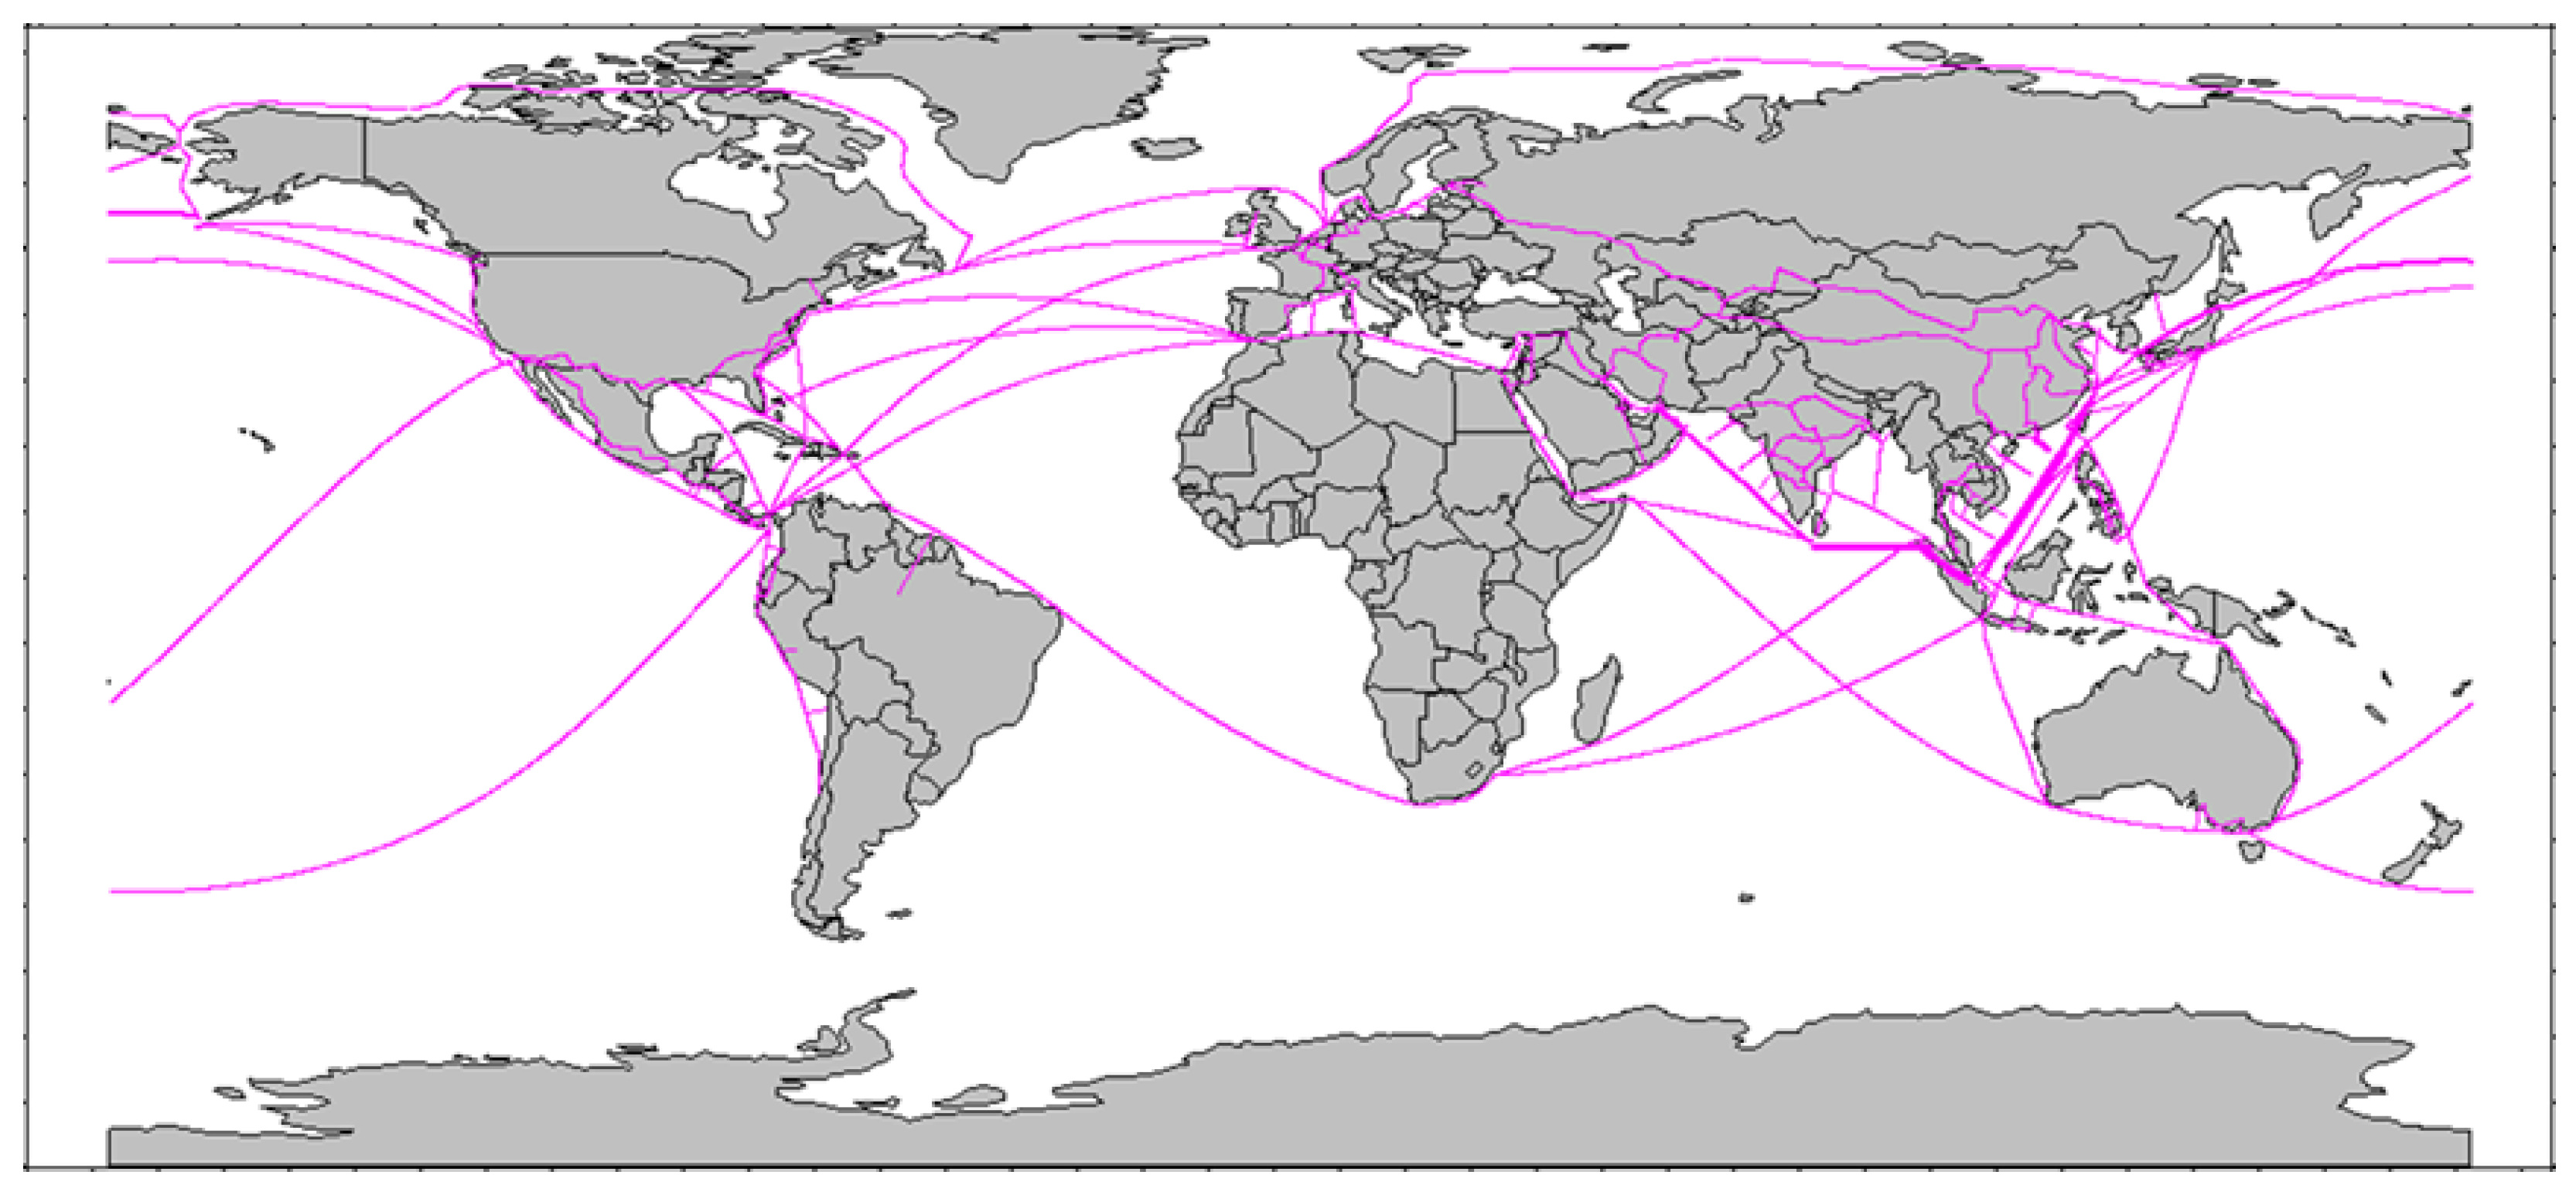
With the optimization and simulation of the container flow assignment model, we obtained the container flow assignment results of the global container sea-rail intermodal network. Figure 8 and Figure 9 show the results of container flow assignment when not considering and considering the Arctic routes, respectively. The NSR and the NWP share about 4% of the global container flow after opening the Arctic routes. Comparing Figure 8 and Figure 9, it can be found that the container flow of the traditional routes changes after the Arctic navigation. Especially, the container flow through the Malacca Strait, the Mandeb Strait and the Hormuz Strait is greatly reduced. In addition, the opening of the Arctic routes has little impact on the assignment of container flow in the rail network, with a slight decrease in container flows through the Eurasian Land Bridge. A further analysis found that opening the Arctic routes would reduce container flow on 34% of the routes in the network. Among the routes with reduced container flows, waterway links account for 52% and railway links account for 19%. Therefore, the Arctic routes have a more significant impact on the assignment of container flows in the maritime network.
To illustrate the changes in container flows assignment in the network after the Arctic navigation, we present the container flows for some routes. As can be seen in Table 2, there is a decreasing trend in the container flow of the major waterways passing through Singapore. Moreover, container flow from Rotterdam to the Suez waterway decreases from 9188 TEU to 6857 TEU per day, while container traffic from the Suez waterway to Hong Kong shows a slight increase. In addition, the Panama Seaway is also negatively affected, with reduced container traffic on the Vancouver–Balboa route decreasing by 1122 TEU per day. After considering transarctic transport, the route from Shanghai to New York via the NWP is assigned 2354 TEU per day, while the route from Busan to Boston via the NWP is assigned 1064 TEU per day. In the railway links, container flow in the Eurasian Land Bridge and the New Eurasian Land Bridge presents a decrease of 12% and 16%. In addition, the total cost of global container transport is reduced by 0.5%. The Arctic routes not only have an important impact on the assignment of container flows in the global shipping network, but they are also able to reduce the total cost of container shipping and bring more competitiveness to container shipping companies.

4.2.2. Impact of Ice Conditions on Flow Assignment

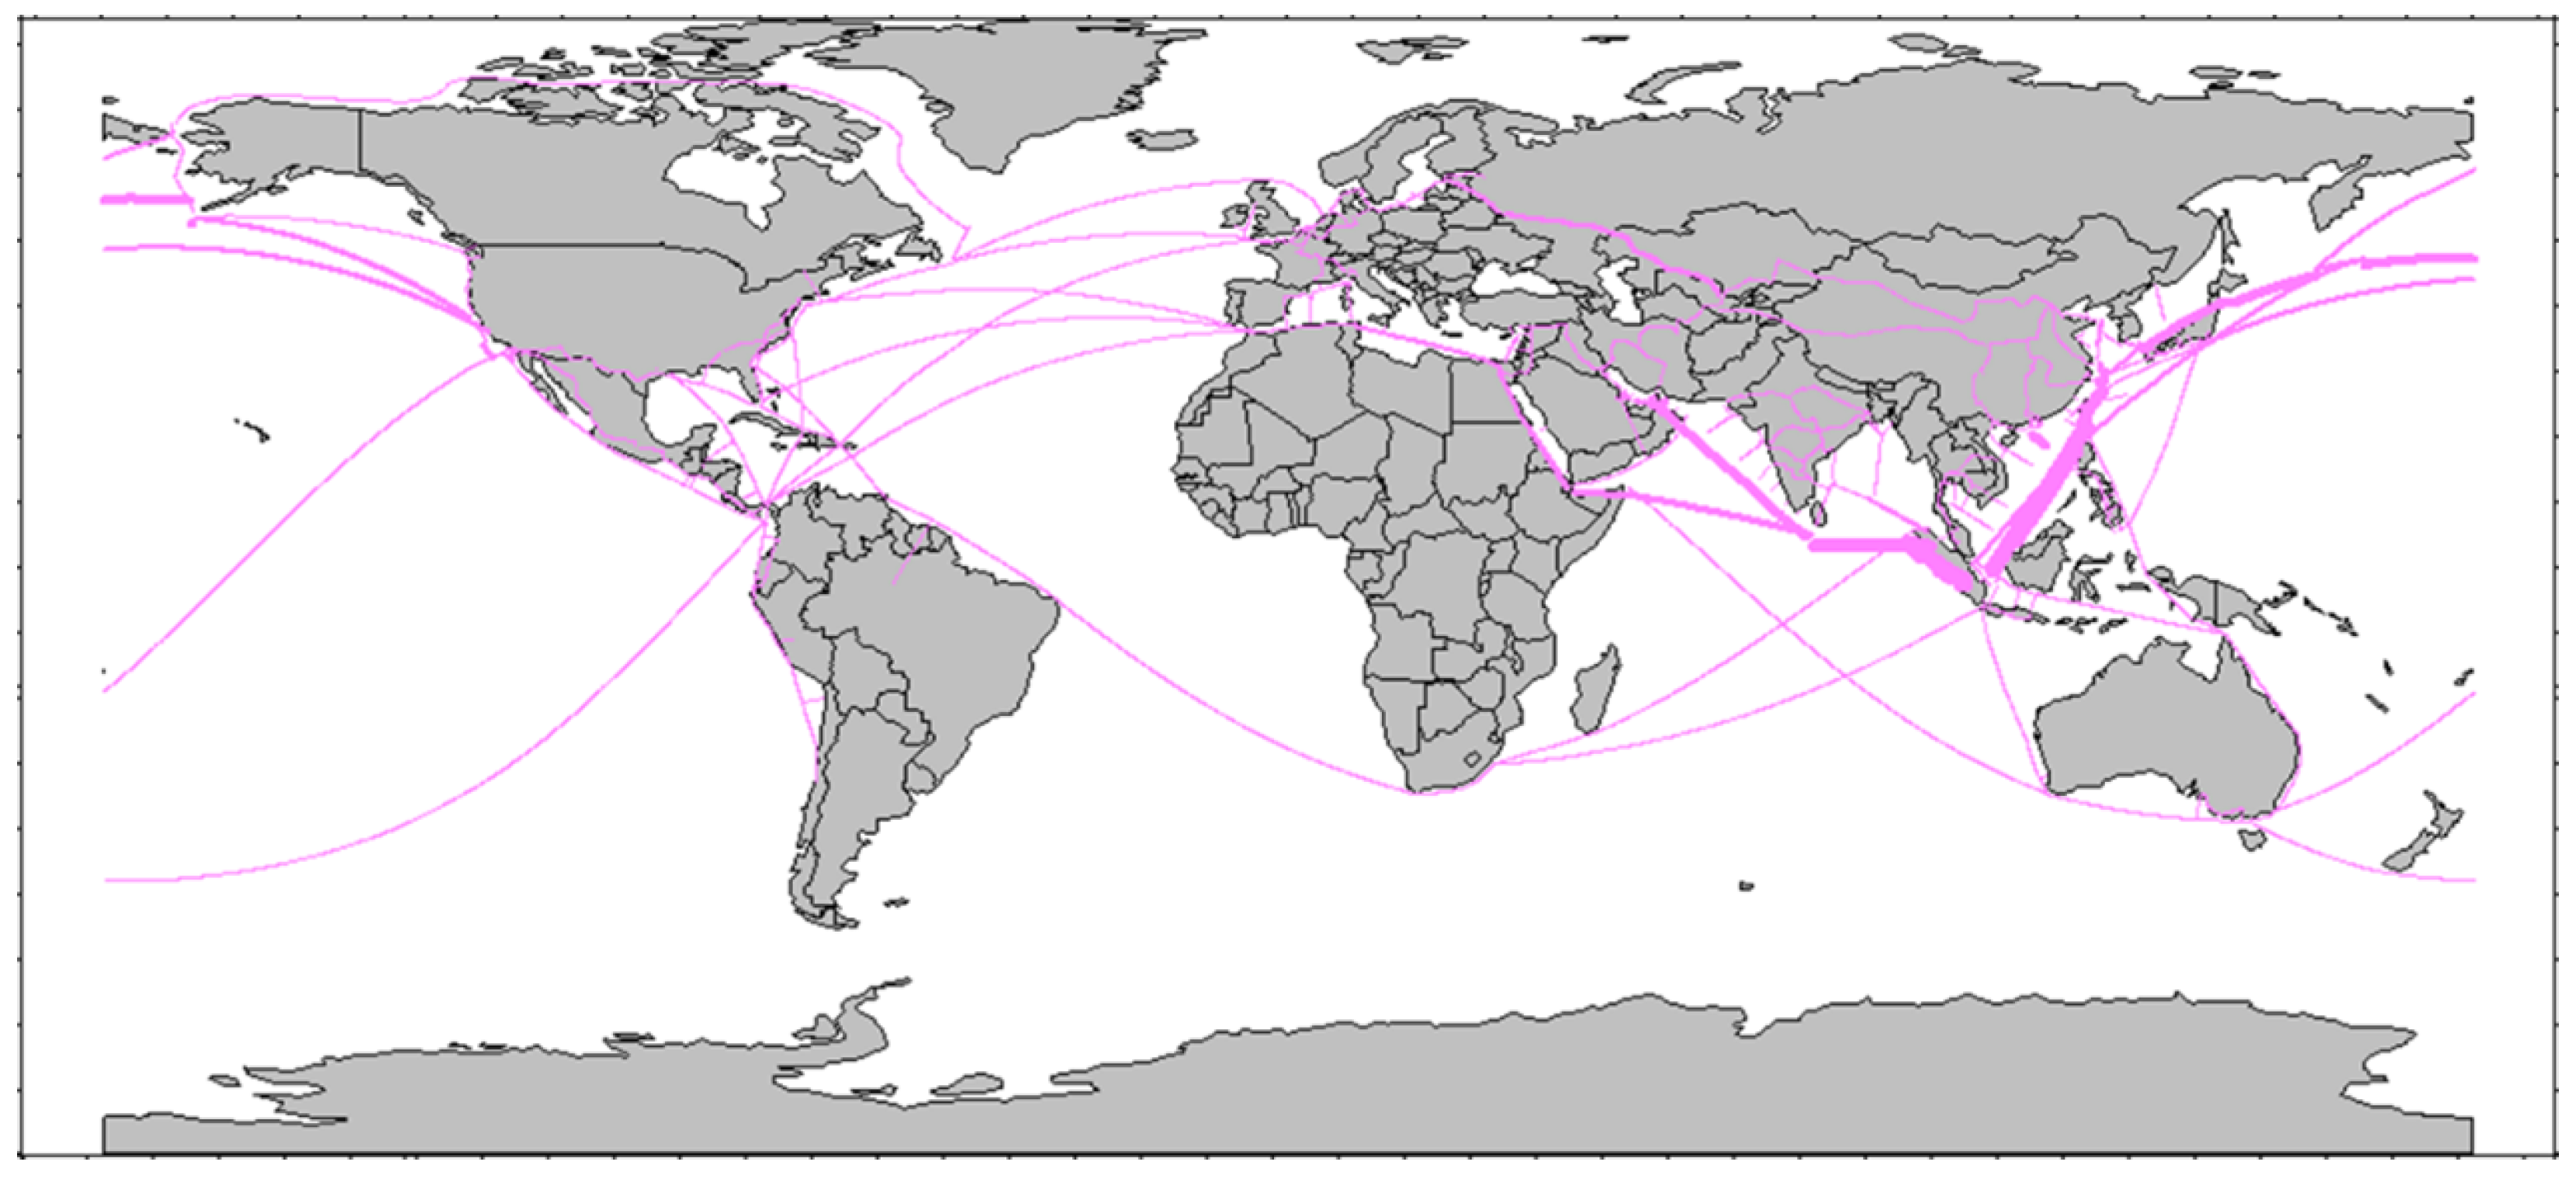
With global warming and changes in Arctic ice melt, parts of the Arctic routes will become navigable. Since the feasibility of Arctic navigation in winter is low, this paper focuses on the Arctic summer ice melt and analyzes the changes in global container flows assignment. Figure 10 shows the results of the global container flow assignment when trans-Arctic transport is considered in the summer of 2020. We can see that only the NWP is navigable in 2020. While in 2050, when the Arctic route is fully navigable in summer, there will be some container traffic on both the NWP and the NSR (Figure 9). In terms of container flows, the NWP carries 1% of total global container flows in the summer of 2020, while in the summer of 2050 when the Arctic is fully navigable, all Arctic routes can carry 4% of total global container traffic.
Compared with the result of the 2020 summer container flow assignment, 27% of the railway links experience a reduction in the container flow, but more than 50% of the railway links see no change in flows. Conversely, 47% of the waterway links in the maritime network reduce container flow, while 16% of the waterway links have no change in flow. In addition, in terms of the distribution of the affected routes, the Asia–Europe and the Asia–North America routes show a significant decrease in cargo flow. Among them, the container flow through the Malacca Strait and the Panama Canal decreases by more than 50%, and the container flow through the Mandeb Strait and the Suez Canal decreases by more than 40%. At the same time, compared to 2020, the total transportation costs of the global shipping network will be reduced by about 0.3% when the Arctic is fully navigable in 2050. Therefore, as the Arctic ice melts, the impact of the Arctic routes on the assignment of container flows in the global shipping network also changes.
We selected the main waterways as the research subjects and present the variation of container flows in the main hub ports along the waterways, as shown is Table 3. In the Malacca Straits, container flow in Singapore and Penang gradually decreases as the Arctic routes become fully navigable. By 2050, the container flow in the two ports drops by 24% and 26%, respectively. As an essential port in the Mandeb Strait, Djibouti suffers the negative impact of Arctic navigation, reducing container flow from 2534 TEU in 2020 to 1607 TEU in 2050. Similarly, container flow in Balboa along the Panama Canal shows a decreasing trend. For ports along other main routes, container flow in the Rotterdam Port remains unchanged, and container flow in Colombo and Seattle declines significantly.

5. Conclusions

Arctic sea ice is melting at an accelerated rate due to climate warming, and it is a key factor limiting the Arctic navigation. The progressive opening of Arctic shipping lanes will change the layout of the maritime network, which in turn will affect the container flows in the network. This paper investigated the container flow assignment in the global sea–rail intermodal shipping network under the change of Arctic sea ice. To solve the above problem, we simulated future changes in sea ice extent using the CMIP5 models, proposed a network flow assignment model to simulate the assignment of container flows in the new global sea–rail intermodal network and solved it with an algorithm.
Our results introduced the following conclusions. First, from the transportation cost side, the opening of the Arctic routes will reduce the total global container transportation costs by 0.5%, which can bring more competitiveness to container shipping enterprises. Secondly, the Arctic routes will compete with traditional routes and share the container flows in traditional routes. Waterways such as the Straits of Malacca and the Suez Canal will be the most negatively impacted, with a significant reduction in container traffic. Thirdly, besides the important impact on the maritime network, the Arctic navigation also leads to a reduction in container flow on the rail network. Compared to the maritime network, the rail network is less affected. Taking the Eurasian Land Bridge as an example, its container flow will be reduced by about 12% after the opening of the Arctic routes. Finally, because the Arctic routes are still severely constrained by ice and snow in winter, and the seasonality of navigation is obvious, the proportion of container flows undertaken in the global container shipping network is still very limited. However, with global warming, the sailing time of the Arctic routes will be expected to be extended annually. The impact of the Arctic routes on the global container shipping network will continue to expand.
Theoretically, our paper considered the feasibility of Arctic navigability after the melting of sea ice, established a global container sea–rail intermodal shipping network including the Arctic routes and assigned the container flow based on the shipping network. In practice, our research can provide valuable management insights for liner shipping companies, port operators and government decision-makers. Specifically, liner companies should make timely adjustments to the shipping network according to the navigability of the Arctic shipping lanes. According to the characteristics of the Arctic shipping lanes at different periods, liner companies can consider deploying different capacities and vessel sizes to reduce transportation costs by using transarctic transportation. For port operators, the Arctic navigation will change the freight flow in the global shipping network, and the port throughput will change with it. The hub position of the southern hemisphere ports will be challenged by the northern ports due to the northward shift of container traffic after the opening of the Arctic routes. For the ports that may benefit from the Arctic routes, they should accelerate the improvement of the sea–rail shipping network of the ports and actively play a transportation hub function. For ports with declining freight volumes, such as Singapore and Penang, they should adjust their port development strategies in time to actively face the economic impact of changes in network traffic. The Arctic route will shorten the distance of maritime trade and increase the efficiency of inter-regional transport. The governments can pursue their strategic interests in the Arctic region and strategically position themselves for a better use of the Arctic routes to facilitate trade development.
It should be noted that the study has some limitations and needs to be improved in future studies. On the one hand, this study did not consider the passage capacity of the shipping lanes. We only analyzed whether the Arctic routes could be opened as sea ice melts. In practice, the extent of Arctic ice melt affects the width of the Arctic shipping lanes, and thus limits the volume of cargo passing through. Further research on Arctic shipping capacity will help to consider the problem of cargo flow in the Arctic more realistically. On the other hand, this study simplified the calculation of transportation costs. We only considered the main container transportation costs, while the actual transportation cost factors are more complex. Future studies need to further refine the classification of transportation costs to consider factors such as container transshipment costs, Arctic route transit costs, etc.
Author Contributions

Conceptualization, Z.S. and R.Z.; methodology, Z.S. and R.Z.; literature survey, T.Z.; data curation, T.Z.; writing, Z.S., R.Z. and T.Z.; supervision, Z.S. All authors have read and agreed to the published version of the manuscript.

Funding

This research was funded in part by the National Natural Science Foundation of China (61304179, 71431001, 71831002); the Humanity and Social Science Youth Foundation of the Ministry of Education (19YJC630151); the International Association of Maritime Universities (20200205-AMC); the Natural Science Foundation of Liaoning Province (2020-HYLH-32); the Dalian Science and Technology Innovation Fund (2020JJ26GX023); the Social Science Planning Fund of Liaoning Province (L19BGL011).

Acknowledgments

We are grateful to Shuang Cong for her help in data collection and her suggestions on the manuscript.

Conflicts of Interest

The authors declare no conflict of interest.

References

  1. Elmi, Z.; Singh, P.; Meriga, V.K.; Goniewicz, K.; Borowska-Stefańska, M.; Wiśniewski, S.; Dulebenets, M.A. Uncertainties in liner shipping and ship schedule recovery: A state-of-the-art review. J. Mar. Sci. Eng. 2022, 10, 563. [Google Scholar] [CrossRef]
  2. Abioye, O.F.; Dulebenets, M.A.; Kavoosi, M.; Pasha, J.; Theophilus, O. Vessel schedule recovery in liner shipping: Modeling alternative recovery options. IEEE Trans. Intell. Transp. Syst. 2020, 22, 6420–6434. [Google Scholar] [CrossRef]
  3. UNCTAD. Review of Maritime Transport 2021; United Nations: New York, NY, USA, 2022; OCLC: 1291391335. [Google Scholar]
  4. Wang, Z.; Silberman, J.A.; Corbett, J.J. Container vessels diversion pattern to trans-Arctic shipping routes and GHG emission abatement potential. Marit. Policy Manag. 2021, 48, 543–562. [Google Scholar] [CrossRef]
  5. Theocharis, D.; Pettit, S.; Rodrigues, V.S.; Haider, J. Arctic shipping: A systematic literature review of comparative studies. J. Transp. Geogr. 2018, 69, 112–128. [Google Scholar] [CrossRef]
  6. Sibul, G.; Jin, J.G. Evaluating the feasibility of combined use of the Northern Sea Route and the Suez Canal Route considering ice parameters. Transp. Res. Part A Policy Pract. 2021, 147, 350–369. [Google Scholar] [CrossRef]
  7. Khon, V.C.; Mokhov, I. Arctic climate changes and possible conditions of Arctic navigation in the 21st century. Izv. Atmos. Ocean. Phys. 2010, 46, 14–20. [Google Scholar] [CrossRef]
  8. Döscher, R.; Vihma, T.; Maksimovich, E. Recent advances in understanding the Arctic climate system state and change from a sea ice perspective: A review. Atmos. Chem. Phys. 2014, 14, 13571–13600. [Google Scholar] [CrossRef]
  9. Guemas, V.; Blanchard-Wrigglesworth, E.; Chevallier, M.; Day, J.J.; Déqué, M.; Doblas-Reyes, F.J.; Fučkar, N.S.; Germe, A.; Hawkins, E.; Keeley, S.; et al. A review on Arctic sea-ice predictability and prediction on seasonal to decadal time-scales. Q. J. R. Meteorol. Soc. 2016, 142, 546–561. [Google Scholar] [CrossRef]
  10. Ng, A.K.; Andrews, J.; Babb, D.; Lin, Y.; Becker, A. Implications of climate change for shipping: Opening the Arctic seas. Wiley Interdiscip. Rev. Clim. Chang. 2018, 9, e507. [Google Scholar] [CrossRef]
  11. Kim, G.S.; Lee, S.W.; Seo, Y.J.; Kim, A.R. Multimodal transportation via TSR for effective Northern logistics: Perspectives of Korean logistics companies. Marit. Bus. Rev. 2020, 5, 291–308. [Google Scholar] [CrossRef] [Green Version]
  12. Seo, Y.J.; Chen, F.; Roh, S.Y. Multimodal transportation: The case of laptop from Chongqing in China to Rotterdam in Europe. Asian J. Shipp. Logist. 2017, 33, 155–165. [Google Scholar] [CrossRef]
  13. Romano, A.; Yang, Z. Decarbonisation of shipping: A state of the art survey for 2000–2020. Ocean. Coast. Manag. 2021, 214, 105936. [Google Scholar] [CrossRef]
  14. Dulebenets, M.A. Multi-objective collaborative agreements amongst shipping lines and marine terminal operators for sustainable and environmental-friendly ship schedule design. J. Clean. Prod. 2022, 342, 130897. [Google Scholar] [CrossRef]
  15. Baştuğ, S.; Haralambides, H.; Esmer, S.; Eminoğlu, E. Port competitiveness: Do container terminal operators and liner shipping companies see eye to eye? Mar. Policy 2022, 135, 104866. [Google Scholar] [CrossRef]
  16. Bensassi, S.; Stroeve, J.C.; Martínez-Zarzoso, I.; Barrett, A.P. Melting ice, growing trade? Melting ice, growing trade? In Elementa: Science of the Anthropocene; University of California Press: Berkeley, CA, USA, 2016; Volume 4. [Google Scholar]
  17. Meng, Q.; Zhang, Y.; Xu, M. Viability of transarctic shipping routes: A literature review from the navigational and commercial perspectives. Marit. Policy Manag. 2017, 44, 16–41. [Google Scholar] [CrossRef]
  18. Lefebvre, W.; Goosse, H. Analysis of the projected regional sea-ice changes in the Southern Ocean during the twenty-first century. Clim. Dyn. 2008, 30, 59–76. [Google Scholar] [CrossRef]
  19. Laliberté, F.; Howell, S.; Kushner, P. Regional variability of a projected sea ice-free Arctic during the summer months. Geophys. Res. Lett. 2016, 43, 256–263. [Google Scholar] [CrossRef]
  20. Jahn, A.; Kay, J.E.; Holland, M.M.; Hall, D.M. How predictable is the timing of a summer ice-free Arctic? Geophys. Res. Lett. 2016, 43, 9113–9120. [Google Scholar] [CrossRef]
  21. Zhang, Z.; Huisingh, D.; Song, M. Exploitation of trans-Arctic maritime transportation. J. Clean. Prod. 2019, 212, 960–973. [Google Scholar] [CrossRef]
  22. Xu, H.; Yang, D.; Weng, J. Economic feasibility of an NSR/SCR-combined container service on the Asia-Europe lane: A new approach dynamically considering sea ice extent. Marit. Policy Manag. 2018, 45, 514–529. [Google Scholar] [CrossRef]
  23. Cheaitou, A.; Faury, O.; Cariou, P.; Hamdan, S.; Fabbri, G. Economic and environmental impacts of Arctic shipping: A probabilistic approach. Transp. Res. Part Transp. Environ. 2020, 89, 102606. [Google Scholar] [CrossRef]
  24. Corman, F.; Viti, F.; Negenborn, R.R. Equilibrium models in multimodal container transport systems. Flex. Serv. Manuf. J. 2017, 29, 125–153. [Google Scholar] [CrossRef]
  25. Shibasaki, R.; Kawasaki, T. International intermodal container shipping network in South Asia: Modelling and policy simulations. Int. J. Shipp. Transp. Logist. 2021, 13, 70–101. [Google Scholar] [CrossRef]
  26. Rosell, F.; Codina, E.; Montero, L. A combined and robust modal-split/traffic assignment model for rail and road freight transport. Eur. J. Oper. Res. 2022, 303, 688–698. [Google Scholar] [CrossRef]
  27. Bell, M.G.; Liu, X.; Angeloudis, P.; Fonzone, A.; Hosseinloo, S.H. A frequency-based maritime container assignment model. Transp. Res. Part Methodol. 2011, 45, 1152–1161. [Google Scholar] [CrossRef]
  28. Bell, M.G.; Liu, X.; Rioult, J.; Angeloudis, P. A cost-based maritime container assignment model. Transp. Res. Part B Methodol. 2013, 58, 58–70. [Google Scholar] [CrossRef]
  29. Song, D.P.; Dong, J.X. Cargo routing and empty container repositioning in multiple shipping service routes. Transp. Res. Part B Methodol. 2012, 46, 1556–1575. [Google Scholar]
  30. Sun, Z.; Zheng, J. Finding potential hub locations for liner shipping. Transp. Res. Part B Methodol. 2016, 93, 750–761. [Google Scholar] [CrossRef]
  31. Lin, D.Y.; Huang, K.L. An equilibrium-based network model for international container flows. Marit. Policy Manag. 2017, 44, 1034–1055. [Google Scholar] [CrossRef]
  32. Ozcan, S.; Eliiyi, D.T.; Reinhardt, L.B. Cargo allocation and vessel scheduling on liner shipping with synchronization of transshipments. Appl. Math. Model. 2020, 77, 235–252. [Google Scholar] [CrossRef]
  33. Wang, H.; Zhang, X.; Wang, S. A joint optimization model for liner container cargo assignment problem using state-augmented shipping network framework. Transp. Res. Part C Emerg. Technol. 2016, 68, 425–446. [Google Scholar] [CrossRef]
  34. Karsten, C.V.; Pisinger, D.; Ropke, S.; Brouer, B.D. The time constrained multi-commodity network flow problem and its application to liner shipping network design. Transp. Res. Part E Logist. Transp. Rev. 2015, 76, 122–138. [Google Scholar] [CrossRef]
  35. Lin, D.Y.; Chang, Y.T. Ship routing and freight assignment problem for liner shipping: Application to the Northern Sea Route planning problem. Transp. Res. Part E Logist. Transp. Rev. 2018, 110, 47–70. [Google Scholar] [CrossRef]
  36. Zeng, Q.; Lu, T.; Lin, K.C.; Yuen, K.F.; Li, K.X. The competitiveness of Arctic shipping over Suez Canal and China-Europe railway. Transp. Policy 2020, 86, 34–43. [Google Scholar] [CrossRef]
  37. Aksenov, Y.; Popova, E.E.; Yool, A.; Nurser, A.G.; Williams, T.D.; Bertino, L.; Bergh, J. On the future navigability of Arctic sea routes: High-resolution projections of the Arctic Ocean and sea ice. Mar. Policy 2017, 75, 300–317. [Google Scholar] [CrossRef]
  38. Parkinson, C.L.; Cavalieri, D.J. Arctic sea ice variability and trends, 1979–2006. J. Geophys. Res. Ocean. 2008, 113. [Google Scholar] [CrossRef]
  39. Clarksons. Shipping Intelligence Network. Available online: https://www.clarksons.net/ (accessed on 6 August 2022).
  40. Shibasaki, R.; Iijima, T.; Kawakami, T.; Kadono, T.; Shishido, T. Network assignment model of integrating maritime and hinterland container shipping: Application to Central America. Marit. Econ. Logist. 2017, 19, 234–273. [Google Scholar] [CrossRef]
Figure 1. Arctic sea ice concentration between September 1990 and September 2020 (Source: NASA data).
Sustainability 14 12214 g001
Figure 2. Simulation framework.
Sustainability 14 12214 g002
Figure 3. Global container sea–rail intermodal network.
Sustainability 14 12214 g003
Figure 4. An illustrative sail–rail intermodal network.
Sustainability 14 12214 g004
Figure 5. Flowchart of the simulated process.
Sustainability 14 12214 g005
Figure 6. Sea-ice predictions in 2050 ((a1a3) indicate the predicted Arctic sea ice extent in March 2050 using different models; (b1b3) indicate the predicted Arctic sea ice extent in September 2050 using different models).
Sustainability 14 12214 g006
Figure 7. The comprehensive forecast results of Arctic sea ice ((a1a3) indicate the sea ice extent in March for 2020, 2030 and 2050, respectively; (b1b3) indicate the sea ice extent in September for 2020, 2030 and 2050, respectively).
Sustainability 14 12214 g007
Figure 8. Simulation results of container flow assignment without considering the Arctic routes.
Sustainability 14 12214 g008
Figure 9. Simulation results of container flow assignment considering the Arctic routes as fully navigable.
Sustainability 14 12214 g009
Figure 10. Simulation results of container flow assignment considering trans-Arctic transport in 2020.
Sustainability 14 12214 g010
Table 1. Notations.
Table 1. Notations.
Sets
VSet of port nodes and rail nodes
PSet of port nodes, including empty container remaining virtual nodes and empty container demand virtual nodes, P V
OSet of origin ports, O P
DSet of destination ports, D P
BSet of links, where B = A A ¯
ASet of waterway links
A ¯ Set of railway links
Parameters
K f Type of full containers
K e Type of empty containers
y f Volume-sharing factor for full containers of type f
y e Volume-sharing factor for empty containers of type e
u i j Capacity of link ( i , j )
d i s i j Distance of link ( i , j )
h i j f Loading and unloading cost of full containers of type f on link ( i , j )
h i j e Loading and unloading cost of empty containers of type e on link ( i , j )
R i j f Freight rates for full containers of type f on link ( i , j )
R i j e Freight rates for empty containers of type e on link ( i , j )
d i f Net flow of full containers of type f at node i
d i e Net flow of empty containers of type e at node i
q i f Demand for full containers of type f at node i
q i e Demand for empty containers of type e at node i
Decision variable
x i j f Flow of full containers of type f on link ( i , j )
x i j e Flow of empty containers of type e on link ( i , j )
Table 2. Changes in container flow assignment after the Arctic navigation (TEU/day).
Current Container Flow AssignmentContainer Flow Assignment Including Arctic Routes
Waterway
Yokohama–Singapore49724443
Shanghai–Singapore18,63415,236
Pusan–Singapore62455143
Manila–Singapore84357899
Balboa–New York72534060
Rotterdam–Suez Canal91886857
Suez Canal–Hong Kong74647568
Vancouver–Balboa33632241
Seattle–Balboa86436256
Miami–Hamburg11351008
Shanghai–New York (via NWP)02354
Busan–Boston (via NWP)01064
Railway
Eurasian Land Bridge41363653
New Eurasian Land Bridge32742751
Table 3. Changes in container flow at main ports (TEU/day).
20202050
Singapore98,53774,574
Penang20241505
Djibouti25341607
Balboa17,2249634
Huston27,36520,046
Colombo15,54512,076
Hamburg30,01229,745
Seattle13,65411,345
Publisher’s Note: MDPI stays neutral with regard to jurisdictional claims in published maps and institutional affiliations.