
Key Logistics Performance Indicators in Low-Income Countries: The Case of the Import–Export Chain in Ethiopia

 , ,
, ,
Abstract
1. Introduction
2. Materials and Methods
2.1. Overview
2.2. Literature Review
2.3. Expert Survey
2.4. Analysis
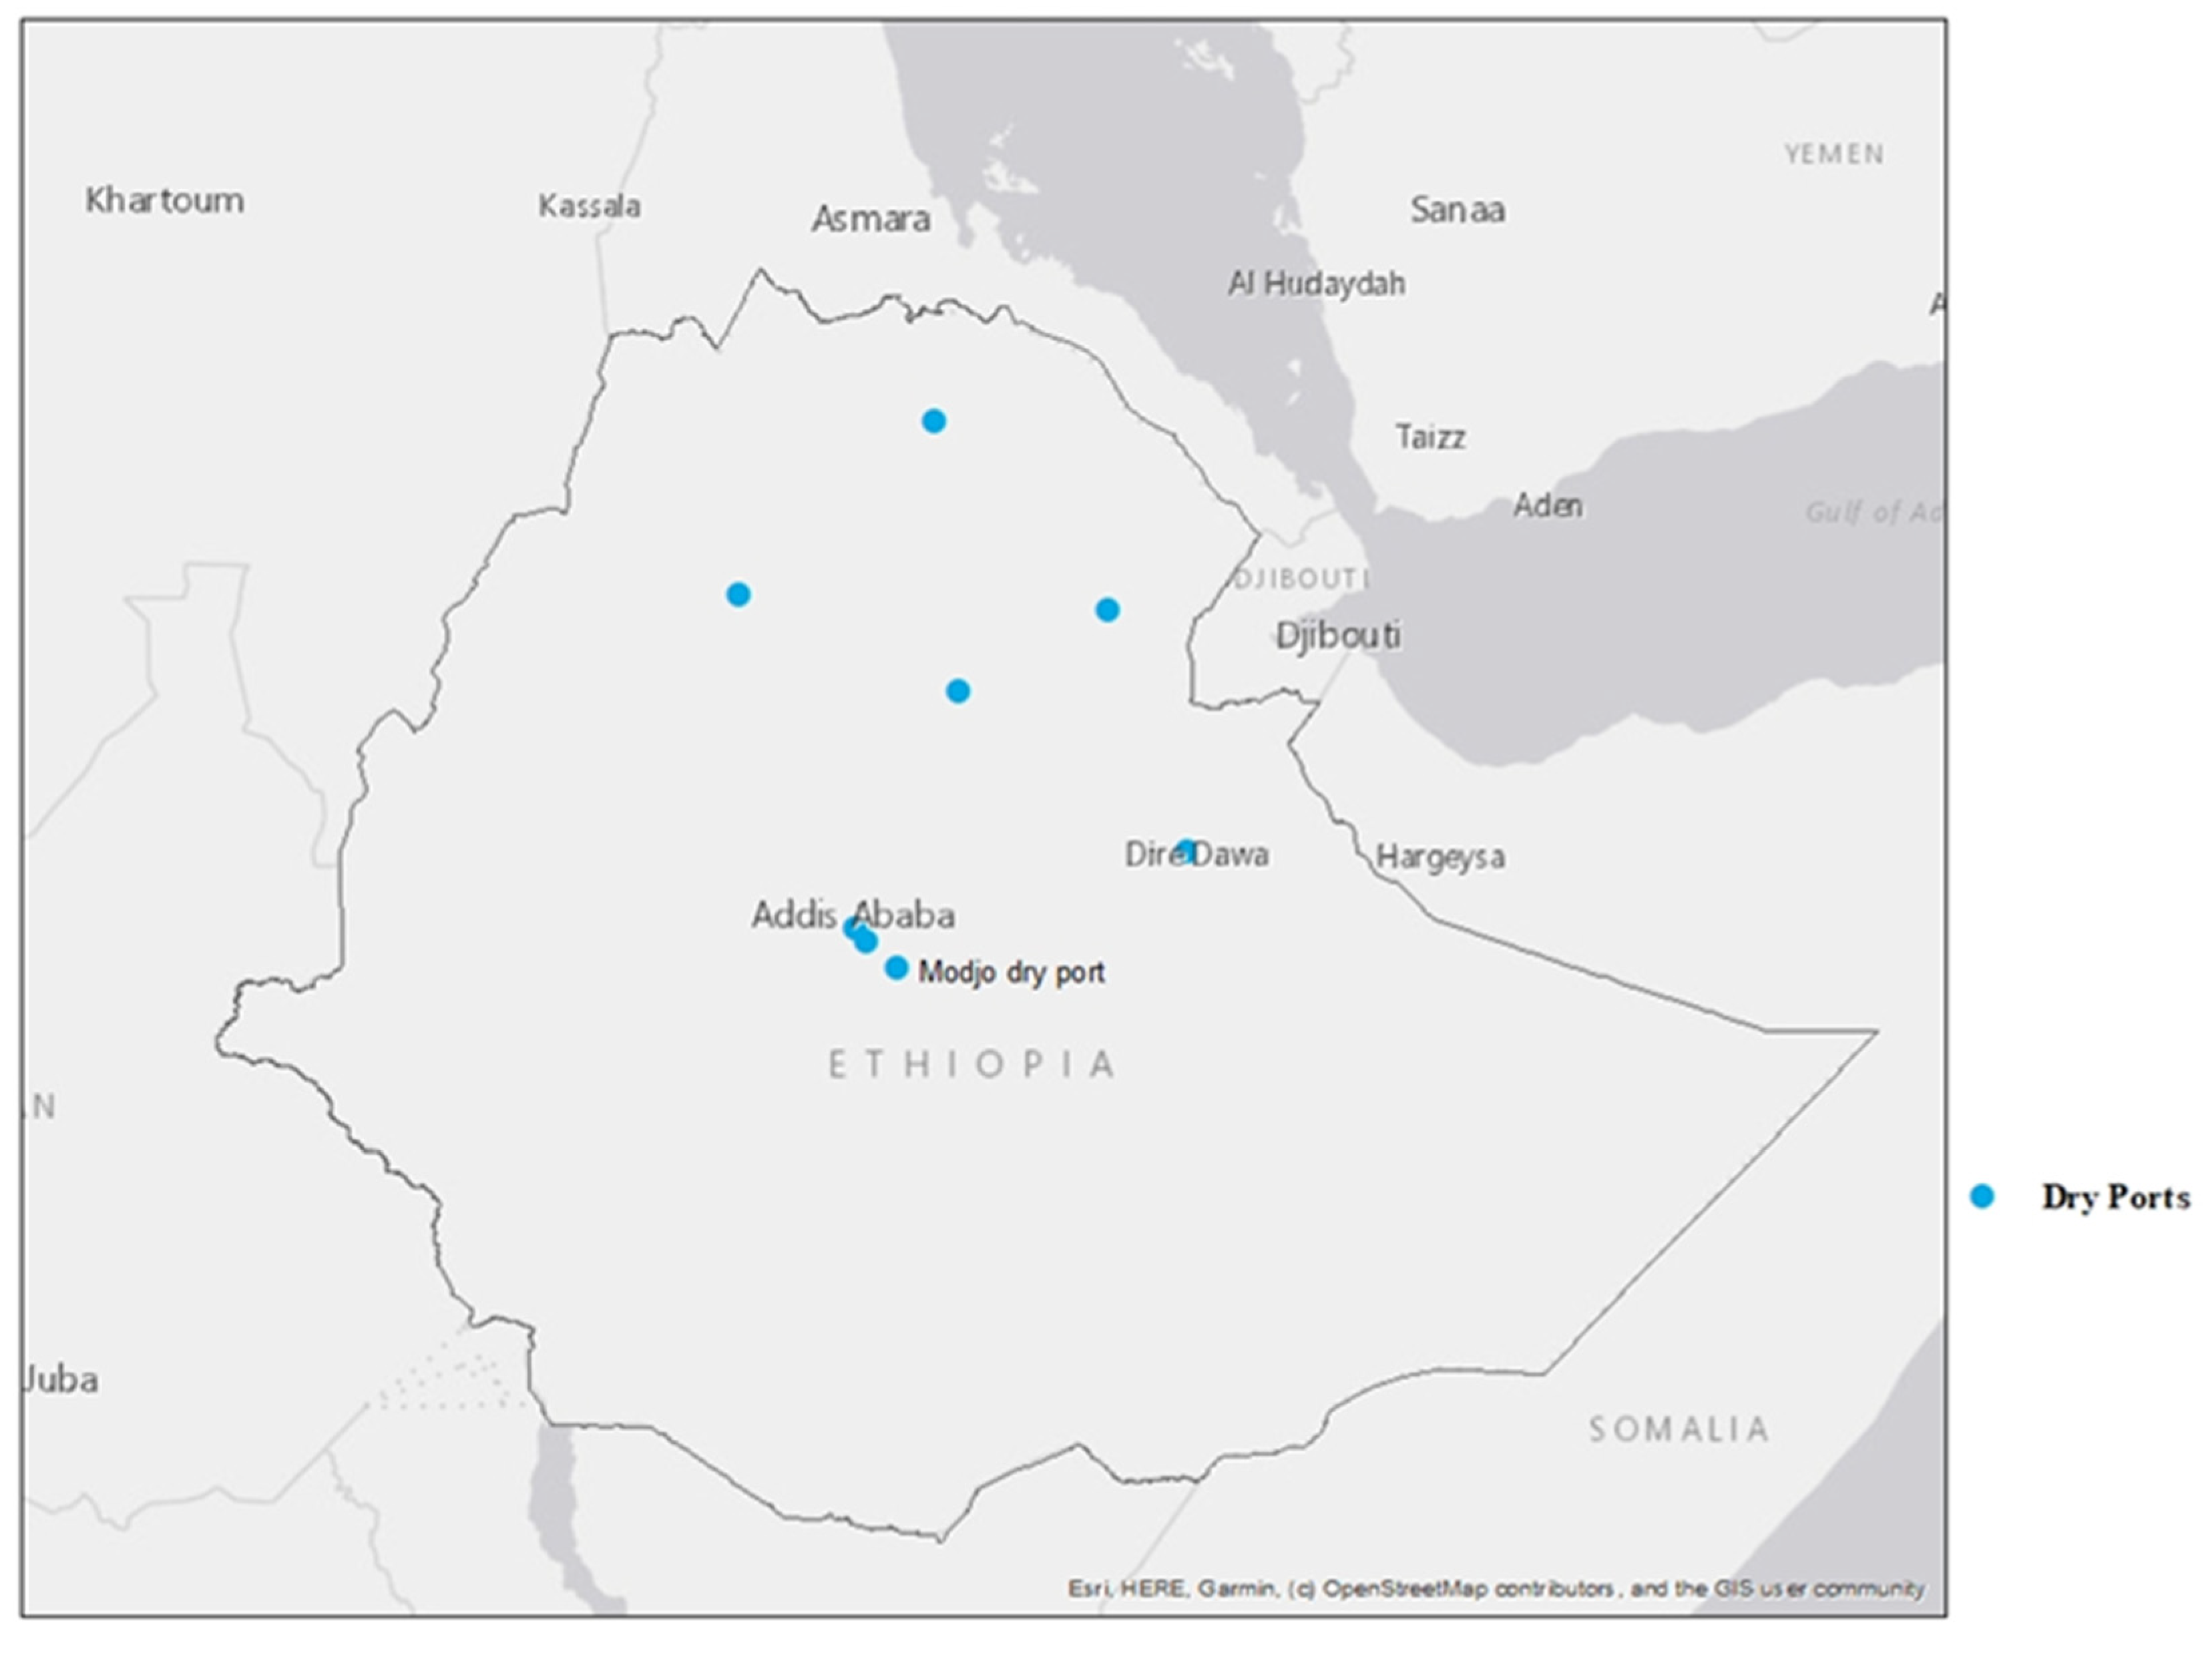
2.5. Study Area
3. Results
3.1. Preliminary Sets of Logistics Performance Indicators
3.1.1. Performance Indicators for Dry Ports
3.1.2. Performance Indicators for Transport
3.1.3. Performance Indicators for Warehouses
3.2. Assessment of Weightings for Each PI
3.2.1. Dry Port PIs
Operational Dry Port PIs
Financial Dry Port PIs
3.2.2. Transport PIs
3.2.3. Warehouse PIs
3.3. Challenges in the Import–Export Sector
4. Discussion
4.1. PIs for Low-Income Countries
4.2. Importance Level of the PIs
4.3. Challenges in the Import–Export Sector
5. Conclusions
Author Contributions
Funding
Informed Consent Statement
Data Availability Statement
Acknowledgments
Conflicts of Interest
Appendix A. The First Round Questionnaire Deployed in the Study
Appendix A.1. Introduction
Appendix A.2. General Information
- What is the name of the company?
- b.
- What is your position in the company?
- c.
- What is your education level?
- d.
- How many years of experience do you have?
Appendix A.3. Dry Port

| Performance Indicators | Not Important | Important |
|---|---|---|
| Distance from commercial areas | ||
| Transhipment time | ||
| Transhipment costs | ||
| Cut-off time | ||
| Turnaround time | ||
| Damage frequency | ||
| Loss frequency | ||
| Process utilisation rate | ||
| Environmental impacts | ||
| Throughput |
- Are there any dry port performance indicators other than the ones mentioned above?
- b.
- If your response to part a is yes, please provide the indicators in the space provided below.
- c.
- Do you perform performance evaluation in your company?
- d.
- What performance indicators do you implement in your company (can be from the list above or any different indicators?)
Appendix A.4. Transport
| Performance Indicators | Not Important | Important |
|---|---|---|
| Availability | ||
| Travel time | ||
| Travel costs | ||
| Integration with other means of transport | ||
| Frequency of accident | ||
| Security | ||
| Number of trips per month | ||
| Truck capacity |
- Are there any transport performance indicators other than the ones mentioned above?
- b.
- If your response to part a is yes, please provide the indicators in the space provided below.
- c.
- Do you perform performance evaluation in your company?
- d.
- If yes, what performance indicators do you implement in your company (can be from the list above or any different indicators?)
Appendix A.5. Warehouse
| Performance Indicators | Not Important | Important |
|---|---|---|
| Loading/unloading time | ||
| Inventory turnover rate | ||
| Damage rate | ||
| Inventory carrying costs | ||
| Order accuracy | ||
| Backorder rate | ||
| Order lead time | ||
| On-time delivery rate | ||
| Total warehouse costs | ||
| Accessibility from road | ||
| Quantity error rate | ||
| Stock accuracy | ||
| Excess inventory rate |
- Are there any warehouse performance indicators other than the ones mentioned above?
- b.
- If your response to part a is yes, please provide the indicators in the space provided below.
- c.
- Do you perform performance evaluation in your company?
- d.
- What performance indicators do you implement in your company (can be from the list above or any different indicators?)
Appendix B. The Second Round Questionnaire Deployed in the Study
Appendix B.1. Introduction
| Importance Scale | Definition of Importance Scale |
|---|---|
| 1 | Equally important preferred |
| 2 | Equally to moderately important preferred |
| 3 | Moderately important preferred |
| 4 | Moderately to strongly important preferred |
| 5 | Strongly important preferred |
| 6 | Strongly to very strongly important preferred |
| 7 | Very strongly important preferred |
| 8 | Very strongly to extremely important preferred |
| 9 | Extremely important preferred |
Appendix B.2. Respondent’s Information
- What is the name of the company?
- b.
- What is your position in the company?
- c.
- What is your education level?
- d.
- How many years of experience do you have?
- e.
- Do you own a truck? If yes, how many
- f.
- Do you own a warehouse? If yes, how many?
Appendix B.3. Performance Indicators of Dry Ports
- Operational Performance Indicators
| Factors | Turnaround Time | Port Cost | Damage Frequency | Loss Frequency | Environmental Impact |
|---|---|---|---|---|---|
| Turnaround time | |||||
| Port cost | |||||
| Damage frequency | |||||
| Loss frequency | |||||
| Environmental impact |
- 2.
- Financial Performance Indicators
| Factors | Capital Expenditure Per Tonne of Cargo | Throughput | Labour Expenditure Per Tonne of Cargo |
|---|---|---|---|
| Capital expenditure per tonne of cargo | |||
| Throughput | |||
| Labour expenditure per tonne of cargo |
- What are the main challenges you face in port operations?
- b.
- Are there any forms of digitisation or automation implemented in your company?
Appendix B.4. Performance Indicators for Transport Services
| Factors | Security | Availability | Travel Time | Truck Capacity | Travel Cost | Frequency of Accident |
|---|---|---|---|---|---|---|
| Security | ||||||
| Availability | ||||||
| Travel time | ||||||
| Truck capacity | ||||||
| Travel cost | ||||||
| Frequency of accidents |
- What are the main challenges you face in transport operations?
- b.
- Are there any forms of digitisation or automation implemented in your company?
Appendix B.5. Performance Indicators for Warehousing
| Factors | Order Lead Time | Order Accuracy | Backorder Rate | Warehouse Location | Total Warehouse Cost | Loading/Unloading Time | Damage Rate |
|---|---|---|---|---|---|---|---|
| Order lead time | |||||||
| Order accuracy | |||||||
| Backorder rate | |||||||
| Warehouse location | |||||||
| Total warehouse cost | |||||||
| Loading/unloading time | |||||||
| Damage rate |
- What are the main challenges you face in warehouse operations?
- b.
- Are there any forms of digitisation or automation implemented in your company?
References
- Frazelle, E.H. World-Class Warehousing and Material Handling; McGraw-Hill Education: New York, NY, USA, 2016. [Google Scholar]
- Heaver, T.D. Perspectives on global performance issues. In Handbook of Logistics and Supply Chain Management; Brewer, A.M., Button, K.J., Hensher, D.A., Eds.; Elsevier: Amsterdam, The Netherlands, 2001. [Google Scholar]
- Amentae, T.K.; Gebresenbet, G. Evaluation of Performances of Intermodal Import-Export Freight Transport System in Ethiopia. J. Serv. Sci. Manag. 2015, 8, 57–70. [Google Scholar] [CrossRef]
- UNCTAD. The Djibouti City—Addis Ababa Transit and Transport Corridor: Turning Diagnostics into Action. Geneva, Switzerland. 2018. Available online: https://unctad.org/webflyer/djibouti-city-addis-ababa-transit-and-transport-corridor-turning-diagnostics-action (accessed on 29 December 2021).
- UN-OHRLLS. Achieving the Sustainable Development Goals in Landlocked Developing Countries through Connectivity and Trade Facilitation. 2018. Available online: https://www.un.org/ohrlls/sites/www.un.org.ohrlls/files/achieving_the_sdgs_in_landlocked_developing_countries_through_connectivity_and_trade_facilitation_2018.pdf (accessed on 10 February 2022).
- Nguyen, L.C.; Notteboom, T. The relations between dry port characteristics and regional port-hinterland settings: Findings for a global sample of dry ports. Marit. Policy Manag. 2019, 46, 24–42. [Google Scholar] [CrossRef]
- Bontekoning, Y.M. The Importance of New-Generation Freight Terminals For Intermodal Transport. J. Adv. Transp. 2000, 34, 391–413. [Google Scholar] [CrossRef]
- Philipp, R.; Gerlitz, L.; Moldabekova, A. Small and Medium-Sized Seaports on the Digital Track: Tracing Digitalisation Across the South Baltic Region by Innovative Auditing Procedures; Lecture Notes in Networks and Systems; Springer: Cham, Switzerland, 2020; Volume 117, pp. 351–362. [Google Scholar] [CrossRef]
- Jacobsson, S.; Arnäs, P.O.; Stefansson, G. Automatic information exchange between interoperable information systems: Potential improvement of access management in a seaport terminal. Res. Transp. Bus. Manag. 2020, 35, 100429. [Google Scholar] [CrossRef]
- Moldabekova, A.; Philipp, R.; Reimers, H.-E.; Alikozhayev, B. Digital technologies for improving logistics performance of countries. Transp. Telecommun. 2021, 22, 1019. [Google Scholar] [CrossRef]
- Scholliers, J.; Permala, A.; Toivonen, S.; Salmela, H. Improving the Security of Containers in Port Related Supply Chains. Transp. Res. Procedia 2016, 14, 1374–1383. [Google Scholar] [CrossRef]
- Corriere, F.; Di Vincenzo, D.; Corriere, R. A Logistics Pattern For Fruit And Vegetable Transportation From Island Region: The Case Of Sicily. ARPN J. Eng. Appl. Sci. 2014, 9, 2279–2285. [Google Scholar]
- Golińska, P. Information management supporting multimodal transport utilization in virtual clusters. Manag. Prod. Eng. Rev. 2013, 4, 20–29. [Google Scholar] [CrossRef]
- Wang, H.; Chen, S.; Xie, Y. An RFID-based digital warehouse management system in the tobacco industry: A case study. Int. J. Prod. Res. 2010, 48, 2513–2548. [Google Scholar] [CrossRef]
- Kumar, S.; Raut, R.D.; Narwane, V.S.; Narkhede, B.E.; Muduli, K. Implementation barriers of smart technology in Indian sustainable warehouse by using a Delphi-ISM-ANP approach. Int. J. Prod. Perform. Manag. 2021, 71, 696–721. [Google Scholar] [CrossRef]
- Ojala, L.; Çelebi, D. The World Bank’s Logistics Performance Index (LPI) and Drivers of Logistics Performance; OECD: Paris, France, 2005. [Google Scholar]
- RFC Rhine-Alpine. Performance Measurement in the Intermodal Transport Chain RFC Rhine-Alpine Study; EEIG Corridor Rhine Alpine EWIV: Frankfurt, Germany, 2019; pp. 1–12. Available online: https://www.corridor-rhine-alpine.eu/downloads.html (accessed on 14 May 2021).
- Arvis, J.-F.; Ojala, L.; Wiederer, C.; Shepherd, B.; Raj, A.; Dairabayeva, K.; Kiiski, T. Connecting to Compete 2018: Trade Logistics in the Global Economy: The Logistics Performance Index and Its Indicators; World Bank: Washington, DC, USA, 2018. [Google Scholar]
- Bolat, P.; Kayisoglu, G.; Gunes, E.; Kızılay, F.E.; Ozsogut, S. Weighting Key Factors for Port Congestion by AHP Method. J. ETA Marit. Sci. 2020, 8, 252–273. [Google Scholar] [CrossRef]
- Chiu, R.-H.; Lin, L.-H.; Ting, S.-C. Evaluation of Green Port Factors and Performance: A Fuzzy AHP Analysis. Math. Probl. Eng. 2014, 2014, 802976. [Google Scholar] [CrossRef]
- Hanaoka, S.; Kunadhamraks, P. Multiple criteria and fuzzy based evaluation of logistics performance for intermodal transportation. J. Adv. Transp. 2009, 43, 123–153. [Google Scholar] [CrossRef]
- Lam, H.Y.; Choy, K.L.; Ho, G.T.S.; Cheng, S.W.Y.; Lee, C.K.M. A knowledge-based logistics operations planning system for mitigating risk in warehouse order fulfillment. Int. J. Prod. Econ. 2015, 170, 763–779. [Google Scholar] [CrossRef]
- Srisawat, P.; Kronprasert, N.; Arunotayanun, K. Development of Decision Support System for Evaluating Spatial Efficiency of Regional Transport Logistics. Transp. Res. Procedia 2017, 25, 4832–4851. [Google Scholar] [CrossRef]
- Reda, A.; Noble, B. Tackling vehicular fraud in Ethiopia: From technology to business. In Proceedings of the 2nd ACM Symposium on Computing for Development 2012, Atlanta, GA, USA, 11–12 March 2012. [Google Scholar] [CrossRef]
- Debela, F.M. Logistics Practices in Ethiopia; Swedish University of Agricultural Sciences: Uppsala, Sweden, 2013; ISSN 1654-9392. [Google Scholar]
- Georgise, F.B.; Heramo, A.H.; Bekele, H. Improving automotive service through e-logistics: A case of Moenco Hawassa, Ethiopia. Int. J. Econ. Manag. Syst. 2020, 5, 21–40. Available online: https://www.iaras.org/iaras/home/caijems/improving-automotive-service-through-e-logistics-a-case-of-moenco-hawassa-ethiopia (accessed on 11 February 2022).
- Nitsche, B. Embracing the Potentials of Intermodal Transport in Ethiopia: Strategies to Facilitate Export-Led Growth. Sustainability 2021, 13, 2208. [Google Scholar] [CrossRef]
- Gebrewahid, G.G.; Wald, A. Export Barriers and Competitiveness of Developing Economies: The Case of the Ethiopian Leather Footwear Industry. J. Afr. Bus. 2017, 18, 396–416. [Google Scholar] [CrossRef]
- Gogas, M.; Adamos, G.; Nathanail, E. Assessing the performance of intermodal city logistics terminals in Thessaloniki. Transp. Res. Procedia 2017, 24, 17–24. [Google Scholar] [CrossRef]
- Rezaei, J.; van Roekel, W.S.; Tavasszy, L. Measuring the relative importance of the logistics performance index indicators using Best Worst Method. Transp. Policy 2018, 68, 158–169. [Google Scholar] [CrossRef]
- Ministry of Transport. Federal Democratic Republic of Ethiopia National Logistics Strategy (2018–2028); Ministry of Transport: Addis Ababa, Ethiopia, 2019. [Google Scholar]
- Maxwell, J.A. Designing a Qualitative Study. In The SAGE Handbook of Applied Social Research Methods; Bickman, L., Rog, D.J., Eds.; SAGE Publications, Inc.: New York, NY, USA.
- Sambasivan, M.; Fei, N.Y. Evaluation of critical success factors of implementation of ISO 14001 using analytic hierarchy process (AHP): A case study from Malaysia. J. Clean. Prod. 2008, 16, 1424–1433. [Google Scholar] [CrossRef]
- Saaty, T. How to make a decision: The Analytic Hierarchy Process. Eur. J. Oper. Res. 2009, 48, 9–26. [Google Scholar] [CrossRef]
- Jamshidi, A.; Jamshidi, F.; Ait-Kadi, D.; Ramudhin, A. A review of priority criteria and decision-making methods applied in selection of sustainable city logistics initiatives and collaboration partners. Int. J. Prod. Res. 2019, 57, 5175–5193. [Google Scholar] [CrossRef]
- Brunelli, M. Introduction to the Analytic Hierarchy Process; Springer: Berlin/Heidelberg, Germany, 2015. [Google Scholar]
- Chang, P.-Y.; Lin, H.-Y. Manufacturing plant location selection in logistics network using Analytic Hierarchy Process. J. Ind. Eng. Manag. 2015, 8, 1547–1575. [Google Scholar] [CrossRef]
- Ishizaka, A.; Labib, A. Analytic Hierarchy Process and Expert Choice: Benefits and limitations. OR Insight 2009, 22, 201–220. [Google Scholar] [CrossRef]
- Rezaei, J. Best-worst multi-criteria decision-making method. Omega 2015, 53, 49–57. [Google Scholar] [CrossRef]
- Kraujalienė, L. Comparative analysis of multicriteria decision-making methods evaluating the efficiency of technology transfer. Bus. Manag. Educ. 2019, 17, 72–93. [Google Scholar] [CrossRef]
- Si, S.-L.; You, X.-Y.; Liu, H.-C.; Zhang, P. DEMATEL Technique: A Systematic Review of the State-of-the-Art Literature on Methodologies and Applications. Math. Probl. Eng. 2018, 2018, 3696457. [Google Scholar] [CrossRef]
- Kayikci, Y. A conceptual model for intermodal freight logistics centre location decisions. Procedia Soc. Behav. Sci. 2010, 2, 6297–6311. [Google Scholar] [CrossRef]
- Tadesse, M.D.; Gebresenbet, G.; Tavasszy, L.; Ljungberg, D. Assessment of Digitalized Logistics for Implementation in Low-Income Countries. Future Transp. 2021, 1, 227–247. [Google Scholar] [CrossRef]
- Bekele, R. Determinants of throughput performance of Modjo dry port, Ethiopia. J. Bus. Adm. Stud. 2019, 11, 1–35. [Google Scholar]
- ESLSE. Dry Ports of ESLSE. 2021. Available online: https://www.eslse.et/dryport.html (accessed on 3 February 2022).
- Çelebi, D. The role of logistics performance in promoting trade. Marit. Econ. Logist. 2019, 21, 307–323. [Google Scholar] [CrossRef]
- Gunasekaran, A.; Patel, C.; Tirtiroglu, E. Performance measures and metrics in a supply chain environment. Int. J. Oper. Prod. Manag. 2001, 21, 71–87. [Google Scholar] [CrossRef]
- Jin, M.; Wang, H. System Performance Measures for Intermodal Transportation with a Case Study and Industrial Application; National Center for Intermodal Transportation: Denver, CO, USA, 2004. [Google Scholar]
- Kabak, Ö.; Ülengin, F.; Önsel Ekici, Ş. Connecting logistics performance to export: A scenario-based approach. Res. Transp. Econ. 2018, 70, 69–82. [Google Scholar] [CrossRef]
- Liebetruth, T. Sustainability in Performance Measurement and Management Systems for Supply Chains. Procedia Eng. 2017, 192, 539–544. [Google Scholar] [CrossRef]
- Lin, C.-Y. Supply chain performance and the adoption of new logistics technologies for logistics service providers in Taiwan. J. Stat. Manag. Syst. 2007, 10, 519–543. [Google Scholar] [CrossRef]
- Rashidi, K.; Cullinane, K. Evaluating the sustainability of national logistics performance using Data Envelopment Analysis. Transp. Policy 2019, 74, 35–46. [Google Scholar] [CrossRef]
- Özceylan, E.; Çetinkaya, C.; Erbaş, M.; Kabak, M. Logistic performance evaluation of provinces in Turkey: A GIS-based multi-criteria decision analysis. Transp. Res. Part A Policy Pract. 2016, 94, 323–337. [Google Scholar] [CrossRef]
- Ha, M.H.; Yang, Z.; Notteboom, T.; Ng, A.K.Y.; Heo, M.W. Revisiting port performance measurement: A hybrid multi-stakeholder framework for the modelling of port performance indicators. Transp. Res. Part E Logist. Transp. Rev. 2017, 103, 1–16. [Google Scholar] [CrossRef]
- Martin, E.; Dombriz, M.A.; Soley, G. Study of the State of the Art and Description of KPI and KRI of Terminals, Hinterland Mobility and Rail Network. 2017. Available online: https://vdocument.in/reader/full/d31-state-of-the-art-and-description-of-kpis-d31-study-of-the-state-of-the (accessed on 27 February 2022).
- Carboni, A.; Deflorio, F. Performance indicators and automatic identification systems in inland freight terminals for intermodal transport. IET Intell. Transp. Syst. 2018, 12, 309–318. [Google Scholar] [CrossRef]
- UNCTAD. Port Performance Indicators, 76th ed.; United Nations: New York, NY, USA, 1976. [Google Scholar]
- De Langen, P.W.; Sharypova, K. Intermodal connectivity as a port performance indicator. Res. Transp. Bus. Manag. 2013, 8, 97–102. [Google Scholar] [CrossRef]
- Cezar-Gabriel, C. Performance assessment in operating dry ports. Ann. Fac. Econ. 2010, 1, 934–938. [Google Scholar]
- Nathnail, E.; Gogas, M.; Adamos, G. Urban Freight Terminals: A Sustainability Cross-case Analysis. Transp. Res. Procedia 2016, 16, 394–402. [Google Scholar] [CrossRef]
- Onwuegbuchunam, D. Assessing Port Governance, Devolution and Terminal Performance in Nigeria. Logistics 2018, 2, 6. [Google Scholar] [CrossRef]
- Lai, K.-H.; Ngai, E.W.T.; Cheng, T.C.E. Measures for evaluating supply chain performance in transport logistics. Transp. Res. Part E Logist. Transp. Rev. 2002, 38, 439–456. [Google Scholar] [CrossRef]
- Stoilova, S.; Munier, N.; Kendra, M.; Skrúcaný, T. Multi-Criteria Evaluation of Railway Network Performance in Countries of the TEN-T Orient–East Med Corridor. Sustainability 2020, 12, 1482. [Google Scholar] [CrossRef]
- Šakalys, R.; Sivilevičius, H.; Miliauskaitė, L.; Šakaly, A. Investigation and evaluation of main indicators impacting synchromodality using ARTIW and AHP methods. Transport 2019, 34, 300–311. [Google Scholar] [CrossRef]
- Easley, R.; Katsikides, N.; Kucharek, K.; Shamo, D.; Tiedeman, J. Freight Performance Measure Primer; Federal Highway Administration: New York, NY, USA, 2017. [Google Scholar]
- Varma, A. Measurement Sources for Freight Performance Measures and Indicators. 2008. Available online: http://www.lrrb.org/PDF/200812.pdf (accessed on 28 February 2022).
- Hagler Bailly Services. Measuring Improvements in the Movement of Highway and Intermodal Freight—FHWA Freight Management and Operations. Available online: https://ops.fhwa.dot.gov/freight/freight_analysis/measure_rpt.htm#travel_time (accessed on 5 May 2021).
- Domingues, M.L.; Reis, V.; Macário, R. A comprehensive framework for measuring performance in a third-party logistics provider. Transp. Res. Procedia 2015, 10, 662–672. [Google Scholar] [CrossRef]
- Stein, N.; Blair, A.; Weisbrod, G. Freight Performance Measures: Measuring Freight Accessibility. 2018. Available online: https://www.researchgate.net/publication/336615388_Freight_Performance_Measures_Measuring_Freight_Accessibility (accessed on 28 February 2022).
- Khan, S.A.R.; Yu, Z. The Impact of Terrorism on Economics and Logistics Performance: An Empirical Study from the Perspective of Saarc Member States. Rom. J. Econ. Forecast. 2020, 23, 99–117. [Google Scholar]
- Oye, A.; Aderinlewo, O.; Croope, S. Urban transport safety assessment in akure based on corresponding performance indicators. Open Eng. 2013, 3, 113–120. [Google Scholar] [CrossRef]
- Chen, P.-S.; Huang, C.-Y.; Yu, C.-C.; Hung, C.-C. The examination of key performance indicators of warehouse operation systems based on detailed case studies. J. Inf. Optim. Sci. 2017, 38, 367–389. [Google Scholar] [CrossRef]
- Karim, N.H.; Abdul Rahman, N.S.F.; Md Hanafiah, R.; Abdul Hamid, S.; Ismail, A.; Abd Kader, A.S.; Muda, M.S. Revising the warehouse productivity measurement indicators: Ratio-based benchmark. Marit. Bus. Rev. 2021, 6, 49–71. [Google Scholar] [CrossRef]
- Kusrini, E.; Novendri, F.; Helia, V.N. Determining key performance indicators for warehouse performance measurement—A case study in construction materials warehouse. MATEC Web Conf. 2018, 154, 01058. [Google Scholar] [CrossRef]
- Salhieh, L.; Alswaer, W. A proposed maturity model to improve warehouse performance. Int. J. Product. Perform. Manag. 2021. ahead-of-print. [Google Scholar] [CrossRef]
- Torabizadeh, M.; Yusof, N.M.; Ma’Aram, A.; Shaharoun, A.M. Identifying sustainable warehouse management system indicators and proposing new weighting method. J. Clean. Prod. 2020, 248, 119190. [Google Scholar] [CrossRef]
- De Marco, A.; Ruffa, S.; Mangano, G. Strategic factors affecting warehouse maintenance costs. J. Facil. Manag. 2010, 8, 104–113. [Google Scholar] [CrossRef]
- Vrat, P. Storage and Warehousing. In Materials Management: An Integrated Systems Approach; Texts in Business and Economics; Springer: Berlin/Heidelberg, Germany, 2014. [Google Scholar]
- Abdul Rahman, N.S.F.; Karim, N.H.; Md Hanafiah, R.; Abdul Hamid, S.; Mohammed, A. Decision analysis of warehouse productivity performance indicators to enhance logistics operational efficiency. Int. J. Prod. Perform. Manag. 2021. ahead-of-print. [Google Scholar] [CrossRef]
- Ribino, P.; Cossentino, M.; Lodato, C.; Lopes, S. Agent-based simulation study for improving logistic warehouse performance. J. Simul. 2018, 12, 23–41. [Google Scholar] [CrossRef]
- Spisak, C.; Morgan, L.; Eichler, R.; Rosen, J.; Serumaga, B.; Wang, A. Results-Based Financing in Mozambique’s Central Medical Store: A Review After 1 Year. Glob. Health Sci. Pract. 2016, 4, 165–177. [Google Scholar] [CrossRef]
- Arvis, J.-F.; Raballand, G.; Marteau, J.-F. The Cost of Being Landlocked: Logistics Costs and Supply Chain Reliability; World Bank: Washington, DC, USA, 2010; Available online: https://openknowledge.worldbank.org/handle/10986/2489 (accessed on 20 January 2022).
- FDRE. Updated Nationally Determined Contribution. Environment, Forest, and Climate Change Commission of the Federal Democratic Republic of Ethiopia: Ethiopia. 2021. Available online: https://unfccc.int/sites/default/files/NDC/2022-06/Ethiopia%27s%20updated%20NDC%20JULY%202021%20Submission_.pdf: (accessed on 15 February 2022).
- Nath, P.K.; Behera, B. A critical review of impact of and adaptation to climate change in developed and developing economies. Environ. Dev. Sustain. 2011, 13, 141–162. [Google Scholar] [CrossRef]
- Ansah, R.K.; Obiri-Yeboah, K.; Akipelu, G. Improving the freight transport of a developing economy: A case of Boankra inland port. J. Shipp. Trade 2020, 5, 10. [Google Scholar] [CrossRef]
- Ngugi, E.N.; Kimutai, G.; Kibet, Y. Effects of inventory management systems on performance of manufacturing companies in Eldoret town, Kenya. J. Bus. Change Manag. 2019, 6, 1431–1445. [Google Scholar]
- UNECE. Recommendation and Guidelines on Establishing a Single Window to Enhance the Effiient Exchange of Information between Trade and Government: Recommendation No. 33; United Nations: New York, NY, USA; Geneva, Switzerland, 2005. [Google Scholar]
- FDRE. Digital Ethiopia 2025: A Digital Strategy for Ethiopia Inclusive Prosperity. 2020. Available online: https://www.pmo.gov.et/media/other/b2329861-f9d7-4c4b-9f05-d5bc2c8b33b6.pdf (accessed on 26 November 2021).
- Kine, H.Z.; Gebresenbet, G.; Tavasszy, L.; Ljungberg, D. Digitalization and Automation in Intermodal Freight Transport and Their Potential Application for Low-Income Countries. Future Transp. 2022, 2, 41–54. [Google Scholar] [CrossRef]
- Behrends, V.; Haunschild, M.; Galonske, N. Smart Telematics Enabling Efficient Rail Transport—Development of the ViWaS Research and Development Project. Transp. Res. Procedia 2016, 14, 4430–4439. [Google Scholar] [CrossRef][Green Version]


| Customers | Number of Respondents | Service Providers | Number of Respondents |
|---|---|---|---|
| Importers/exporters | 35 | Ethiopian shipping and logistics service enterprise (ESLSE) | 6 |
| Freight forwarders | 18 | Ethiopian Maritime Authority (EMA) | 2 |
| Ministry of Transportation (MoT) | 1 |
| MCDM Method | Strengths | Limitations |
|---|---|---|
| AHP | Ability to evaluate both qualitative and quantitative data [38] | Pairwise comparisons increase as the number of variables increase [39] Issues with inconsistency [40] |
| TOPSIS | Does not require pairwise comparisons [40] No issues with inconsistency [40] | Needs to be combined with other methods to have quantitative results in qualitative problems [41] |
| BWM | Lesser pairwise comparisons [39] Weights are always consistent [39] | Complex calculation process |
| DEMATEL | Can weight dependent alternatives [42] Understands cause and effect relationship [42] | Individual weightings of experts are not used to obtain the final weighting for an alternative [42] |
| Author | Contributions |
|---|---|
| Çelebi [46] | Studied the impact logistics performance has on promoting international trade by comparing countries by their income levels. The authors found that countries from all income groups should collaborate to improve their logistics performance. |
| Gunasekaran et al. [47] | Developed a framework to measure supply chain performance at strategic, tactical and operational levels. The supply chain performance framework developed by the authors enables the identification of areas in the supply chain that require improvement. |
| Jin and Wang [48] | Categorised the performance measurement levels in logistics as infrastructure, operational and user-level performance measures. |
| Kabak et al. [49] | Developed a new approach for investigating the relationship between logistics performance and export. The authors found a direct relationship between logistics performance and export level. Their findings indicate that countries should improve their logistics performance to improve their export levels. |
| Liebetruth [50] | Studied the various approaches for measuring logistics performance. The authors then studied the possibility for integrating sustainability aspects for measuring the performance of supply chains. |
| Lin [51] | Studied the factors affecting the adoption of new technologies in Taiwan to improve logistics performance. Their findings indicate that adopting new technologies improves the performance of supply chains. |
| Rashidi and Cullinane [52] | Used a new approach known as sustainable operational logistics performance to measure the logistics performance of selected countries. The authors compared the logistics rankings with the World Bank’s LPI. The approach used by the authors can be used with the World Bank’s LPI to identify inefficiencies in logistics performance. |
| Özceylan et al. [53] | Measured the logistics performance of provinces in Turkey using geographic and economic indicators. The authors then developed a logistics performance map of countries. The findings of the authors facilitate making logistics decisions based on a Geographic Information System (GIS). |
| Dimension | PI | Source |
|---|---|---|
| Global PIs for dry ports | ||
| Financial | Throughput | [54,55,57,58] |
| Equipment costs | [55] | |
| Profitability | [55] | |
| Turnover revenues/expenditures | [55,57] | |
| Labour costs | [55] | |
| Maintenance costs | [55] | |
| Efficiency | Storage area utilisation | [55,59] |
| Equipment productivity and utilisation | [26,54,55,56,60] | |
| Labour productivity and utilisation | [26,54,55,60] | |
| Time | Turnaround time | [54] |
| Cut-off time 1 | [56] | |
| Entrance waiting time | [56] | |
| Exit waiting time | [56] | |
| Average waiting time under crane | [54] | |
| Document exchange time | [56] | |
| Service quality | Handling costs | [26,54,56,60] |
| Loss frequency | [26,56,60] | |
| Damage frequency | [26,56,60] | |
| Supply chain visibility | [26,56,60] | |
| Information availability | [26,56,60] | |
| Environmental | Carbon footprint | [54,56] |
| Water consumption | [54] | |
| Energy consumption | [54,56] | |
| Noise emission | [56] | |
| Multi-modality aspects | Multimodality rate 2 | [26,58,60] |
| Expandability | [26,58,60] | |
| Distance from city centre, commercial areas and industrial zones | [26,58,60] | |
| Intermodal connectivity | [26,58,60] | |
| Dry port PIs in low-income countries | ||
| Financial | Throughput | [61] |
| Efficiency | Distribution of plants and equipment 3 | [61] |
| Average number of vessels | ||
| Capacity utilisation | ||
| Time | Turnaround time | [61] |
| Berth occupancy | ||
| Dimensions | PIs | Sources |
|---|---|---|
| Global PIs for transport | ||
| Service quality | Travel time (dwell time, processing time, transit time) | [65,66] |
| Travel time reliability | [65] | |
| Delay/out-of-date deliveries | [66,67,68] | |
| Safety | [65,66] | |
| Vehicle operating costs | [65] | |
| Accessibility | [65,66,68,69] | |
| Truck capacity | [65,66,68,69] | |
| Loss and damage frequency | [66,67,68] | |
| Accident | [66,68] | |
| Financial | Transport costs | [66] |
| Distance travelled per day | [66] | |
| Turnover per km | [66] | |
| Delivery frequency | [66] | |
| Profit per delivery | [66] | |
| Vehicle loading capacity utilised per journey/vehicle | [66] | |
| Infrastructure condition | [65] | |
| Environmental | Congestion | [65] |
| CO2 emissions | [65] | |
| Transport PIs in low income countries | ||
| Safety | [70] | |
| Infrastructure | [70,71] | |
| Vehicle condition | [71] | |
| Dimension | PI | Source |
|---|---|---|
| Global PIs for warehousing | ||
| Time | Timely shipping | [72,75] |
| Lead time | [1,47] | |
| Loading/unloading time | [73,75,76] | |
| Warehouse location | [1,77] | |
| Quality | Order accuracy | [72,75,76] |
| Damage rate | [72,75,78] | |
| Delivery accuracy | [72] | |
| Financial | Operational costs | [72,76] |
| Storage space costs | [1] | |
| Shipping costs | [1] | |
| Labour costs | [1] | |
| Material handling equipment costs | [1,78] | |
| Productivity | Inventory turnover | [73,79] |
| Storage space utilisation | [72,73,78,79] | |
| Backorder rate | [75] | |
| Labour productivity | [73,79] | |
| Throughput | [73,76,79,80] | |
| Warehouse PIs in low-income countries | ||
| Order lead time | [81] | |
| Inventory turnover ratio | [81] | |
| Dry Port PIs | Transport PIs | Warehouse PIs |
|---|---|---|
|
Distance from commercial areas Transhipment time Transhipment costs Cut-off time Turnaround time Damage frequency Loss frequency Process utilisation rate Environmental impacts Throughput | Availability Travel time Travel costs Integration with other means of transport Frequency of accident Security Number of trips per month Truck capacity | Loading/unloading time Inventory turnover rate Damage rate Inventory carrying costs Order accuracy Backorder rate Order lead time On-time delivery rate Total warehouse costs Accessibility from road Quantity error rate Stock accuracy Excess inventory rate |
| Activity | Main Challenges |
|---|---|
| Dry port | Inadequate technology implementation, long waiting times, lack of skilled staff, unfair/inconsistent tax, misplaced containers, corruption, high port fees, bureaucracy |
| Transport | Aged trucks, low truck availability, poor security, poor road infrastructure, lack of standardised tariffs, poor driver behaviour |
| Warehouse management | Inadequate technology implementation, lack of skilled staff, high rental costs, warehouse location, poor storage conditions |
Publisher’s Note: MDPI stays neutral with regard to jurisdictional claims in published maps and institutional affiliations. |
© 2022 by the authors. Licensee MDPI, Basel, Switzerland. This article is an open access article distributed under the terms and conditions of the Creative Commons Attribution (CC BY) license (https://creativecommons.org/licenses/by/4.0/).
Share and Cite
Tadesse, M.D.; Kine, H.Z.; Gebresenbet, G.; Tavasszy, L.; Ljungberg, D. Key Logistics Performance Indicators in Low-Income Countries: The Case of the Import–Export Chain in Ethiopia. Sustainability 2022, 14, 12204. https://doi.org/10.3390/su141912204
Tadesse MD, Kine HZ, Gebresenbet G, Tavasszy L, Ljungberg D. Key Logistics Performance Indicators in Low-Income Countries: The Case of the Import–Export Chain in Ethiopia. Sustainability. 2022; 14(19):12204. https://doi.org/10.3390/su141912204
Chicago/Turabian StyleTadesse, Mahlet Demere, Helen Zewdie Kine, Girma Gebresenbet, Lóránt Tavasszy, and David Ljungberg. 2022. "Key Logistics Performance Indicators in Low-Income Countries: The Case of the Import–Export Chain in Ethiopia" Sustainability 14, no. 19: 12204. https://doi.org/10.3390/su141912204
APA StyleTadesse, M. D., Kine, H. Z., Gebresenbet, G., Tavasszy, L., & Ljungberg, D. (2022). Key Logistics Performance Indicators in Low-Income Countries: The Case of the Import–Export Chain in Ethiopia. Sustainability, 14(19), 12204. https://doi.org/10.3390/su141912204