
Passive Environmental Control at Neighborhood and Block Scales for Conservation of Historic Settlements: The Case Study of Huatzai Village in Wang-An, Taiwan


Abstract
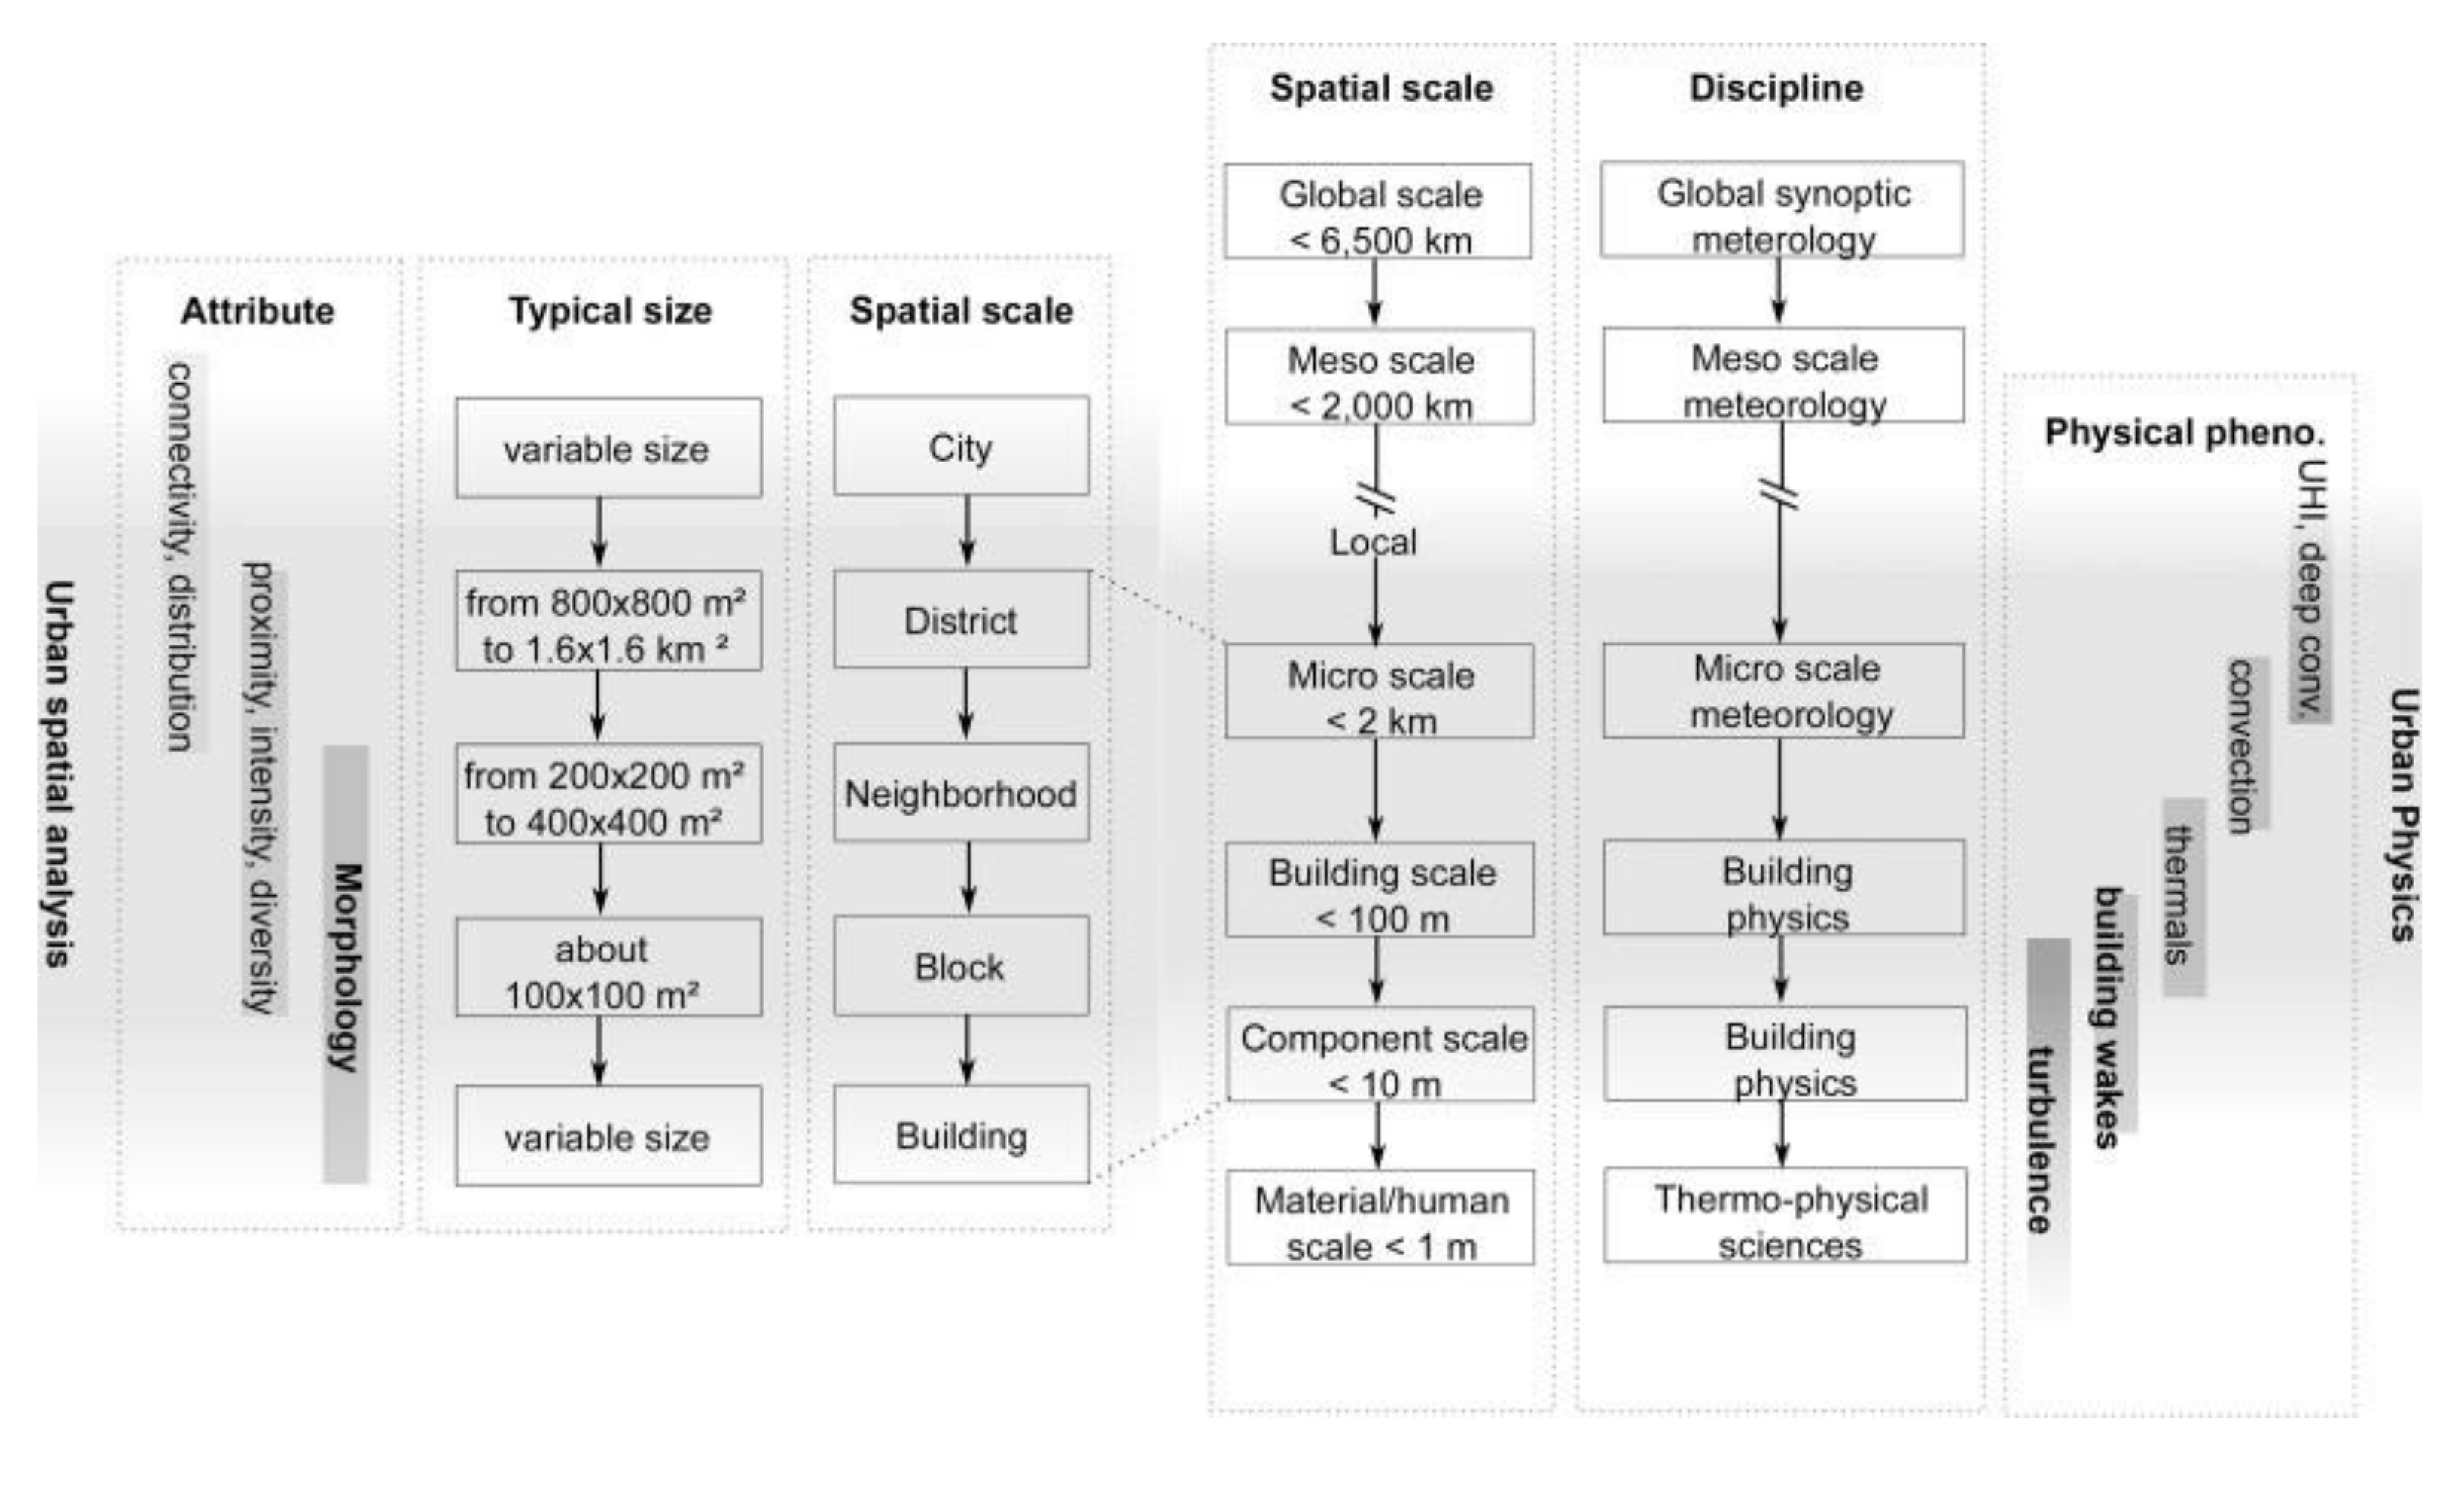
:1. Introduction
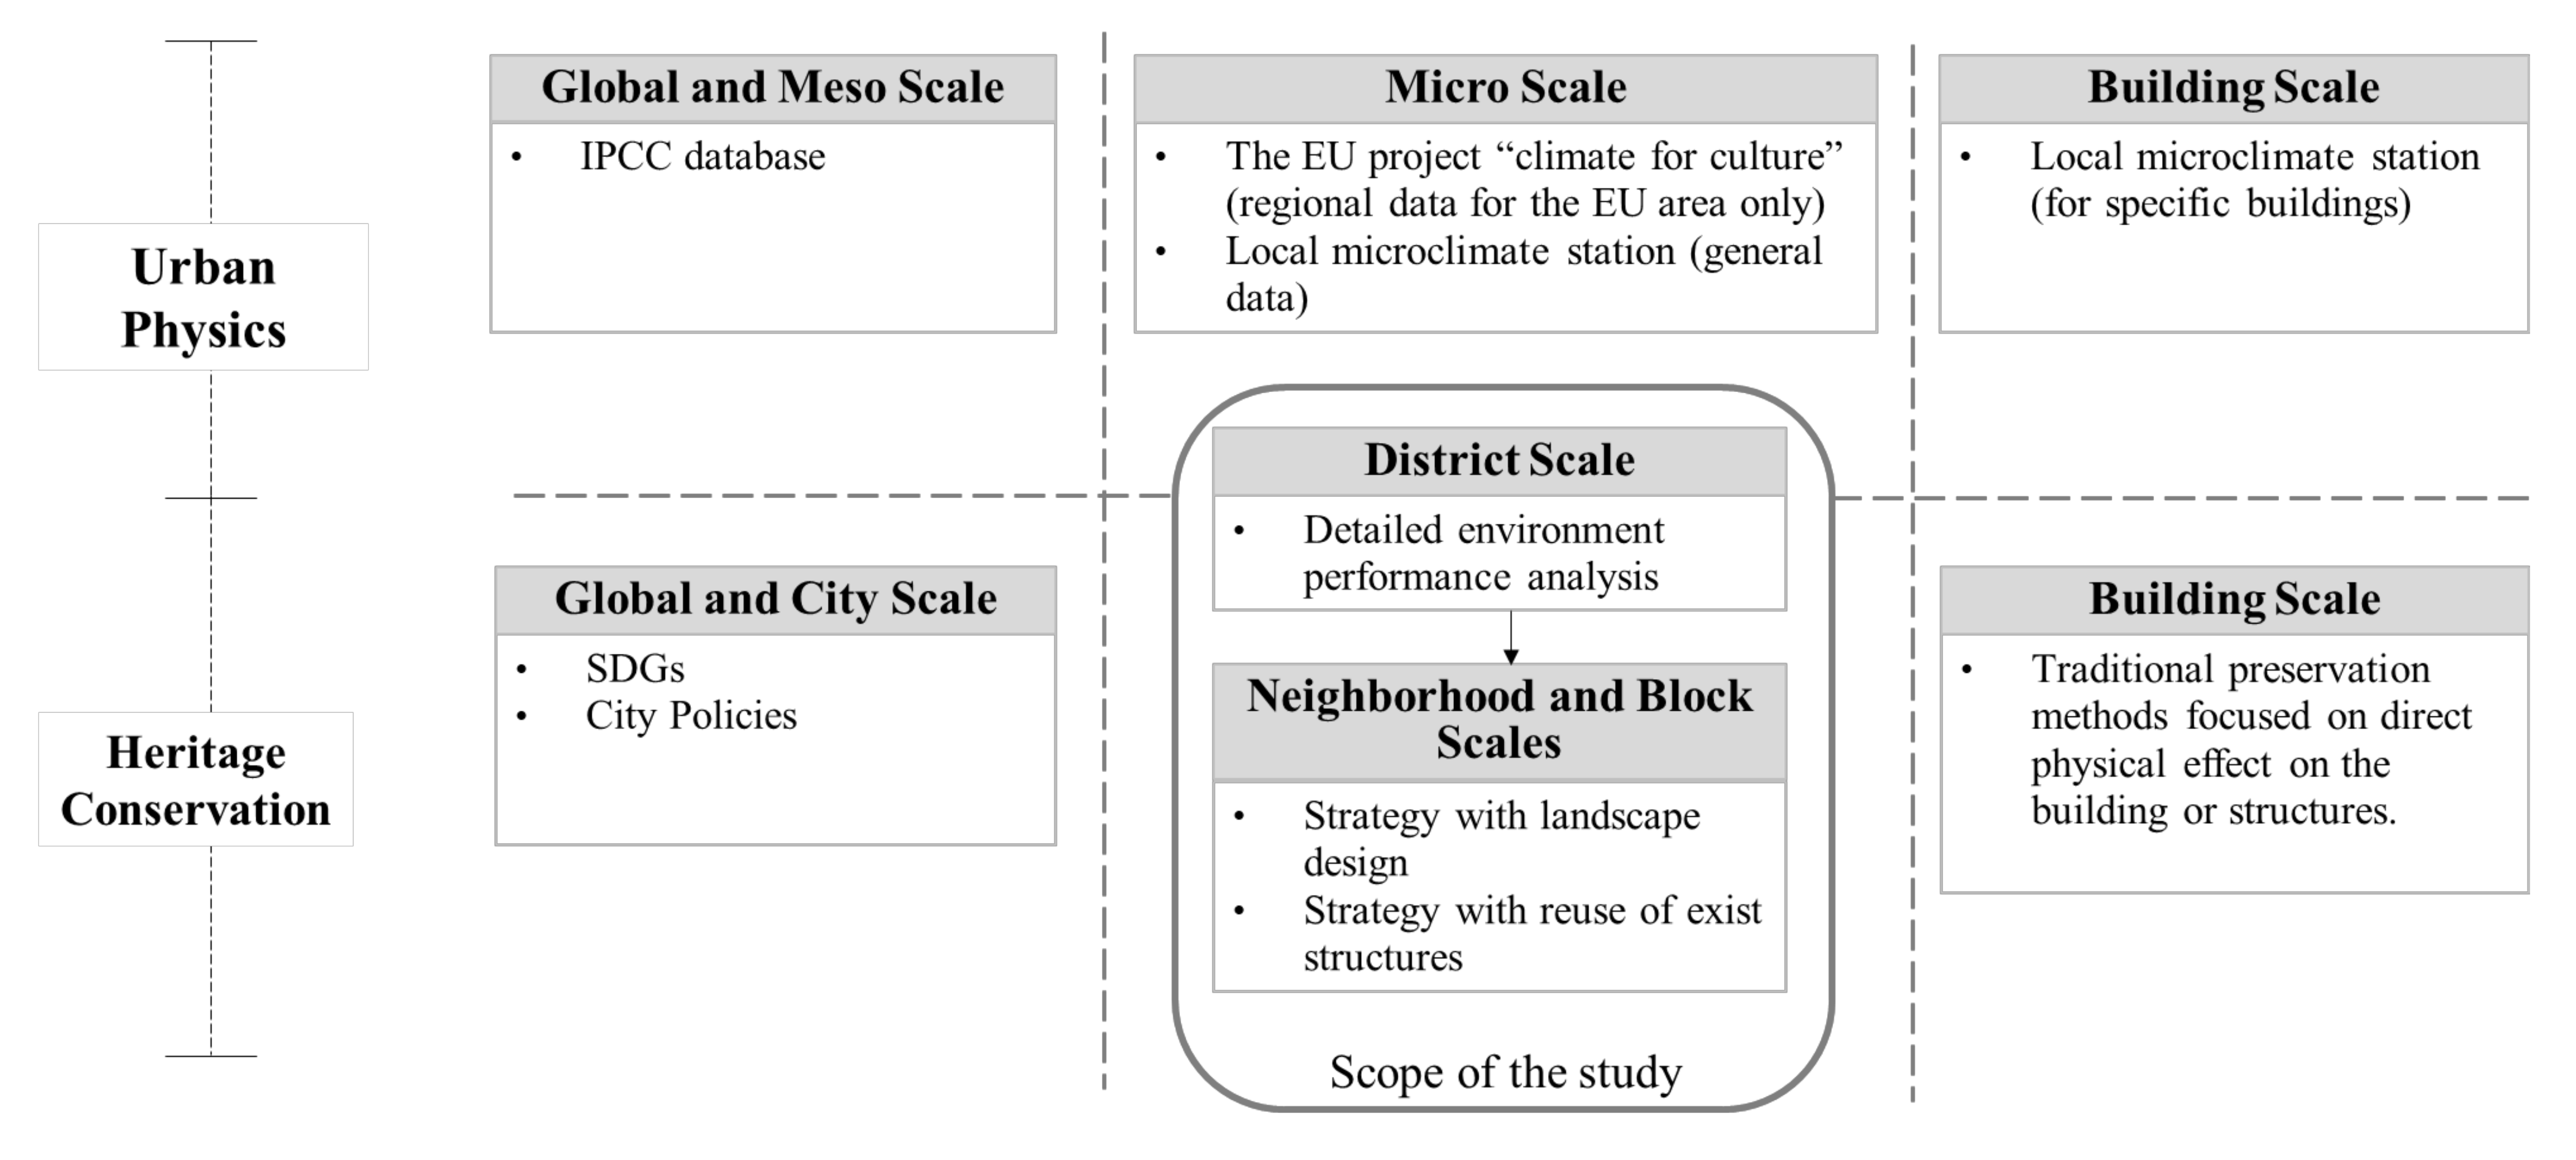
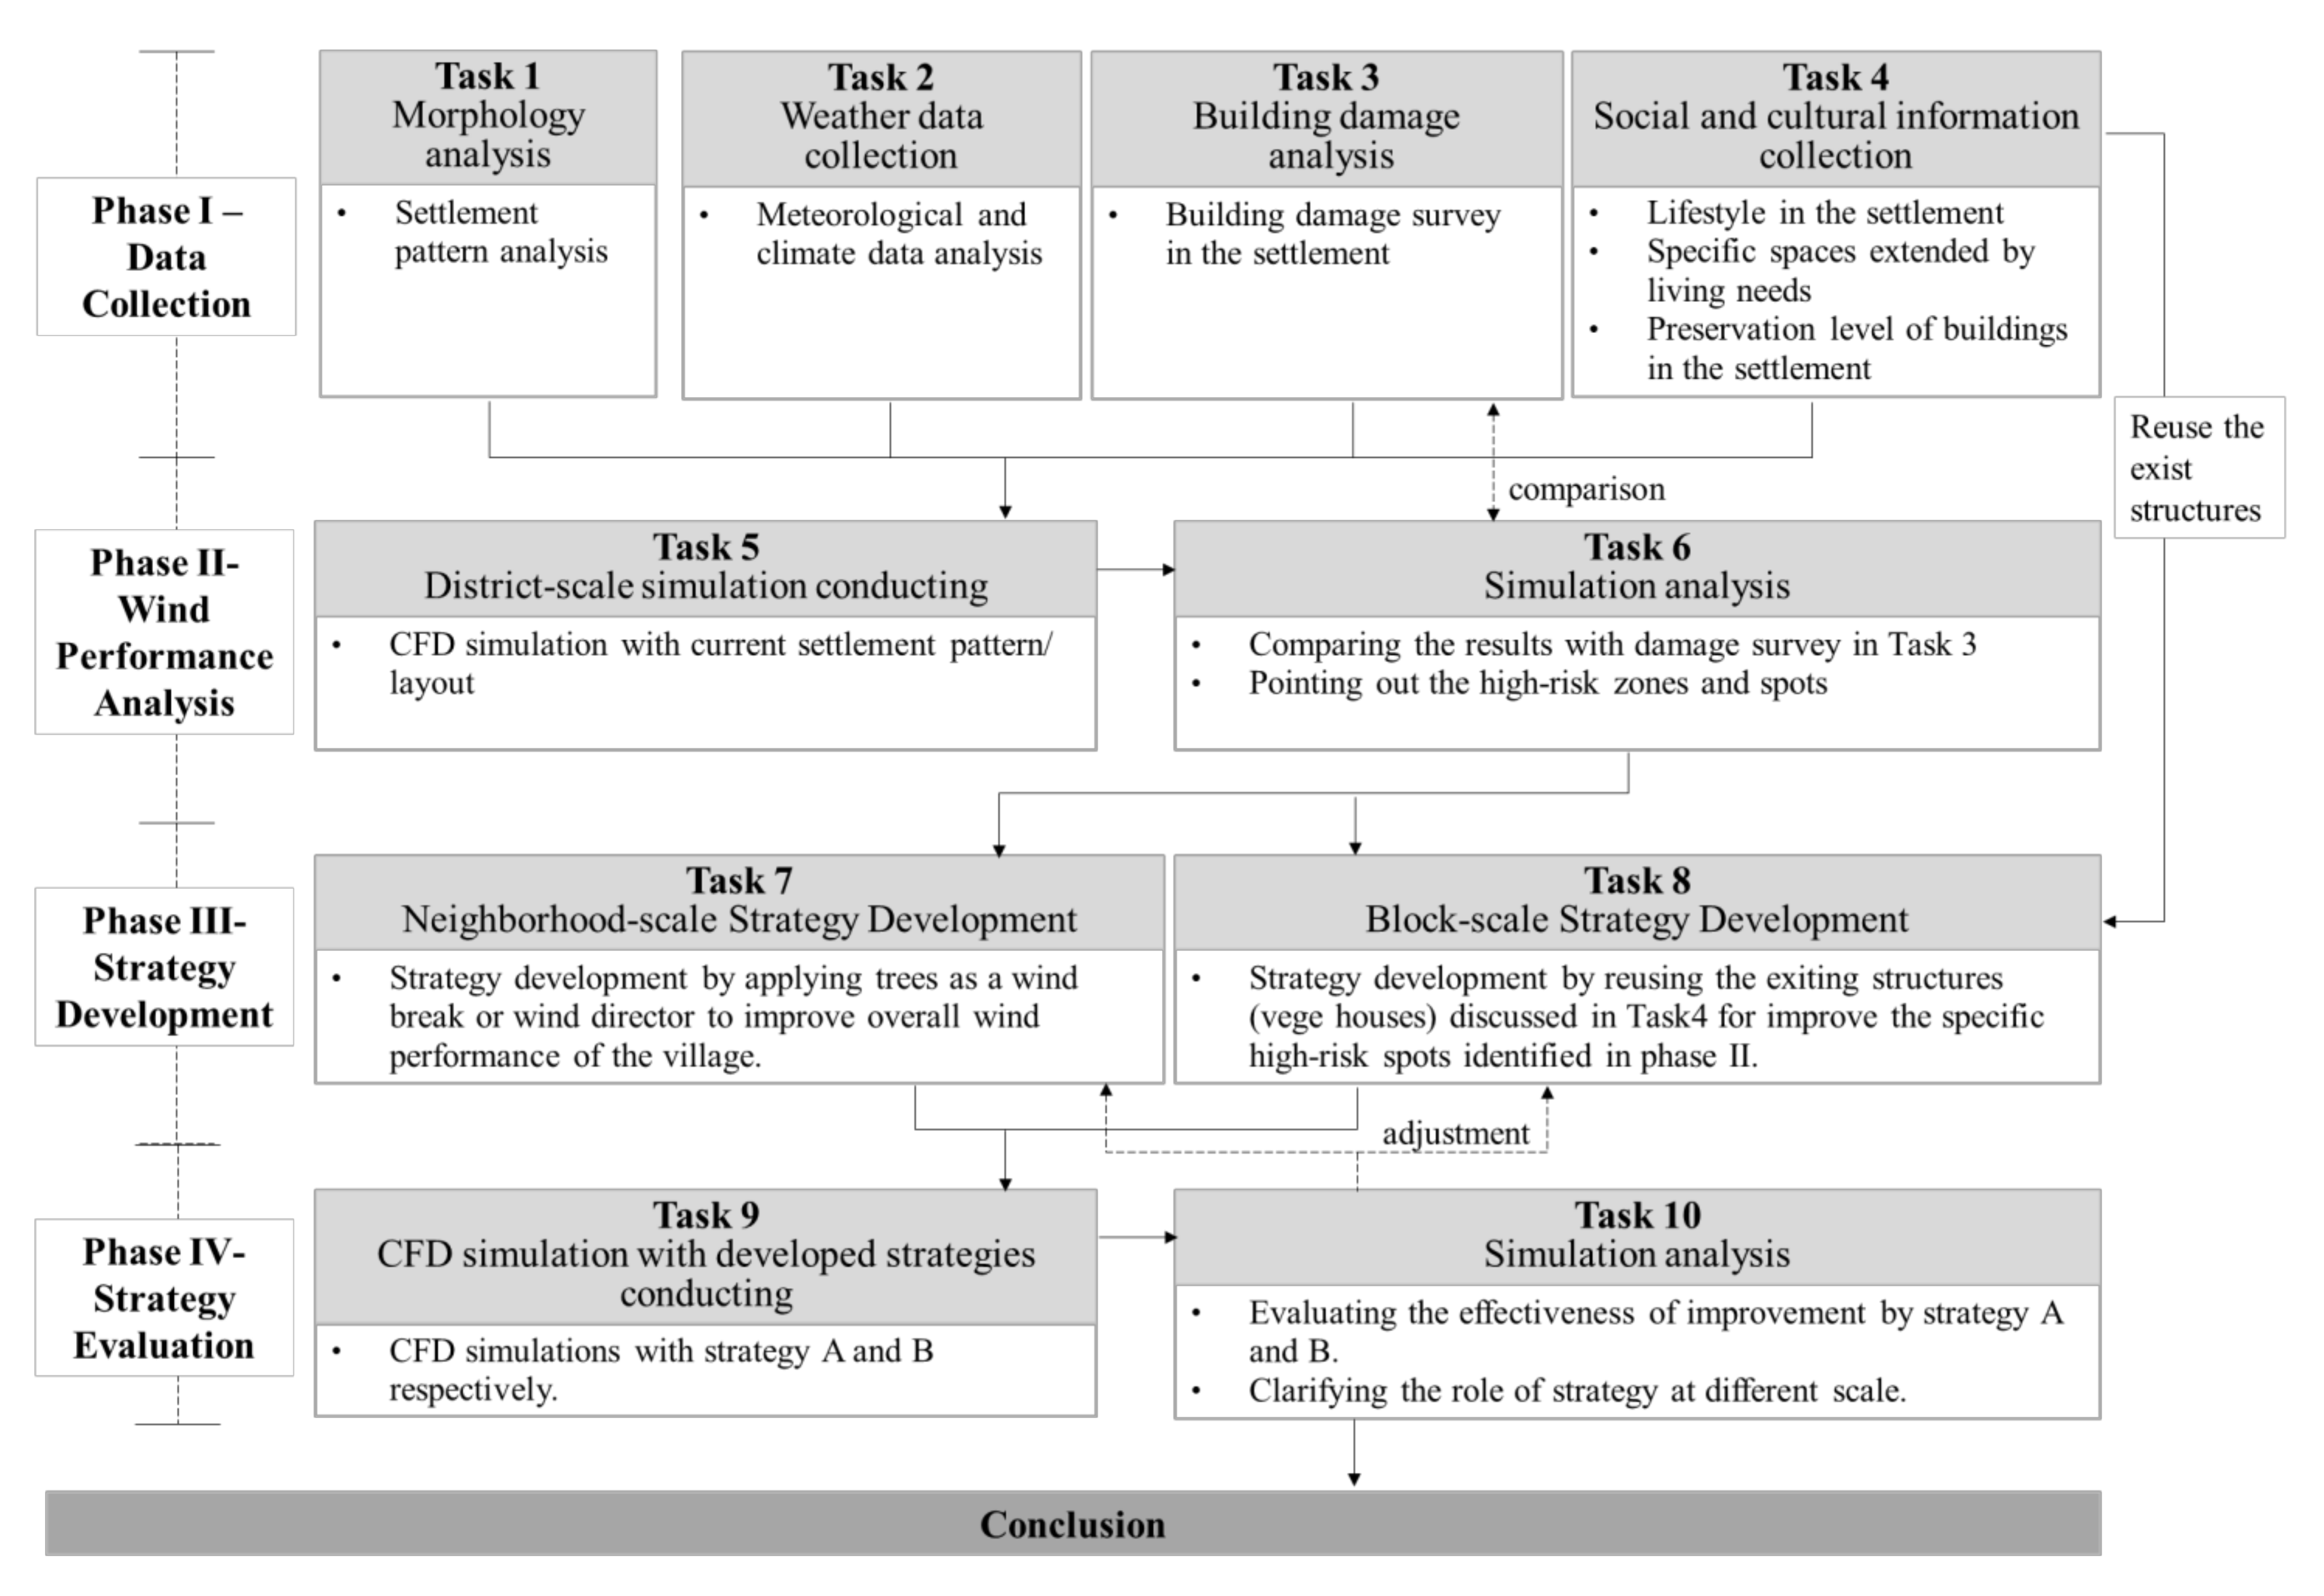
2. Methodology
2.1. Research Structure
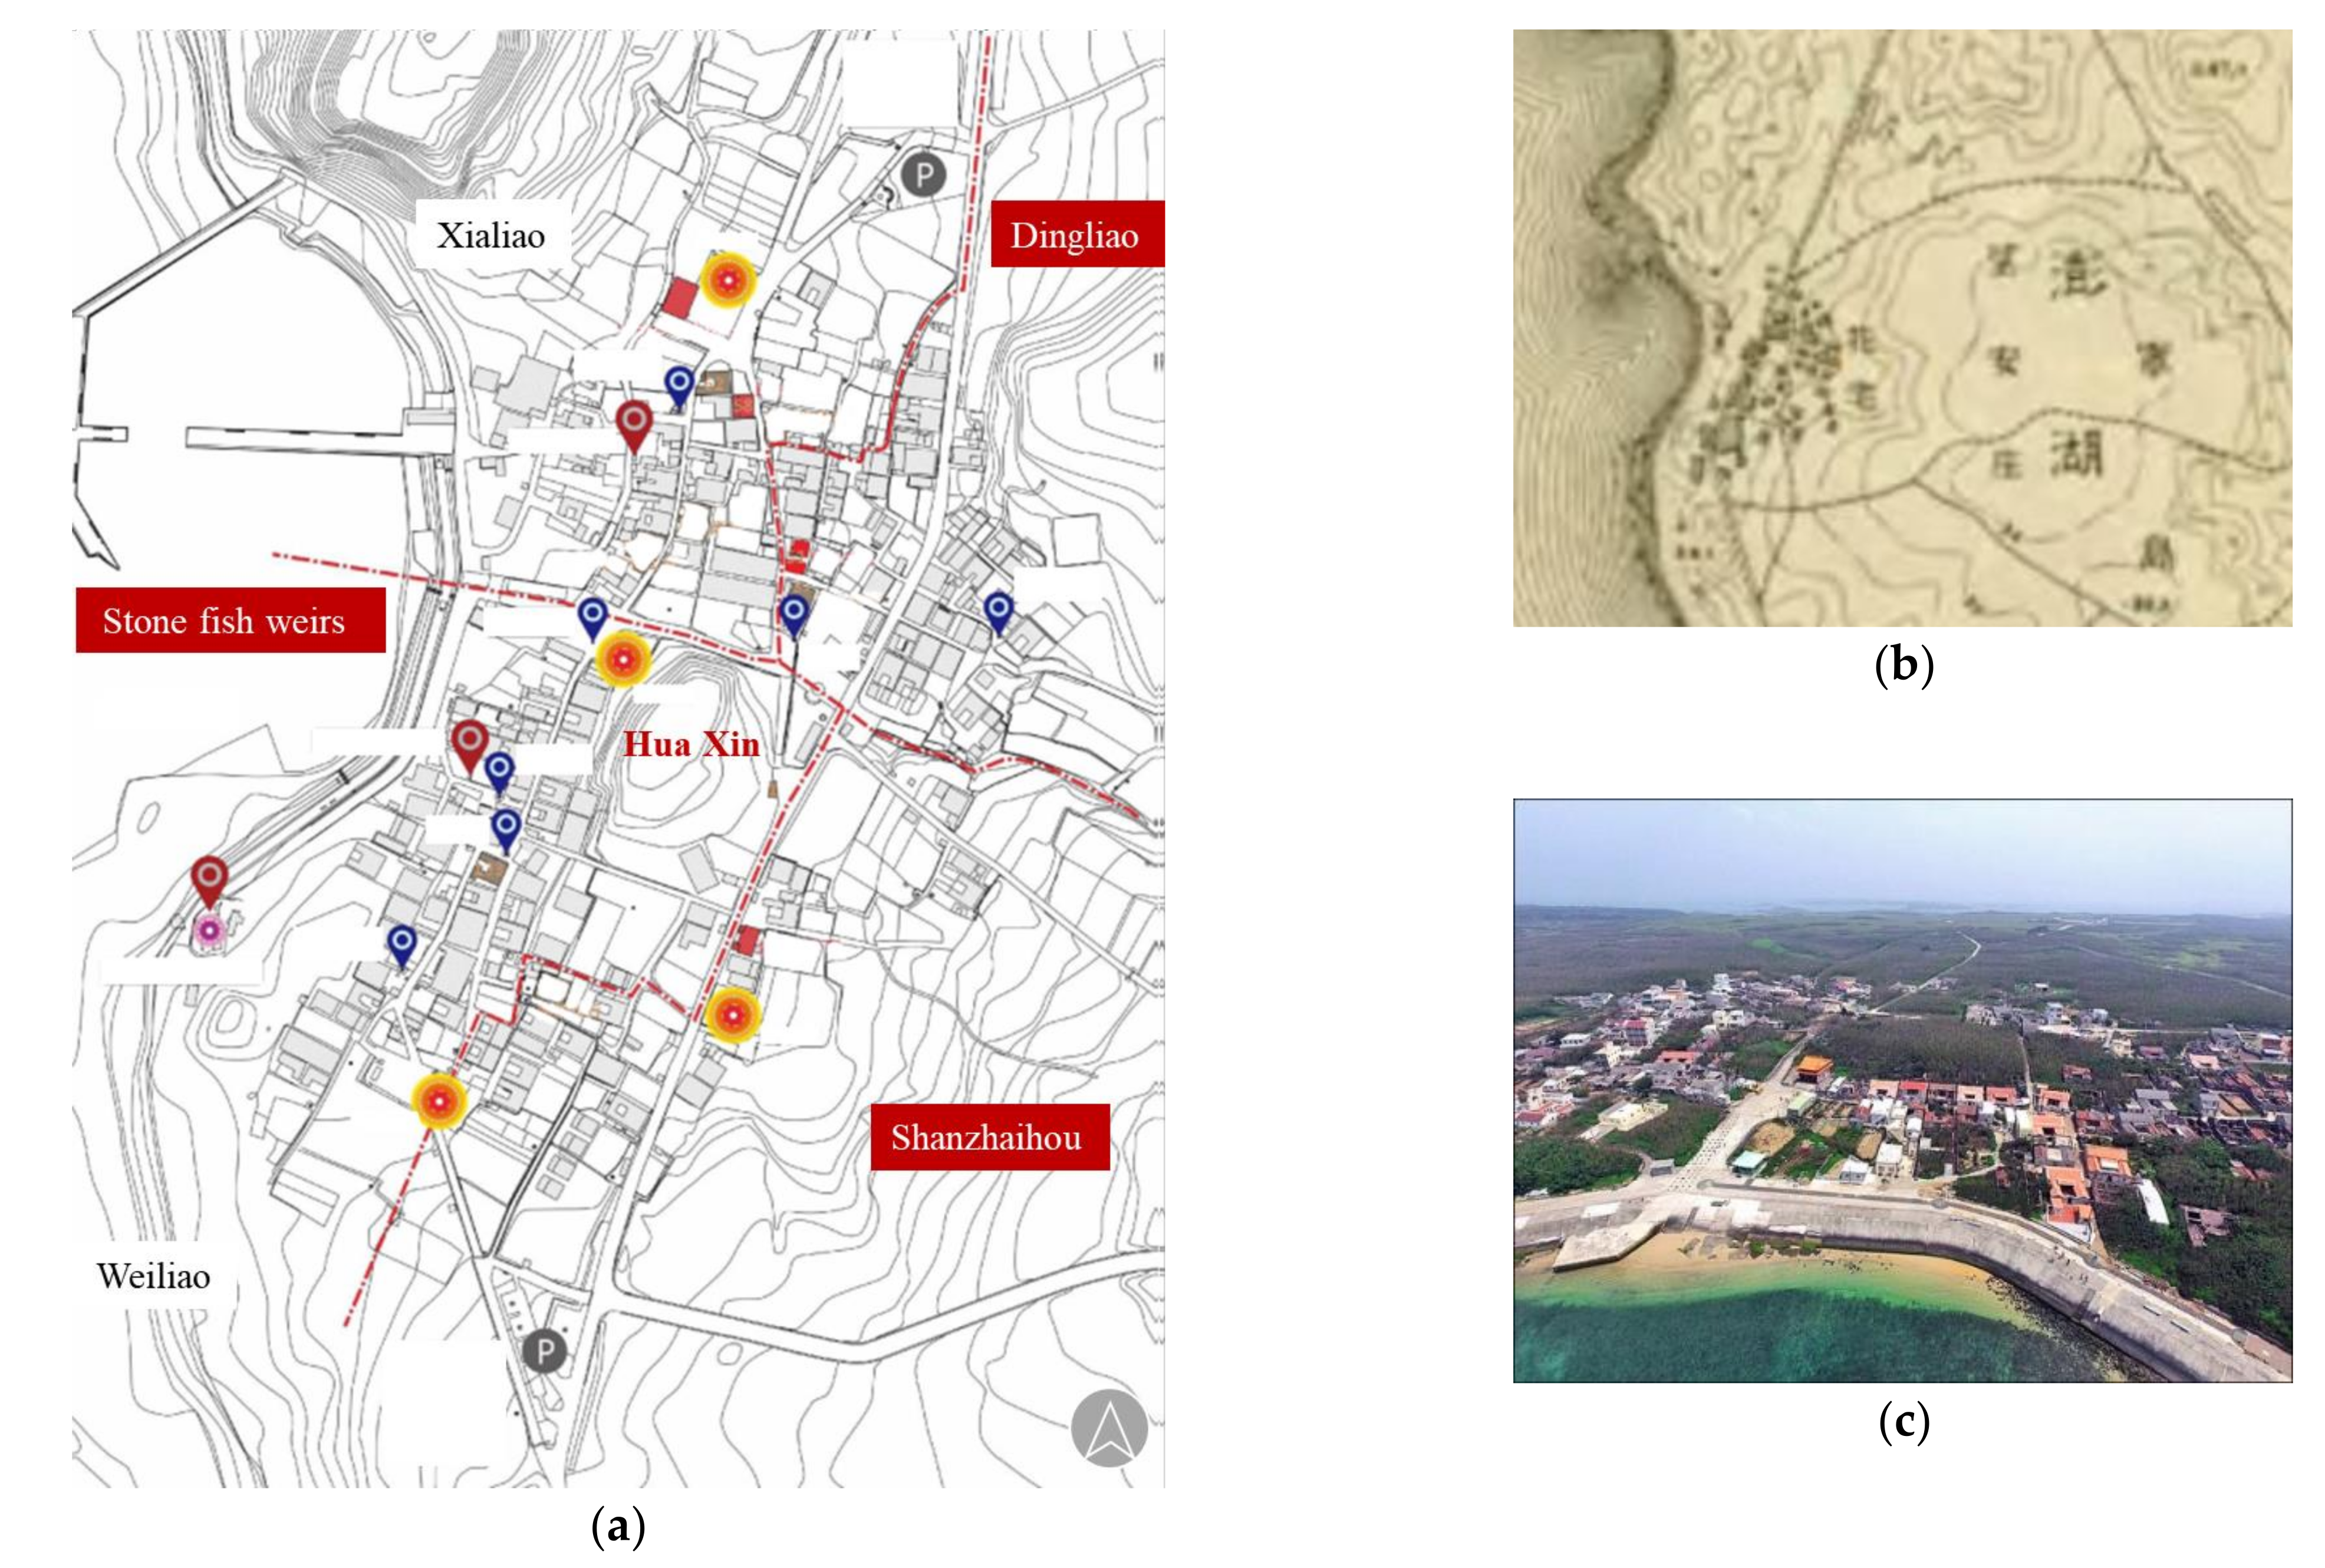
2.2. Pattern of Huatzai Village
2.3. Computational Fluid Dynamics Simulation Settings and Validation
3. Result and Discussion
3.1. Phase Ⅰ—Data Collection
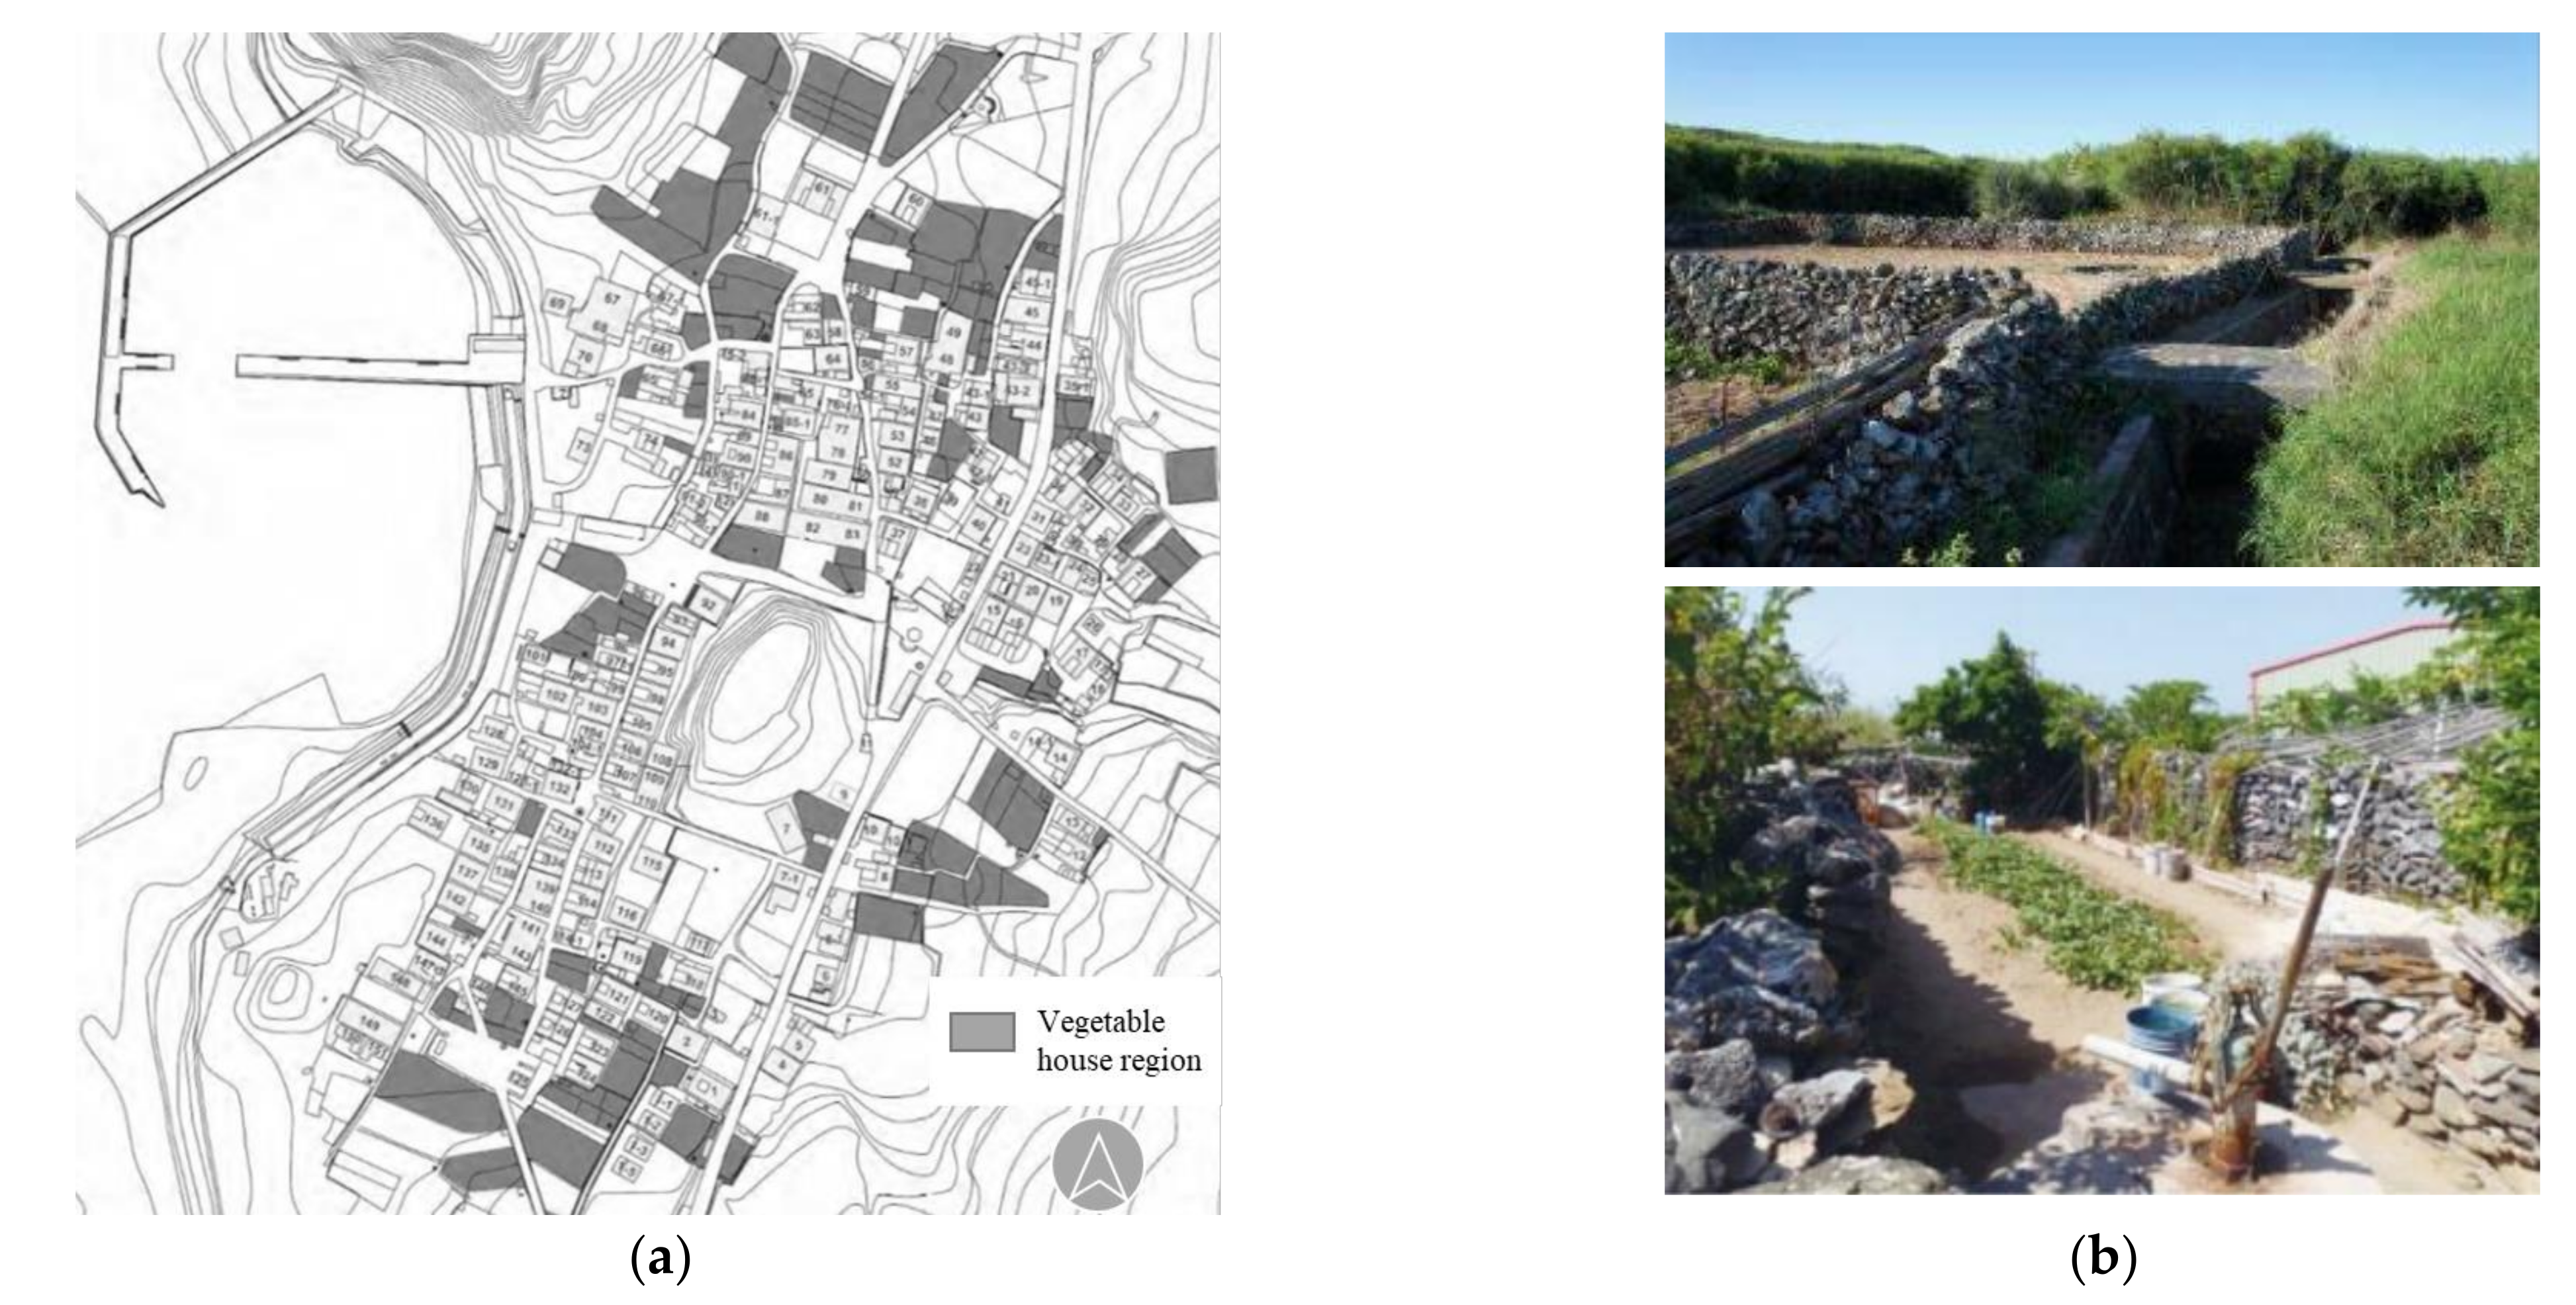
3.1.1. Characteristic Spaces in Huatzai Village
3.1.2. Weather Conditions
3.1.3. Building Damage Review
3.1.4. Preservation Level of Buildings
3.2. Phase Ⅱ—Wind Field Performance Analysis
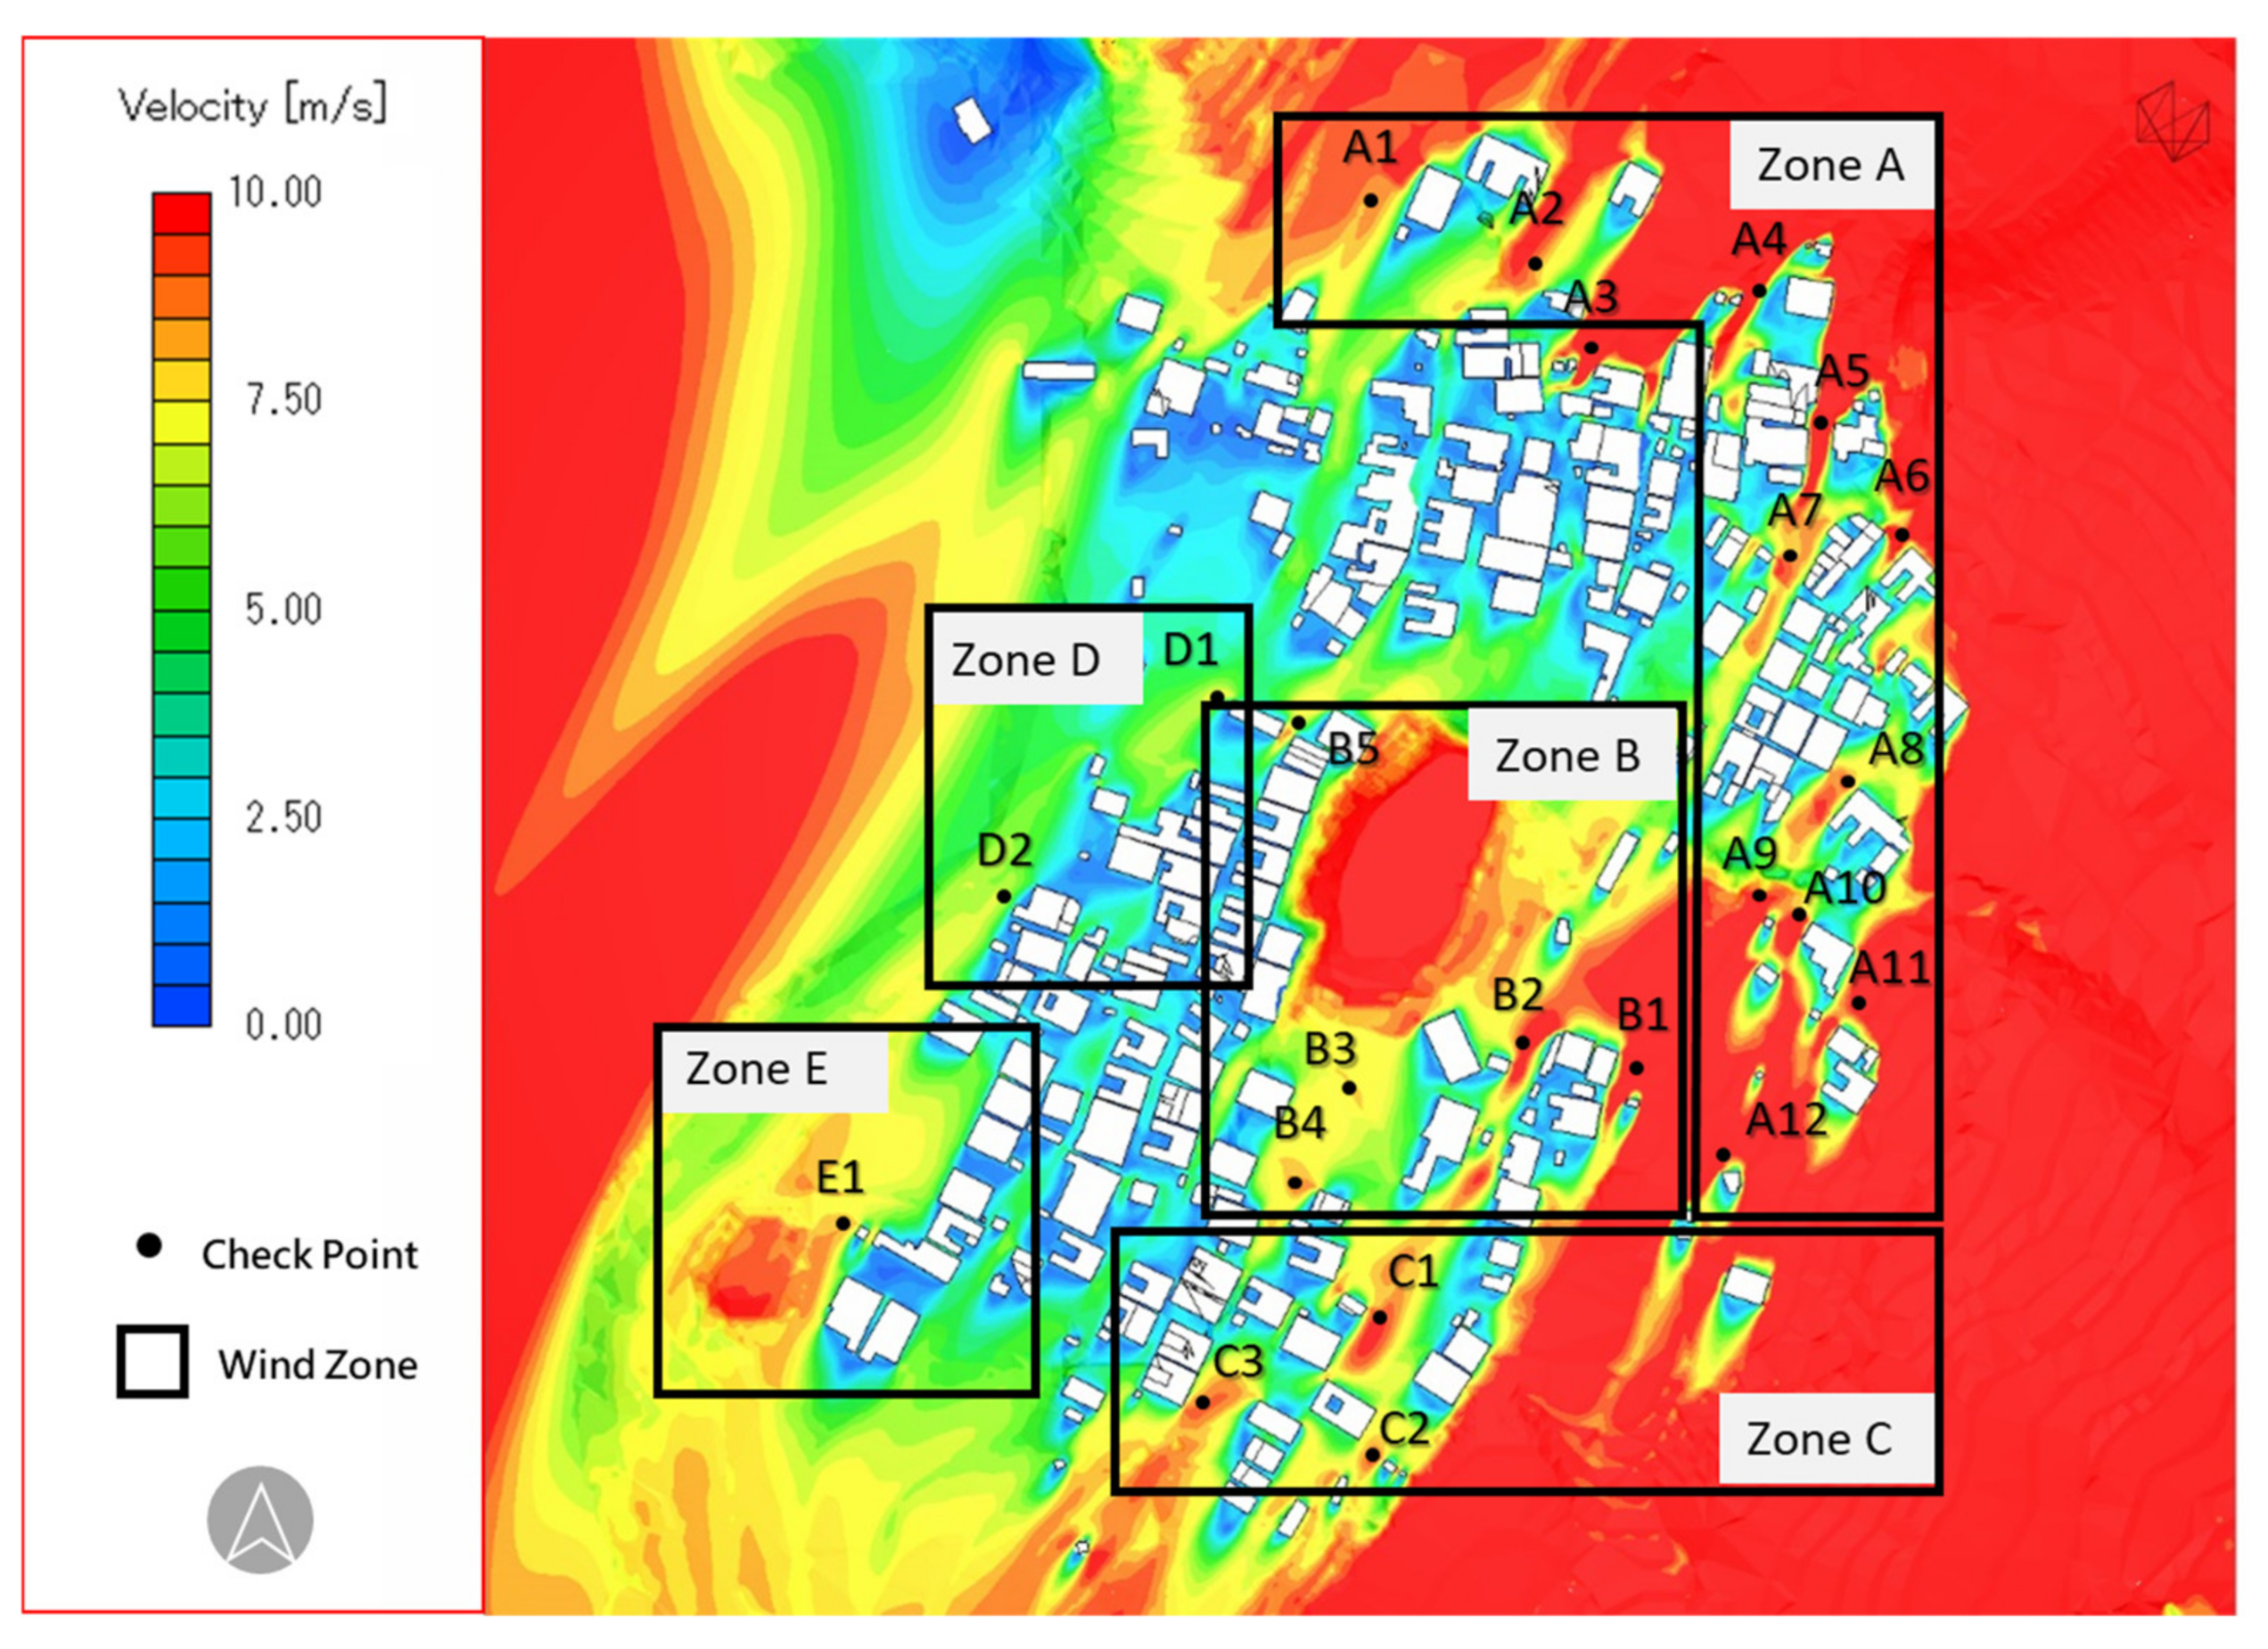
3.2.1. Wind Path Analysis
3.2.2. High-Risk Designation
3.3. Phase Ⅲ—Strategy Development
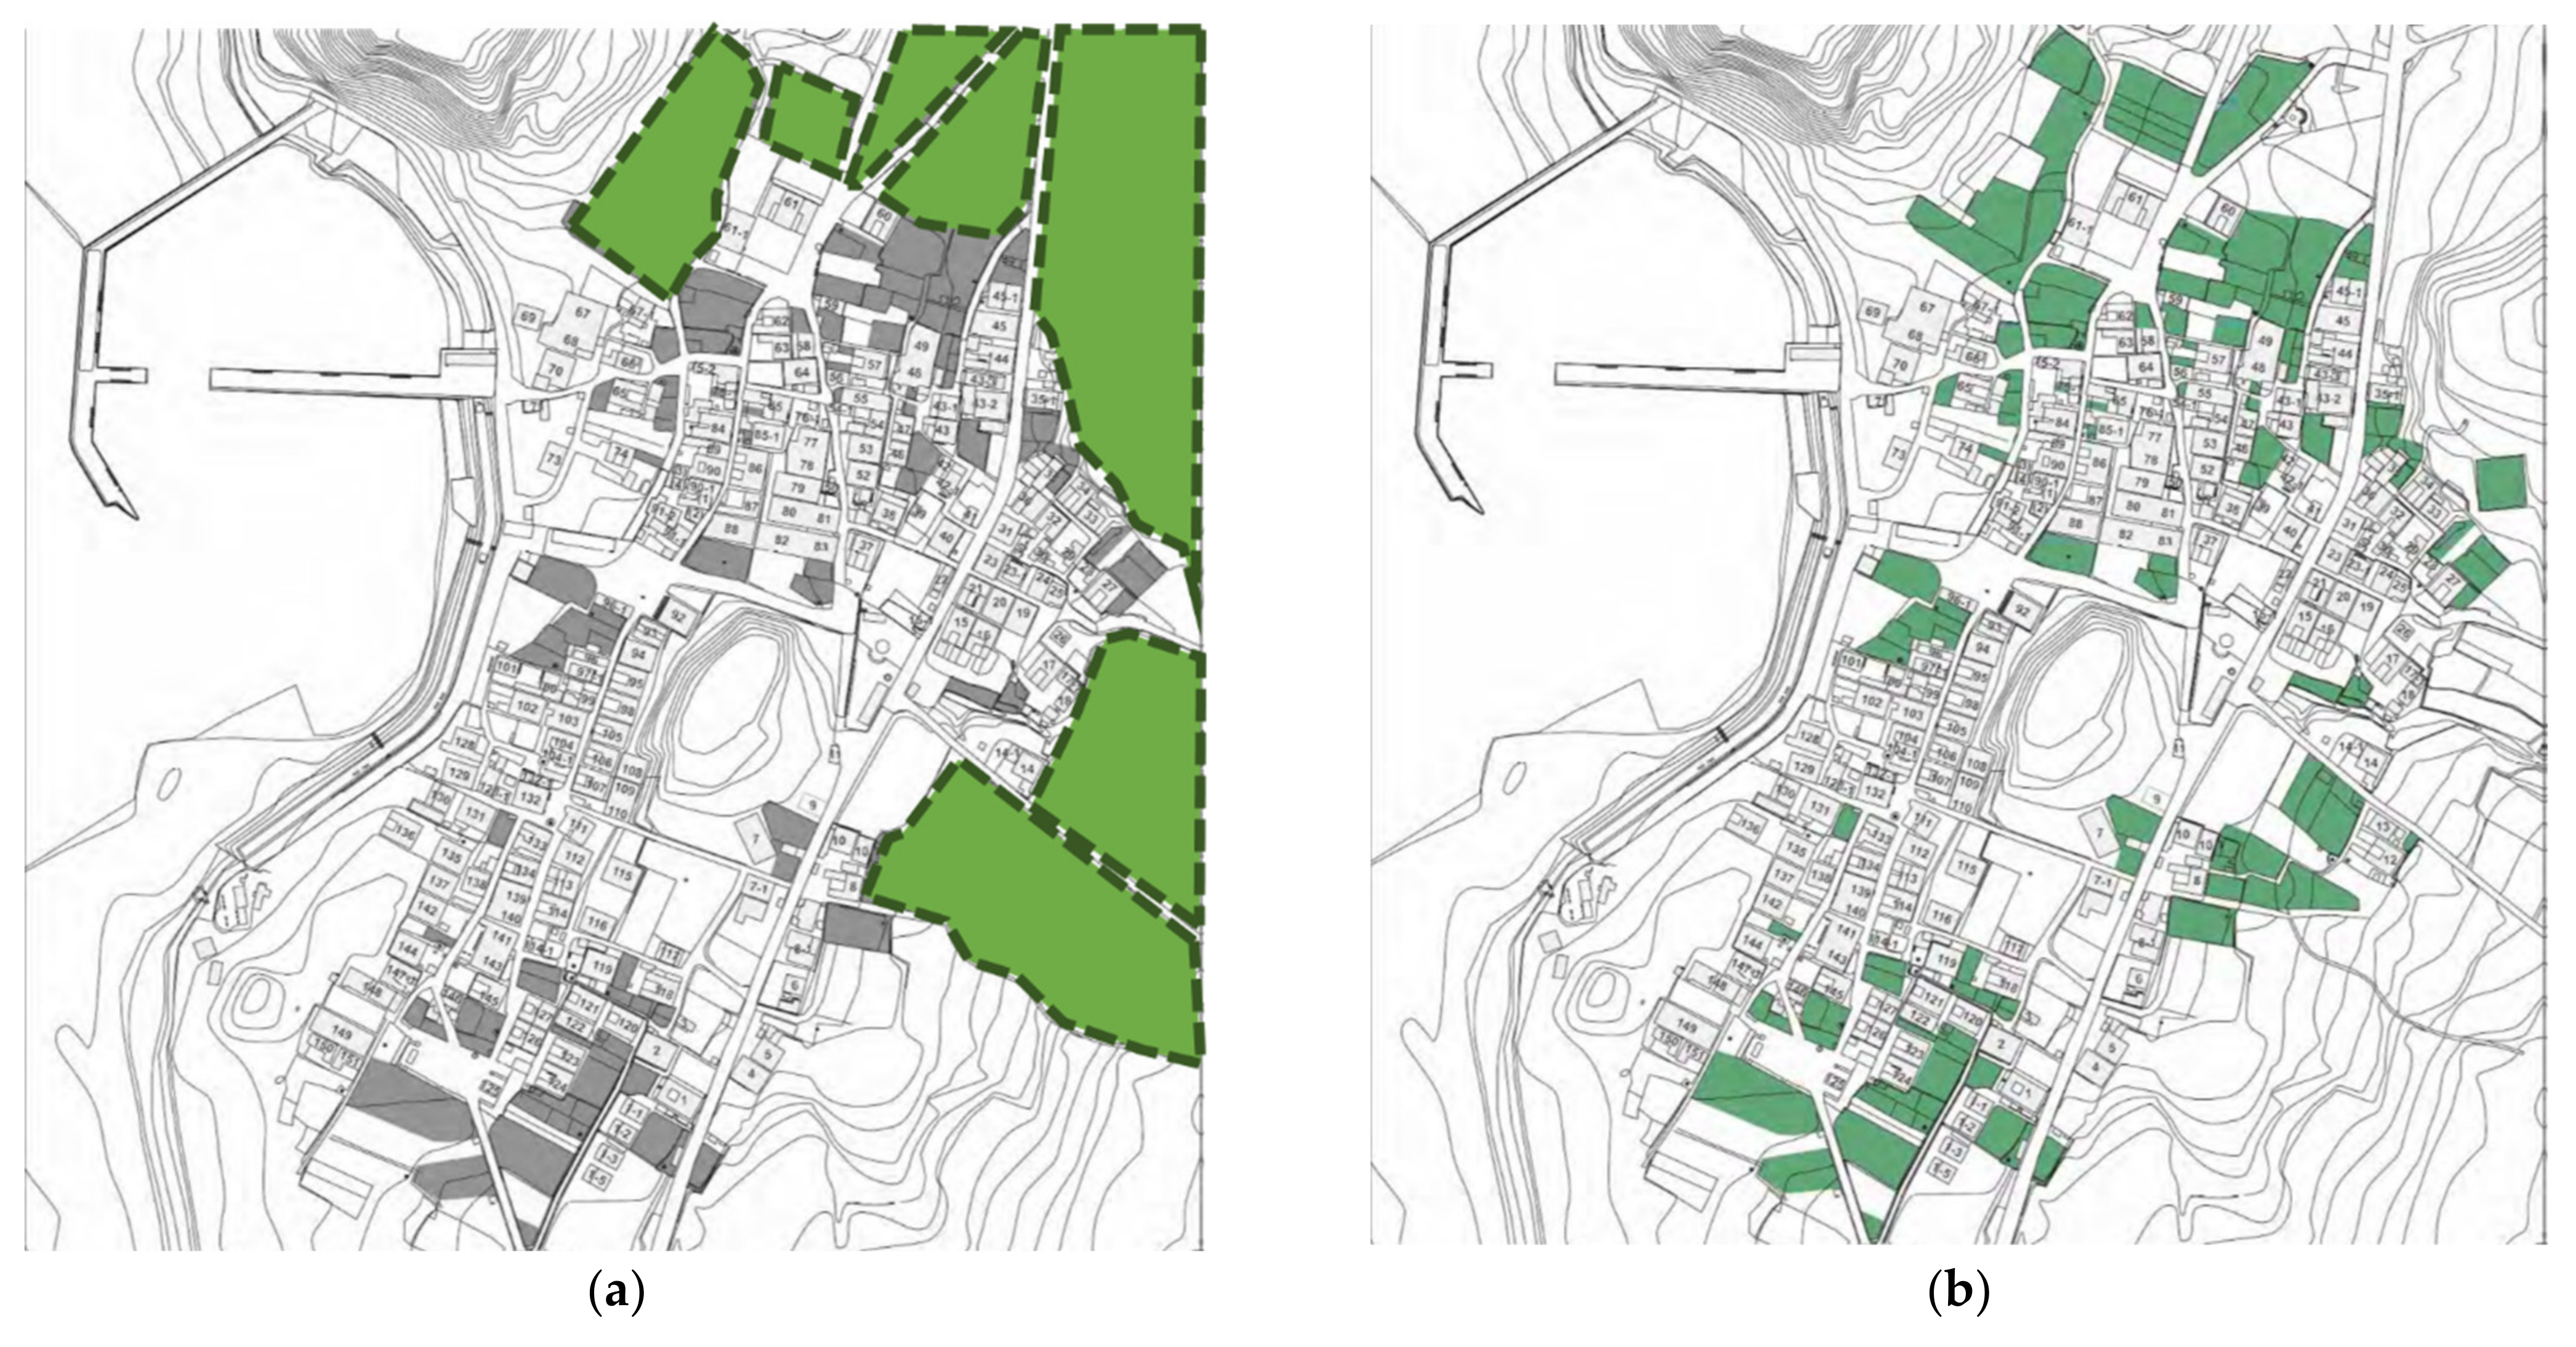
3.3.1. Strategy A
3.3.2. Strategy B
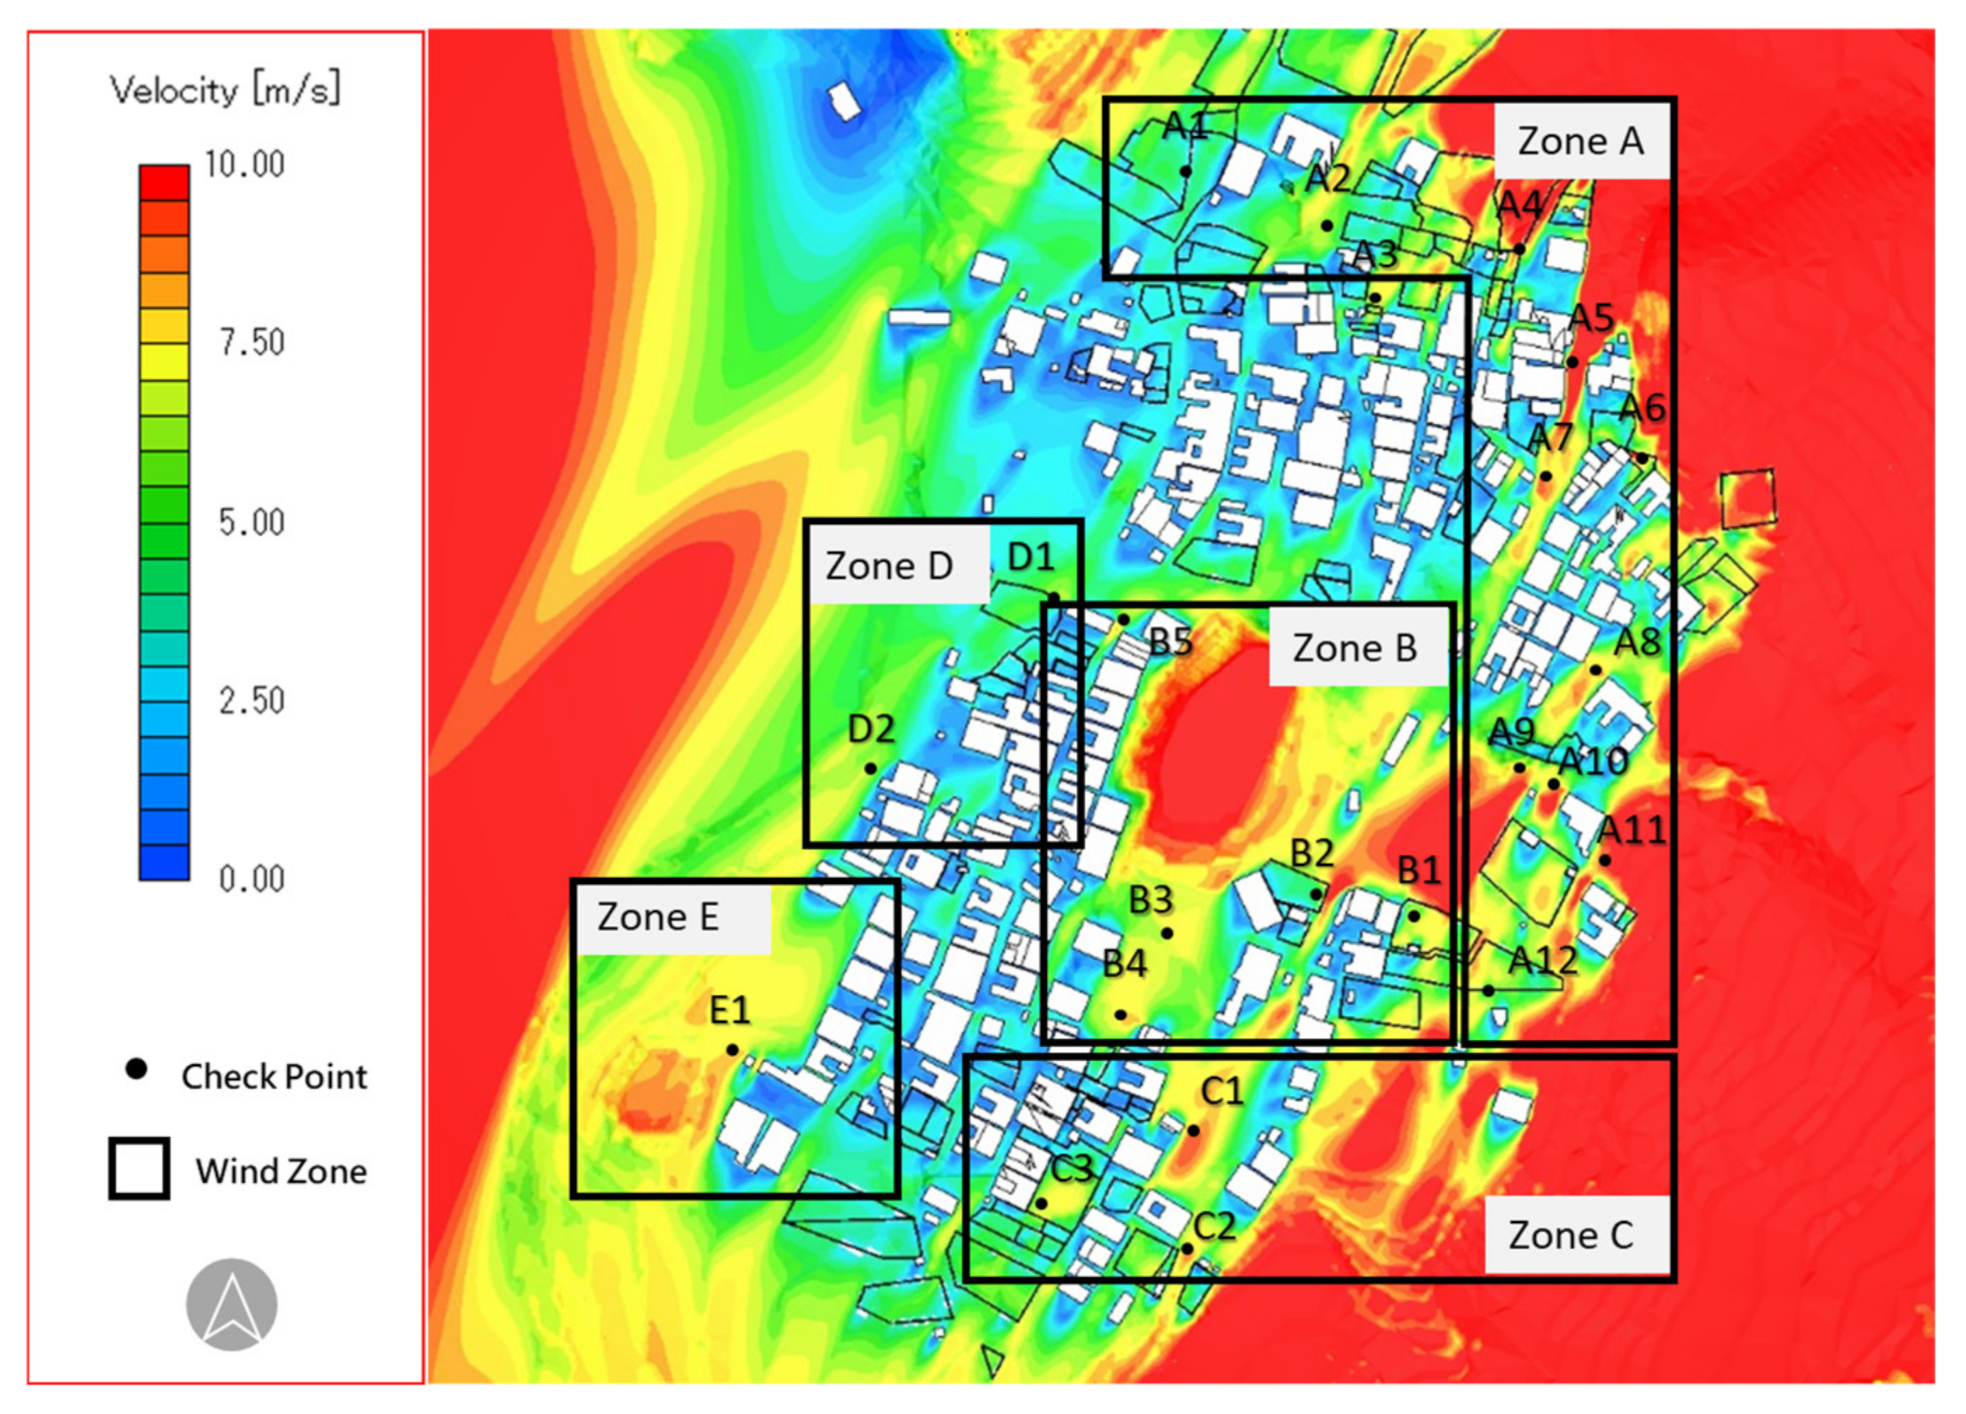
3.4. Phase Ⅳ—Strategy Evaluation
4. Conclusions
- A.
- Weather data adoption must consider the scale of the analyzed spaces.
- B.
- Wind is a key factor that affects degradation mechanisms on heritage assets.
- C.
- Settlement arrangement and lifestyle reviews are essential for climate adaptation strategy development.
- D.
- Hierarchal climate adaptation strategy could bring more efficient heritage conservation.
Author Contributions
Funding
Acknowledgments
Conflicts of Interest
References
- Pachauri, R.K.; Meyer, L.A. Climate Change 2014: Synthesis Report. In Contribution of Working Groups I, II and III to the Fifth Assessment Report of the Intergovernmental Panel on Climate Change; IPCC: Geneva, Switzerland, 2014; pp. 1–151. [Google Scholar]
- Leissner, J.; Kilian, R.; Kotova, L. Climate for Culture: Assessing the impact of climate change on the future indoor climate in historic buildings using simulations. Herit. Sci. 2015, 3, 38. [Google Scholar] [CrossRef]
- Sabbioni, C.; Cassar, M.; Brimblecombe, P.; Tidblad, J.; Kozlowski, R.; Drdácký, M.; Jiménez, C.S.; Grøntoft, T.; Ian, N.; Wainwright, M.; et al. Global Climate Change Impact on Built Heritage and Cultural Landscapes; Taylor & Francis Group: London, UK, 2006; pp. 395–401. [Google Scholar]
- Leissner, J.; Kaiser, U.; Kilian, R. CLIMATE FOR CULTURE-Damage Risk Assessment, Economic Impact and Mitigation Strategies for Sustainable Preservation of Cultural Heritage in the Times of Climate Change; Fraunhofer: Munich, Germany, 2014; pp. 1–95. [Google Scholar]
- Pamela, J. Recommendations from the ICOMOS Scientific Council Symposium: Changing World, Changing Views of Heritage: Technological Change and Cultural Heritage. In Proceedings of the ICOMOS Scientific Council Symposium: Changing World, Changing Views of Heritage: Technological Change and Cultural Heritage, La Valletta, Malta, 8 October 2009. [Google Scholar]
- Merlier, L.; Kuznik, F.; Rusaouën, G.; Salat, S. Derivation of generic typologies for microscale urban airflow studies. Sustain. Cities Soc. 2018, 36, 71–80. [Google Scholar] [CrossRef]
- ICOMOS Climate Change and Cultural Heritage Working Group. The Future of Our Pasts: Engaging Cultural Heritage in Climate Action; ICOMOS: Paris, France, 2019; pp. 1–108. [Google Scholar]
- Luo, Y.; Yin, B.; Peng, X.; Xu, Y.; Zhang, L. Wind-rain erosion of Fujian Tulou Hakka Earth Buildings. Sustain. Cities Soc. 2019, 50, 101666. [Google Scholar] [CrossRef]
- Erkal, A.; D’Ayala, D.; Sequeira, L. Assessment of wind-driven rain impact, related surface erosion and surface strength reduction of historic building materials. Build. Environ. 2012, 57, 336–348. [Google Scholar] [CrossRef]
- Richards, J.; Viles, H.; Guo, Q. The importance of wind as a driver of earthen heritage deterioration in dryland environments. Geomorphology 2020, 369, 107363. [Google Scholar] [CrossRef]
- Hussein, A.S.; El-Shishiny, H. Influences of wind flow over heritage sites: A case study of the wind environment over the Giza Plateau in Egypt. Environ. Model. Softw. 2009, 24, 389–410. [Google Scholar] [CrossRef]
- Webb, N.P.; Kachergis, E.; Miller, S.W.; McCord, S.E.; Bestelmeyer, B.T.; Brown, J.R.; Chappell, A.; Edwards, B.L.; Herrick, J.E.; Karl, J.W.; et al. Indicators and benchmarks for wind erosion monitoring, assessment and management. Ecol. Indic. 2020, 110, 105881. [Google Scholar] [CrossRef]
- Chung, Y.-S. A Condition Survey of Stucco Walls of Traditional Lao-Gu Buildings in Peng-hu Island. Master’s Thesis, National Yunlin University of Science and Technology, Yunlin, Taiwan, July 2007. [Google Scholar]
- Mirzaei, P.A. CFD modeling of micro and urban climates: Problems to be solved in the new decade. Sustain. Cities Soc. 2021, 69, 102839. [Google Scholar] [CrossRef]
- Zhang, S.; Kwok, K.C.S.; Liu, H.-L.; Jiang, Y.; Dong, K.; Wang, B. A CFD study of wind assessment in urban topology with complex wind flow. Sustain. Cities Soc. 2021, 71, 103006. [Google Scholar] [CrossRef]
- He, Y.; Liu, X.; Zhang, H.; Zheng, W.; Zhao, F.; Schnabel, M.A.; Mei, Y. Hybrid framework for rapid evaluation of wind environment around buildings through parametric design, CFD simulation, image processing and machine learning. Sustain. Cities Soc. 2021, 73, 103092. [Google Scholar] [CrossRef]
- Hsu, H.-H.; Chiang, W.-H.; Huang, J.-S. Hybrid Ventilation in an Air-Conditioned Office Building with a Multistory Atrium for Thermal Comfort: A Practical Case Study. Buildings 2021, 11, 625. [Google Scholar] [CrossRef]
- Mirzaei, P.A.; Haghighat, F. Approaches to study Urban Heat Island-Abilities and limitations. Sustain. Cities Soc. 2010, 45, 2192–2201. [Google Scholar] [CrossRef]
- Rajagopalan, P.; Lim, K.C.; Jamei, E. Urban heat island and wind flow characteristics of a tropical city. J. Sol. Energy 2014, 107, 159–170. [Google Scholar] [CrossRef]
- Hsieh, C.-M.; Huang, H.-C. Mitigating urban heat islands: A method to identify potential wind corridor for cooling and ventilation. Computers. Comput. Environ. Urban Syst. 2016, 57, 130–143. [Google Scholar] [CrossRef]
- Adamek, K.; Vasan, N.; Elshaer, A.; English, E.; Bitsuamlak, G. Pedestrian level wind assessment through city development: A study of the financial district in Toronto. Sustain. Cities Soc. 2017, 35, 178–190. [Google Scholar] [CrossRef]
- Chu, C.-R.; Chang, C.-Y.; Huang, C.-J.; Wu, T.-R.; Wang, C.-Y.; Liu, M.-Y. Windbreak protection for road vehicles against crosswind. J. Wind Eng. Ind. Aerodyn. 2013, 116, 61–69. [Google Scholar] [CrossRef]
- Wu, X.; Zou, X.; Zhou, N.; Zhang, C.; Shi, S. Deceleration efficiencies of shrub windbreaks in a wind tunnel. Aeolian Res. 2015, 16, 11–23. [Google Scholar] [CrossRef]
- Baker, T.P.; Moroni, M.T.; Hunt, M.A.; Worledge, D.; Mendham, D.S. Temporal, environmental and spatial changes in the effect of windbreaks on pasture microclimate. Agric. For. Meteorol. 2021, 297, 108265. [Google Scholar] [CrossRef]
- Speckart, S.O.; Pardyjak, E.R. A method for rapidly computing windbreak flow field variables. J. Wind Eng. Ind. Aerodyn. 2014, 132, 101–108. [Google Scholar] [CrossRef]
- Liu, K.-C.; Chao-Ching, Y.; Mu, S. Overall Review Plan for the Preservation and Redevelopment Plan of the Huatzai Settlement, an Important Settlement in Wang-an; Cultural Affair Bureau: Penghu, Taiwan, 2019. [Google Scholar]
- 100-Year-Old Historical Maps from Taiwan. Available online: https://gissrv4.sinica.edu.tw/gis/twhgis/ (accessed on 1 September 2022).
- Liberty Times. Available online: https://news.ltn.com.tw/news/local/paper/1053279 (accessed on 1 September 2022).
- Franke, J.; Hellsten, A.; Schlünzen, H.; Carissimo, B. COST Action 732: Best Practice Guideline for the CFD Simulation of Flows in the Urban Environment; COST: Hamburg, German, 2007. [Google Scholar]
- Kwak, K.-H.; Baik, J.-J.; Lee, S.-H.; Ryu, Y.-H. Computational fluid dynamics modelling of the diurnal variation of flow in a street canyon. Bound.-Layer Meteorol. 2011, 141, 77–92. [Google Scholar] [CrossRef]
- Luo, Z.; Li, Y. Passive urban ventilation by combined buoyancy-driven slope flow and wall flow: Parametric CFD studies on idealized city models. Atmos. Environ. 2011, 45, 5946–5956. [Google Scholar] [CrossRef]
- Haghighat, F.; Mirzaei, P.A. Impact of non-uniform urban surface temperature on pollution dispersion in urban areas. Build. Simul. 2011, 4, 227–244. [Google Scholar] [CrossRef]
- Mirzaei, P.A.; Carmeliet, J. Dynamical computational fluid dynamics modeling of the stochastic wind for application of urban studies. Build Environ. 2013, 70, 161–170. [Google Scholar] [CrossRef]
- Vidrih, B.; Medved, S. Multiparametric model of urban park cooling island. Urban For. Urban Green. 2013, 12, 220–229. [Google Scholar] [CrossRef]
- Penghu.Info Website. Available online: https://penghu.info/ (accessed on 1 September 2022).


| Damaged Component | Damage | Deterioration of Walls of Different Orientations (Hardness ≤ Level 3) |
|---|---|---|
| Surface and frame of the roof |
|  |
| Wall structure | Collapse due to water vapor penetrating upward from the ground | |
| Wall surface | Erosion | |
| Doors and windows |
|
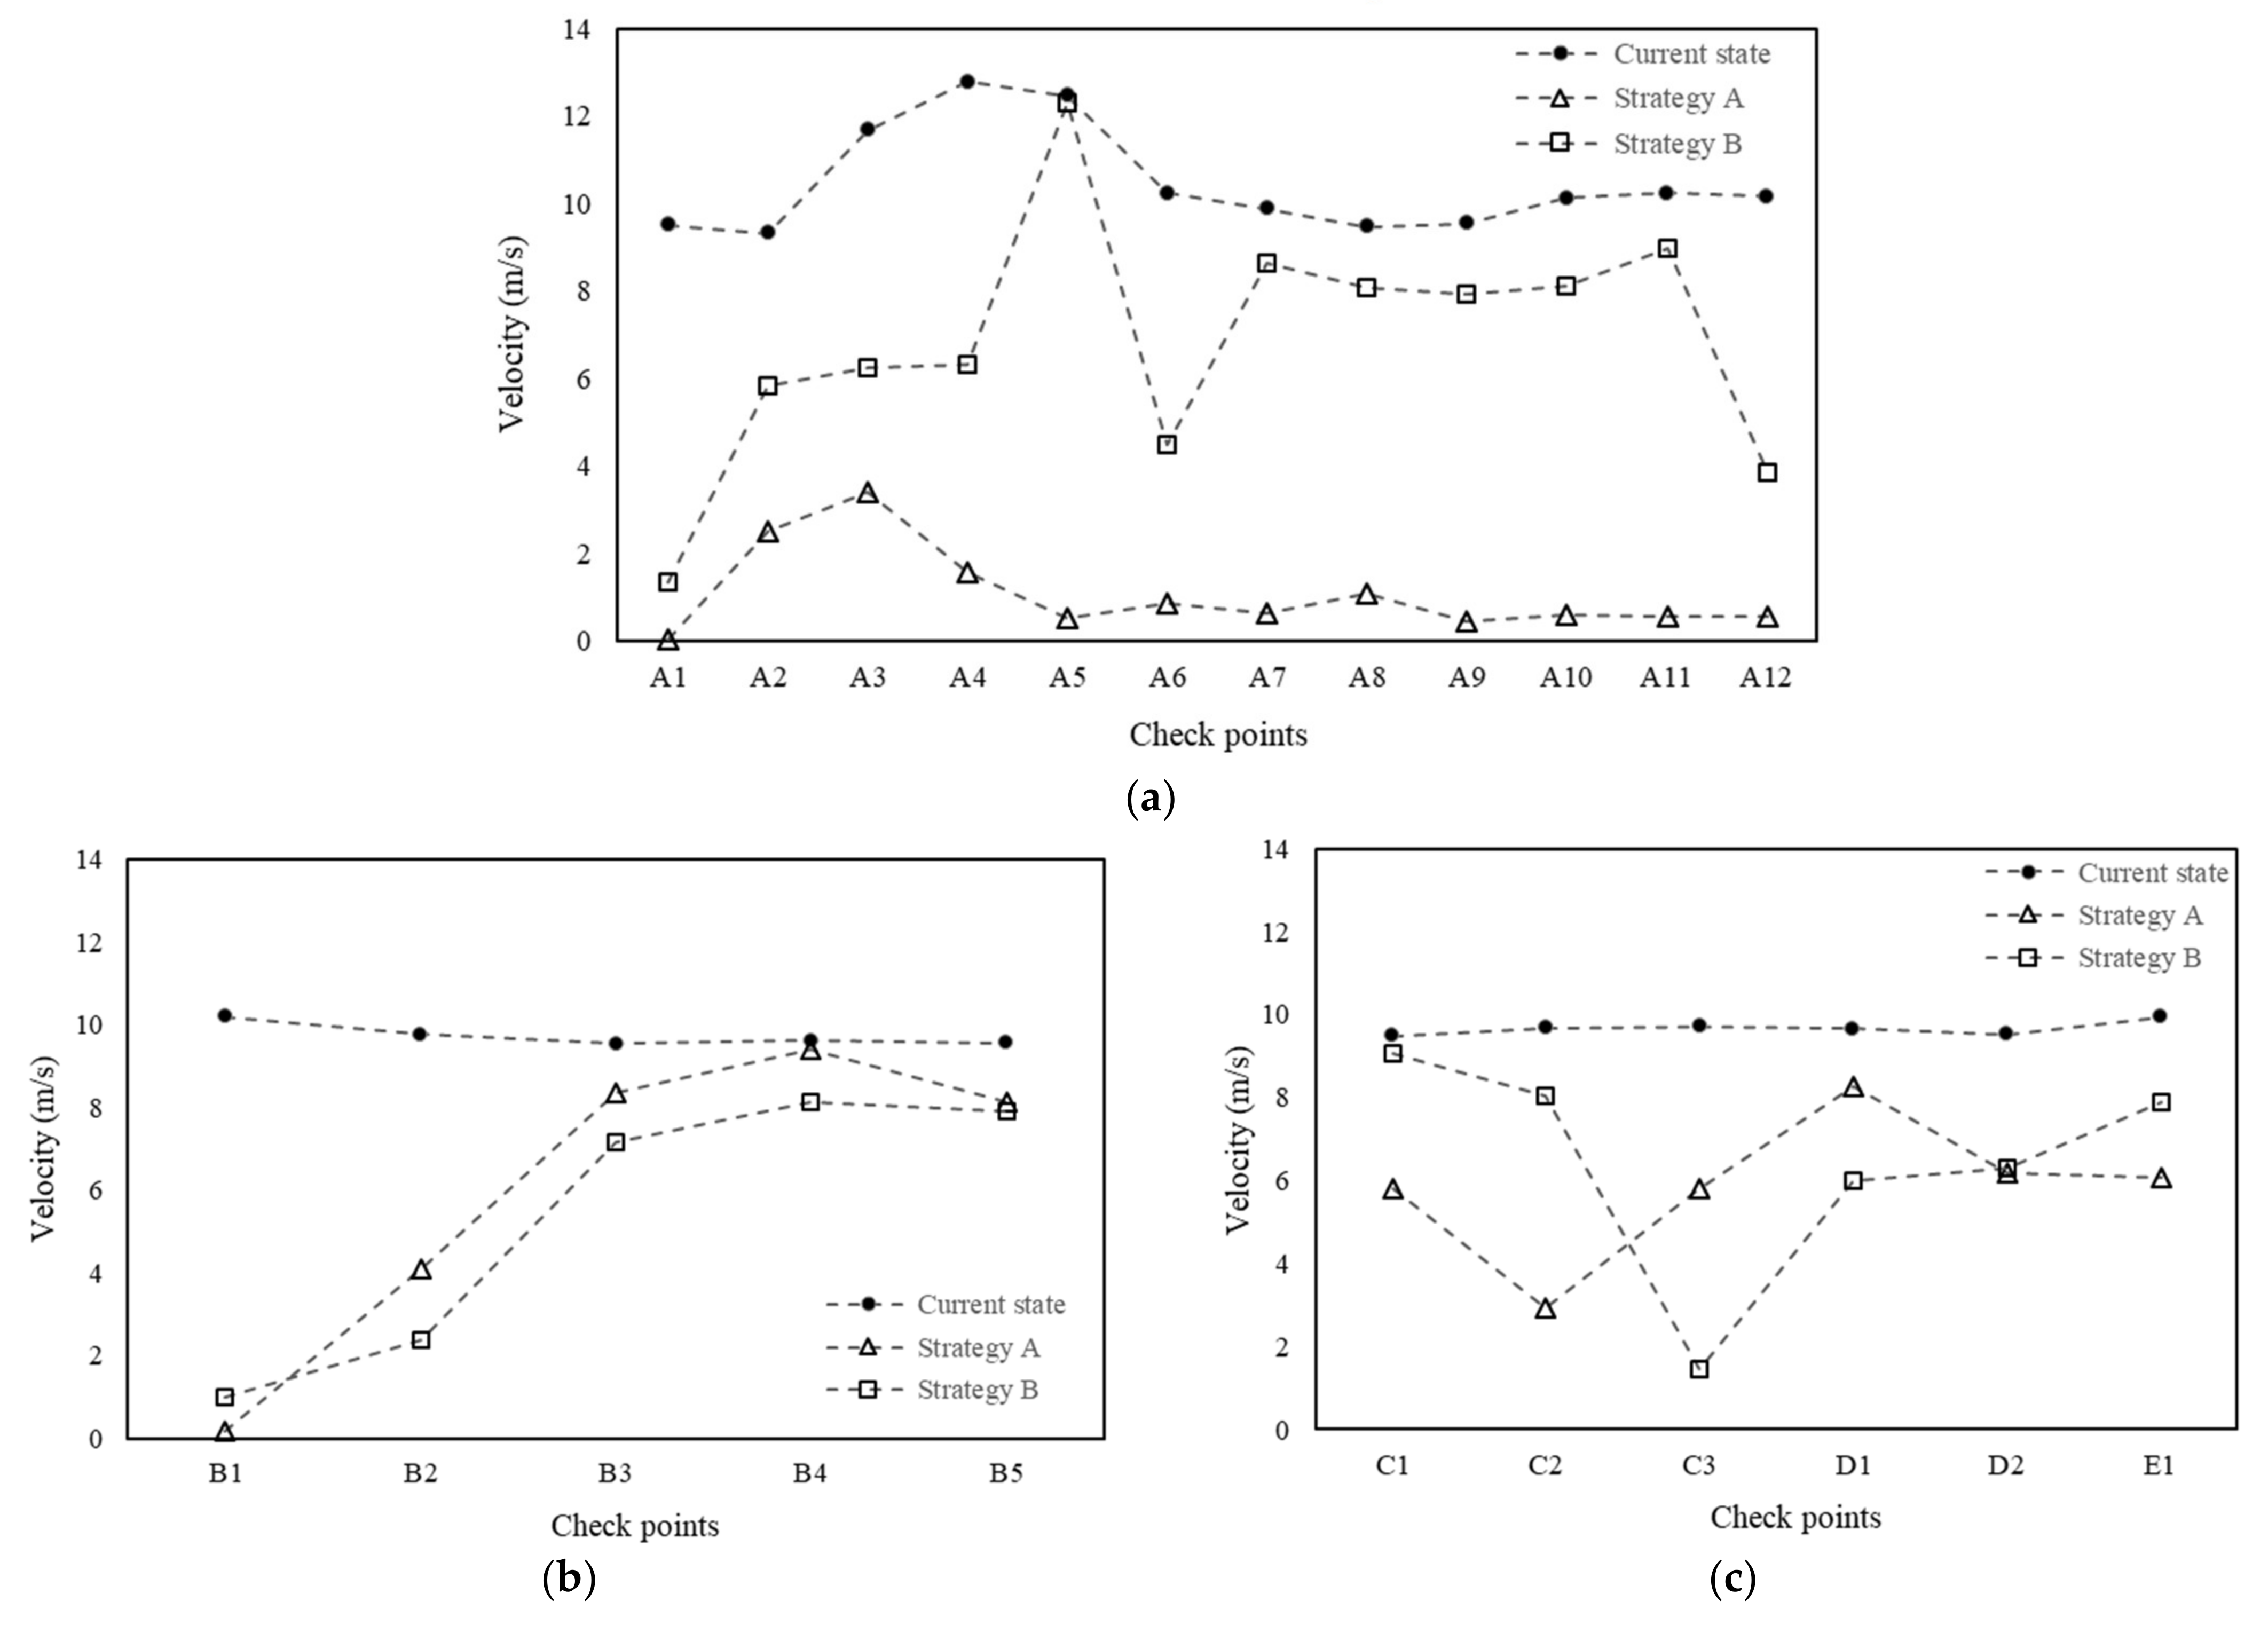
| (a) Zone A | ||||||||||||
| Check Points | A1 | A2 | A3 | A4 | A5 | A6 | A7 | A8 | A9 | A10 | A11 | A12 |
| Current State (m/s) | 9.51 | 9.32 | 11.67 | 12.77 | 12.47 | 10.24 | 9.88 | 9.48 | 9.54 | 10.12 | 10.24 | 10.17 |
| Strategy A (m/s) | 0.06 | 2.5 | 3.4 | 1.58 | 0.52 | 0.88 | 0.63 | 1.09 | 0.47 | 0.62 | 0.56 | 0.57 |
| Reduction (%) | 99% | 73% | 71% | 88% | 96% | 91% | 94% | 88% | 95% | 94% | 94% | 94% |
| (b) Zone B | ||||||||||||
| Check point | B1 | B2 | B3 | B4 | B5 | |||||||
| Current State (m/s) | 10.2 | 9.77 | 9.54 | 9.62 | 9.56 | |||||||
| Strategy A (m/s) | 0.18 | 4.11 | 8.36 | 9.4 | 8.12 | |||||||
| Reduction (%) | 98% | 58% | 12% | 2% | 15% | |||||||
| (c) Zone C, D and E | ||||||||||||
| Check point | C1 | C2 | C3 | D1 | D2 | E1 | ||||||
| Current State (m/s) | 9.5 | 9.69 | 9.72 | 9.66 | 9.53 | 9.94 | ||||||
| Strategy A (m/s) | 5.82 | 2.93 | 5.81 | 8.26 | 6.17 | 6.06 | ||||||
| Reduction (%) | 39% | 70% | 40% | 15% | 35% | 39% | ||||||
| (a) Zone A | ||||||||||||
| Check Points | A1 | A2 | A3 | A4 | A5 | A6 | A7 | A8 | A9 | A10 | A11 | A12 |
| Current State (m/s) | 9.51 | 9.32 | 11.67 | 12.77 | 12.47 | 10.24 | 9.88 | 9.48 | 9.54 | 10.12 | 10.24 | 10.17 |
| Strategy B (m/s) | 1.36 | 5.82 | 6.24 | 6.33 | 12.29 | 4.51 | 8.65 | 8.08 | 7.94 | 8.1 | 8.96 | 3.84 |
| Reduction (%) | 86% | 38% | 47% | 50% | 1% | 56% | 12% | 15% | 17% | 20% | 12% | 62% |
| (b) Zone B | ||||||||||||
| Check point | B1 | B2 | B3 | B4 | B5 | |||||||
| Current State (m/s) | 10.2 | 9.77 | 9.54 | 9.62 | 9.56 | |||||||
| Strategy B (m/s) | 1.01 | 2.4 | 7.15 | 8.13 | 7.91 | |||||||
| Reduction (%) | 90% | 75% | 25% | 15% | 17% | |||||||
| (c) Zone C, D and E | ||||||||||||
| Check point | C1 | C2 | C3 | D1 | D2 | E1 | ||||||
| Current State (m/s) | 9.5 | 9.69 | 9.72 | 9.66 | 9.53 | 9.94 | ||||||
| Strategy B (m/s) | 9.07 | 8.03 | 1.47 | 6 | 6.29 | 7.89 | ||||||
| Reduction (%) | 4% | 17% | 85% | 38% | 34% | 21% | ||||||
Publisher’s Note: MDPI stays neutral with regard to jurisdictional claims in published maps and institutional affiliations. |
© 2022 by the authors. Licensee MDPI, Basel, Switzerland. This article is an open access article distributed under the terms and conditions of the Creative Commons Attribution (CC BY) license (https://creativecommons.org/licenses/by/4.0/).
Share and Cite
Hsu, H.-H.; Huang, J.-S. Passive Environmental Control at Neighborhood and Block Scales for Conservation of Historic Settlements: The Case Study of Huatzai Village in Wang-An, Taiwan. Sustainability 2022, 14, 11840. https://doi.org/10.3390/su141911840
Hsu H-H, Huang J-S. Passive Environmental Control at Neighborhood and Block Scales for Conservation of Historic Settlements: The Case Study of Huatzai Village in Wang-An, Taiwan. Sustainability. 2022; 14(19):11840. https://doi.org/10.3390/su141911840
Chicago/Turabian StyleHsu, Hao-Hsiang, and Jian-Sheng Huang. 2022. "Passive Environmental Control at Neighborhood and Block Scales for Conservation of Historic Settlements: The Case Study of Huatzai Village in Wang-An, Taiwan" Sustainability 14, no. 19: 11840. https://doi.org/10.3390/su141911840
APA StyleHsu, H.-H., & Huang, J.-S. (2022). Passive Environmental Control at Neighborhood and Block Scales for Conservation of Historic Settlements: The Case Study of Huatzai Village in Wang-An, Taiwan. Sustainability, 14(19), 11840. https://doi.org/10.3390/su141911840