Article

Strength Deterioration Model of Soft Rock Considering Mesoscopic Bonding–Expansion Coupling Mechanism under Freeze–Thaw Cycles

1
School of Civil Engineering, Sun Yat-Sen University, Zhuhai 519082, China
2
Guangdong Engineering Research Centre for Major Infrastructures Safety, Sun Yat-Sen University, Guangzhou 510275, China
3
Research Center for Geotechnical Engineering and Information Technology, Sun Yat-Sen University, Guangzhou 510275, China
*
Authors to whom correspondence should be addressed.
Sustainability 2022, 14(18), 11766; https://doi.org/10.3390/su141811766
Submission received: 25 August 2022 / Revised: 12 September 2022 / Accepted: 15 September 2022 / Published: 19 September 2022

Abstract

:
The mechanical deterioration of soft rocks under freeze–thaw cycles is caused by the accumulation of mesoscopic damage. However, the current freeze–thaw deterioration model for soft rocks does not adequately consider the multiscale correlations, which makes the strength calculation results differ greatly from the test results and cannot fully reveal the damage mechanism of soft rocks under freeze–thaw cycling conditions. In this paper, the bond damage and pore ice expansion laws are considered from the soft-rock mesoscopic bond unit and a multiscale strength deterioration model is proposed. The freeze–thaw deterioration model is extended to intact and cracked soft rocks by the Discrete Element Method (DEM). The results are validated by laboratory tests. The peak strengths of intact soft rocks are calculated within 10% error for different numbers of freeze–thaw cycles, and the macroscopic crack development simulation results are consistent with the laboratory tests. The joints have a significant effect on the damage evolution: the freeze–thaw-induced mesoscopic damage in cracked rocks accumulates at a uniform rate, while the damage in intact soft rocks grows exponentially; the freeze–thaw cracks in cracked soft rocks are distributed between 60 and 90°, with a tensile–shear damage ratio of 1:2; the freeze–thaw cracks in intact soft rocks are distributed around 90°, with a tensile–shear damage ratio of 1:3. The deterioration model proposed in this paper can fully consider the multiscale damage correlations, which renders it easy to promote the application in the freeze–thaw hazard problem of soft rock engineering.

1. Introduction

Freeze–thaw (F-T) damage in cold regions causes many hazards to soft rock engineering, posing a threat to construction safety [1,2,3,4,5,6]. Soft rock engineering mainly refers to the tunnel, high slopes, open-pit mines etc., which rely on soft rock bases. The strength of soft rock is less than 20 MPa [7], and the high proportion of clay minerals in soft rock makes it sensitive to water erosion. The soft rock in cold regions is exposed to long-term F-T cycles, which cause initial crack expansion and significantly reduce the strength of the rock mass [8,9,10,11]. Soft rock consists of skeletal particles, pores and fractures on a mesoscopic scale, and the deterioration of mechanical properties under freeze–thaw cycling is caused by the accumulation of meso-damage [12,13,14,15,16,17,18,19,20]. As the number of cycles increases, the microscopic damage leads to an expansion in internal porosity, which provides more space for pore ice to further degrade the mechanical properties of the soft rock [21,22,23,24,25]. The current study has not adequately investigated the multi-scale damage correlation mechanism.
The current strength deterioration models under freeze–thaw cycling conditions mainly include strength deterioration prediction models, damage constitutive models and mesoscopic freeze–thaw cycling evolution equations. Based on laboratory experiments [26,27,28,29,30,31], scholars have found that the peak strength of soft rocks under freeze–thaw cycling conditions gradually decays, for which some empirical models have been proposed to predict the macroscopic strength deterioration of soft rocks [32,33,34]. Empirical models have the advantage of being simple and efficient, but their theory is too simple to be applied to predicting different types of soft rocks. For this reason, damage constitutive models have been derived [28,35,36]. These damage constitutive models have transformed from uniaxial models to triaxial models, which can better restore the in situ stress state. Based on these damage constitutive models, related thermodynamically numerical calculations have also been conducted to calculate the decrease in strength during freeze–thaw cycles [37,38]. However, these damage constitutive models are based on the assumption of homogeneous, isotropic and intact rock conditions. Therefore, it has difficulty in calculating natural soft rocks containing joints. Due to the large influence of initial fractures, some studies have considered the freeze–swelling effect near the joints, which causes significant stress concentrations [31,39]. Some strength deterioration models considering water migration and volume expansion have also been proposed [16]. Although these studies can well reveal the macroscopic strength decreasing in soft rocks under freeze–thaw cycles, the mesoscopic damage evolution is not adequately considered. However, the study of the mesoscale damage evolution can better reveal the freeze–thaw-induced strength deterioration. Therefore, research into the detection of mesoscale damage is advancing [40,41,42], with scholars conducting indoor freeze–thaw tests combined with scanning electron microscopy technology, ultrasonic technology and nuclear magnetic resonance technology to investigate the evolution of mesoscopic damage [12,43,44]. Based on these probing techniques, and combined with some statistical theories, scholars have developed equations for the mesoscopic evolution of freeze–thaw cyclic damage [45,46,47]. With the convenience of describing soft rock anisotropy and joints at the mesoscopic scale, some more specific strength deterioration models have been proposed. For example, the deterioration model for freeze–thaw-loaded rocks has been developed by applying the damage mechanics theory and strain equivalence principle to consider the non-uniformity of the mesostructure of rocks [48,49]. Therefore, it is easier to consider special conditions (e.g., joints) from the mesoscopic deterioration model, but the current models are difficult to fully consider the multiscale damage correlations, which makes it difficult to promote in practical applications. Actually, we can regard the soft rock consisting of bonded mesoscopic units and correlate the meso-damage evolution with the macroscopic strength deterioration. Some of these studies have already been carried out, such as the freeze–thaw cyclic damage constitutive models in a mesoscopic mechanical regime proposed by the discretization of the rock mass [50], and freeze–thaw computational simulations based on discrete elementary units [51]. In general, the current soft rock freeze–thaw deterioration models cannot adequately consider the correlations of multiscale damage evolution, which makes the strength calculation results differ greatly from the test results and cannot fully reveal the damage mechanism of soft rock under freeze–thaw cycling conditions.
To address the abovementioned issues, this paper considers the bond damage and pore ice expansion laws from the soft rock mesoscopic bonding unit and proposes a multiscale strength deterioration model. The freeze–thaw damage is simulated by DEM for intact and cracked soft rocks with horizontal joints, and the results are verified by laboratory tests. The strength deterioration model proposed in this paper can adequately consider the multi-scale damage correlation and can be easily applied to freeze–thaw hazard problems in soft rock engineering.

2. Content and Method

2.1. Bonding–Expansion Coupling Mechanism of Mesoscopic Clusters in Soft Rocks under F-T Cycles

Soft rocks are subjected to periodic temperature changes in a water-rich environment, and the internal pore water produces a freeze–thaw cycle phenomenon, with a bonding–expansion coupling effect in its internal mesoscopic cluster units (see Figure 1). Due to the presence of pores and natural fractures within the soft rock, pore water exists, and the ambient temperature is gradually transferred from the surface of the soft rock to the interior during the cooling process until it is completely frozen. There is a pore–water–ice transition in this process, and the expansion effect between the pores can lead to the development and accumulation of bond damage. In a cluster-bonded structure of mesoscopic mineral grains, the expansion of the pore ice within the interior leads to tensile and shear effects on the surrounding bonded grains resulting in meso-damage, leading to an increase in pore volume. During the next freeze–thaw cycle, more water enters the pore space and so on, eventually causing an engineering hazard.
Before proposing the deterioration model, we first analyzed the cluster unit and its freeze–thaw damage mechanisms, and the following assumptions were made:
(1)
Soft rock consists of skeletal particles, bonds, pores [52,53,54,55,56];
(2)
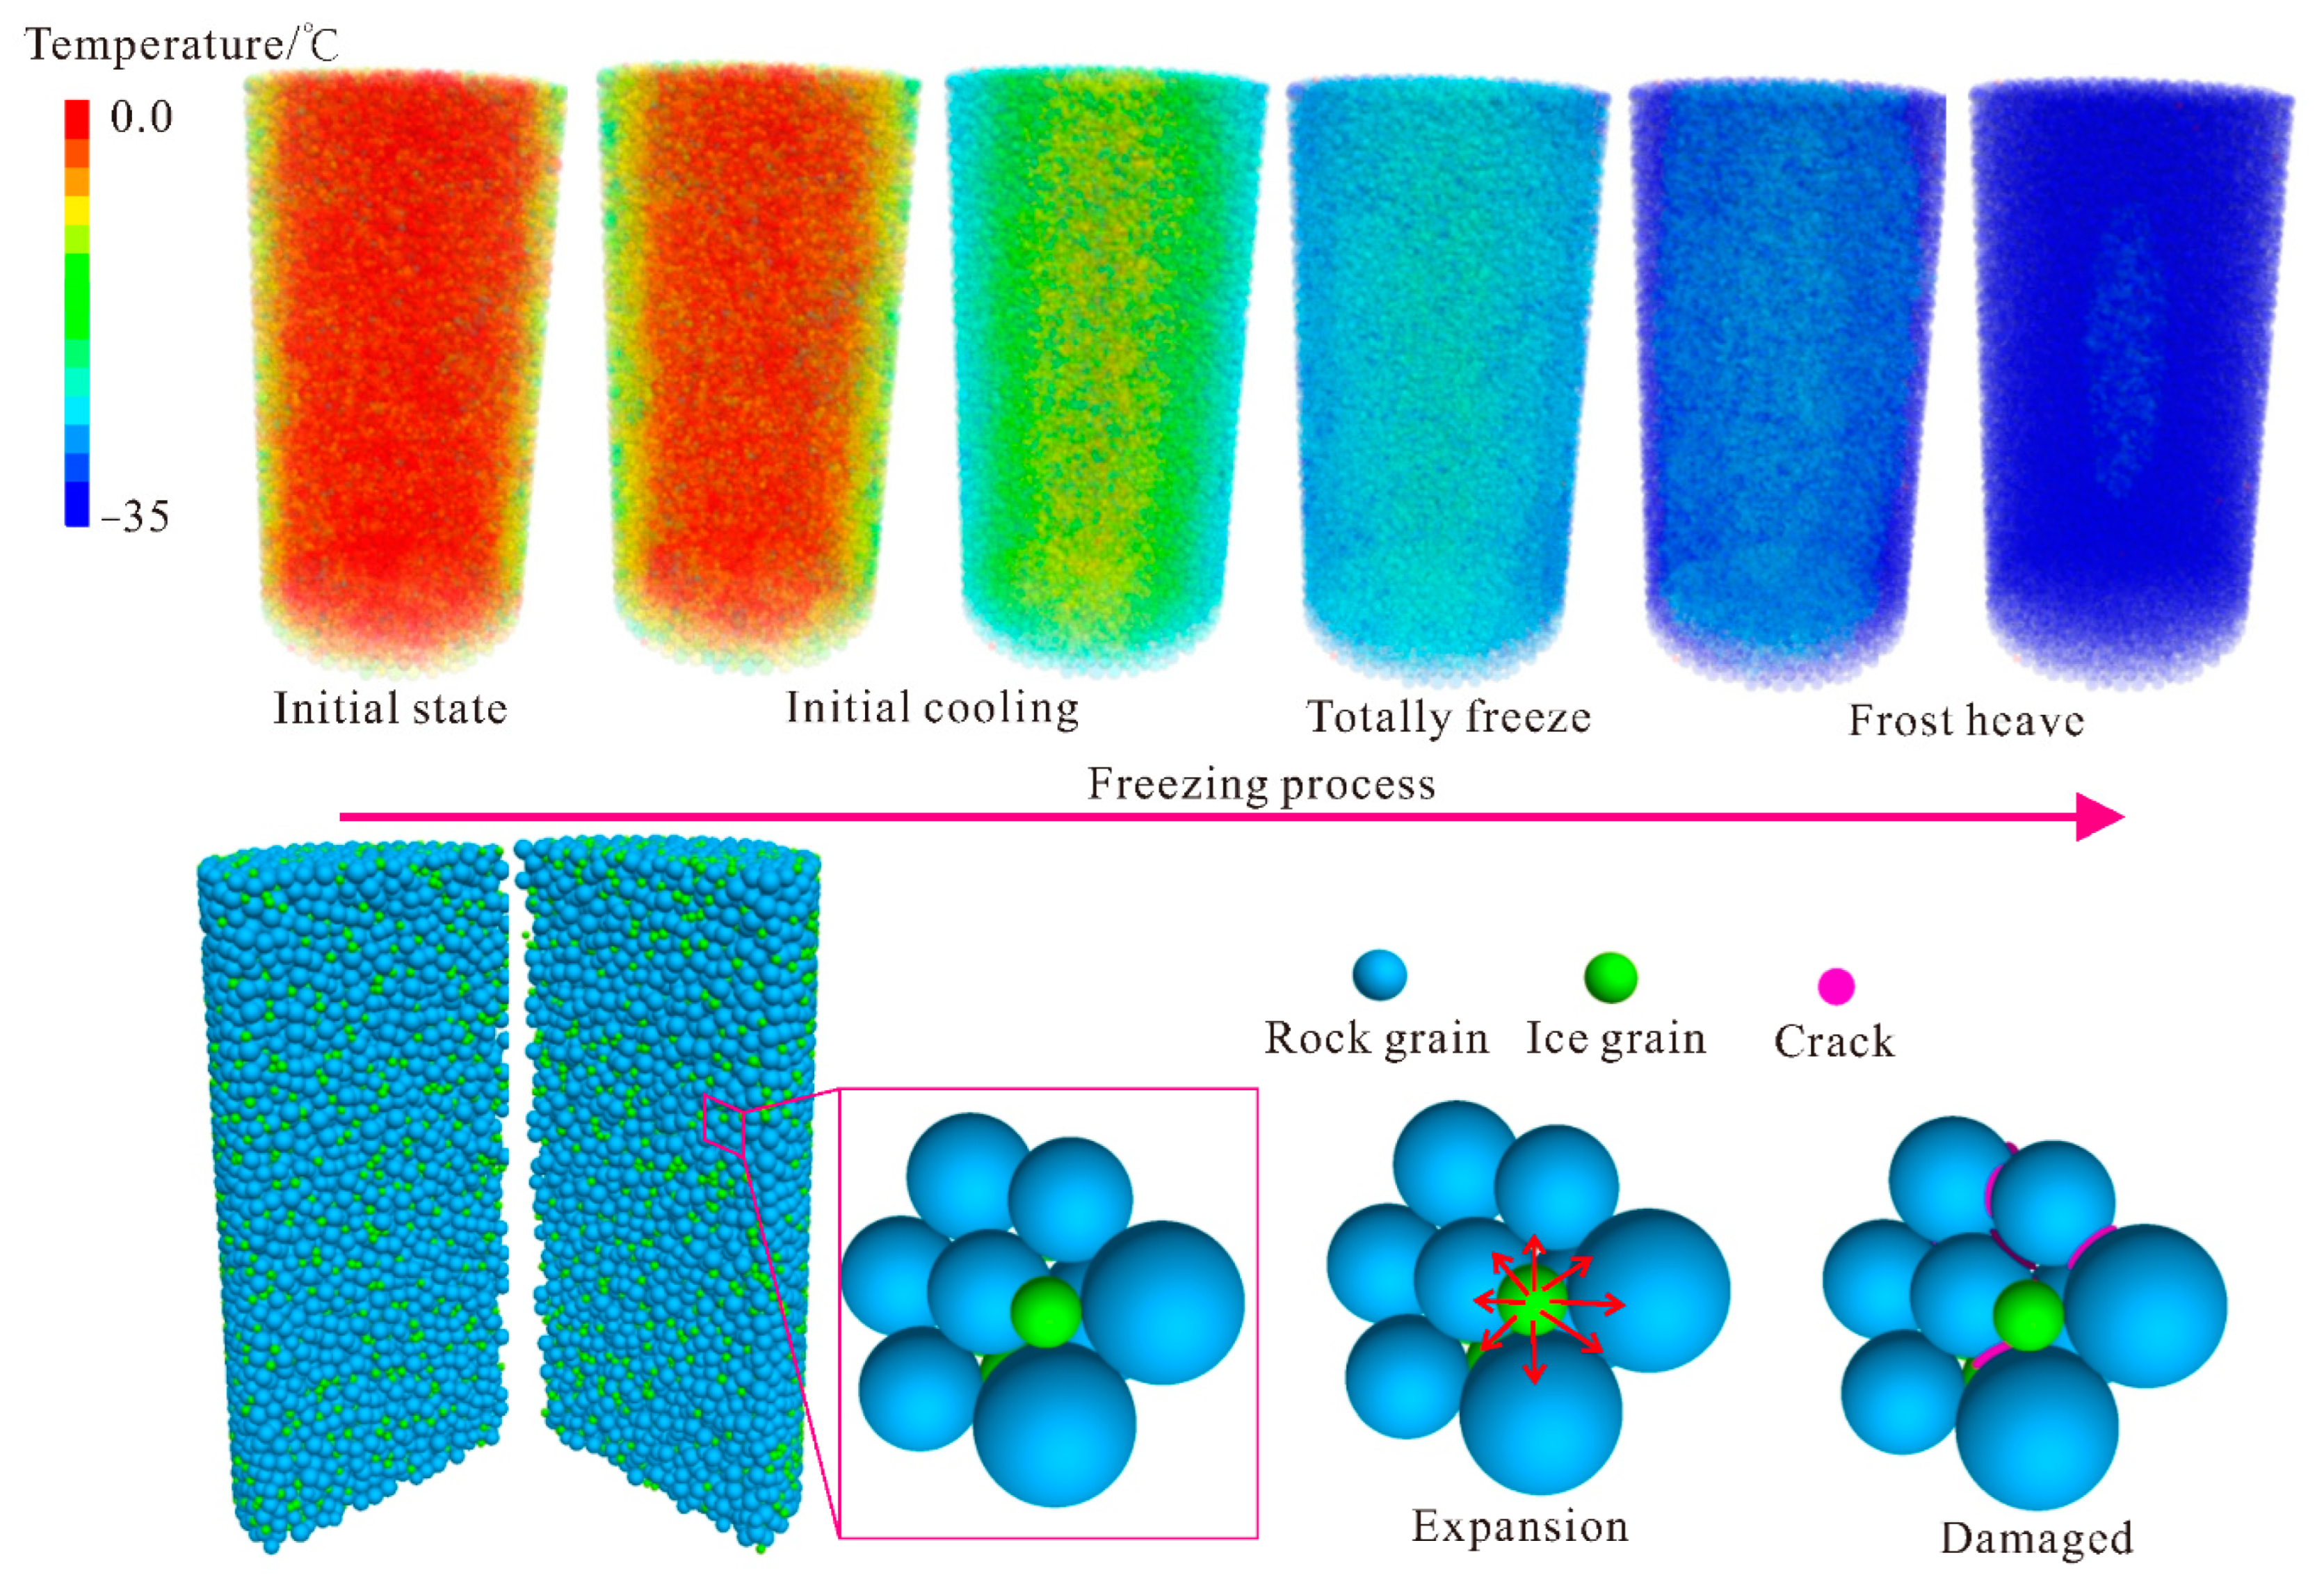
The bonds can be damaged, and the pores are able to carry liquid water and provide the initial space for freezing swelling;
(3)
The pore volume increases after damage occurs and more pore water will enter the interior of the soft rock under water-rich conditions.
The bonds in the soft rock unit need to be able to resist tensile, torsional and shear forces. The parallel bonding model (PBM) is typically used to simulate the mineral-scale bonding of rock masses in mesoscopic mechanics [57].
The minimum unit of this study is the meso-cluster unit shown in Figure 1, where pore space, pore ice/water, bonds and mineral grains are present. The coupling effects of pore ice swelling and the bond damage results in the volume expansion of the soft rock cluster unit. This coupled bonding–expansion mechanism is analyzed by Equation (1):
V = V v o i d s + V g r a i n s + V b o n d s
where V represents the cluster unit volume; V v o i d s represents the pore volume; V g r a i n s represents the skeletal particle volume and V b o n d s represents the bonds volume. The volume changes under the condition of freeze–thaw cycles. Since temperature changes have a small effect on the volume of soft rock particles, V g r a i n s is considered to be a constant value, at which point the volume change is:
V = V v o i d s + V b o n d s
During a single freeze–thaw cycle, V v o i d s is controlled by the freezing expansion of the pore water, and the temperature transfer process of the pore ice expansion process follows the thermodynamic law shown in Equation (3):
q i x i + q v = ρ C v T t
where q i is the heat flow vector; x i is the indicator representation of the coordinates; q v is the heat density; ρ is the density; C v is the specific heat capacity at constant volume; and T is the temperature.
The Fourier’s law for the continuum defines the relationship between the heat flux vector and the temperature gradient as Equation (4):
q i = k i j T x j
where k i j is the thermal conductivity tensor.
In this paper, the default water/ice particles are spherical particles, and the particle size of the ice particles changes as Equation (5) when the temperature is changing:
R = α R T
where α is the coefficient of freezing volume expansion. When the temperature is above 0°, pore ice exists in liquid form. When the temperature is below 0°, pore ice is produced, and volume expansion occurs and compresses the surrounding particles. Cracking occurs when the contact force exceeds the ultimate load-bearing capacity of the bond. When the temperature returns above 0° again, the ice particles melt into water and reduce in volume. This process involves a mechanism for the transformation of pore water and pore ice. Anderson et al. [58] have obtained an empirical formula for the freeze–thaw process in rocks by measuring the water content. The pore water content in the non-freezing state can be calculated by the following Equation:
w = 1 [ 1 + 3 λ m ( T i T ) 1 3 ln ( 1 + e m T W 2 ) ] ( 1 e m T W )
where w is the water content in the non-frozen state; m is a constant related to the pore structure; T i is the freezing temperature, chosen as 0° in this paper. T is the temperature, and γ i w is the free energy at the water-ice interface. ρ i is the ice density and ρ w is the water density. λ and W are determined by Equations (7) and (8):
λ = ( A 6 π ρ w l ) 1 3
W = 2 γ i w T m ρ i
where A is the Hamaker constant. The selection of these parameters is based on the results of previous research [51,59]:
w = 1 [ 1 + 0.139 ( 1 T ) 1 3 ln ( 1 + e 0.268 T 2 ) ] ( 1 e 0.268 T )
V v o i d s = V w a t e r = V 0 + V 0 ( 1 w ) ( ρ w ρ i 1 )
where V w a t e r is the volume change of pore water at different temperatures and V 0 is the volume of ice particles at 0 °C. The expansion coefficient α in Equation (5) is determined by Equation (11):
α = ( 1 + ( 1 w u ) ( ρ w ρ i 1 ) ) 1 3
Soft rocks in water-rich environments increase in water content with the accumulation of damage during continuous F-T cycling, which has been consistently identified in previous studies. In the mesoscopic cluster unit of this paper, the damage is caused by bond damage. Assuming that the ratio of irrecoverable to total deformation is r, Equation (12) can be used to describe the pattern of pore volume change due to bond damage during the i-th freeze–thaw cycle:
V v o i d s = V b o n d s = r ( V m a x i V i )
where V m a x i represents the maximum volume of the freezing process determined by Equation (10); V i is the initial volume before the start of the i-th freeze–thaw cycle; and the initial volume before the start of the i + 1-th freeze–thaw cycle is:
V i + 1 = V i + V v o i d s
According to Equation (7), the water–ice conversion law can be obtained during the temperature change (see Figure 2). Water is completely liquid at temperatures around 0°, with an initial volume of V0. As the temperature decreases, the content of liquid water shows a sharp decline, with the content reducing to around 10% of the initial value at −10 °C, and gradually approaching the limit at around −20 °C. The water–ice conversion process is accompanied by volume expansion, which approaches a maximum at around −10 °C and is about 1.08 times the initial value.
With the continuous freeze–thaw damage erosion, the internal damage of the rock develops, the pore space gradually increases and the initial liquid water content shows a gradual increase during each cycle. According to the Equations (7)–(10), we can obtain the pore ice volume increasing law with the temperature cycle (see Figure 3).

2.2. Soft Rock Strength Deterioration Model Based on Bonding–Expansion Coupling Mechanism

Based on the coupled bonding–expansion analysis in mesoscopic scale, this paper will further propose a strength deterioration model for the freeze–thaw conditions and consider the multiscale damage correlations.
During the expansion and contraction process, the meso-cluster units of soft rocks undergo the volume changes expressed in Equation (2), and the mechanical changes during volume expansion are expressed by the amount of displacement overlap of the particles:
F n = k n A U n
F s = k s A U s
where F n and F s represent the normal and tangential forces on the mineral particle surface, respectively; U n and U s represent the normal and tangential displacements, respectively; and k n and k s represent the normal and tangential stiffnesses, respectively. Combining Equations (5) and (11) yields U :
U = ( 1 + ( 1 w u ) ( ρ w ρ i 1 ) ) 1 3 R T
The freeze–thaw damage may occur in the bonded portion of the meso-cluster units of soft rocks under the action of swelling and shrinkage. Bond damage is determined by the bond strength and the expansion forces, and the normal and tangential stresses in the soft rock mineral grains are calculated by Equations (17) and (18):
σ = F n A
τ = F s A
In this paper, the parallel bond model (PBM) [57,60,61] is chosen as the bond between minerals, and the strength pattern of the PBM when subjected to freezing and swelling forces conforms to the strength curve shown in Figure 4. Bond damage occurs when σ σ c or τ τ c , with tensile damage occurring in the former and shear damage in the latter. The analysis of bond damage types later in this paper will also be based on the damage types described in this section. Under the bonding–expansion coupling mechanism, each bond damage results in a change in pore volume of r V b o n d s according to Equation (12).
The damage accumulation of meso-units in soft rock will affect the macroscopic strength of rock, and the damage is an irreversible thermodynamic dissipation process. The strength damage history of soft rock based on the bonding–expansion coupling mechanism can be represented by the irreversible volume change in Equation (13): V i + 1 = V i + V v o i d s .
From the thermodynamic Equation, the thermodynamic potential function of soft rock can be represented by the Helmholtz free energy, ψ , which is determined by the elastic strain and the internal variables v k ( k = 1 , 2 , 3 ,   n ) :
ψ = ψ ( ε e , v k )
We can use the damage variable D to describe the degree of damage, and use the damage history scalar β to describe the damage history during the freeze–thaw cycle, so the internal variable v k herein is:
v k = {   D , β }
The Helmholtz free energy ψ per unit volume of soft rock can be expressed as:
ρ ψ ( ε e ,   D , β ) = ρ ψ e ( ε e , D ) + ρ ψ d ( β )
During freeze–thaw cycles, the bond damage to mineral units due to expansion and contraction is counted as di, di (i = 1…n) denoting the number of damage histories. The damage history β can be expressed by the coupled bonding–expansion mechanism as:
β = f ( i = 1 n d i r Δ V b o n d s )
D is determined by the damage history β . After a certain number of freeze–thaw cycles, the macroscopic mechanical properties of the soft rock deteriorate, and the stress state when the soft rock is loaded is expressed by σ i j . The effective stress σ ˜ i j after damage is expressed as:
σ ˜ i j = σ i j 1 D
The degradation of the peak strength is also determined by Equation (23). The stiffness matrix in the elastic phase is transformed from the initial stiffness matrix C to the effective stiffness matrix C ˜ :
C ˜ 1 = 1 ( 1 D ) 2 C 1
C ˜ 1 = 1 ( 1 D ) 2 E 0 [ 1 v 0 v 0 0 0 0 v 0 1 v 0 0 0 0 v 0 v 0 1 0 0 0 0 0 0 2 ( 1 + v 0 ) 0 0 0 0 0 0 2 ( 1 + v 0 ) 0 0 0 0 0 0 2 ( 1 + v 0 ) ]
where E 0 and v 0 are the initial modulus of elasticity and Poisson’s ratio.

2.3. Discrete Element Application of the F-T Strength Deterioration Model for Soft Rock

The discrete element method is a simulation tool based on the mineral particle scale and can respond well to the meso-scale damage processes in soft rocks. Therefore, this paper adopts the common commercial software PFC for the study of freeze–thaw cycles in soft rocks. Based on the soft rock strength-damage model proposed above, this paper uses the discrete element method and Fish code to complete the modelling for numerical calculations. Based on the meso-structure characteristics of soft rock, the macroscopic model of soft rock shown in Figure 1 is established. The model consists of soft rock mineral particles, water particles and the bond between the particles. The water particles are transformed into ice particles at low temperatures; the bonding includes mineral–mineral, mineral–ice and ice–ice.
The modelling process begins with the generation of a base soft rock specimen with a certain porosity, followed by the addition of a bond between the minerals, which can be calibrated by indoor test subjects. The pore water particles are added between the pores of the minerals, where the cementation strength between the water–rock contact is taken to be greater, so that the freeze–thaw damage is calculated to occur at the mineral bond.
The specific macroscopic modelling starts with the establishment of macroscopic parameters based on the results of the indoor tests; this step establishes the more important macroscopic dimensions, uniaxial strength and Young’s modulus [62]. The simulation method proposed in this paper needs to be validated by laboratory tests, so here the parameters of the complete rock sample are calibrated based on previously published test results [63]. When selecting the size and shape of the modelled particles, the shape of the particles during the simulations in this paper defaults to spherical particles. The smaller the particle size, the higher the accuracy of the simulation, but the particle size cannot be infinitely small due to computational efficiency constraints; it has been concluded that the size of the particles in the discrete element simulation process has less impact on the accuracy when L/r > 68 [64] or the number of particles in the three-dimensional case is greater than 15,000 [65]. In this paper, the test procedure simulates the indoor rock mechanics test, and the model size is chosen to be 50 mm× 100 mm, and the number of particles in the three-dimensional model is 19,015, which meets the accuracy requirement in the three-dimensional case. Through the ‘trial and error’ method of continuous debugging, the final results were obtained to be able to restore the macroscopic strength and elastic modulus, and the specific calibration results are presented in Section 3. According to the mesoscopic expansion and contraction law mentioned in Section 2.1, this paper controls the volume expansion of ice particles at low temperatures according to the law shown in Figure 1 through the Fish code. The traversal operation of particle size expansion is performed through the ice particle pointer during each cycle, and a larger number of calculation steps (10,000) is chosen for each freeze–thaw cycle. After each cycle new meso-damage is created and the pore volume within the soft rock specimen increases at the next cycle, thus causing a deteriorating process of damage deterioration.
Conventional indoor tests are less likely to consider the freeze–thaw cycling process in cracked rock samples, while the discrete element method can provide an ideal test environment. As initial cracking is often present in natural rock masses, it is necessary to consider it in the study of freeze–thaw cycling. In this paper, initial joints are produced on the basis of an initial rock sample, which is a 0° horizontal penetration joint with a thickness of 2 mm.
On the fabricated rock samples, freeze–thaw cycling tests were carried out in this paper. The quantitative analytical verification of the strength-curve deterioration during freeze–thaw on intact rock samples and the qualitative verification of macroscopic damage on cracked soft rock will be carried out in the next section.

3. Results and Discussion

3.1. Parameters Determination of Soft Rock F-T Cycle Strength Deterioration Model

Based on the freeze–thaw deterioration model for soft rock proposed in this paper, discrete element numerical tests of the freeze–thaw and loading processes were conducted. The experimental validation process refers to the experimental results published by Wang [63]. The test object is muddy dolomite commonly found in Guizhou, China, which mainly consists of dolomite and clay minerals. Muddy dolomite with a low pore and joint content, uniform texture and similar appearance and color was selected, and the samples were cut and polished to a standard size of 50 mm × 100 mm and then screened and numbered. The number of cycles during the freeze–thaw test was set to 5, 10, 15, 20 and 25, respectively. A uniaxial compression test was conducted by an RMT-301 loading device after the end of freeze–thaw cycle, and its stress–strain curve and strength deterioration information were obtained. Based on this calibration, the strength deterioration model’s meso-parameters shown in Table 1 were obtained.

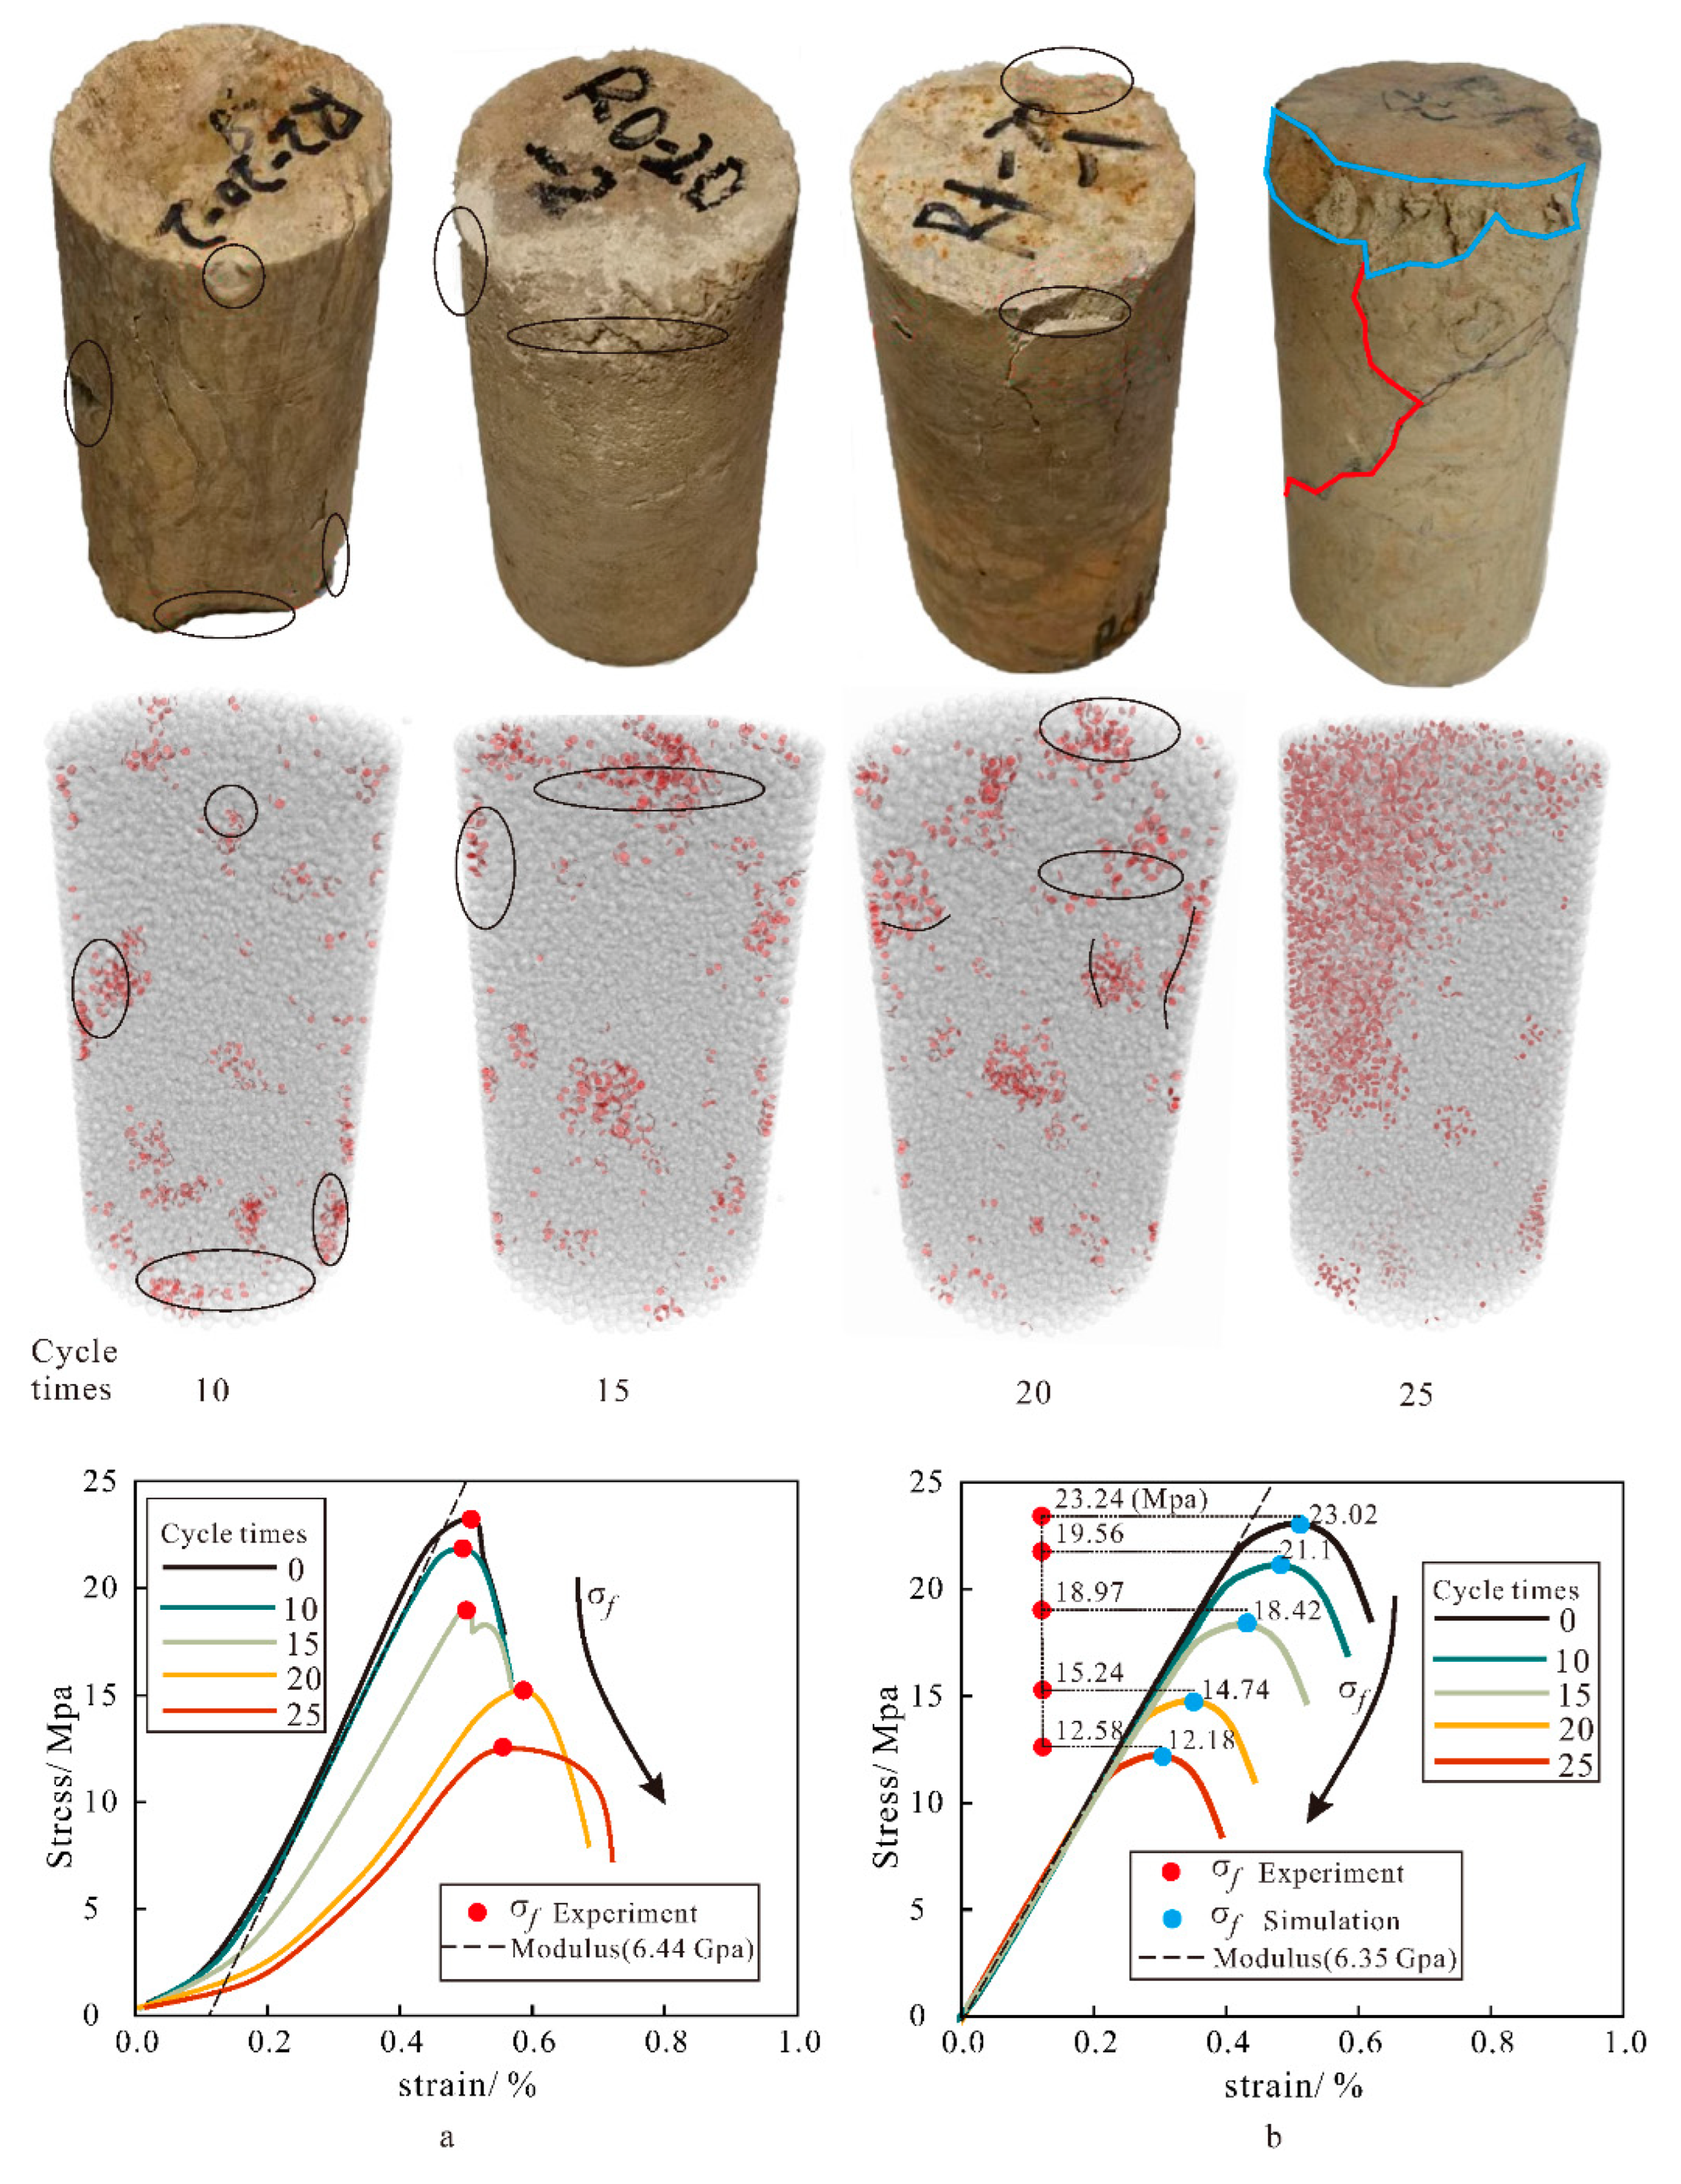
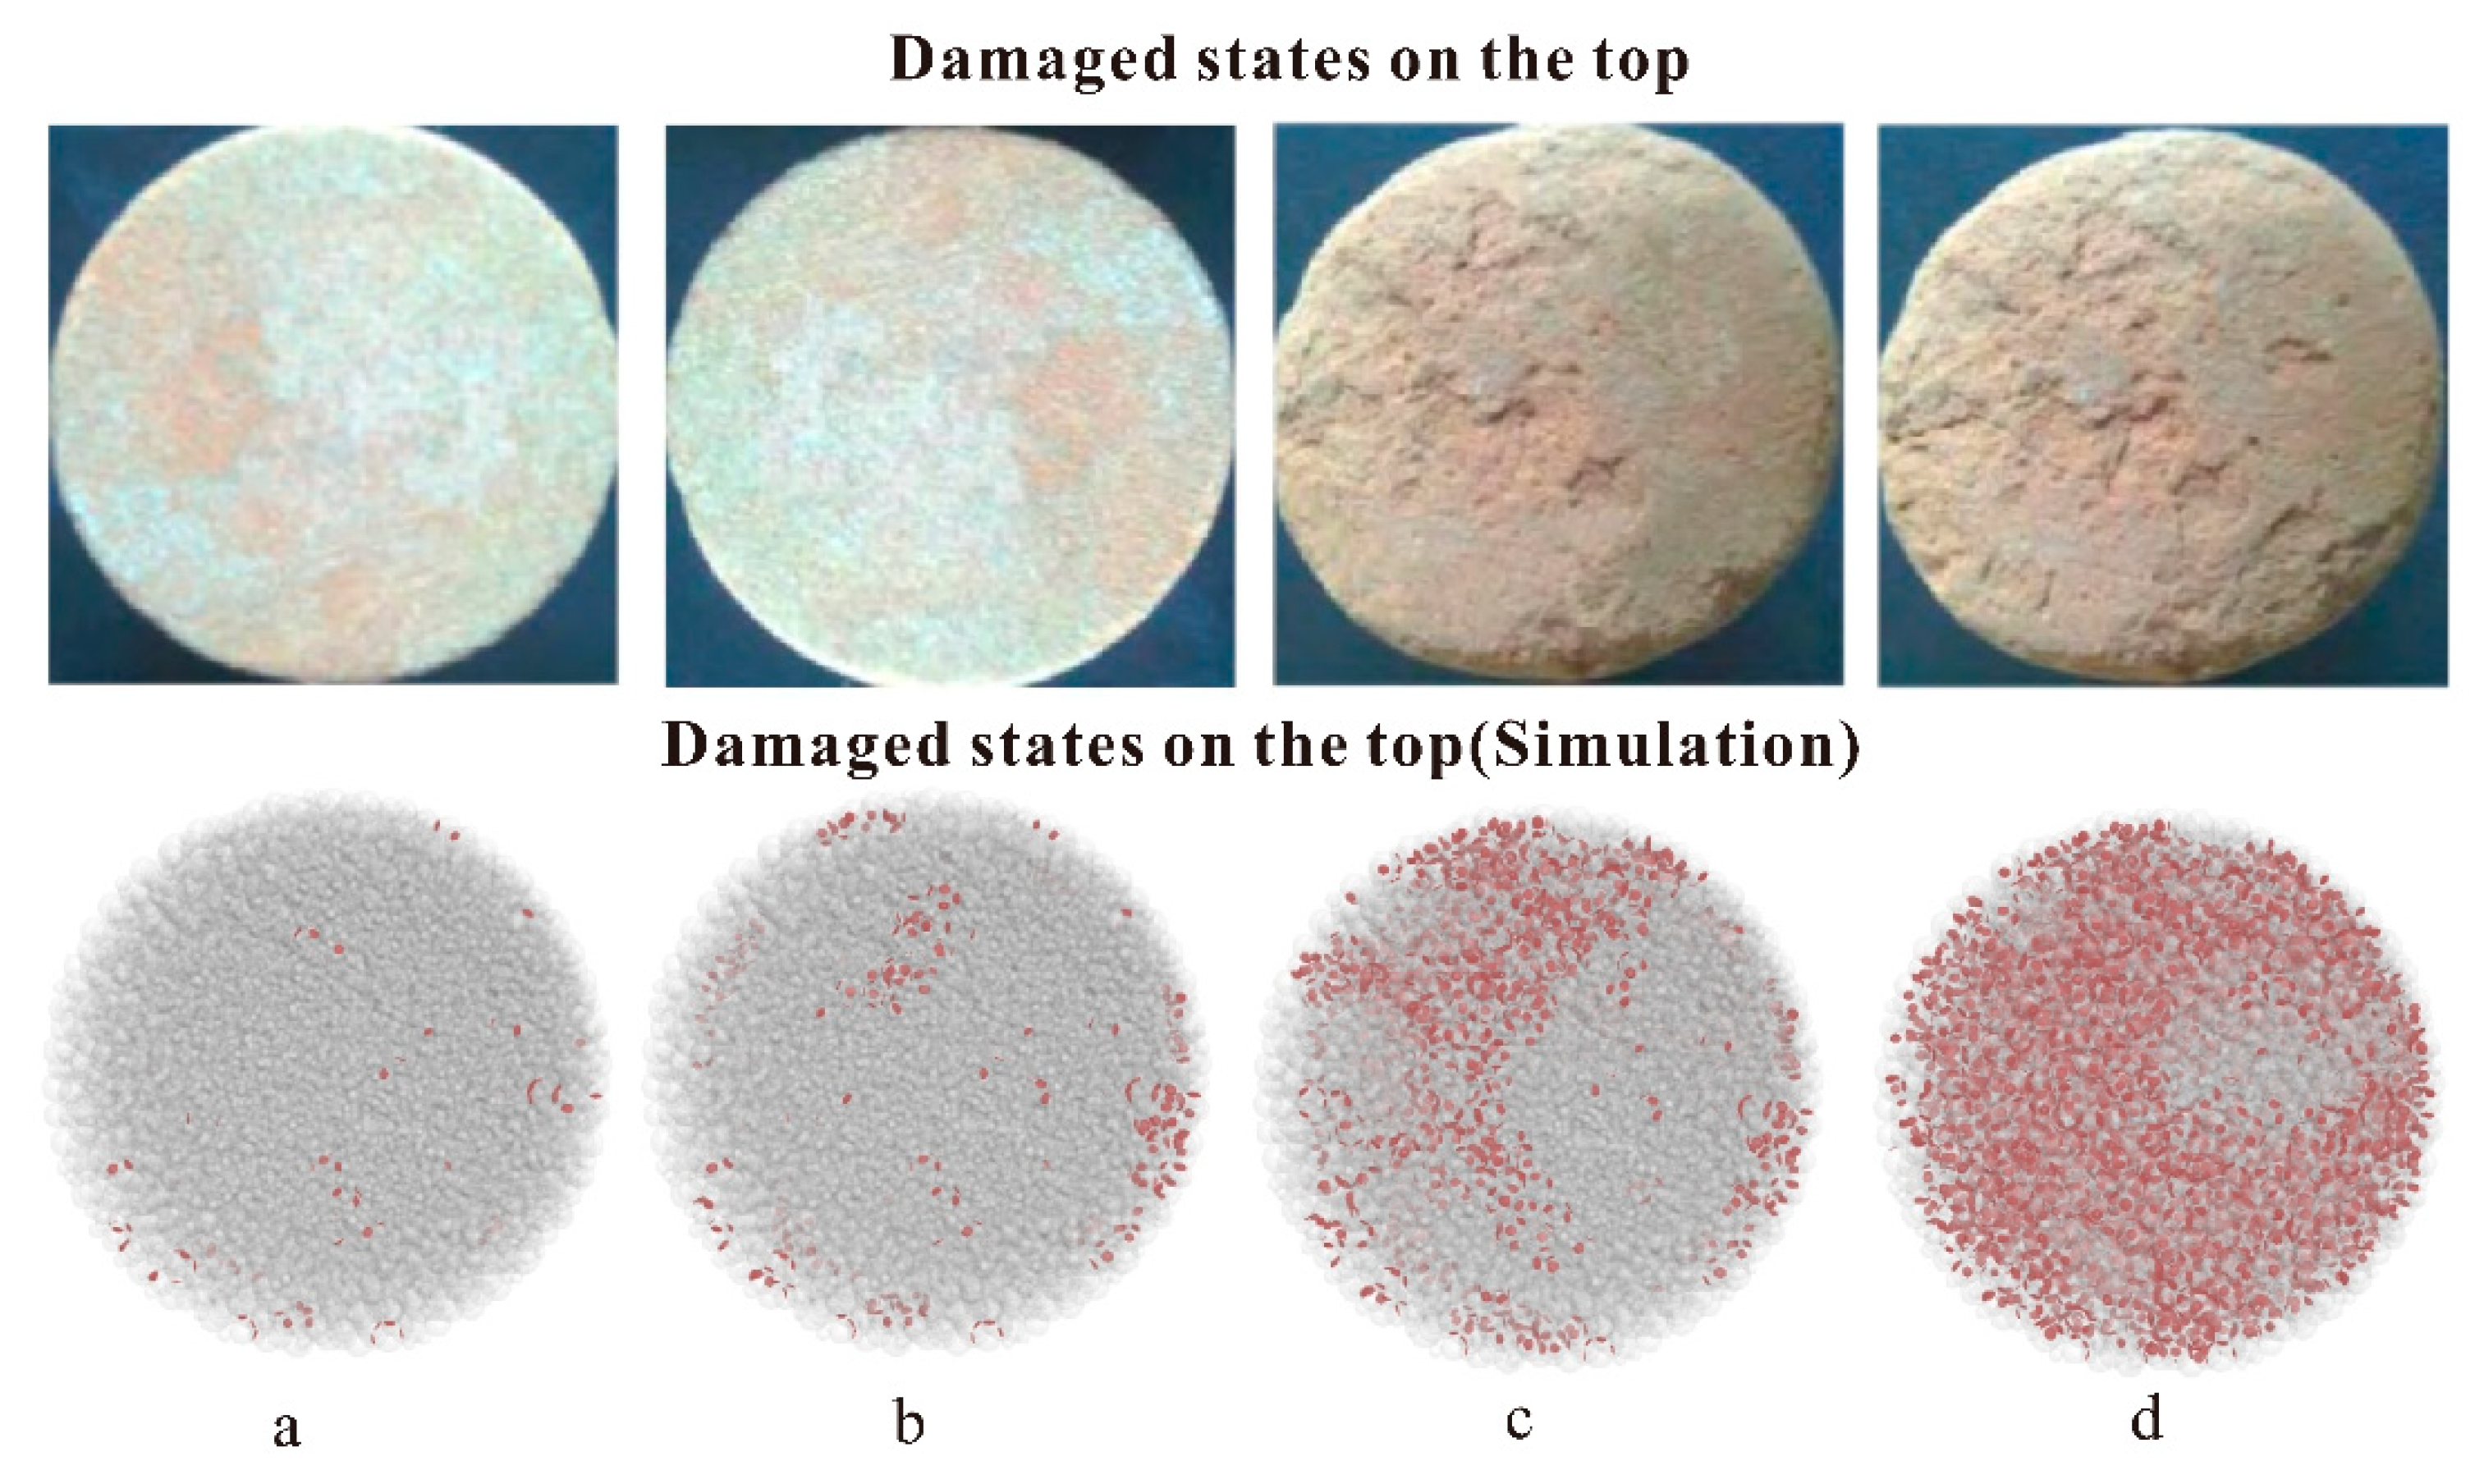
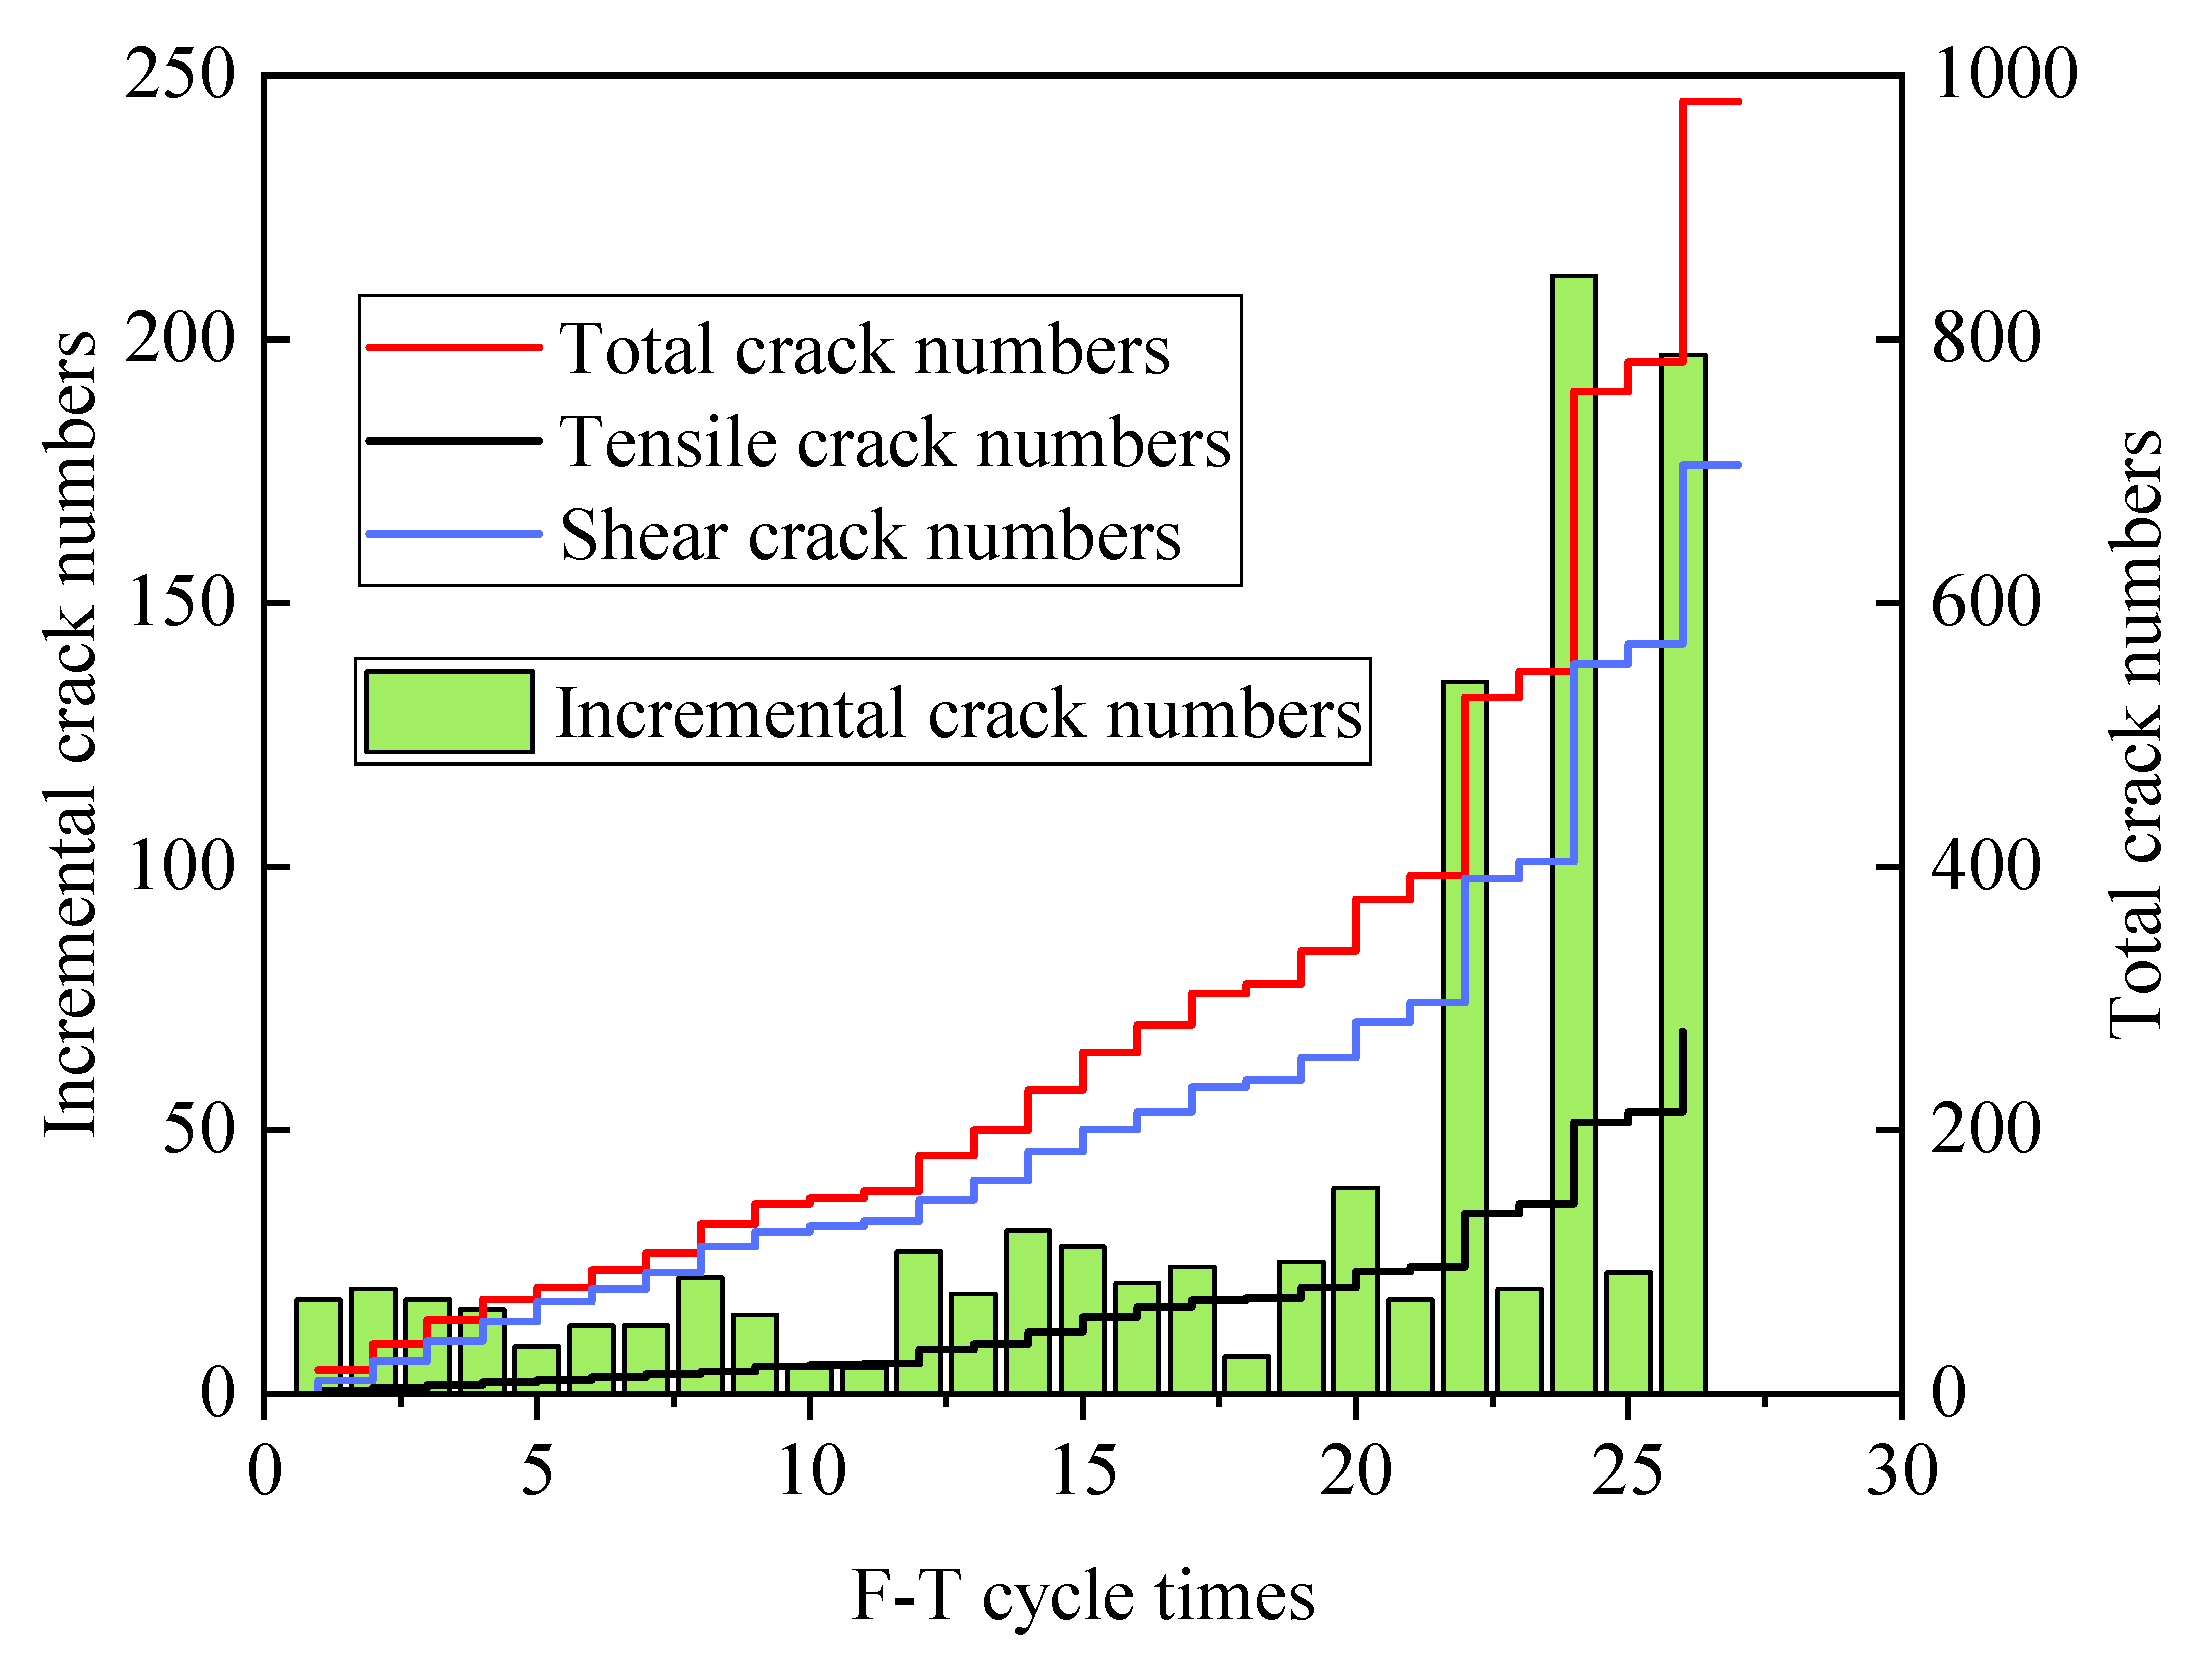
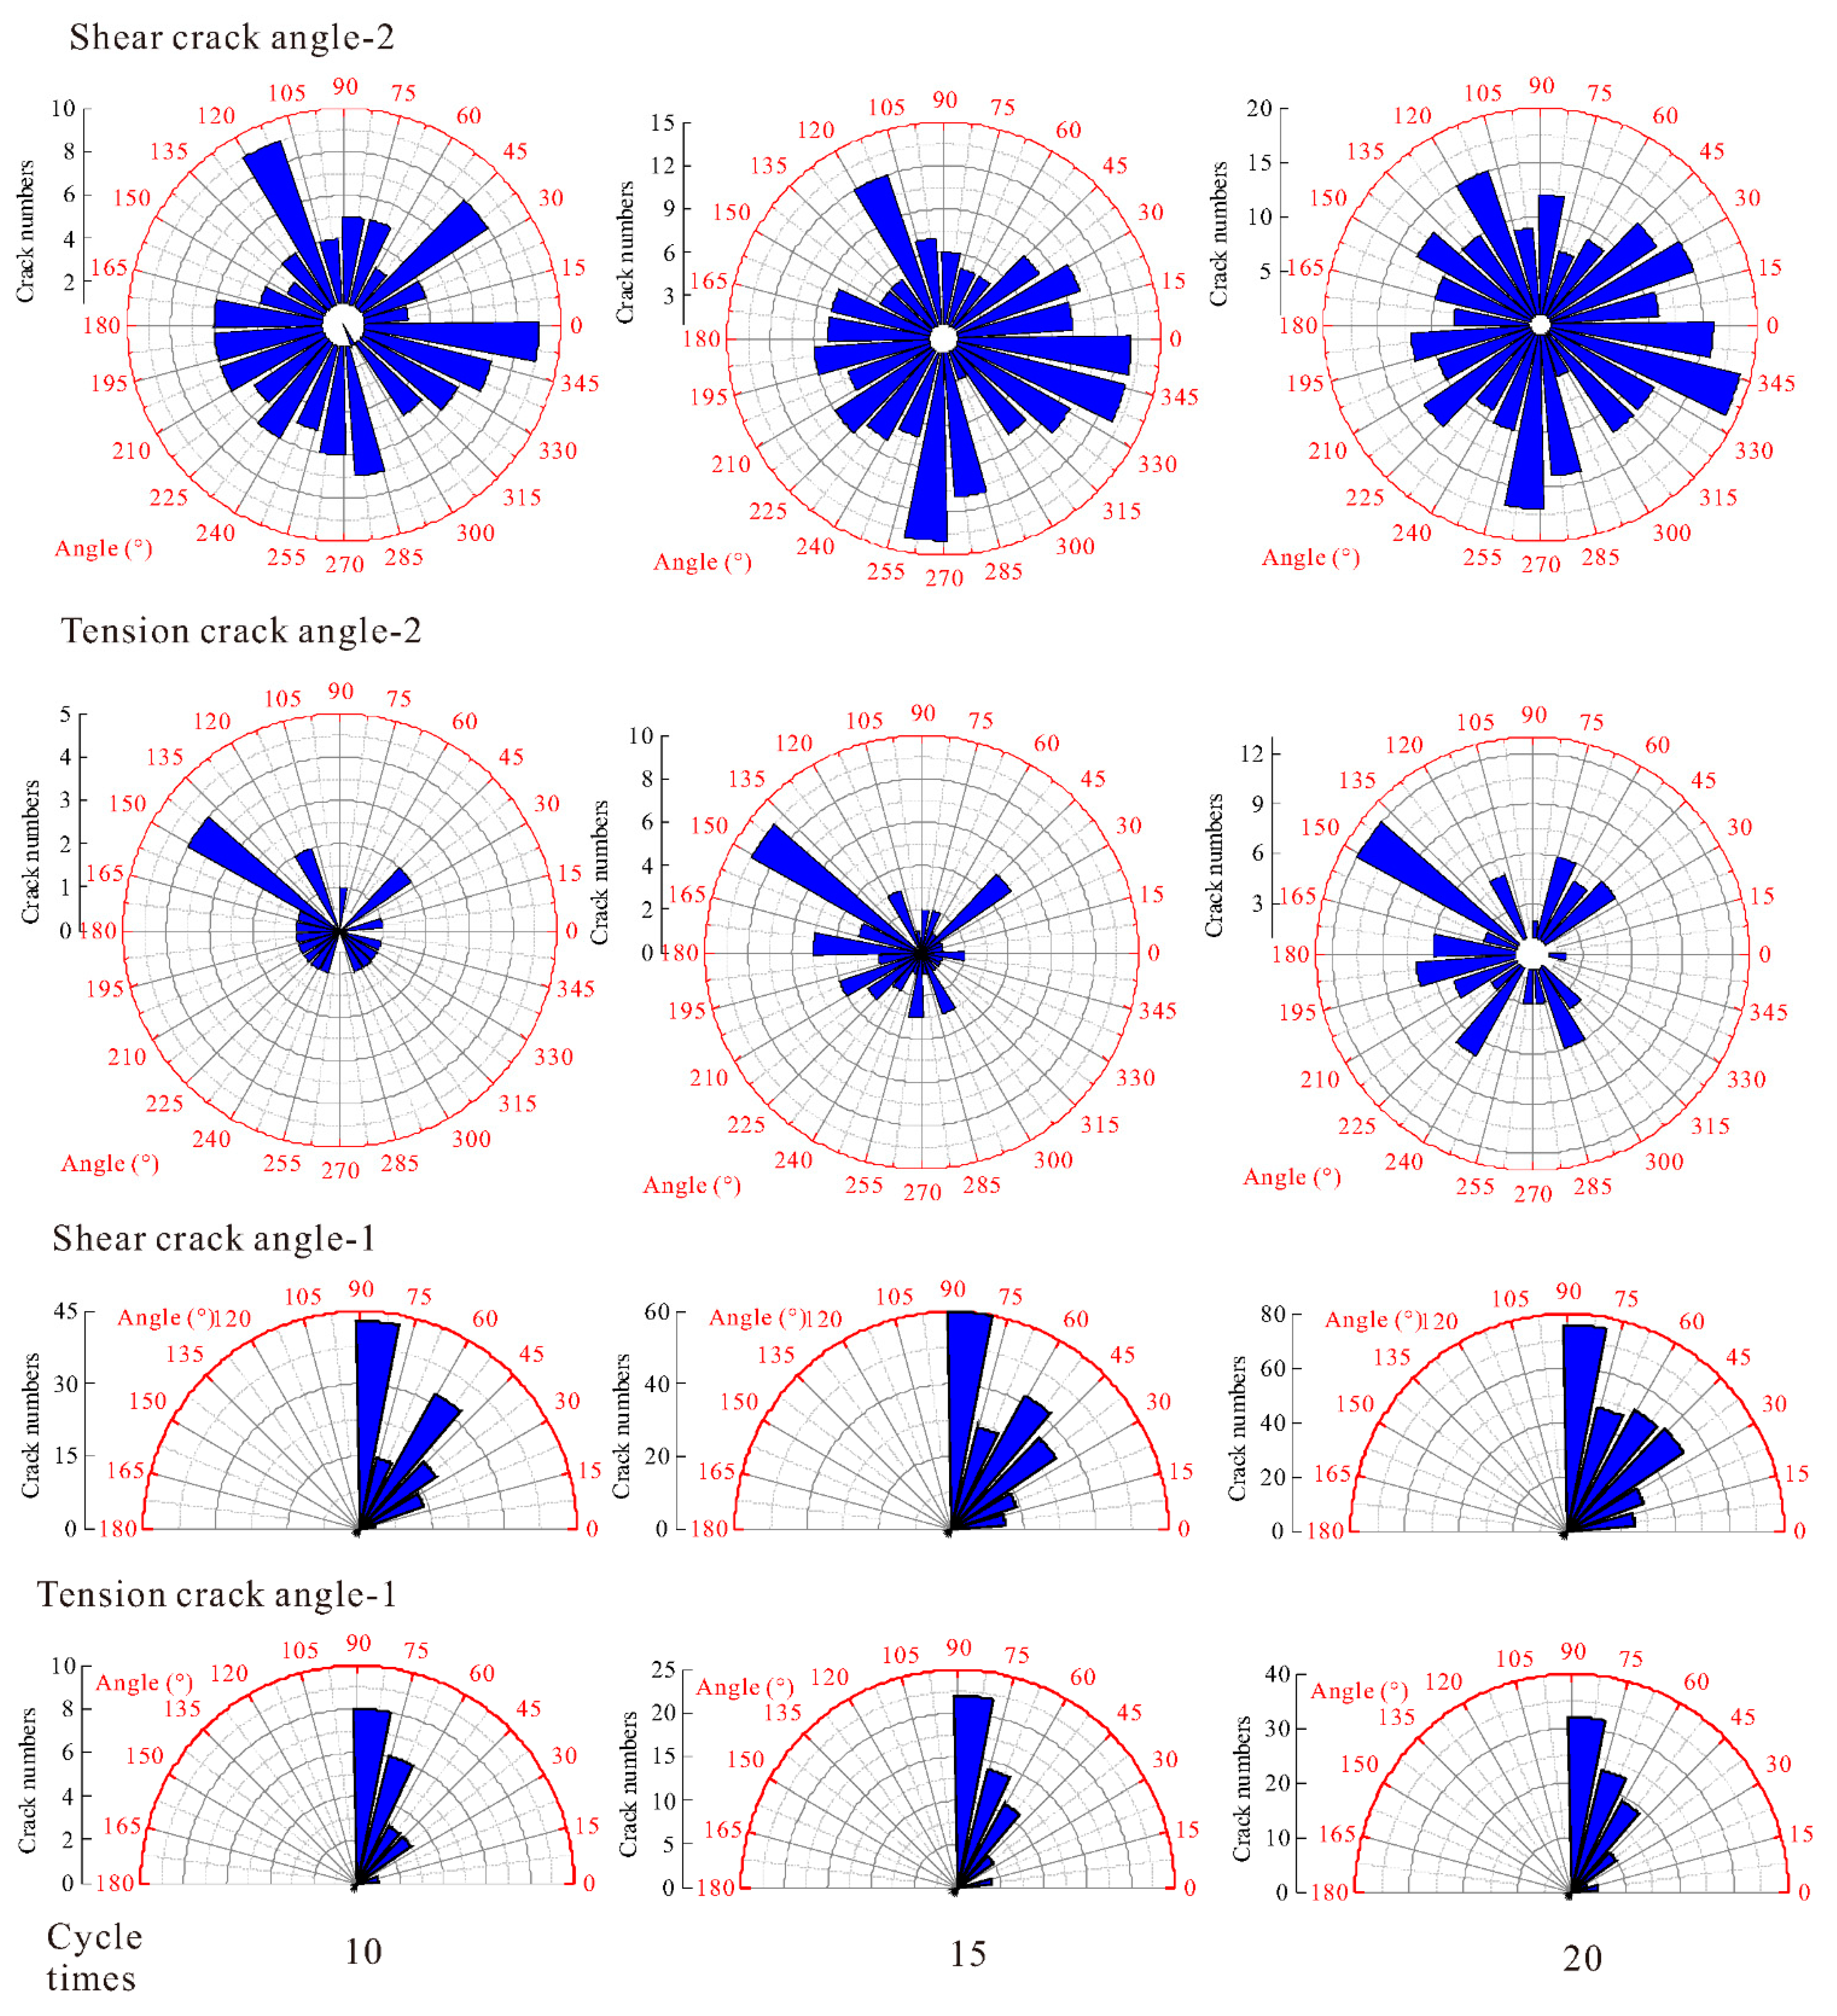
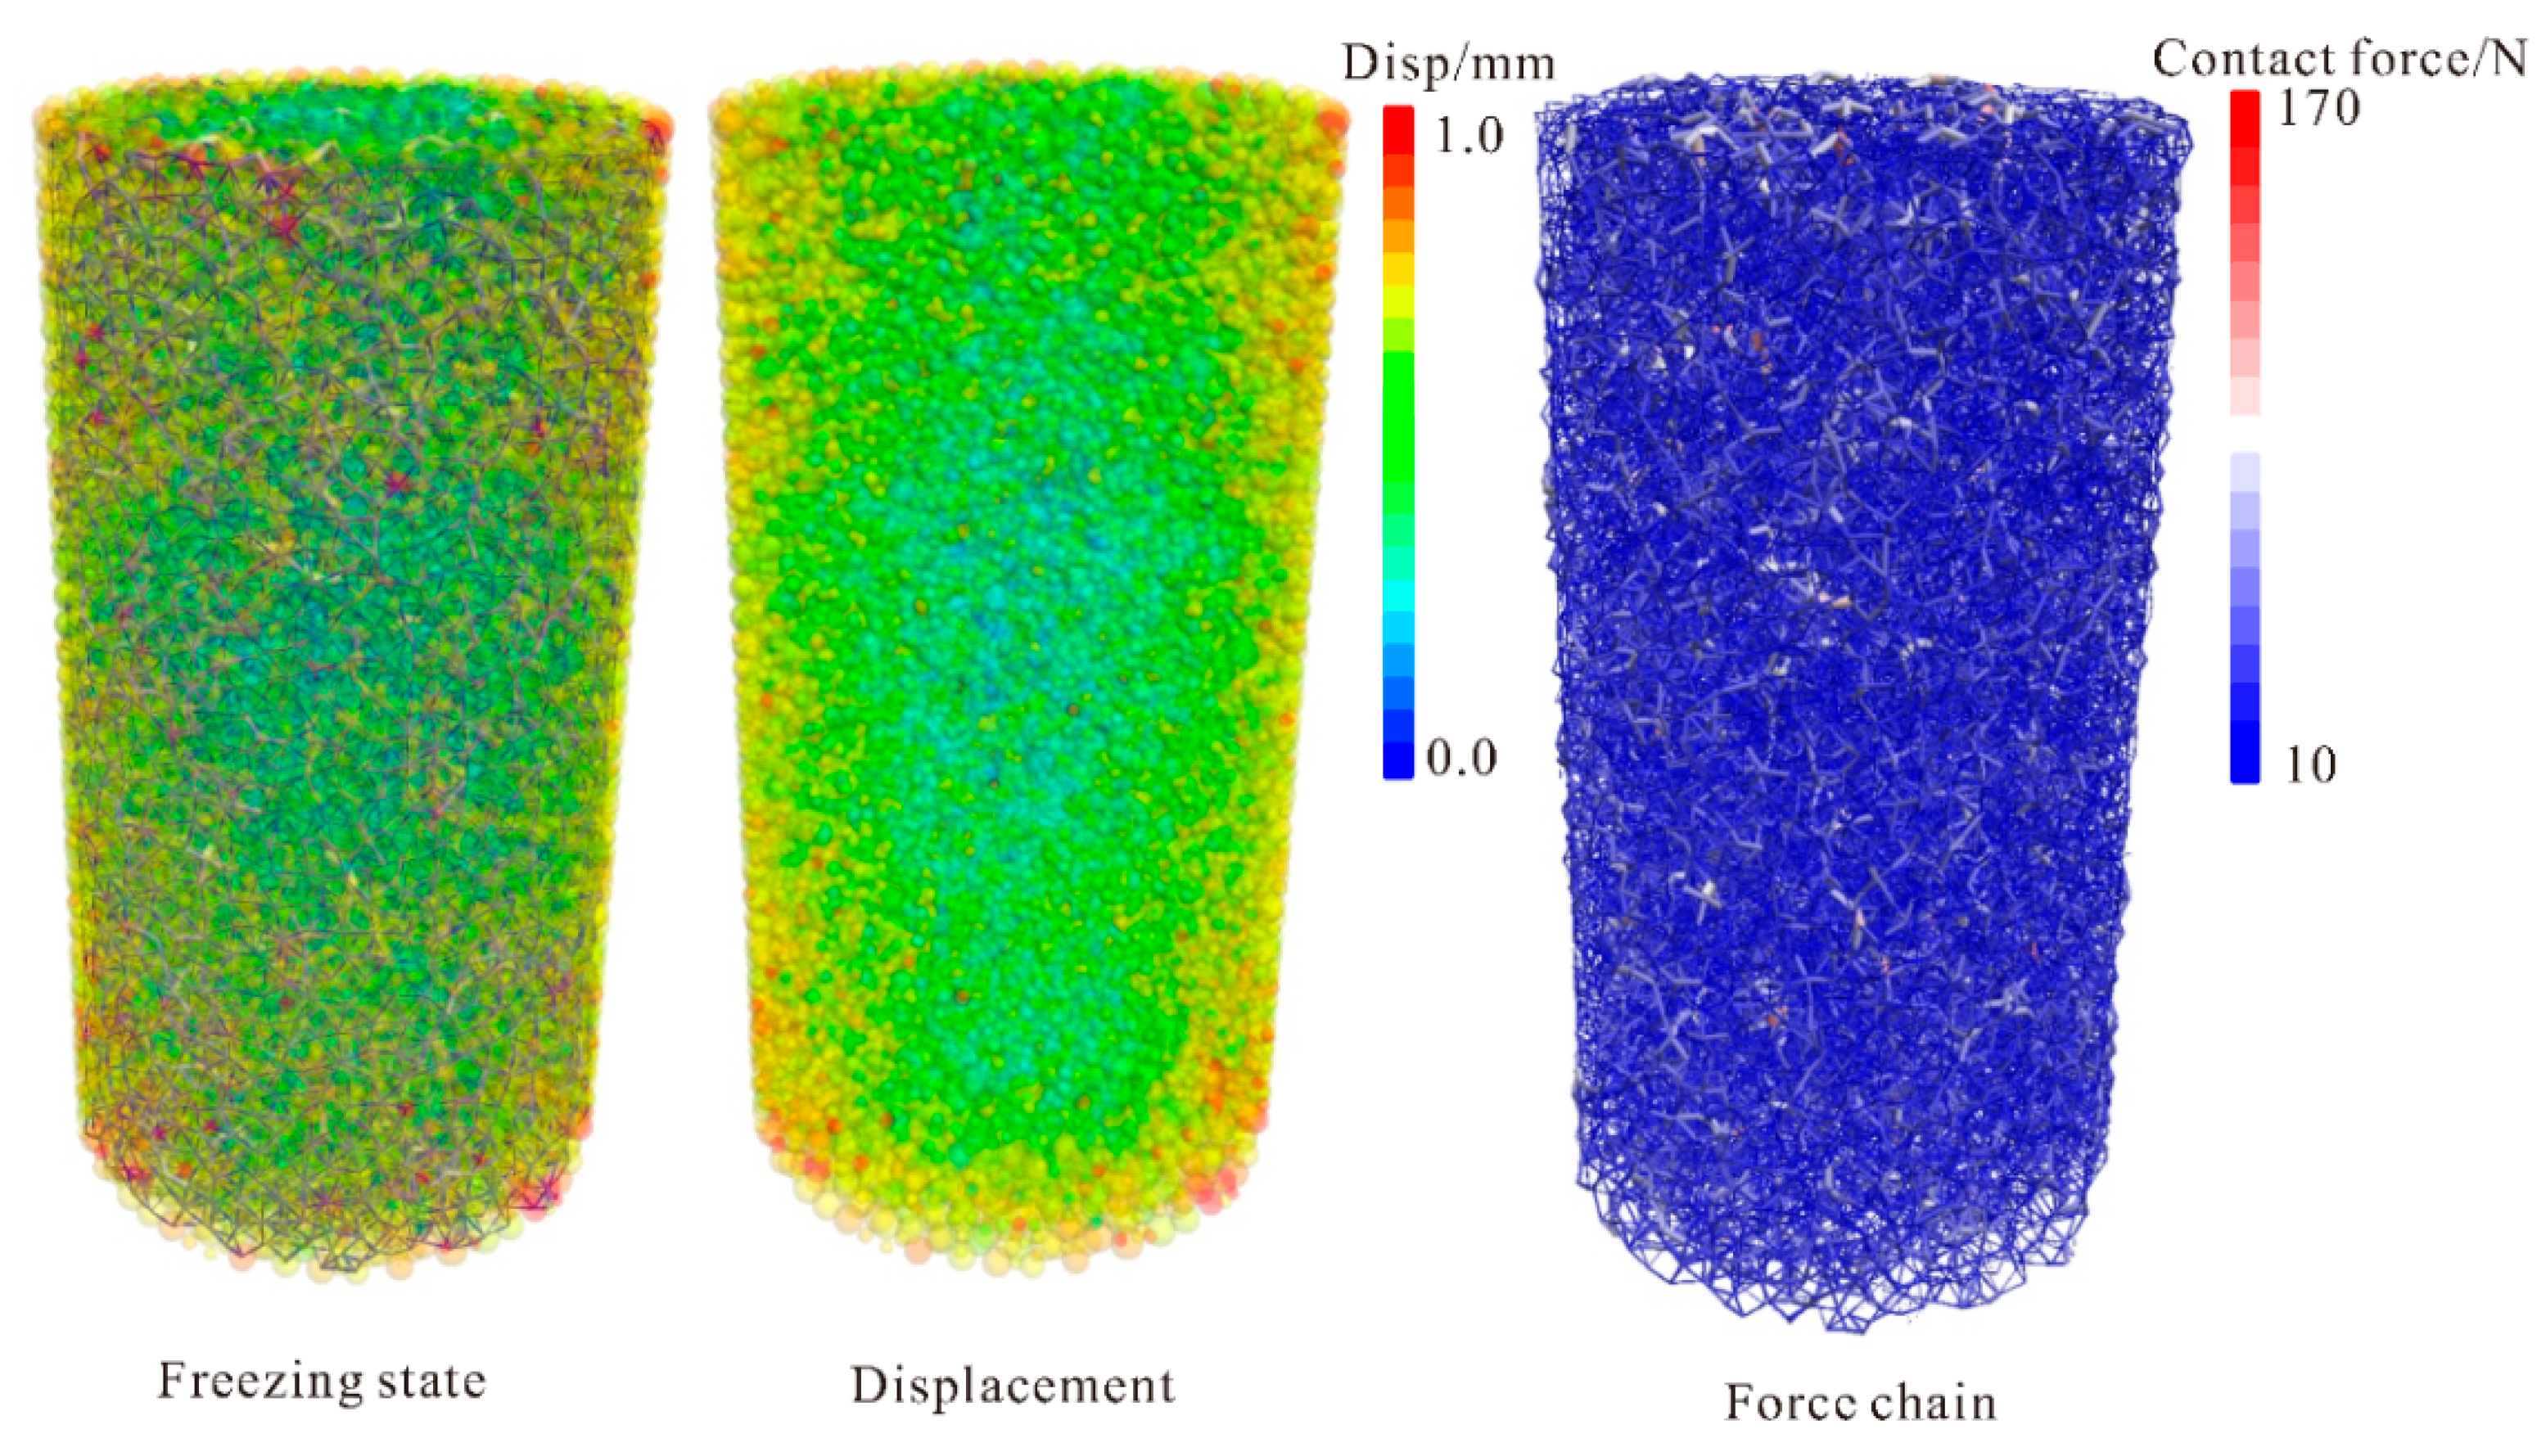
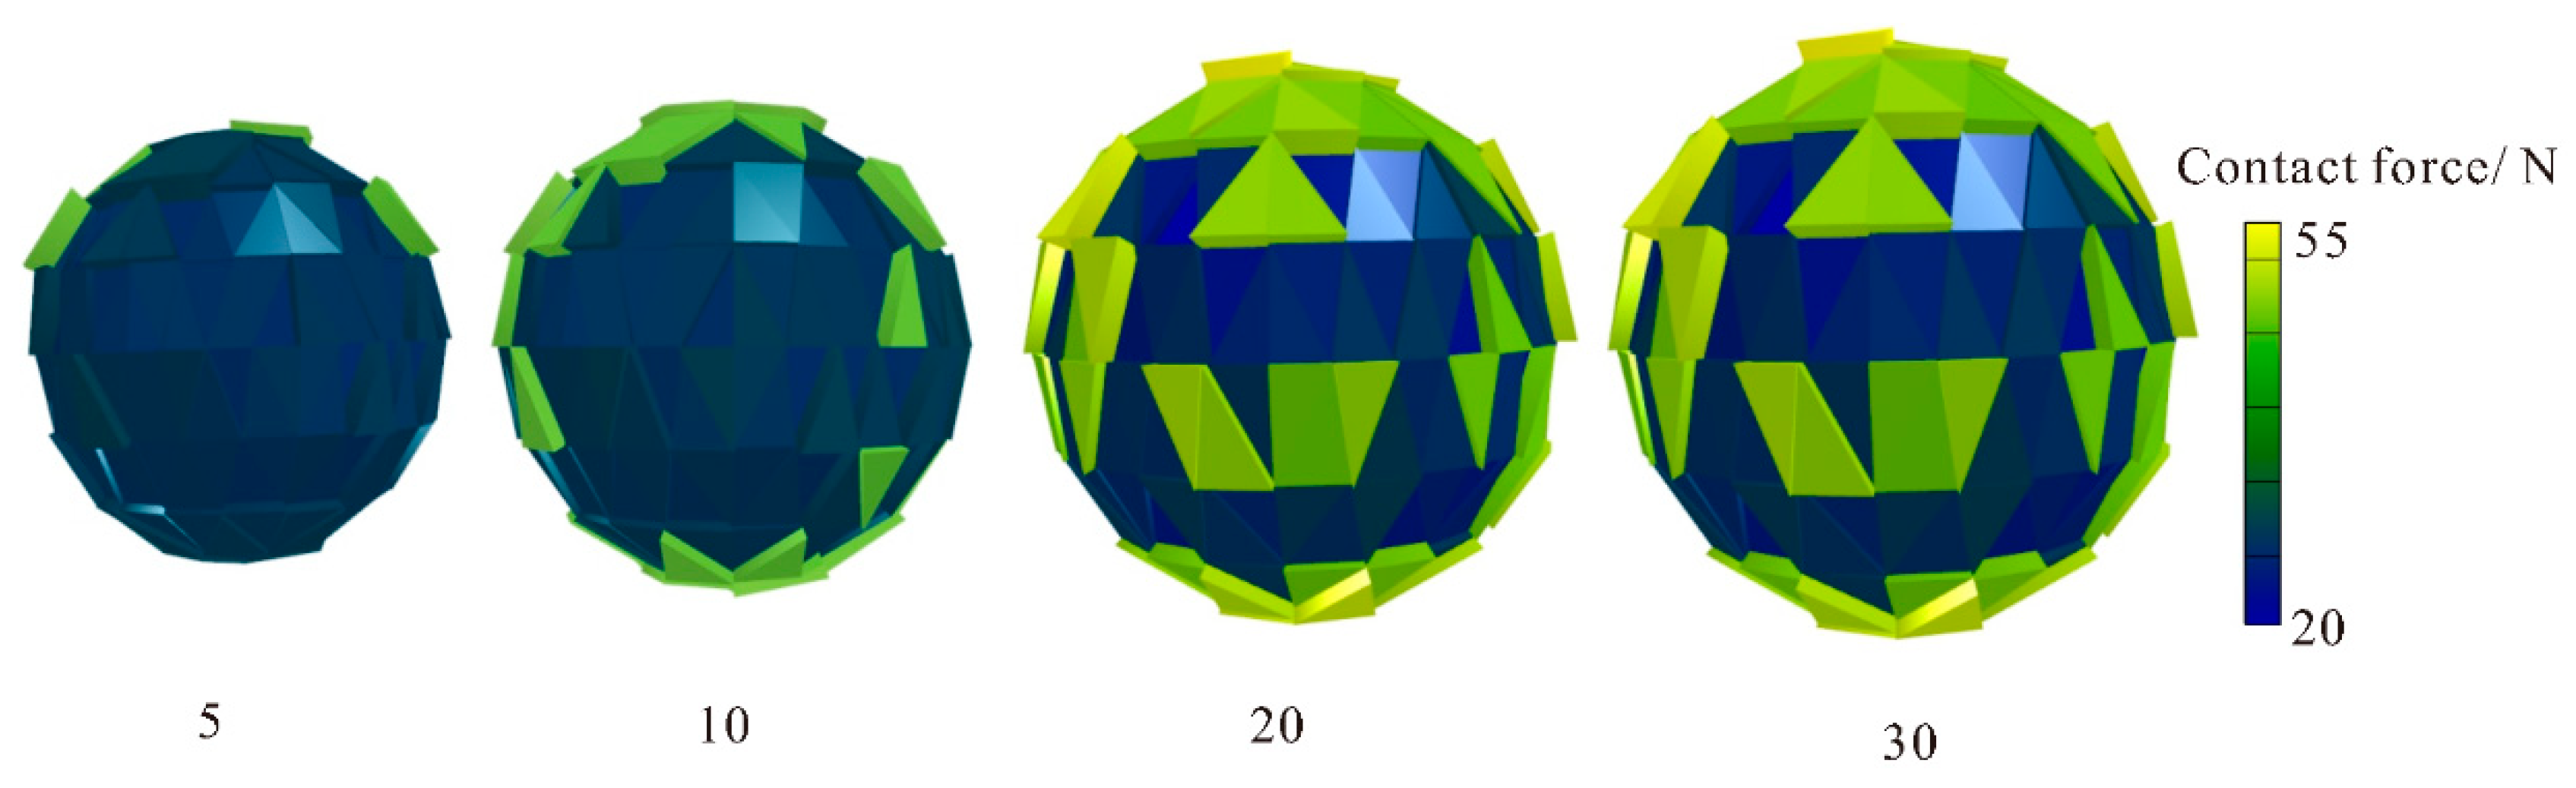
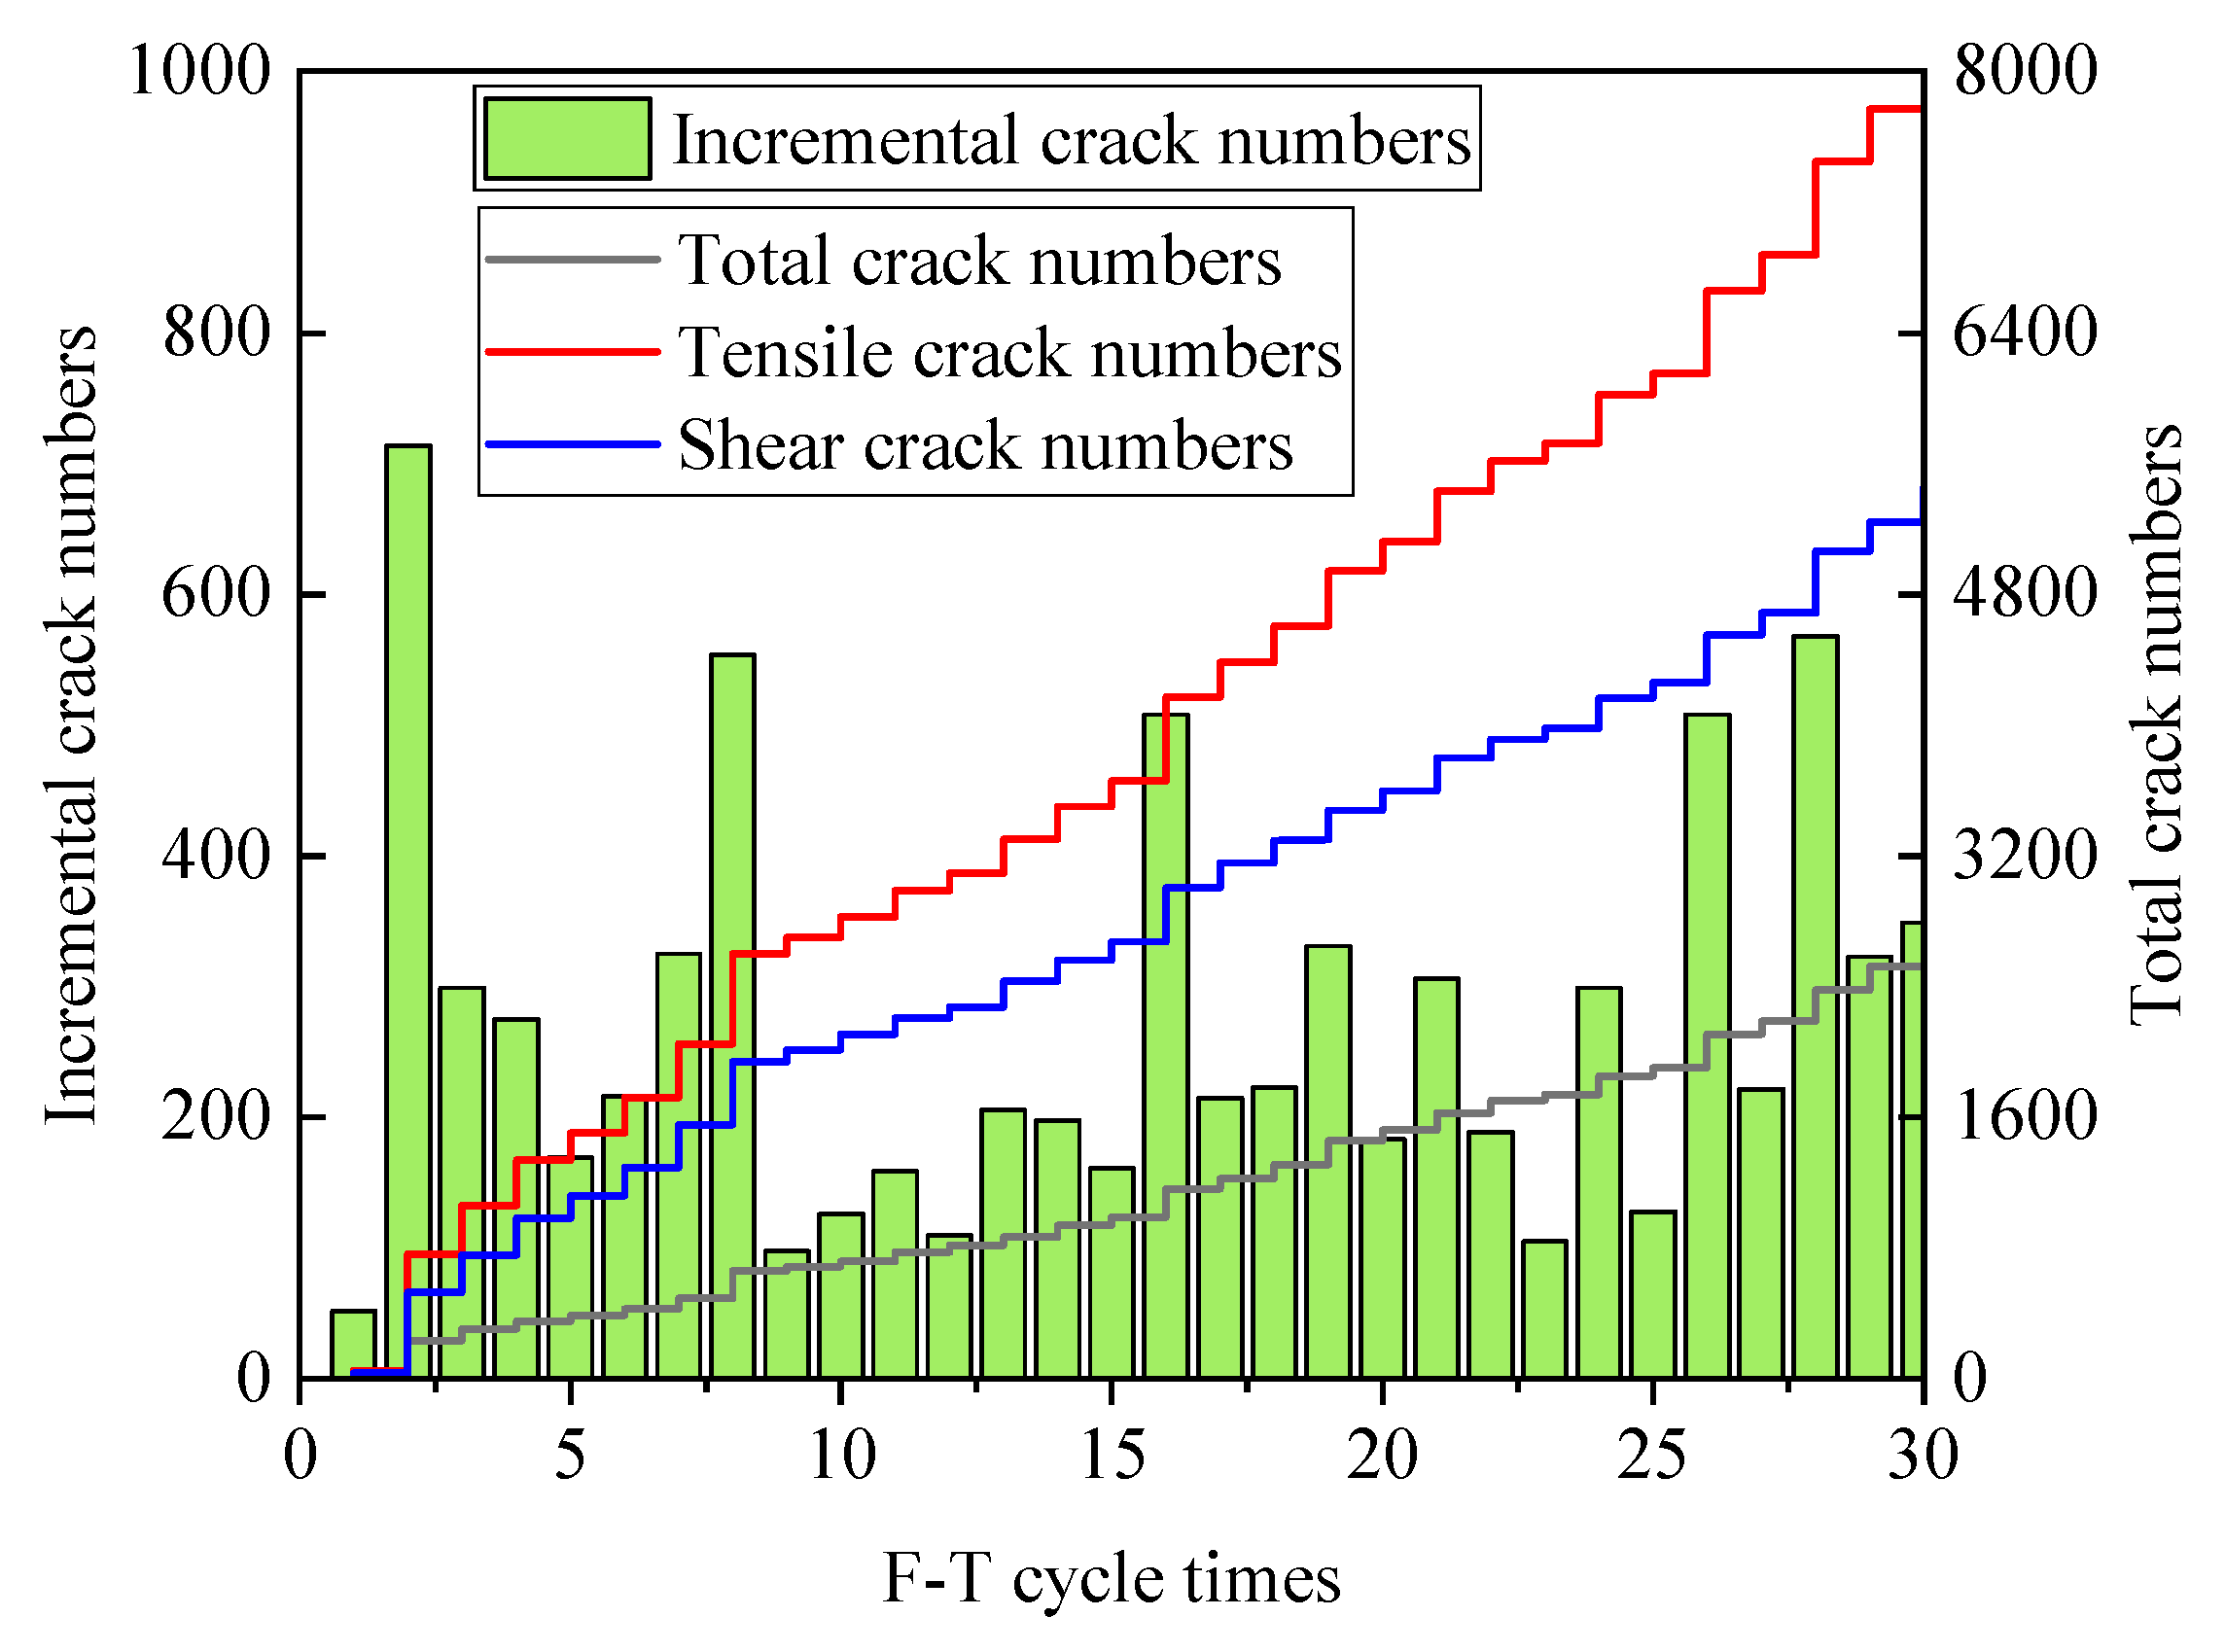
3.2. Strength Deterioration Model Validation and Multiscale Mechanical Analysis of Soft Rock under F-T Cycles

The laboratory test validation of the freeze–thaw strength deterioration model in this paper mainly considered the macroscopic damage pattern as well as the strength decay process. The stress–strain curves and damage characteristics are compared and analyzed in Figure 5. The laboratory test results for the muddy dolomite after 25 freeze–thaw cycles showed spalling and crack penetration at the top of the specimens, and the results of the numerical tests are consistent with them. The simulated results in Figure 5b are obtained after uniaxial loading of dolomite specimens under different numbers of freeze–thaw cycles, and the results are compared with the test curves in Figure 5a, which indicate a consistent pattern of peak strength deterioration. Since the calibration process refers to the Young’s modulus in the elastic phase, the discrete element numerical test is more difficult to reveal the pore compaction phase when the PBM is adopted, so the error in the morphology of the stress–strain curve is not the focus of this study.
We can find from Figure 5 that the peak strain decreases as the number of cycles increases, which is opposed to the laboratory results. The freeze–thaw erosion process has affected both the strength and modulus of specimens, but the simulation only reveals the mineral bonds’ deterioration. We may provide an improved model that can tackle the both of the above problems in the future research.
With the freeze–thaw strength deterioration model proposed in this paper, the macroscopic mechanical performance consistent with the indoor tests was obtained after freeze–thaw tests on intact rock samples. In order to further analyze the internal microscopic damage characteristics of the soft rock freeze–thaw process, we will further develop the qualitative and quantitative analysis of the mesoscopic damage.
The damage induced by freeze–thaw cycling is progressively accumulated. The damage is considered to arise from the disruption of cementation at the mineral scale, so the whole process of damage development is first counted by the DEM in this paper. Figure 6 and Figure 7 show the process of internal damage accumulation during the freeze–thaw cycling of intact rock samples, and the statistical results of meso-cracks are listed in Figure 8. From a qualitative point of view, we can observe the internal damage intensification process in soft rocks during the freeze–thaw cycles, and the numerical test results are compared with the indoor test results of Liu et al. [66] in Figure 6, and the mesoscopic NMR results of Gao et al. [67] in Figure 7. The qualitative comparison reveals a consistent, overall internal damage development pattern, which proves the effectiveness of the method proposed in this paper.
The initial rock samples are intact, and the meso-damage accumulated uniformly during the first 20 freeze–thaw cycles, which produced accelerated weathering after 20 cycles and showed an exponential growth overall (see Figure 8). This is due to the fact that the rock sample itself is intact and can have strong resistance to the mechanical damage process during freeze–thawing, so the state of damage caused after the initial freeze–thawing cycle can maintain a longer period of stability. The freeze–thaw cycles of natural rocks often require a longer evolution to produce significant weathering, so the slower initial stage of freeze–thaw cycle damage is consistent with the objective rule. The final cracks are classified according to the tension cracks and shear cracks, and it can be found that the damage process of intact rock samples is mainly affected by shear cracks, and the ratio of tension cracks to shear cracks is about 1:3, which indicates that the shear misalignment within the intact rock samples during freeze–thaw damage is more significant.
In order to further analyze the evolutionary characteristics of the meso-cracks, the angles at the generation of the mesoscopic cracks are studied in this paper. As shown in Figure 9, the generated meso-cracks are in the equivalent of the disc in the plane state. The crack plane is controlled by two kinds of angles; the first one termed angle-1 is the angle between the crack plane axis and the Z direction, which is 0~90°, and the second one termed angle-2 is the angle between the plane normal axis and the Y axis after projection in the X–Y plane, which is 0~360°.
The angular statistics of the mesoscopic tensile and shear cracks after the final 25 cycles are shown in Figure 10. Analysis of angle-2 reveals that the angles of shear cracks are mainly clustered toward 150° and 330°, while the tensile cracks are perpendicular to them and mainly clustered toward 60° and 240°. This indicates that there is a conjugate relationship between the tensile and shear effects during the development of the meso-damage. The statistics of angle-1 show that the angles of both shear and tension cracks are mainly clustered toward 90°, which is due to the lack of surrounding pressure on the surface of the soft rock specimen, the pore ice expansion process makes the rock sample expand toward the side, and the overall meso-cracks are generated during the volume expansion and are perpendicular to the expansion direction.
To further analyze the evolution of micro-cracks during freeze–thaw cycling, we also present the angular relationships in some earlier stages in Figure 11, at cycle times 10, 15 and 20. We can find that there is no obvious difference in angle-1, which mainly extends toward 90°. The angular relation of angle-2 shows a relative random behavior, which is caused by a low number of captured cracks.
During the freezing process, there is a squeezing effect of the pore ice on the mineral particles of the soft rock specimen, and this phenomenon can be described by the internal contact forces (see Figure 12).
The statistics of this mesoscopic contact force can be obtained from the three-dimensional mechanical statistics in the spatial state (see Figure 13), and it can be observed that the process of increasing the internal contact force for the different number of cycles of the intact rock sample is more uniform and no obvious directional clustering occurs. We can also find that the contact force increases with the rise in cycle times. This is because pore-water obtains a larger volume at a higher cycle time, which provides a larger expansion force between the pores in the rock.

3.3. Discussion on the Influence of Mesoscopic Bonding–Expansion Coupling Effect in Cracked Soft Rocks

The mesoscopic bonding–expansion coupling mechanism proposed in this paper can explain the freeze–thaw damage process of intact soft rock, and further discussion is needed for the joints in soft rock. Therefore, we additionally performed 30 cycles of freeze–thaw tests on the soft rock with horizontal joints. The freeze–thaw test of the jointed soft rock is only qualitatively compared with the laboratory results, and compared with the previous mesoscopic damage mechanism of the intact soft rock. The selection of artificial-jointed soft rock can better control the joint shape and penetration degree, avoid the influence of joint shape and roughness on the test and facilitate the summary of the rules.
The cracked rock samples were in a damaged state and the results of Liu et al. [68] were selected for the laboratory comparison of the freeze–thaw tests. The macroscopic phenomena revealed that the soft rock specimens produced a damage pattern radiating from the center of the initial crack to the surrounding area at the end of 30 freeze–thaw cycles. The freeze–thaw damage process produced wing cracks near the initial cracks, and this result is consistent with the indoor results (see Figure 14). Therefore, in this paper, the mesoscopic damage characteristics during the freeze–thaw cycling of cracked soft rocks will be analyzed in this section to contrast with intact rock samples.
The accumulation rate of meso-damage in the first 10 freeze–thaw cycles is faster in the cracked soft rocks, and slows down in the last 20 cycles, showing a uniform growth rate and one that is different from that of the intact rock samples (see Figure 15). This is due to the fact that the intact rock sample has a strong resistance to the mechanical damage process during freeze–thawing, so the state of the damage caused after the initial freeze–thawing cycle can be maintained for a longer time, while the jointed soft rock already has the initial damage. The freeze–thaw cycles of the intact rock samples tend to evolve longer before producing significant weathering, and the overall weathering rate of the freeze–thaw process of the jointed soft rock is higher than the intact rock samples, which is consistent with the general knowledge. Classifying the meso-cracks according to tension cracks and shear cracks, it can be found that the damage process of the jointed soft rock is mainly influenced by shear cracks, but the ratio of tension cracks to shear cracks is about 1:2, and the dominant role of the shear is reduced, which indicates that the initial jointing has influenced the damage process during the freeze–thaw process.
The angle statistics of the final 30 cycles of mesoscopic tension and shear cracks are shown in Figure 16. The statistics of angle-2 reveal that the angle of shear cracks is mainly clustered toward 180° and 0°, while the tension cracks are perpendicular to it, mainly clustered toward 270° and 90°. The conjugate relationship also exists, but the presence of the initial joints has a significant effect on the angle, making the final result different from the intact rock sample. The statistics of angle-1 also show that both shear and tension cracks are mainly clustered at angles of 60° to 90°, which also differs from the intact soft rock. This is due to the fact that the initial joints cause a large amount of pore water to accumulate in the crack space, and the freezing process produces more expansion effects toward the top and bottom, resulting in a weakening of the original lateral volume expansion effect and causing a change in crack orientation.
To further analyze the evolution of micro-cracks during freeze–thaw cycling in cracked rocks, we also present the angular relationships in some earlier stages in Figure 17, at cycle times 10, 15 and 20. We can find that there is no obvious difference both in angle-1 and angle-2. These statistical results are relatively stable compared with their counterparts in Figure 11. It is mainly because the number of accumulated cracks in the cracked rock is much higher than in the intact rock.
We only applied horizontal cracks in this study. According to the laboratory results from Shi et al. (2022), the initial cracks direction has an influence on the meso-cracks evolution [69]. Changing the inclinations of initial joints may also cause a different angular relationship in this study. In the next study, we may conduct more experiments to study the initial crack’s inclination influence on the micro-crack angular relationship.
There is no significant damage acceleration in the freeze–thaw cycles for the cracked soft rocks, but we could find several stable and jump processes in the overall damage count. The first jump occurs between 5–10 cycles followed by a period of steady growth. A second sharp increase occurs between 15–20 cycles followed by another sharp increase between 25–30 freeze–thaw cycles.
During the freezing process, the compression of the pore ice on the mineral grains of the cracked soft rocks can also be described by the internal contact forces (see Figure 18). A comparative analysis with the intact rocks shows that there is a significant concentration of contact forces, with a large amount of pore ice accumulating near the initial joints producing a local mechanical concentration and causing the radiation state damage described above as well as wing cracks near the initial joints.
The statistics of mesoscopic contact forces can also be obtained from the three-dimensional mechanical statistics in the spatial state (see Figure 19), and it can be observed that the internal contact forces are not uniformly distributed for different numbers of freeze–thaw cycles in the jointed soft rock, producing vertical concentrations, which are different from the intact rock samples.

4. Conclusions

After field drilling, we could obtain the material property from engineering and we could conduct freeze–thaw simulations to calibrate the sample. The results can be used to execute an overall modelling, which provides predictive results guiding the prevention of freeze–thaw-induced hazards, and the following conclusions are obtained:
(1)
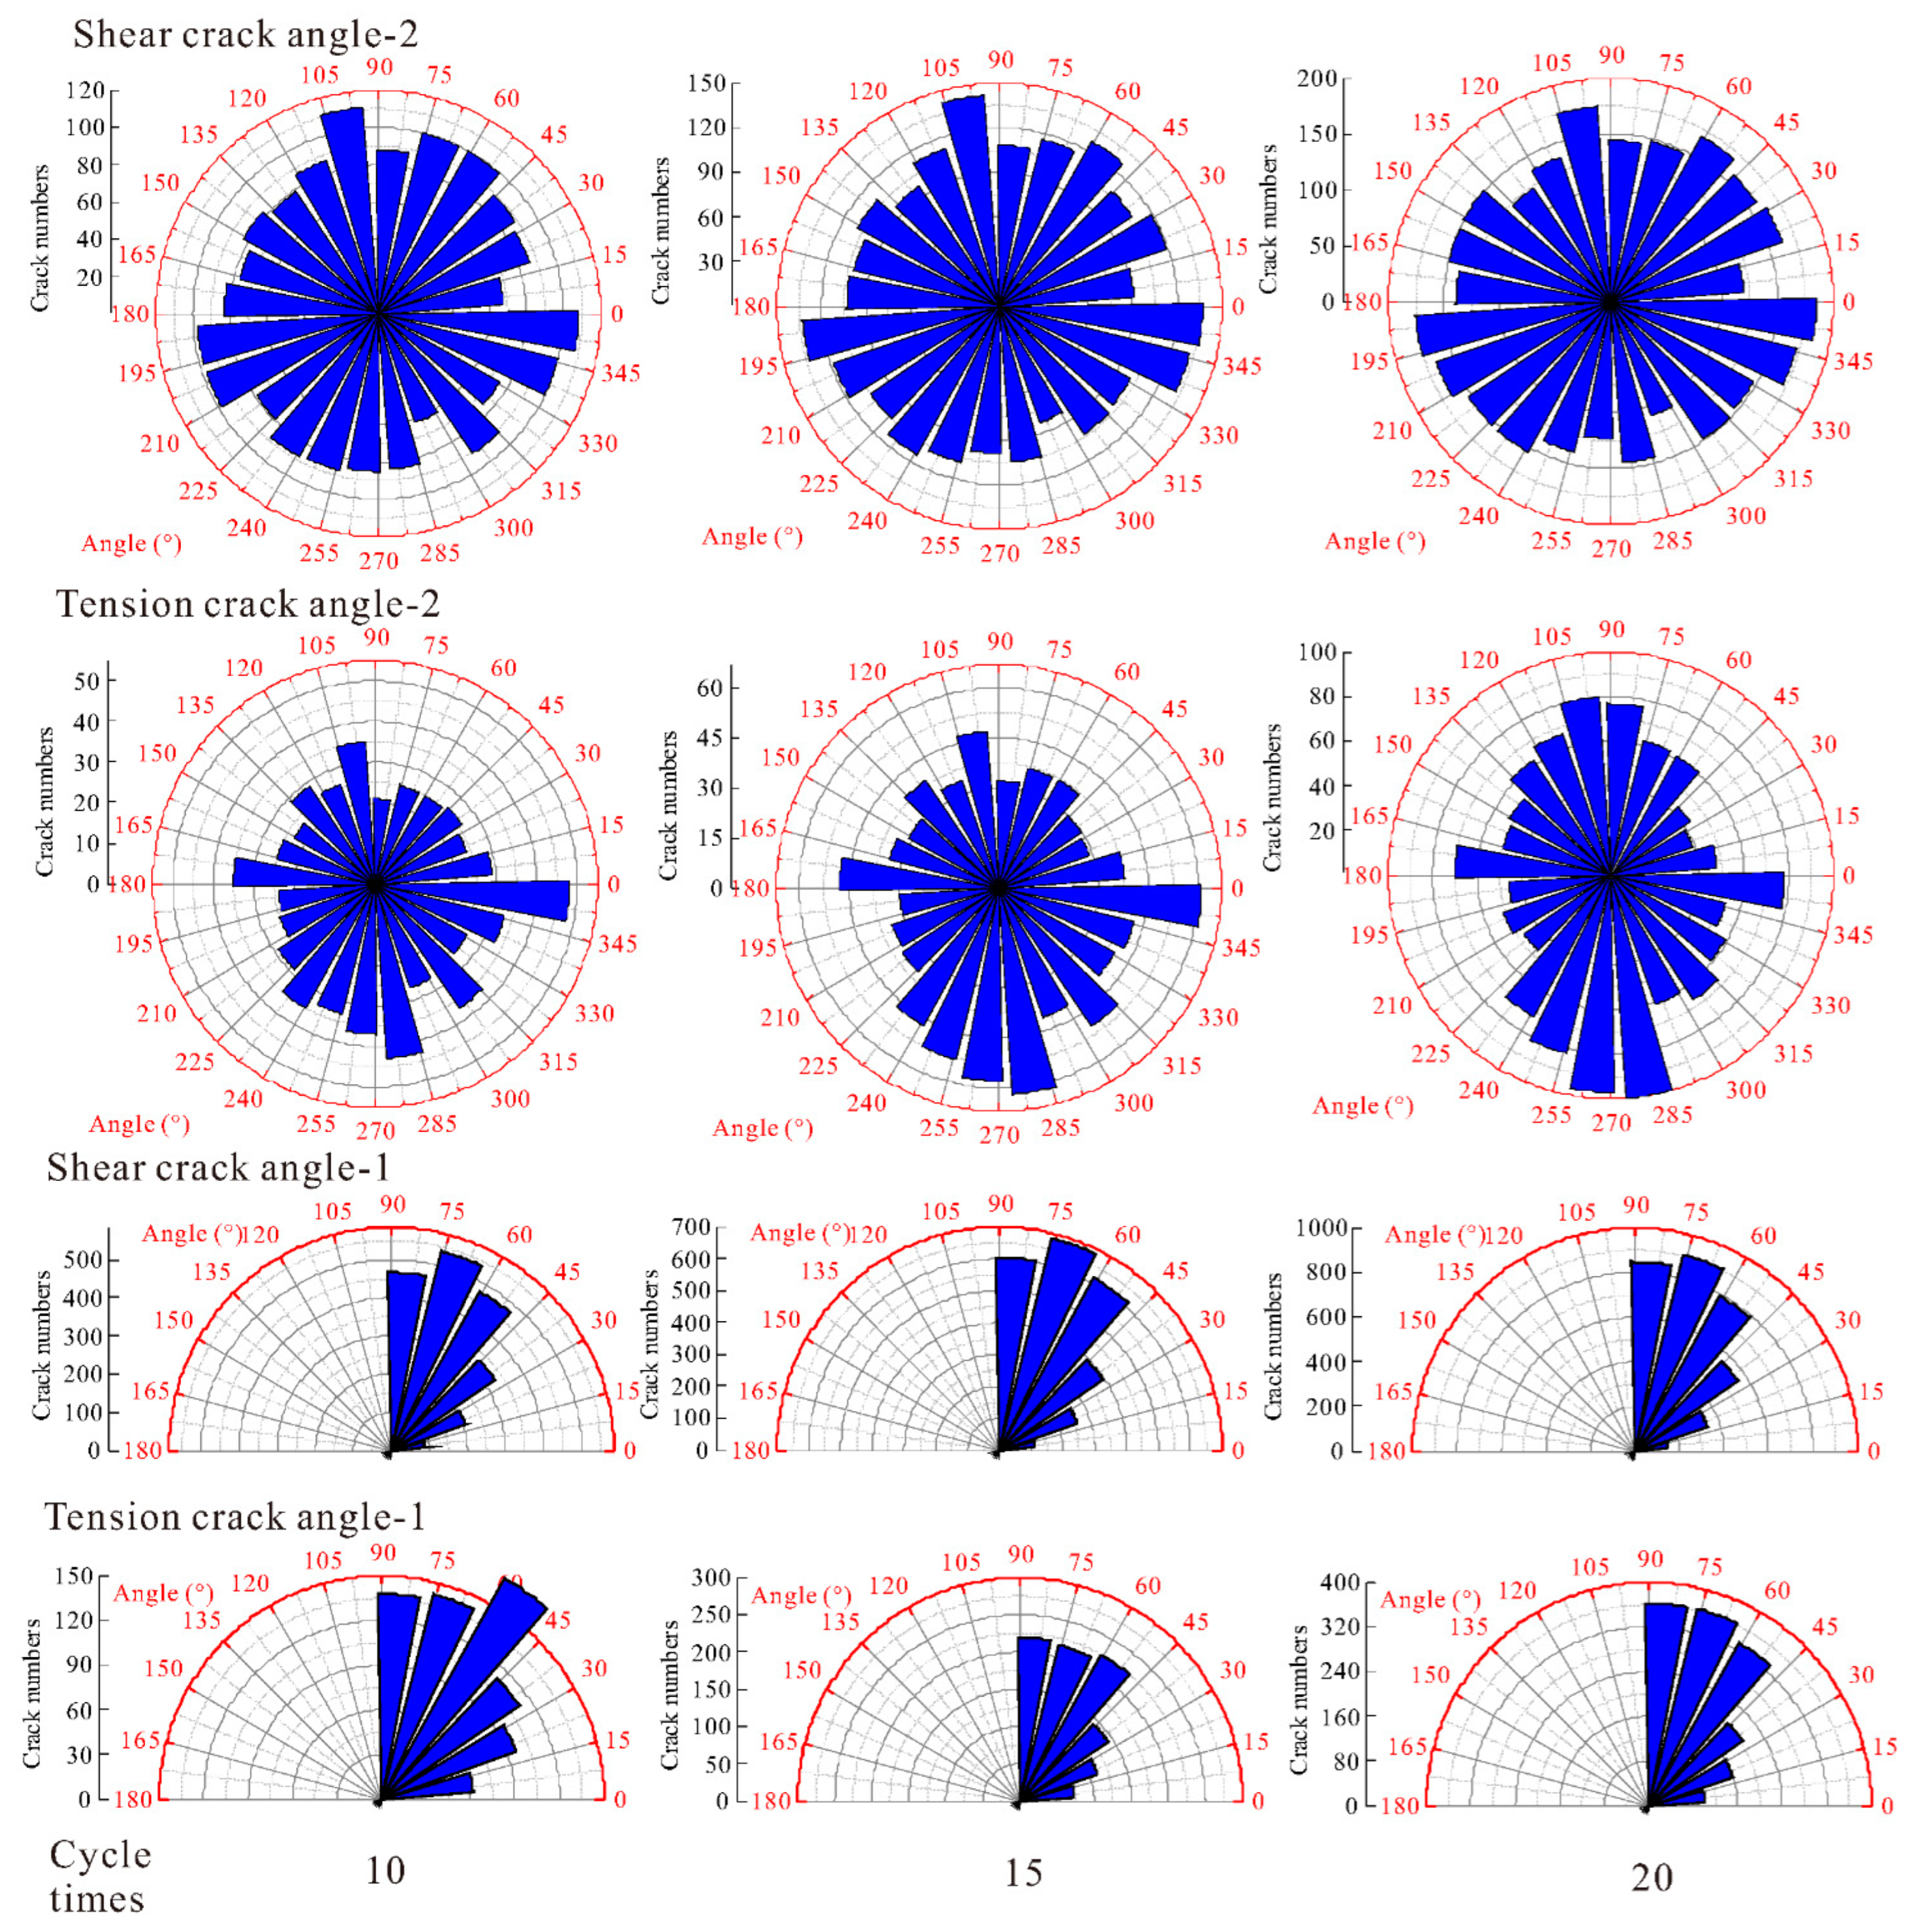
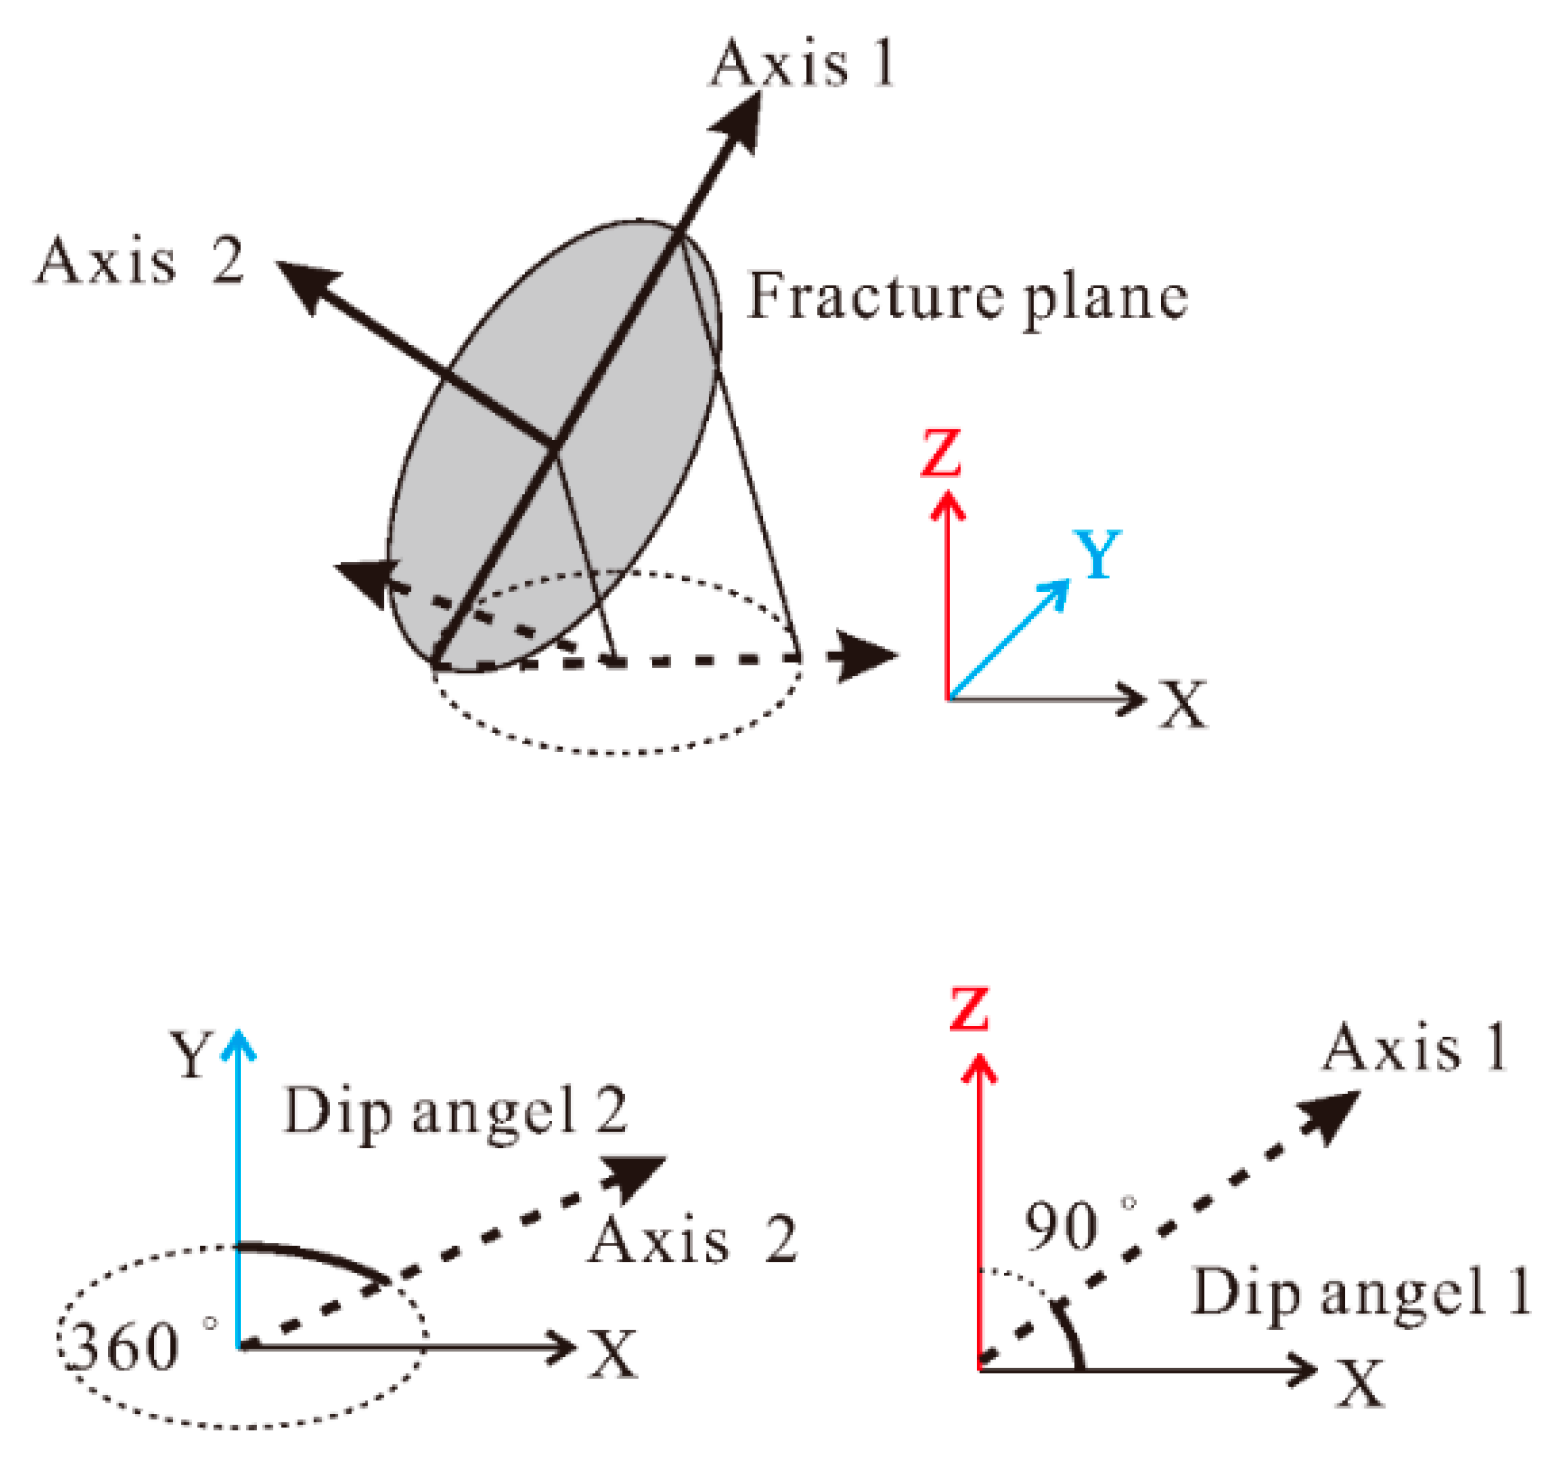
In this paper, a soft rock freeze–thaw cycle strength-deterioration model is proposed based on the bonding–expansion coupling mechanism, which can fully consider the correlations of multiscale damage and explain the strength decreasing and damage mode from the meso-damage cracks’ generation rate and direction;
(2)
The mesoscopic bonding–expansion coupling mechanism proposed in this paper can explain the multiscale damage mechanism of soft rock freeze–thaw cycling, and the corresponding strength-deterioration model has a computational error less than 10% compared with indoor tests, which can correlate macroscopic and mesoscopic damage to the special freeze–thaw damage process of jointed soft rock;
(3)
Although no model can replace laboratory testing in engineering design, the soft rock-strength deterioration model can provide guidance for the prevention of landslides and tunnel collapses induced by freeze–thaw cycles under water-rich conditions in cold regions, and the model can be easily extended for application on different soft rocks.

Author Contributions

Conceptualization, C.Z.; methodology, C.X.; software, C.X.; validation, C.Z., Z.L. and C.X.; formal analysis, Z.L.; investigation, C.X.; resources, C.X.; data curation, Z.L.; writing—original draft preparation, C.X.; writing—review and editing, Z.L.; visualization, C.X.; supervision, C.Z.; project administration, C.Z.; funding acquisition, C.Z. All authors have read and agreed to the published version of the manuscript.

Funding

This research was funded by the National Key R&D Program of China (Grant Numbers: 41977230) and the Science and Technology Planning Project of Guangdong Province, China (Grant Numbers: 2015B090925016, 2016B010124007).

Institutional Review Board Statement

Not applicable.

Informed Consent Statement

Not applicable.

Data Availability Statement

All relevant data are within the manuscript.

Conflicts of Interest

The authors declare no conflict of interest.

References

  1. Jin, D.W.; Sun, J.F.; Fu, S.L. Discussion on landslides hazard mechanism of two kinds of low angle slope in permafrost region of Qinghai-Tibet plateau. Rock Soil Mech. 2005, 26, 774–778. [Google Scholar]
  2. Lai, J.X.; Qiu, J.L.; Fan, H.B.; Chen, J.X.; Xie, Y.L. Freeze-proof method and test verification of a cold region tunnel employing electric heat tracing. Tunn. Undergr. Space Technol. 2016, 60, 56–65. [Google Scholar] [CrossRef]
  3. Liu, Q.; Huang, S.; Kang, Y.; Pan, Y. Study of unfrozen water content and frost heave model for saturated rock under low temperature. Chin. J. Rock Mech. Eng. 2016, 35, 2000–2012. [Google Scholar]
  4. Lyu, Z.T.; Xia, C.C.; Liu, W.P. Analytical solution of frost heaving force and stress distribution in cold region tunnels under non-axisymmetric stress and transversely isotropic frost heave of surrounding rock. Cold Reg. Sci. Technol. 2020, 178, 103117. [Google Scholar] [CrossRef]
  5. Wu, G.; Chen, W.; Cui, K.; Wang, P. Degradation behavior and mechanism of slate under alternating conditions of freeze-thaw and wet-dry. J. Cent. South Univ. (Sci. Technol.) 2019, 50, 1392–1402. [Google Scholar] [CrossRef]
  6. Zhao, X.; Zhang, H.W.; Lai, H.P.; Yang, X.H.; Wang, X.Y.; Zhao, X.L. Temperature field characteristics and influencing factors on frost depth of a highway tunnel in a cold region. Cold Reg. Sci. Technol. 2020, 179, 103141. [Google Scholar] [CrossRef]
  7. Liu, Z.; Zhou, C.; Li, B.; Zhang, L.; Liang, Y. Effects of grain dissolution-diffusion sliding and hydro-mechanical interaction on the creep deformation of soft rocks. Acta Geotech. 2020, 15, 1219–1229. [Google Scholar] [CrossRef]
  8. Ballantyne, C.K.; Sandeman, G.E.; Stone, J.O.; Wilson, P. Rock-slope failure following Late Pleistocene deglaciation on tectonically stable mountainous terrain. Quat. Sci. Rev. 2014, 86, 144–157. [Google Scholar] [CrossRef]
  9. Chen, Y.L.; Ni, J.; Jiang, L.H.; Liu, M.L.; Wang, P.; Azzam, R. Experimental study on mechanical properties of granite after freeze-thaw cycling. Environ. Earth Sci. 2014, 71, 3349–3354. [Google Scholar] [CrossRef]
  10. Park, K.; Kim, K.; Lee, K.; Kim, D. Analysis of Effects of Rock Physical Properties Changes from Freeze-Thaw Weathering in Ny-angstrom lesund Region: Part 1-Experimental Study. Appl. Sci.-Basel 2020, 10, 1707. [Google Scholar] [CrossRef]
  11. Yavuz, H.; Altindag, R.; Sarac, S.; Ugur, I.; Sengun, N. Estimating the index properties of deteriorated carbonate rocks due to freeze-thaw and thermal shock weathering. Int. J. Rock Mech. Min. Sci. 2006, 43, 767–775. [Google Scholar] [CrossRef]
  12. Wang, Y.; Feng, W.K.; Wang, H.J.; Li, C.H.; Hou, Z.Q. Rock bridge fracturing characteristics in granite induced by freeze-thaw and uniaxial deformation revealed by AE monitoring and post-test CT scanning. Cold Reg. Sci. Technol. 2020, 177, 103115. [Google Scholar] [CrossRef]
  13. Prick, A. Dilatometrical behaviour of porous calcareous rock samples subjected to freeze–thaw cycles. CATENA 1995, 25, 7–20. [Google Scholar] [CrossRef]
  14. Shen, Y.J.; Wang, Y.Z.; Wei, X.; Jia, H.L.; Yan, R.X. Investigation on meso-debonding process of the sandstone-concrete interface induced by freeze-thaw cycles using NMR technology. Constr. Build. Mater. 2020, 252, 118962. [Google Scholar] [CrossRef]
  15. Kang, Y.S.; Hou, C.C.; Liu, B.; Liu, Q.S.; Sang, H.M.; Tian, Y.C. Frost Deformation and a Quasi-Elastic-Plastic-Creep Constitutive Model for Isotropic Freezing Rock. Int. J. Geomech. 2020, 20, 4020119. [Google Scholar] [CrossRef]
  16. Zhou, C.; Su, D.; Qiu, X.; Yang, X.; Liu, Z. Experimental study of cracked soft rock with hydro—Mechanical coupling effect. Acta Sci. Nat. Univ. Sunyatseni 2019, 58, 35–44. [Google Scholar]
  17. Drotz, S.H.; Tilston, E.L.; Sparrman, T.; Schleucher, J.; Nilsson, M.; Oquist, M.G. Contributions of matric and osmotic potentials to the unfrozen water content of frozen soils. Geoderma 2009, 148, 392–398. [Google Scholar] [CrossRef]
  18. Zhao, B.; Liu, D.; Li, Z.; Huang, W.; Dong, Q. Mechanical Behavior of Shale Rock under Uniaxial Cyclic Loading and Unloading Condition. Adv. Civ. Eng. 2018, 2018, 9750480. [Google Scholar] [CrossRef]
  19. Zhang, M.Y.; Zhang, X.Y.; Lu, J.G.; Pei, W.S.; Wang, C. Analysis of volumetric unfrozen water contents in freezing soils. Exp. Heat Transf. 2019, 32, 426–438. [Google Scholar] [CrossRef]
  20. Zhou, X.H.; Zhou, J.; Kinzelbach, W.; Stauffer, F. Simultaneous measurement of unfrozen water content and ice content in frozen soil using gamma ray attenuation and TDR. Water Resour. Res. 2014, 50, 9630–9655. [Google Scholar] [CrossRef]
  21. Anderson, R.S.; Anderson, S.P.; Tucker, G.E. Rock damage and regolith transport by frost: An example of climate modulation of the geomorphology of the critical zone. Earth Surf. Processes Landf. 2013, 38, 299–316. [Google Scholar] [CrossRef]
  22. Chen, Y.L.; Wu, P.; Yu, Q.; Xu, G. Effects of Freezing and Thawing Cycle on Mechanical Properties and Stability of Soft Rock Slope. Adv. Mater. Sci. Eng. 2017, 2017, 3173659. [Google Scholar] [CrossRef]
  23. Kolay, E. Modeling the effect of freezing and thawing for sedimentary rocks. Environ. Earth Sci. 2016, 75, 210. [Google Scholar] [CrossRef]
  24. Luo, X.D.; Jiang, N.; Fan, X.Y.; Mei, N.F.; Luo, H. Effects of freeze-thaw on the determination and application of parameters of slope rock mass in cold regions. Cold Reg. Sci. Technol. 2015, 110, 32–37. [Google Scholar] [CrossRef]
  25. Mu, J.Q.; Pei, X.J.; Huang, R.Q.; Rengers, N.; Zou, X.Q. Degradation characteristics of shear strength of joints in three rock types due to cyclic freezing and thawing. Cold Reg. Sci. Technol. 2017, 138, 91–97. [Google Scholar] [CrossRef]
  26. Li, J.; Kaunda, R.B.; Zhu, L.; Zhou, K.; Gao, F. Experimental Study of the Pore Structure Deterioration of Sandstones under Freeze-Thaw Cycles and Chemical Erosion. Adv. Civ. Eng. 2019, 2019, 9687843. [Google Scholar] [CrossRef]
  27. Lei, D.; Lin, H.; Chen, Y.; Cao, R.; Wen, Z. Effect of Cyclic Freezing-Thawing on the Shear Mechanical Characteristics of Nonpersistent Joints. Adv. Mater. Sci. Eng. 2019, 2019, 9867681. [Google Scholar] [CrossRef]
  28. Ma, Q.; Ma, D.; Yao, Z. Influence of freeze-thaw cycles on dynamic compressive strength and energy distribution of soft rock specimen. Cold Reg. Sci. Technol. 2018, 153, 10–17. [Google Scholar] [CrossRef]
  29. Li, J.; Zhou, K.; Liu, W.; Zhang, Y. Analysis of the effect of freeze-thaw cycles on the degradation of mechanical parameters and slope stability. Bull. Eng. Geol. Environ. 2018, 77, 573–580. [Google Scholar] [CrossRef]
  30. Qiao, G.; Wang, Y.; Chu, F.; Yang, X. Failure mechanism of slope rock mass due to freeze-thaw weathering. J. Eng. Geol. 2015, 23, 469–476. [Google Scholar]
  31. Lin, H.; Lei, D.; Zhang, C.; Wang, Y.; Zhao, Y. Deterioration of non-persistent rock joints: A focus on impact of freeze-thaw cycles. Int. J. Rock Mech. Min. Sci. 2020, 135, 104515. [Google Scholar] [CrossRef]
  32. Ling, X.Z.; Zhang, F.; Li, Q.L.; An, L.S.; Wang, J.H. Dynamic shear modulus and damping ratio of frozen compacted sand subjected to freeze-thaw cycle under multi-stage cyclic loading. Soil Dyn. Earthq. Eng. 2015, 76, 111–121. [Google Scholar] [CrossRef]
  33. Bost, M.; Pouya, A. Stress generated by the freeze-thaw process in open cracks of rock walls: Empirical model for tight limestone. Bull. Eng. Geol. Environ. 2017, 76, 1491–1505. [Google Scholar] [CrossRef]
  34. Chen, S.; Kong, L.; Xu, G. An effective way to estimate the Poisson’s ratio of silty clay in seasonal frozen regions. Cold Reg. Sci. Technol. 2018, 154, 74–84. [Google Scholar] [CrossRef]
  35. Zhang, H.; Xie, X.; Peng, C.; Yang, G.; Ye, W.; Sheng, Y. Constitutive model for damage of freeze-thaw rock under three-dimensional stress. Chin. J. Geotech. Eng. 2017, 39, 1444–1452. [Google Scholar]
  36. Zhou, Z.; Ma, W.; Zhang, S.; Mu, Y.; Li, G. Effect of freeze-thaw cycles in mechanical behaviors of frozen loess. Cold Reg. Sci. Technol. 2018, 146, 9–18. [Google Scholar] [CrossRef]
  37. Ji, W.D.; Kang, Y.S.; An, X.Y.; Zhao, Y. Simulation on freeze-thaw action in multi-cracks in rock mass. In Proceedings of the 4th International Conference on Intelligent System and Applied Material (GSAM), Taiyuan, China, 23–24 August 2014; p. 426. [Google Scholar]
  38. Xu, S.; Li, N.; Xu, G.; Wang, X.; Tian, Y.; Yuan, K.; Wang, L. Thermal transfer and heat balance of saturated rock under freezing-thawing environment. Chin. J. Rock Mech. Eng. 2016, 35, 2225–2236. [Google Scholar]
  39. Huang, S.-B.; Liu, Q.-S.; Cheng, A.-P.; Liu, Y.-Z. A coupled hydro-thermal model of fractured rock mass under low temperature and its numerical analysis. Rock Soil Mech. 2018, 39, 735–744. [Google Scholar] [CrossRef]
  40. Christ, M.; Kim, Y.C. Experimental study on the physical-mechanical properties of frozen silt. Ksce J. Civ. Eng. 2009, 13, 317–324. [Google Scholar] [CrossRef]
  41. Sparrman, T.; Oquist, M.; Klemedtsson, L.; Schleucher, J.; Nilsson, M. Quantifying unfrozen water in frozen soil by high-field H-2 NMR. Environ. Sci. Technol. 2004, 38, 5420–5425. [Google Scholar] [CrossRef]
  42. Wang, D.Y.; Zhu, Y.L.; Ma, W.; Niu, Y.H. Application of ultrasonic technology for physical-mechanical properties of frozen soils. Cold Reg. Sci. Technol. 2006, 44, 12–19. [Google Scholar] [CrossRef]
  43. Weng, L.; Wu, Z.J.; Taheri, A.; Liu, Q.S.; Lu, H. Deterioration of dynamic mechanical properties of granite due to freeze-thaw weathering: Considering the effects of moisture conditions. Cold Reg. Sci. Technol. 2020, 176, 103092. [Google Scholar] [CrossRef]
  44. Zhou, X.P.; Li, C.Q.; Zhou, L.S. The effect of microstructural evolution on the permeability of sandstone under freeze-thaw cycles. Cold Reg. Sci. Technol. 2020, 177, 103119. [Google Scholar] [CrossRef]
  45. Huimei, Z.; Gengshe, Y. Damage mechanical characteristics of rock under freeze-thaw and load coupling. Eng. Mech. 2011, 28, 161–165. [Google Scholar]
  46. Zhang, H.; Meng, X.; Peng, C.; Yang, G.; Ye, W.; Shen, Y.; Liu, H. Rock damage constitutive model based on residual intensity characteristics under freeze-thaw and load. J. China Coal Soc. 2019, 44, 3404–3411. [Google Scholar]
  47. Chen, Y.; Lin, H.; Wang, Y.; Zhao, Y. Damage Statistical Empirical Model for Fractured Rock under Freezing-Thawing Cycle and Loading. Geofluids 2020, 2020, 8842471. [Google Scholar] [CrossRef]
  48. Huimei, Z.; Gengshe, Y. Research on damage model of rock under coupling action of freeze-thaw and load. Chin. J. Rock Mech. Eng. 2010, 29, 471–476. [Google Scholar]
  49. Chen, S.; Qiao, C.; Ye, Q.; Ji, S. Compositedamage model of jointed rock mass under freezing and thawing load. J. Harbin Inst. Technol. 2019, 51, 100–108. [Google Scholar]
  50. Liu, Y.; Liu, E.; Yin, Z. Constitutive model for tailing soils subjected to freeze-thaw cycles based on meso-mechanics and homogenization theory. Acta Geotech. 2020, 15, 2433–2450. [Google Scholar] [CrossRef]
  51. Zhu, T.; Chen, J.; Huang, D.; Luo, Y.; Li, Y.; Xu, L. A DEM-Based Approach for Modeling the Damage of Rock Under Freeze-Thaw Cycles. Rock Mech. Rock Eng. 2021, 54, 2843–2858. [Google Scholar] [CrossRef]
  52. Li, B.; Wong, R.C.K. Quantifying structural states of soft mudrocks. J. Geophys. Res. -Solid Earth 2016, 121, 3324–3347. [Google Scholar] [CrossRef]
  53. Pinyol, N.M.; Vaunat, J.; Alonso, E.E. A constitutive model for soft clayey rocks that includes weathering effects. Geotechnique 2007, 57, 137–151. [Google Scholar] [CrossRef]
  54. Liu, Z.; Zhou, C.Y.; Li, B.T.; Lu, Y.Q.; Yang, X. A dissolution-diffusion sliding model for soft rock grains with hydro-mechanical effect. J. Rock Mech. Geotech. Eng. 2018, 10, 457–467. [Google Scholar] [CrossRef]
  55. Zhou, C.Y.; Ge, X.X.; Huang, W.; Li, D.X.; Liu, Z. Effects of Aqua-Dispersing Nano-Binder on Clay Conductivity at Different Temperatures. Sustainability 2019, 11, 4859. [Google Scholar] [CrossRef]
  56. Liu, Z.; Sun, H.; Lin, K.; Zhou, C.; Huang, W. Occurrence Regularity of Silt-Clay Minerals in Wind Eroded Deserts of Northwest China. Sustainability 2021, 13, 2998. [Google Scholar] [CrossRef]
  57. Xia, C.; Liu, Z.; Zhou, C. Burger’s Bonded Model for Distinct Element Simulation of the Multi-Factor Full Creep Process of Soft Rock. J. Mar. Sci. Eng. 2021, 9, 945. [Google Scholar] [CrossRef]
  58. Anderson DM, T.A. Low–temperature phases of interfacial water in clay–water systems. Soil Sci Soc Am J 1971, 35, 47–54. [Google Scholar] [CrossRef]
  59. Li, X.P.; Qu, D.X.; Luo, Y.; Ma, R.Q.; Xu, K.; Wang, G. Damage evolution model of sandstone under coupled chemical solution and freeze-thaw process. Cold Reg. Sci. Technol. 2019, 162, 88–95. [Google Scholar] [CrossRef]
  60. Castro-Filgueira, U.; Alejano, L.R.; Ivars, D.M. Particle flow code simulation of intact and fissured granitic rock samples. J. Rock Mech. Geotech. Eng. 2020, 12, 960–974. [Google Scholar] [CrossRef]
  61. Lin, C.; Xia, C.; Liu, Z.; Zhou, C. A Comprehensive Correlation Study of Structured Soils in Coastal Area of South China about Structural Characteristics. J. Mar. Sci. Eng. 2022, 10, 508. [Google Scholar] [CrossRef]
  62. Cai, M.; Kaiser, P.K.; Uno, H.; Tasaka, Y.; Minami, M. Estimation of rock mass deformation modulus and strength of jointed hard rock masses using the GSI system. Int. J. Rock Mech. Min. Sci. 2004, 41, 3–19. [Google Scholar] [CrossRef]
  63. Wang, H.S. Mechanical Properties and Damage Law of Confined Argillaceous Dolomite under Freeze-Thaw Cycles; Guizhou University: Guiyang, China, 2021. [Google Scholar]
  64. Cheng, Y.; Wong, L.N.Y. A study on mechanical properties and fracturing behavior of Carrara marble with the flat-jointed model. Int. J. Numer. Anal. Methods Geomech. 2020, 44, 803–822. [Google Scholar] [CrossRef]
  65. Li, B.; Guo, L.; Zhang, F.-s. Macro-micro investigation of granular materials in torsional shear test. J. Cent. South Univ. 2014, 21, 2950–2961. [Google Scholar] [CrossRef]
  66. Liu, J.; Li, Z.; Yang, Y.; Tang, H.; Gao, J.; Shen, H. Study on the mechanical properties of sandstone nondestructive testing under the freeze-thaw cycle. J. Water Resour. Water Eng. 2019, 30, 201–209, 216. [Google Scholar]
  67. Gao, F.; Wang, Q.; Deng, H.; Zhang, J.; Tian, W.; Ke, B. Coupled effects of chemical environments and freeze-thaw cycles on damage characteristics of red sandstone. Bull. Eng. Geol. Environ. 2017, 76, 1481–1490. [Google Scholar] [CrossRef]
  68. Liu, T.; Zhang, C.; Cao, P.; Zhou, K. Freeze-thaw damage evolution of fractured rock mass using nuclear magnetic resonance technology. Cold Reg. Sci. Technol. 2020, 170, 102951. [Google Scholar] [CrossRef]
  69. Xudong, S.; Jinwen, B.; Feng., G.; Wang., K.; Cui., B.; Guo., J.; Yuyang., X.; Song., C. Crack propagation law at the interface of FRP wrapped coal-backfilling composite structure. Constr. Build. Mater. 2022, 344, 128229. [Google Scholar] [CrossRef]
Figure 1. Schematic diagram of the coupling of soft rock bonding–expansion in freezing process.
Sustainability 14 11766 g001
Figure 2. Variation of pore water/ice with temperature.
Sustainability 14 11766 g002
Figure 3. Expansion and contraction patterns under freeze–thaw cycles.
Sustainability 14 11766 g003
Figure 4. The schematical diagram of the PBM model.
Sustainability 14 11766 g004
Figure 5. Mechanical properties of intact rock samples at different numbers of freeze–thaw cycling ((a) Laboratory experimental results; (b) Numerical results.).
Sustainability 14 11766 g005
Figure 6. Comparison of macroscopic damage patterns during the development of freeze–thaw cycling in intact rock samples ((a) Cycle 5; (b) Cycle 10; (c) Cycle 15; (d) Cycle 20.).
Sustainability 14 11766 g006
Figure 7. Detailed NMR comparison of freeze–thaw damage in intact rock samples ((a) Cycle 5; (b) Cycle 10; (c) Cycle 15; (d) Cycle 20.).
Sustainability 14 11766 g007
Figure 8. Cracking statistics of intact rock samples during freeze–thaw cycles.
Sustainability 14 11766 g008
Figure 9. Schematic diagram of the angular relationship of mesoscopic cracks.
Sustainability 14 11766 g009
Figure 10. T Statistics of the angular relationship of the meso-cracks in the intact rock sample: (a) Shear crack angle-2 statistics; (b) Tension crack angle-2 statistics; (c) Shear crack angle-1 statistics; (d) Tension crack angle-1 statistics.
Sustainability 14 11766 g010
Figure 11. Statistics of the angular relationship of the meso-cracks at lower cycle times.
Sustainability 14 11766 g011
Figure 12. Internal contact force state during freezing of intact soft rock samples.
Sustainability 14 11766 g012
Figure 13. 3-D contact force statistics of freeze–thaw process of intact rock samples.
Sustainability 14 11766 g013
Figure 14. Development of freeze–thaw cracks in fractured rock samples.
Sustainability 14 11766 g014
Figure 15. Cracking statistics during freeze–thaw cycles in fractured samples.
Sustainability 14 11766 g015
Figure 16. Statistics of the angular relationship of the meso-cracks in the cracked rock sample: (a) Shear crack angle-2 statistics; (b) Tension crack angle-2 statistics; (c) Shear crack angle-1 statistics; (d) Tension crack angle-1 statistics.
Sustainability 14 11766 g016
Figure 17. Statistics of the angular relationship of the meso-cracks in cracked rock samples at lower cycle times.
Sustainability 14 11766 g017
Figure 18. Internal contact force state during freezing of cracked rock samples.
Sustainability 14 11766 g018
Figure 19. 3-D contact force statistics of freeze–thaw process of cracked rock samples.
Sustainability 14 11766 g019
Table 1. Parameters of soft rock Freeze–Thaw cycle strength deterioration model.
ParametersValue
PBM tensile strength (MPa)10
PBM cohesion strength (MPa)18.8
PBM modulus (GPa)5.2
PBM friction (°)20
Ratio of normal to shear stiffness of parallel-bond1.2
Particle friction coefficient0.57
Density of particle (kg/m3)2600
Mean particle radius (mm)1.2
Publisher’s Note: MDPI stays neutral with regard to jurisdictional claims in published maps and institutional affiliations.

