Abstract
Aiming at the problems of holes, misclassification, and rough edge segmentation in building extraction results from high spatial remote sensing images, a coordinate attention mechanism fusion network based on the BASNet network (CA-BASNet) is designed for building extraction in high spatial remote sensing images. Firstly, the deeply supervised encoder–decoder network was used to create a rough extract of buildings; secondly, to make the network pay more attention to learning building edge features, the mixed loss function composed of binary cross entropy, structural similarity and intersection-over-union was introduced into the network training process; finally, the residual optimization module of fusion coordinate attention mechanism was used for post-processing to realize the fine extraction of buildings from high spatial resolution remote sensing images. Experiments on the WHU building dataset show that the proposed network can achieve mIoU of 93.43%, mPA of 95.86%, recall of 98.79%, precision of 90.13% and F1 of 91.35%. Compared with the existing semantic segmentation networks, such as PSPNet, SegNet, DeepLapV3, SE-UNet, and UNet++, the accuracy of the proposed network and the integrity of object edge segmentation are significantly improved, which proves the effectiveness of the proposed network.
1. Introduction
With increasing spatial resolution of remote sensing images, remote sensing images have a more obvious surface texture structure and rich edge information of ground [1]. Automatic building information extraction from high spatial resolution remote sensing images is of great significance to the construction of smart cities, which can improve the level of urban management and the efficiency of resource allocation, and also provide important references for urban planning, land management and disaster monitoring [2], so as to promote sustainable economic growth and higher quality of life. However, redundant ground object information is included in remote sensing images, such as building shadows and tree occlusion, which increase the difficulty of automatic building extraction [3]. In addition, different scales of objects exist: “different objects with the same spectrum” and “the same objects with different spectra” in high spatial resolution remote sensing images [4], leading to blurred edges and false detection when buildings are extracted. Therefore, it is of great significance to design an accurate building extraction network for high spatial resolution remote sensing images.
With the development of deep learning, building extraction methods have been developed from traditional to deep learning, and a series of methods have been studied by scholars. The traditional feature extraction method is mainly performed by analyzing the spectrum and texture of ground objects and using the features of ground objects, such as shape and topological relationship [5]. For example, Huang et al. [6] proposed a building change detection network based on multi-temporal high-resolution images of morphological building index, which could automatically identify the existence of buildings from high-resolution images. However, the network did not consider the brightness differences in each image, resulting in many buildings missing detection. Chen et al. [7] combined the edge rule index and shadow line index as the candidate new features obtained from the segmentation network to refine and detect the edges of buildings. Due to the change of illumination in this network, some roads and concrete areas were still misdivided into buildings. Avudaiammal et al. [8] used the support vector machine (SVM) classifier to extract urban buildings from satellite images based on the morphological building index. This network has a higher integrity of extraction, but its universality is not strong. Most of the ground objects are extracted using low-level features in traditional methods. However, due to different imaging conditions and mixed features between building classes [9], the automatic extraction of buildings remains very difficult.
With the development of deep learning technology and the increase in a large number of sample data, the building extraction network has achieved better results than traditional methods. High-level abstract features are extracted and perform better in complex scenes. At the same time, the robustness of semantic extraction method based on deep learning is significantly enhanced, mainly manifested in its generalization ability and extraction ability far exceeding that of traditional methods; the extraction cost is greatly reduced, and the economic benefits are constantly increased. For example, Ziaee et al. [10] proposed a new network G2G based on Pix2Pix network to solve the problem of inaccurate segmentation boundaries of buildings. Although the network improves the accuracy of building extraction, its applicability for building extraction in complex scenes is not high. Li et al. [11] designed a new deep interactive segmentation network through the interactive guided attention module, which can effectively extract the features of buildings, but the network still has the problem of rough edges when extracting buildings. Xu et al. [12], combined with multiscale features and the attention mechanism module, proposed the HA U-Net network based on U-Net to improve the real-time segmentation effect of buildings. Chen et al. [13] proposed a dense residual neural network DR-Net, which can efficiently extract building features by combining densely connected convolutional neural network and residual network structure, but the generalization ability of the network needs to be improved. Wei et al. [14] used the U2-Net semantic segmentation network to extract the contour of the building and further refined the edge detection of buildings by modifying the loss function of the network. In general, deep learning leads the development of extraction methods from building in a new direction. Building features are effectively extracted and segmentation accuracy is improved. However, there are still some problems, such as low edge accuracy in building extraction in complex scenes, holes, and error detection in large scale building extraction, which cannot meet the needs of efficient target extraction.
In order to solve the above problems and improve the accuracy of building extraction and edge integrity, this paper added the coordinate attention module (CA [15]) on the basis of BASNet [16] to propose the CA-BASNet network. The proposed network can maintain high spatial resolution semantic information while incorporating the CA attention mechanism to enhance the expression ability of network learning features, so as to reduce the problems of holes in buildings and rough edge segmentation and improve the accuracy of building extraction. This paper also provides some reference for promoting the intelligent management and operation of urban buildings and promoting the harmonious integration and sustainable development of cities and towns. The main contributions of this paper are given as follows:
- (1)
- A new high spatial resolution remote sensing images extraction network CA-BASNet is proposed to accurately obtain building areas and realize efficient building extraction.
- (2)
- A mixed loss function [16] composed of binary cross-entropy, structural similarity, and intersection and union ratio is introduced to reduce the influence of rough edge segmentation on building extraction and enhance the effect of building extraction.
- (3)
- The experimental results on the WHU building dataset show that compared with other building extraction networks, the proposed network achieves 9.66% and 7.94% improvement on mIoU and mPA, respectively.
2. Research Methods
In this paper, a coordinate attention mechanism fusion network based on the BASNet network (CA-BASNet) is designed to realize the effective extraction of high spatial resolution remote sensing images. The network uses deep supervision of the encoder–decoder structure in the BASNet network to supervise and predict the input image and capture the semantic information of the image. The edge features are learned by the mixed loss function, and the residual module fused with the CA attention mechanism is used for segmentation and optimization to obtain the high-quality building extraction results. The flow chart of the proposed method is shown in Figure 1.
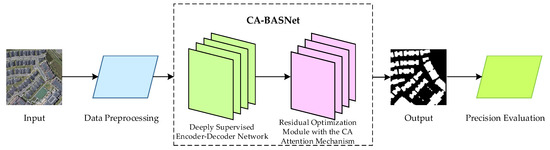
Figure 1.
Flow chart of the proposed method.
2.1. CA-BASNet
The BASNet network was proposed by Qin et al. [16] in 2021, and the network was originally used for edge enhanced segmentation of salient objects. This deep network has good integrity when the target boundary is extracted, and the segmentation result has high accuracy. Therefore, BASNet is used as the network foundation model in the proposed method. The BASNet network is mainly composed of two modules: a deeply supervised encoder–decoder structure and a residual optimization module. The deeply supervised encoder–decoder structure is a segmentation target prediction model, which captures global and local context information to improve the accuracy of building extraction. Then, the extracted feature map is passed into the residual optimization module to improve the uncertainty and rough edge of the image’s region. However, the spectral information of some buildings and ground objects in the image is similar and the roof scale is different, leading to adhesion and error detection during extraction. To solve the above problems, the CA-BASNet network is proposed in this paper, and its network is shown in Figure 2.
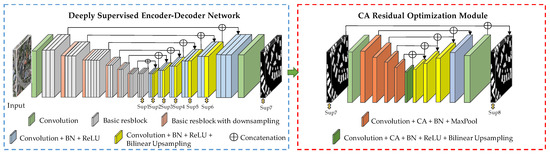
Figure 2.
The network structure of CA-BASNet.
2.1.1. Deeply Supervised Encoder–Decoder Network
The deeply supervised encoder–decoder structure consists of encoder layer, decoder layer, and bridge layer. The encoder part is made up of a convolution layer and six basic residual blocks. The convolution layer and the first four basic residual blocks are made up of 64 convolution filters with a size of 3 × 3 and a stride of 1. This part enables the network to obtain higher resolution feature maps and reduce the overall receptive field in the early training stage. The last two basic residual blocks are constructed from three basic residual modules and 512 convolution filters. The bridge layer is made up of three residual blocks, each of which consists of 512 atrous convolution [17] filters of size 3 × 3, batch normalization (BN) and the activation function of ReLU, with the aim of further obtaining global information and expanding the receptive field. The decoder layer is almost symmetric to the encoder layer, and the output of each encoder layer and the bridge layer is input as a 3 × 3 convolution layer of 3 × 3 size. The bilinear interpolation method is used for up-sampling to save memory and improve the network running speed. Finally, seven different resolution feature maps (sup1–7) were output by sigmoid function. At the same time, in order to prevent vanishing gradient in the training process, the information of the same layer encoder feature is transmitted to the same layer decoder feature through the concatenation operation.
2.1.2. CA Residual Optimization Module
In 2021, Hou et al. [15], National University of Singapore, referred to as CA, proposed a new mechanism of attention, coordinate attention. This attention mechanism takes advantage of its efficient capture of location information to accurately obtain the building area and reduce the error detection rate of building extraction. This attention mechanism embedded location information into channel attention and decomposed it into two one-dimensional feature encoding processes, which aggregated features along two spatial directions. In this way, remote dependencies can be captured along one spatial direction, while accurate location information can be retained along the other spatial direction, enhancing the performance of the BASNet network and improving the accuracy of building extraction. The implementation process of the CA attention mechanism is shown in Figure 3:

Figure 3.
Schematic of the CA module [16].
- (1)
- Global average pooling was performed on input feature maps in the height (H) and width (W) directions to obtain the feature maps of the two directions.
- (2)
- The two feature maps were concatenated and sent to a convolution module with a shared convolution kernel of 1 × 1, and its dimension was reduced to the original C/r (C represents the number of channels, r represents the compression ratio parameter). After batch normalization, the feature map of 1 × (W + H) × C/r was obtained.
- (3)
- The feature map was convolved by 1 × 1 according to the original height and width, and the feature map with the same number of channels was obtained.
- (4)
- After the operation of the sigmoid activation function, the attention weight feature maps in height and width were obtained, respectively. The final output feature map with CA attention was obtained by weighted multiplication operation between them and the original input feature map.
The network residual optimization module in the proposed method adopts the residual encoder–decoder architecture, which is composed of the convolution layer with a size of 3 × 3, encoder layer, the bridge layer, and the decoder layer. To accurately obtain the building area and reduce the misclassification of semantic segmentation, the CA attention mechanism is integrated into its encoder layer and bridge layer to enhance the expression ability of network learning features and realize the effective extraction of buildings. Figure 4 shows the CA residual optimization module. The encoder layer and decoder layer of the module have 4 convolution layers. Each convolution layer is composed of 64 convolution filters with a size of 3 × 3, CA attention mechanism, BN, and ReLU activation function. The bridge layer is similar to it and consists of 64 convolution filters of size 3 × 3, CA attention mechanism, BN and ReLU activation function. A non-overlapping max pooling layer was used in the down-sampling encoder layer to extract image features. Bilinear interpolation is used in the up-sampling decoder layer to recover the image size.
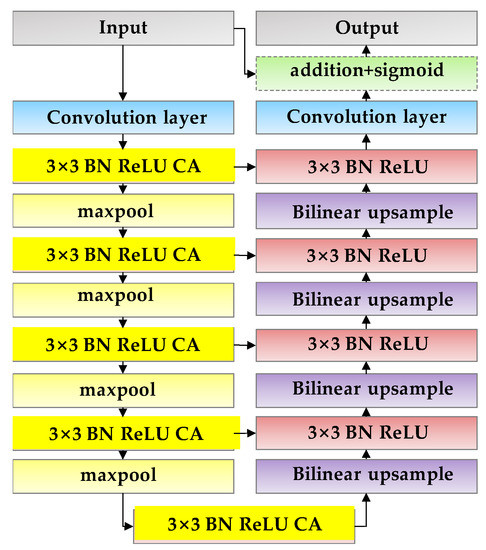
Figure 4.
CA residual optimization module.
2.1.3. Mixed Loss Function
The training loss function in this paper is defined as the weighted sum of each layer of loss:
where is the loss of the k-th side output, K represents the number of outputs, and is the weight of each loss. Section 2.1.1 shows that the building detection model is supervised by eight output feature maps, namely K = 8, which include seven outputs from the prediction model and one output from the optimization module.
The loss of each layer consists of a mixed loss function. Generally, the building segmentation will be affected by shadows and ground, resulting in fuzzy segmentation edges. To obtain high-quality target segmentation and clear boundary features, the mixed loss function is introduced as follows:
Among them, respectively, represent binary cross entropy (BCE) loss [18], structural similarity (SSIM) loss [19] and intersection-over-union (IoU) loss [20], which enables the network model to pay attention to the feature information at pixel level, object level, and image level. Thus, more accurate building extraction accuracy and edge integrity can be obtained.
BCE loss is a widely used binary cross-entropy loss function, and its formula is defined as:
where represents the truth label of the pixel , represents the predicted probability of the segmentation target.
SSIM loss is used to measure the structural similarity between two images x and y, which is defined as:
where is the average of x, is the average of y, is the variance of x, is the variance of y, is the covariance of x and y. , are constants used to maintain stability, L is the dynamic range of pixel values, , , the loss produced by each pixel is related to its nearby local block. Therefore, during network training, the loss value of the image edge will be strengthened, and the non-edge part will be inhibited, which makes the network in this paper pay more attention to the details of the image edge.
Initially used to measure the similarity of two sets, IoU loss has been gradually applied to object detection and semantic segmentation, which is defined as:
where represents the truth label of pixel ; represents the predicted probability of the segmentation object.
3. Experiment
3.1. Dataset
The training dataset used in the experiment comes from the WHU building dataset [21] made by the Ji Shunping team of Wuhan University, and the example image is shown in Figure 5. This dataset is divided into the aerial building dataset and the satellite building dataset. The aerial dataset [21] comes from Christchurch City, New Zealand, covering 220,000 buildings of different forms, with a ground resolution of 0.075 m and a coverage area of 450 km2, including a variety of ground object types. Most of the aerial images in the dataset were clipped to 8188 non-overlapping images with a pixel size of 512 × 512 pixels. At the same time, the dataset was divided into a training set with 4736 images, a validation set with 1036 images, and a test set with 2416 images.

Figure 5.
Example images of WHU datasets (the building background is (a) small scale, (b) multiscale and (c) large scale).
3.2. Implementation Details
The computer configuration used in the experiment is an Intel(R) I7-9700K CPU (Intel, Santa Clara, CA, USA), an NVIDIA GeForce GTX1070 graphics card (NVIDIA, Santa Clara, CA, USA), with 8 GB of video memory. The experiment randomly selected 1850 images from the training set for training and 1000 images from the test set for testing from the WHU dataset, with a pixel size of 512 × 152. The number of iterations is 100, the initial learning rate is 0.0001, the weight attenuation coefficient is 0, and the batch size in the training process is 2. The optimizer of the training network is set to Adam optimizer, and its hyperparameter is set to the default value.
3.3. The Evaluation Index
In order to analyze the segmentation accuracy of the network intuitively and effectively, mIoU and mPA are used to evaluate the overall accuracy of the test set. Precision, recall, and F1 were used as evaluation indexes to quantitatively evaluate the extraction accuracy for each scene image.
There are N + 1 classes (0, 1, …, k); usually, 0 denotes background. The calculation formula of each index is as follows:
In Formulas (6)–(10), i represents class i, the building target is defined as a positive sample, the background is defined as a negative sample, the correct prediction is “true”, otherwise it is “false”, and the true example (TP) represents the number of pixels of the real building predicted as the building. True negative example (TN) represents the number of pixels predicted as the background. The false positive example (FP) represents the number of pixels whose background pixels are predicted to be buildings, and the false negative example (FN) represents the number of pixels whose real building pixels are predicted to be background.
4. Discussion
4.1. Results and Analysis
In order to test the building extraction effect of CA-BASNet, this paper selects semantic segmentation classical networks PSPNet [22], SegNet [23], DeepLabV3 [24], SE-UNet [25] and UNet++ [26] as comparison methods. Performance tests were carried out on the WHU building dataset, and the test results are shown in Table 1. As can be seen from the table, the two indexes of mIoU and mPA of the proposed network reached 93.43% and 95.86%, respectively, and the segmentation accuracy of buildings in remote sensing images was significantly improved. Compared to other networks, the proposed network improved by 19.69%, 15.76%, 11.13%, 10.48%, and 9.66% on mIoU, respectively. The mPA was increased by 15.43%, 12.60%, 8.79%, 8.49%, and 7.49%, respectively. Furthermore, the recall was increased by 9.17%, 5.52%, 4.45%, 3.36%, and 2.70%, respectively. The precision was increased by 27.27%, 22.26%, 14.74, 14.39%, and 13.44%, respectively. In F1, it increased by 17.49%, 12.78%, 7.55%, 6.89%, and 6.05%, respectively. Compared with other networks, the network proposed in this paper has the highest value of each index and has high effectiveness for building segmentation.

Table 1.
Detection results of different networks.
4.1.1. Quantitative and Qualitative Analysis
In order to analyze the reasons for the differences in test performance of each network under different scenarios, small scale, multiscale, and large scale buildings in the test set were selected for quantitative and qualitative analysis. The selected prediction scenarios shown in Figure 6a–c respectively represent the buildings in different scenarios in the WHU building dataset, where the first line is the input image, and the second line is the corresponding ground truth. It can be seen from the figure that (a) the buildings in this picture are small in size but densely distributed, and the spectral information of some buildings is similar to that of the background area, which is easy to cause misclassification phenomenon during segmentation, resulting in an unsatisfactory final effect; in (b), the building scale types are diverse and the edge structure is complex, which leads to a high requirement for the complete edge extraction ability of the network; the buildings in (c) are large in size and prone to holes during segmentation, which requires a higher ability of the network to extract image features and integrate contextual information. Next, according to the images in (a–c), the reasons for the differences in test performance of each network were analyzed in three scenarios: small scale, multiscale and large scale.

Figure 6.
Example drawings of buildings in different scenarios ((a), small scale; (b), multiscale; (c), large scale).
- (1)
- Extraction results of small scale buildings
Table 2 and Figure 7 show the detection results and extraction in the small scale building scenario, respectively. According to the results in Table 2, compared to other networks, the proposed network achieves the best performance in all indexes in this scenario and the recall value is up to 98.13%. According to the visualization results of buildings in Figure 7, PSPNet and SegNet have a poor extraction effect in the segmentation of small scale buildings, and only the general outline is segmented. The other networks achieved good results in the segmentation of small scale buildings. However, from the input image, we can see that some buildings in the yellow box are densely arranged, which leads to adhesion phenomenon in DeepLabV3 and UNet++ during segmentation, and the misclassification is serious. Furthermore, the texture of the building in the lower left corner of the yellow box is similar to the surrounding environment, which causes DeepLabV3 to misclassify it as the buildings, and the rest of the network segmentation is better. The background area in the red box was very similar to the spectral information of the building and was blocked by trees; PSPNet, SegNet, DeepLabV3, SE-UNet, and UNet++, all missed the score. In this paper, the network segmentation effect is good and edge segmentation achieves satisfactory results, but there is also a phenomenon of misclassification in the red box. As can be seen from the table and figure, compared with other networks, the network proposed in this paper has a more complete feature extraction and a more complete effect on building edge processing.
Table 2.
Detection results of small scale building.
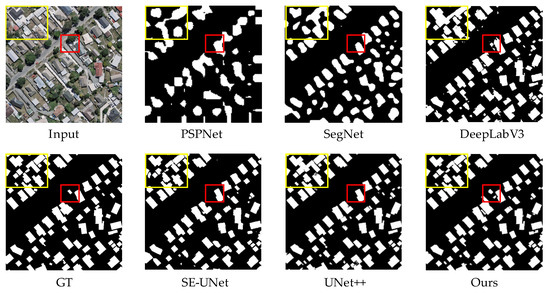
Figure 7.
Extraction result of small scale building.
- (2)
- Extraction results of multiscale buildings
Table 3 and Figure 8 show the detection results and extraction in the multiscale building scenario, respectively. According to the table, the network in this paper is optimal in all the five evaluation indicators, and mIoU, mPA, recall, precision, and F1 are 93.80%, 97.16%, 99.78%, 91.05% and 93.07%, respectively. As shown in the red box in Figure 8, when the building scales are different, the spacing is small and the density is large; except for the network proposed in this paper, PSPNet, SegNet, DeepLapV3, SE-UNet, and UNet++ all appear serious misclassification phenomenon. However, in PSPNet, SegNet, DeepLapV3, SE-UNET, and UNet++ networks, different degrees of building adhesion were found in the upper right corner of the red box. The visualization results show that the proposed network has a considerable extraction effect under the background of multiscale buildings, and the feature extraction of buildings is superior, and the extraction accuracy is significantly improved.
Table 3.
Detection results of multiscale building.
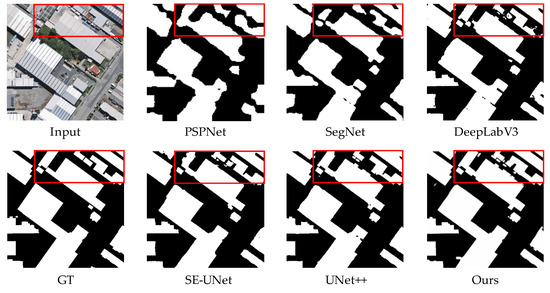
Figure 8.
Extraction result of multiscale building.
- (3)
- Extraction results of large scale buildings
Table 4 and Figure 9 show the detection results and extraction in the large scale building scenario, respectively. Compared to other network evaluation indicators, the network in this paper is still the best. As can be seen in Figure 9, the roof materials of large scale buildings are mixed, texture information is diverse, and there is shadow occlusion between different layers, which requires higher network extraction. As shown in the red box, the result of the segmentation of the proposed network in the large building area has the highest similarity with the ground truth value, the smallest holes appear inside and the most complete extraction of the building area. According to the extraction results, PSPNet and SegNet had a serious adhesion problem, and DeepLabV3, SE-UNet and UNet++ had varying degrees of adhesion. In terms of the missing score phenomenon, PSPNet, SegNet and DeepLabV3 have high miss rates, SE-UNet and UNet++ also have different degrees of miss scores, and the proposed network has the lowest miss rate. From the perspective of the constraint ability of the network edge, the proposed network has the best processing effect on the edge.
Table 4.
Detection results of large scale building.

Figure 9.
Extraction result of large scale building.
4.1.2. Ablation Experiments
In order to verify the effectiveness of the network proposed in this paper, an ablation experiment was performed on the WHU building dataset. The BASNet network, the network with different combinations of loss functions, and the proposed network were selected as comparisons, and mIoU, mPA, precision, recall, and F1 were selected as evaluation indicators to evaluate the accuracy of the network. Table 5 shows the results of the ablation experiments. As can be seen in Table 5, BASNet and the proposed network have strong adaptability to building scenarios, and overall accuracy has achieved good extraction results. The mixed loss network BASNet used in this paper has a better overall performance than other loss function combination networks, and the proposed network CA-BASNet has the best performance for each index. Compared to BASNet, CA-BASNet improved by 3.33% in mIoU; in mPA, it increased by 1.98%; mean recall was increased by 0.39%. Precision increased by 2.69%; gain 1.43% in F1. The buildings tested by each network were selected for visualization. From Table 5 and Figure 10, it can be seen that the extraction effect of the proposed network is significantly better; the missed detection rate is reduced, the adhesion problem is improved, the edge segmentation is also relatively complete, and the overall accuracy is higher.
Table 5.
Detection result of ablation tests.
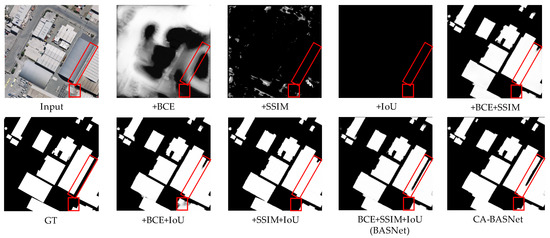
Figure 10.
Comparison of the results of the ablation experiment.
4.2. Theoretical Implications
From the above experimental results and analysis, we found that compared to other networks, the proposed network has a greater improvement in mIoU and mPA index, which verifies that the BASNet network integrated with the CA attention mechanism can effectively extract buildings from high-resolution remote sensing images. The theoretical implications are described as follows: in this paper, CA attention mechanism is added to the residual optimization processing module of the proposed network, and the characteristics of efficiently capturing location information of the mechanism are used to accurately obtain the building area. The problem of holes in the extraction results is greatly reduced, and the error detection rate of building extraction is reduced. At the same time, compared to the network with other loss functions, the network with the combination of three loss functions in this paper achieves better accuracy and higher edge integrity. According to Table 1 and visualization results in Figure 7, Figure 8, Figure 9 and Figure 10, the addition of CA attention mechanism and mixed loss function has a certain positive effect on the network training model. Under different architectural backgrounds, the proposed network can still achieve better results than PSPNet, SegNet, DeepLapV3, SE-UNet and UNet++ networks, which proves the practicability and superiority of the proposed network. However, under the background of dense and small scale buildings, there is still a misclassification phenomenon in the extraction of buildings, which is due to the similar spectral information between some buildings and the background area and the interference by other information objects. In subsequent work, it is necessary to study how to efficiently extract buildings under dense buildings.
4.3. Practical Implications
Based on the deep learning algorithm, related models and methods are constructed to realize the extraction of buildings from high-resolution remote sensing images in this paper. The proposed network greatly improves the accuracy of building extraction and proves the effectiveness of the proposed network. At the same time, timely and accurate acquisition of building information provides a certain data basis for rapid acquisition and update of data required by an urban spatial database, which is of great value in urban dynamic monitoring and smart town construction and provides a healthy and sustainable development policy for urban construction.
5. Conclusions
In this paper, CA-BASNet is proposed to improve the problems of building segmentation in high-resolution remote sensing images, such as holes and rough edges. It provides an important reference for the resource allocation and sustainable development of smart cities. The method in this paper learns richer global and local features from the shallow and deep layers through the deeply supervised encoder–decoder structure. In the training process, the mixed loss function is introduced to learn the building edge features, and the CA attention mechanism is added to the residual optimization module to enhance feature learning. The experimental results on the WHU building dataset show that the proposed network has higher mIoU (93.43%) and mPA (95.86%) compared to other networks and the BASNet network, greatly reducing holes in building segmentation, more complete extraction of edge information, and the best segmentation accuracy. However, according to the analysis of the visualization results, the network in this paper still has shortcomings in the extraction of dense and small scale buildings. In subsequent research, the parameters of the network model continue to be experimentally adjusted to achieve better extraction effects. The addition of other structures is considered on the basis of the proposed network to strengthen the robustness of the network.
Author Contributions
Funding acquisition, directing, and manuscript review, L.H.; designed the study, performed the research, analyzed data, and wrote the paper, J.Z.; project administration and supervision, M.Q.; source of formula, X.L.; translation of the research, S.Z. All authors discussed the results and revised the manuscript. All authors have read and agreed to the published version of the manuscript.
Funding
This research was funded by the National Natural Science Foundation of China (41961039), Yunnan Fundamental Research Projects (grant NO. 202201AT070164 and 202101AT070102).
Institutional Review Board Statement
Not applicable.
Informed Consent Statement
Not applicable.
Data Availability Statement
The WHU building dataset used in this article can be downloaded at https://study.rsgis.whu.edu.cn/pages/download/building_dataset.html (accessed on 15 November 2021).
Conflicts of Interest
The authors declare no conflict of interest.
References
- Zhou, Y.; Chen, Z.L.; Wang, B.; Li, S.J.; Liu, H.; Xu, D.Z.; Ma, C. BOMSC-Net: Boundary optimization and multi-scale context awareness based building extraction from high-resolution remote sensing imagery. IEEE Trans. Geosci. Remote Sens. 2022, 60, 5618617. [Google Scholar] [CrossRef]
- Das, P.; Chand, S. AttentionBuildNet for building extraction from aerial imagery. In Proceedings of the 2021 International Conference on Computing, Communication, and Intelligent Systems (ICCCIS), Noida, India, 19–20 February 2021. [Google Scholar]
- Abdollahi, A.; Pradhan, B.; Alamri, A.M. An ensemble architecture of deep convolutional Segnet and Unet networks for building semantic segmentation from high-resolution aerial images. Geocarto Int. 2020, 37, 3355–3370. [Google Scholar] [CrossRef]
- Zhang, H.Y.; Liao, Y.; Yang, H.H.; Yang, G.Y.; Zhang, L.P. A local–global dual-stream network for building extraction from very-high-resolution remote sensing images. IEEE Trans. Neural Netw. Learn. Sys. 2022, 33, 1269–1283. [Google Scholar] [CrossRef] [PubMed]
- He, H.; Wang, S.Y.; Zhao, Q.; Lv, Z.F.; Sun, D.W. Building extraction based on U-net and conditional random fields. In Proceedings of the 2021 6th International Conference on Image, Vision and Computing (ICIVC), Qingdao, China, 23–25 July 2021. [Google Scholar]
- Huang, X.; Zhang, L.P.; Zhu, T.T. Building change detection from multitemporal high-resolution remotely sensed images based on a morphological building index. IEEE J. Sel. Top. Appl. Earth Obs. Remote Sens. 2014, 7, 105–115. [Google Scholar] [CrossRef]
- Chen, R.X.; Li, X.H.; Li, J. Object-based features for house detection from RGB high-resolution images. Remote Sens. 2018, 10, 451. [Google Scholar] [CrossRef]
- Avudaiammal, R.; Elaveni, P.; Selvan, S.; Rajangam, V. Extraction of buildings in urban area for surface area assessment from satellite imagery based on morphological building Index using SVM classifier. J. Indian Soc. Remote Sens. 2020, 48, 1325–1344. [Google Scholar] [CrossRef]
- Yu, Y.T.; Ren, Y.F.; Guan, H.Y.; Li, D.L.; Yu, C.H.; Jin, S.H.; Wang, L.F. Capsule feature pyramid network for building footprint extraction from high-resolution aerial imagery. IEEE Geosci. Remote Sens. Lett. 2021, 18, 895–899. [Google Scholar] [CrossRef]
- Ziaee, A.; Dehbozorgi, R.; Doller, M. A novel adaptive deep network for building footprint segmentation. arXiv 2021, arXiv:2103.00286. [Google Scholar]
- Li, K.; Hu, X.Y. A deep interactive framework for building extraction in remotely sensed images via a coarse-to-fine strategy. In Proceedings of the 2021 IEEE International Geoscience and Remote Sensing Symposium IGARSS, Brussels, Belgium, 11–16 July 2021. [Google Scholar]
- Xu, L.L.; Liu, Y.J.; Yang, P.; Chen, H.; Zhang, H.Y.; Wang, D.; Zhang, X. HA U-Net: Improved model for building extraction from high resolution remote sensing imagery. IEEE Access 2021, 9, 101972–101984. [Google Scholar] [CrossRef]
- Chen, M.; Wu, J.J.; Liu, L.Z.; Zhao, W.H.; Tian, F.; Shen, Q.; Zhao, B.Y.; Du, R.H. DR-Net: An improved network for building extraction from high resolution remote sensing image. Remote Sens. 2021, 13, 294. [Google Scholar] [CrossRef]
- Wei, X.C.; Li, X.; Liu, W.; Zhang, L.P.; Cheng, D.; Ji, H.Y.; Zhang, W.Z.; Yuan, K. Building outline extraction directly using the U2-Net semantic segmentation model from high-resolution aerial images and a comparison study. Remote Sens. 2021, 13, 3187. [Google Scholar] [CrossRef]
- Hou, Q.B.; Zhou, D.Q.; Feng, J.S. Coordinate attention for efficient mobile network design. In Proceedings of the IEEE/CVF Conference on Computer Vision and Pattern Recognition, Nashville, TN, USA, 20–25 June 2021. [Google Scholar]
- Qin, X.B.; Fan, D.P.; Huang, C.Y.; Diagne, C.; Zhang, Z.C.; Sant’Anna, A.C.; Suarez, A.; Jagersand, M.; Shao, L. Boundary-aware segmentation network for mobile and web applications. arXiv 2021, arXiv:2101.04704. [Google Scholar]
- Yu, F.; Koltun, V.; Funkhouser, T. Dilated residual networks. In Proceedings of the 30th IEEE/CVF Conference on Computer Vision and Pattern Recognition, Honolulu, HI, USA, 21–26 July 2017. [Google Scholar]
- De Boer, P.T.; Kroese, D.P.; Mannor, S.; Rubinstein, R.Y. A tutorial on the cross-entropy method. Ann. Oper. Res. 2005, 134, 19–67. [Google Scholar] [CrossRef]
- Wang, Z.; Simoncelli, E.P.; Bovik, A.C. Multi-scale structural similarity for image quality assessment. In Proceedings of the 37th Asilomar Conference on Signals, Systems & Computers, Pacific Grove, CA, USA, 9–12 November 2003. [Google Scholar]
- Mattyus, G.; Luo, W.J.; Urtasun, R. DeepRoadMapper: Extracting Road Topology from Aerial Images. In Proceedings of the 16th IEEE International Conference on Computer Vision (ICCV), Venice, Italy, 22–29 October 2017. [Google Scholar]
- Ji, S.P.; Wei, S.Q.; Lu, M. Fully convolutional networks for multisource building extraction from an open aerial and satellite imagery data set. IEEE Trans. Geosci. Remote Sens. 2018, 57, 574–586. [Google Scholar] [CrossRef]
- Zhao, H.S.; Shi, J.P.; Qi, X.J.; Wang, X.G.; Jia, J.Y. Pyramid scene parsing network. In Proceedings of the 30th IEEE/CVF Conference on Computer Vision and Pattern Recognition (CVPR), Honolulu, HI, USA, 21–26 July 2017. [Google Scholar]
- Badrinarayanan, V.; Kendall, A.; Cipolla, R. SegNet: A deep convolutional encoder-decoder architecture for image segmentation. IEEE Trans. Pattern Anal. Mach. Intell. 2017, 39, 2481–2495. [Google Scholar] [CrossRef] [PubMed]
- Chen, L.C.; Papandreou, G.; Schroff, F.; Adam, H. Rethinking atrous convolution for semantic image segmentation. arXiv 2017, arXiv:1706.05587. [Google Scholar]
- Sofla, R.A.D.; Alipour-Fard, T.; Arefi, H. Road extraction from satellite and aerial image using SE-Unet. J. Appl. Remote Sens. 2021, 15, 014512. [Google Scholar] [CrossRef]
- Zhou, Z.W.; Siddiquee, M.M.R.; Tajbakhsh, N.; Liang, J.M. UNet++: Redesigning skip connections to exploit multiscale features in image segmentation. IEEE Trans. Med. Imaging 2020, 39, 1856–1867. [Google Scholar] [CrossRef] [PubMed]
Publisher’s Note: MDPI stays neutral with regard to jurisdictional claims in published maps and institutional affiliations. |
© 2022 by the authors. Licensee MDPI, Basel, Switzerland. This article is an open access article distributed under the terms and conditions of the Creative Commons Attribution (CC BY) license (https://creativecommons.org/licenses/by/4.0/).