Article

Production Capacity Reserve Strategy of Emergency Medical Supplies: Incentive Model for Nonprofit Organizations

1
School of Management Science, Chengdu University of Technology, Chengdu 610059, China
2
Department of Military Logistics, Army Logistics Academy, Chongqing 401331, China
3
School of Foreign Studies, East China University of Political Science and Law, Shanghai 200042, China
*
Author to whom correspondence should be addressed.
Sustainability 2022, 14(18), 11612; https://doi.org/10.3390/su141811612
Submission received: 24 July 2022 / Revised: 28 August 2022 / Accepted: 14 September 2022 / Published: 15 September 2022
(This article belongs to the Special Issue Sustainability in Emergency Supply Chain Management)

Abstract

:
In 2020, COVID-19 swept across the globe. To reduce the social harms caused by this public health event, nonprofit organizations (NPOs) cooperated with medical enterprises to produce reserves of emergency medical supplies. In practice, this cooperation was challenged by the different goals of NPOs and medical enterprises and the asymmetry of information between these parties. Enterprises are prone to irregularities or speculative behaviors that can result in insufficient production capacity during public health events, which increase disaster risks. Based on the principal–agent relationship of NPOs and enterprises, this study analyzed a game model between NPOs and enterprises under information asymmetry; constructed an incentive model for reserve emergency medical supply production capacity; and solved the optimal reward and punishment coefficients of NPOs, optimal effort level of enterprises, and benefits of disaster reduction. The study also verified the validity of the model using numerical examples and a sensitivity analysis. In taking up the findings of the study, this paper discusses the effects of several important exogenous variables on the optimal decision strategies of NPOs and enterprises and offers management-related insights for NPOs.

1. Introduction

Since 2020, the COVID-19 pandemic has affected almost all countries. By April 12, 2020, 1,696,588 confirmed cases of COVID-19 and 105,952 deaths had been reported worldwide. Unfortunately, the pandemic revealed that many nations were experiencing medical supply shortages. The World Health Organization [1] reported that a lack of medical supplies was preventing patients from receiving timely treatment. On 23 March 2020, the WHO further announced that the COVID-19 pandemic could exacerbate this existing shortage by affecting the production and supply of emergency medical supplies and their raw materials. In light of this issue, the establishment of a strong system for emergency medical reserves to reduce disaster risk has become an urgent concern.
Emergency medical supplies include reagents, masks, protective clothing, and other non-durable supplies. These supplies are all in high demand and have a short production cycle and shelf life. In the past, emergency medical supplies were mainly in the form of physical reserves, which required not only a large amount of money for procurement but also high capital costs for management, rotation, obsolescence disposal, and other reserve processes. In contrast, reserve production capacity can effectively reduce inventory costs, capital investment, and waste.
Usually, productive capacity is retained in a principal–agent relationship. The kind of actor that serves as the “principal” actor may vary across different settings; for example, the principal can be the government, the military, or a non-profit organization (NPO). Considering the functional similarities of these actors regarding the role of the principal, this paper simply treats NPOs as the principal. Meanwhile, it situates an enterprise as the agent. In the context of disaster management, the principal’s goal is to minimize the negative outcomes of a disaster, while the agent’s goal is to maximize their own interests. Evidently, when the objectives of both parties are not aligned, enterprises often fail to perform their duties seriously. In addition, in a case of information asymmetry in which a firm has an advantage of information sharing, NPOs cannot fully or accurately grasp the enterprise’s actual reserve capacity. If a firm receives a fixed subsidy, it may reduce its labor and material resources (thus maximizing its own interests at the expense of the principal’s interests), which may result in an actual level of effort that is much lower than the principal’s expectations [2].
To maximize disaster reduction, we need an incentive mechanism that can improve enterprises’ reserve emergency medical supply production capacities and eliminate or reduce the losses caused by their irregular operations or speculative behaviors. This study responds to this pressing need. Specifically, we designed a dual-incentive mechanism and determined the optimal reward and punishment coefficients necessary to promote enterprise reserve emergency medical supply production capacity in the context of a contract cooperation model between NPOs and enterprises. Our findings may guide decisions related to reserve emergency medical supply production capacity in ways that offer long-term benefits for both NPOs and enterprises.
This paper makes three notable contributions. First, it introduces a novel principal–agent model to describe the relationship between NPOs and enterprises in the context of reserve production capacity. Second, it presents an incentive model rooted in the dual indicators of enterprise production efficiency and sustained production capacity that considers the characteristics of reserve emergency medical supply production capacity. Third, it offers an analysis of this incentive model that yields insights into the intrinsic links between the benefits of disaster reduction, the incentive mechanism, optimal enterprise effort, and exogenous variables.

2. Literature Review

As suggested in the Introduction, the principal–agent relationship between NPOs and enterprises is characterized by the facts that enterprises tend to hold the superior position in information sharing relative to NPOs and that enterprises and NPOs do not pursue the same goals. Basu et al. [3] introduced principal–agent theory to corporate supply chain management and studied the incentive problems of salesperson compensation and production marketing based on the principal–agent relationship. Regarding incentive mechanisms, Holmstrom and Milgrom [4] designed a linear mechanism to reduce corporate moral hazard problems given information asymmetry. Subsequently, researchers have applied these early findings across various areas and fields. For instance, Chu and Sappongton [5] used principal–agent theory to analyze optimal purchase contracts under the condition of unobservable levels of supplier R&D effort. Meanwhile, Gary et al. [6] discussed two contractual incentives that allow manufacturers and suppliers to share product recall costs to induce quality improvement efforts. Additionally, Yan et al. [7] analyzed information asymmetries regarding transit costs and benefits in the transit supply chain system and designed an optimal incentive contract to promote information sharing in ways that may improve the chain’s overall efficiency.
Many scholars have extensively studied the incentive contract problem and applied incentive mechanisms to industries from the perspective of industry practices. For example, Cai and Singham [8] studied the impact of uncertainty in agent demand on principal contracts. Zhou et al. [9] studied the incentive problem of wage structure from the perspective of aversions to loss and unfairness. Nan et al. [10] applied dynamic incentive mechanisms to the field of collaborative communication. Euch et al. [11] used principal–agent theory to address the issue of appropriate fees for exchanges to attract platform traffic. Bi et al. [12] apply principal–agent theory to the field of IT project schedule risk control. Ai and Zhang [13] introduced incentives to the integrated circuit design industry to provide practical guidance for managers of companies. Yao et al. [14] considered a risk-averse owner who hires a risk-neutral contractor to negotiate and design an incentive contract with the contractor, without knowing information about the contractor’s overtime costs.
In addition, many scholars have applied incentive mechanisms in the field of project management to uncover how the relation between cost, profit, and project duration under information asymmetry may impact cooperation [15,16,17]. From the perspective of government entrustment, Lin Zhang and Tian [18] studied procurement and reserve cooperation between government departments and strategic suppliers, and discussed an optimal recycling replenishment strategy, along with an optimal government payment strategy. Zhao et al. [19] explored the appropriate optimal subsidy mechanism for green products from the perspective of maximizing net policy benefits, established an optimal subsidy delegated agent model, and provided an effective subsidy scheme for accelerating the development of green products and achieving sustainable development goals. Meanwhile, Wang et al. [20] analyzed government incentives and effort levels under conditions of information symmetry and asymmetry based on principal–agent theory; ultimately, they concluded that given information symmetry, the central government can help local governments reach the Pareto optimal effort level through the design of incentive contracts. In addition, experts have presented solutions to the optimal incentive strategy with consideration of the incentive compatibility constraint problem [21,22,23,24]. At present, principal–agent theory has been widely studied and applied, and the literature provides solid theoretical and operational support for our study of the principal–agent relationship between NPOs and enterprises, including our construction of an incentive model for reserve emergency medical supply production capacity.
To help reduce disaster risks and improve disaster relief capabilities, scholars have conducted considerable research on carrying out emergency material reserves. From a qualitative perspective, Wang et al. [25] identified common problems across Australia, Canada, China, and the US, such as insufficient types and quantities of emergency medical supply reserves and insufficient emergency production capacity; in response, they proposed that countries should improve their emergency medical supplies reserve systems and cooperation mechanisms. From a quantitative perspective, research has been mainly conducted on disaster preparedness, layout siting, and pricing incentives. In the area of disaster preparedness, Tanner et al. [26] studied the level of emergency reserves of college students. Hiroki et al. [27] analyzed the impact of disaster experience on household emergency supply reserves. Furthermore, Lin et al. [28] proposed big data-driven dynamic demand for disaster relief supplies from the perspective of uncontrolled distribution of a dynamic population estimation model. Hu et al. [29] developed a scenario-based two-stage stochastic planning model for emergency supplies allocation. Al-Hajj et al. [30] concluded that a nation’s emergency medical preparedness is critical to its disaster resilience preparedness. Additionally, some scholars have studied the emergency supplies reserve problem from the perspective of layout and site selection [31,32,33,34].
Meanwhile, in terms of emergency supplies mechanisms, Tamal et al. [35] designed a distribution model for scarce resources, such as food, water, clothing, medical equipment, and rescue workers, for post-disaster relief, and achieved effective coordination for resource allocation. Oluwasegun et al. [36] proposed a multi-phase stochastic planning model for the timely distribution of relief supplies. Ertem and Ertem [37] argued that multimodal transportation is more advantageous in emergency supplies delivery in disasters where transportation resources are scarce and infrastructure destruction is severe. Min and Jie [38,39] applied a two-stage stochastic equilibrium model to the storage and distribution of emergency supplies. Additionally, from the perspectives of pricing and incentives, some scholars have studied the pricing problem of emergency supplies procurement [40,41,42]. Gao and Tian [43] aimed to enhance the level of effort by constructing a multi-period physical reserve incentive model that would bring long-term benefits to the government and enterprises. Meanwhile, Yang et al. [44] introduced a reputation effect mechanism to the emergency material reserve system composed of the government and two enterprises; they found that a dynamic incentive model of an emergency material reserve system that accounts for the reputation effect can improve enterprise efforts. Some scholars have also introduced a supervision mechanism into the design of incentive contracts and built incentive models for a supervision mechanism [28,45,46].
In summary, research on incentive mechanisms for emergency supply reserves has focused on physical reserve incentives, while ignoring incentives for production capacity reserves. Given the obvious differences between reserve production capacity and physical reserves in terms of demand characteristics, capital investment, and storage patterns, it is unreasonable to apply the physical reserve incentive model to reserve production capacity under information asymmetry. Therefore, we analyzed the game of benefits between NPOs and enterprises in the context of reserve production capacity based on their principal–agent relationship. Subsequently, we constructed an incentive model for reserve emergency medical supply production capacity by introducing a bank loan discount policy under the condition of information asymmetry. Notably, we sought to determine the optimal reward and punishment coefficients of productivity and the sustained production capacity of NPOs, along with the optimal effort level of enterprises, which have important implications for management.

3. Variables and Assumptions

3.1. Parameter and Variable Definitions

The parameters and decision variables used throughout this paper are shown in Table 1.

3.2. Assumptions

To give practical significance to the incentive model of emergency medical supplies, we made the following assumptions without losing generality:
(1)
If one supposes that NPOs and the firm are completely rational, NPOs are risk-neutral, the firm is risk-averse, and the utility function of the firm is a Pratt–Arrow utility function, u ( x ) = e r x , r is the enterprise risk aversion coefficient. x is the real monetary income.
(2)
Assuming that NPOs and enterprises pursue different goals, the goal of NPOs is to maximize the benefits of disaster reduction; that of enterprises is to maximize the benefits, without affecting their own retained utility.
(3)
Assuming that the information held by NPOs and enterprises is asymmetric, NPOs cannot fully observe the level of the enterprises’ efforts, nor can they accurately obtain the private information of enterprises.
(4)
Enterprise effort has a linear influence on reserve production efficiency, sustainable production capacity, and NPOs’ income. Thus, the enterprises’ production efficiency reserve level is given as p = α 1 e + ε (considered a daily maximum output) and sustained production capacity is expressed as q = α 2 e + ζ (regarded as the total amount of continuous production of the enterprise). NPOs’ income is set as h e + ξ .
(5)
The NPOs’ production efficiency reward to enterprise reserve productive capacity can be expressed as ω 1 ( p P ) . When a disaster occurs, if the enterprise’s actual reserve production efficiency, p, is less than the reserve productivity, P, which is required by the NPOs, then the NPOs will follow the coefficient of ω 1 to punish the enterprise. Otherwise, NPOs will reward the enterprise according to the coefficient of ω 1 . The NPOs’ reward for the enterprise’s sustainable production capacity can be expressed as ω 2 ( q Q ) . That is, when a disaster occurs, if the actual sustainable production capacity level of the enterprise, q = α 2 e + ζ , is less than the level of sustained productivity, Q, required by the NPOs, then the NPOs will follow the coefficient of ω 2 to punish the enterprise. Otherwise, the NPOs will reward the enterprise according to the coefficient of ω 2 .
(6)
We replaced the cost of reserve production capacity with the cost of effort, which is related to the level of effort and the cost of production. Using the monetary cost representation, the effort cost function can be expressed as C ( e ) = m e + 1 2 n e 2 . The first and second derivatives of the cost of effort with respect to the level of effort are greater than zero and are as follows: C ( e ) > 0 and C ( e ) > 0 .

4. Design of the Incentive Contract Model

There is an interest game relation between NPOs and enterprises, in which the former are dominant and the latter are subordinate. The decision-making order and content of both sides are as follows. First, before an emergency occurs, NPOs entrust enterprises to maintain a particular reserve emergency medical supply production capacity, which may involve stocking raw materials and making production lines available for use, and help enterprises apply for discount loans. Second, the enterprise decides the effort allocated to its reserve production capacity. If a sudden disaster occurs during the reserve period, then the enterprise will convert its production capacity into physical objects for disaster relief, and NPOs will reward or punish the enterprise according to the set reward/punishment coefficients for its production efficiency and sustainable production capacity. If there is no sudden disaster, then NPOs do not need to reward or punish enterprises.

4.1. Analysis of the Enterprise Utility Function

NPOs adopt the linear contract; that is, the reserve productive capacity and the enterprise income function, f H . This function can be expressed as follows:
f H = y ( ω ) + τ ω 0 C ( e ) = ω 0 i φ + ω 1 ( α 1 e + ε P ) + ω 2 ( α 2 e + ζ Q ) + τ ω 0 m e 1 2 n e 2
The cost function of the agent storage enterprise is C ( e ) = m e + 1 2 n e 2 , given that ε ~ N ( 0 , σ 2 ) and ζ ~ N ( 0 , δ 2 ) . Therefore,
f H ~ N ( ω 0 i φ + ω 1 ( α 1 e + ε P ) + ω 2 ( α 2 e + ζ Q ) + τ ω 0 m e 1 2 n e 2 , ω 1 2 σ 2 + ω 2 2 δ 2 )
Because the enterprise’s reserve production capacity is risk-averse, the utility function expression of the enterprise adopts a common utility function expression in economics; namely, the coefficient of relative risk aversion. r indicates the constant relative risk aversion coefficient. Thus, u ( f H ) = exp ( r f H ) , and the expected value of the utility function of the production capacity reserve enterprise, E u ( f H ) , is given as follows:
E [ u ( f H ) ] = + e r f H 1 2 π V a r ( f H ) e ( f H E ( f H ) ) 2 2 V a r ( f H ) d f H = 1 2 π V a r ( f H ) + e ( ( f H E ( f H ) + r V a r ( f H ) ) 2 2 V a r ( f H ) + r ( E ( f H ) r V a r ( f H ) 2 ) d f H = e r ( E ( f H ) r V a r ( f H ) 2 ) 1 2 π V a r ( f H ) + e ( ( f H E ( f H ) + r V a r ( f H ) ) 2 2 V a r ( f H ) ) d f H = e r ( E ( f H ) r V a r ( f H ) 2 )
To solve the model conveniently, we used the certainty equivalent, x(a), to represent the expected value of the utility function of the agent storage enterprise, Π H . The meaning of the certainty equivalent can be explained as follows: if u(x(a)) = Eu(W), then x(a) is the certainty equivalent income of W. According to the definition above, x ( a ) = E ( f H ) r V a r ( f H ) 2 and Π H is as follows:
Π H = ω 0 i φ + ω 1 ( α 1 e P ) + ω 2 ( α 2 e Q ) + τ ω 0 m e 1 2 n e 2 r 2 ( ω 1 2 σ 2 + ω 2 2 δ 2 )

4.2. Utility Function Analysis of NPOs

NPOs’ revenue is a social benefit called the disaster mitigation benefit. This is because it carries out reserve production capacity and adequate pre-disaster prevention work. Therefore, the benefit function of NPOs is as follows:
g z = h e + ξ [ ω 0 i φ + ω 1 ( α 1 e + ε P ) + ω 2 ( α 2 e + ζ Q ) ]
As NPOs are risk-neutral, the expected value of the utility function of the NPO, Π Z , is equal to the expected value of its payoff function, which can be expressed as follows:
Π Z = ( h ω 1 α 1 ω 2 α 2 ) e + ω 1 P + ω 2 Q ω 0 i φ

4.3. Construction of Incentive Model

Based on the modeling analysis above, we constructed an incentive contract for the principal–agent relationship between NPOs and enterprises. By setting the incentive function with the objective of maximizing the disaster reduction benefit, the objective function can be expressed as follows:
max Π Z ω 1 . ω 2 = ( h ω 1 α 1 ω 2 α 2 ) e + ω 1 P + ω 2 Q ω 0 i φ
Next, we defined the participation and incentive constraints of the enterprises. Regarding the participation constraints, we assume that u ( f H ) is the highest opportunity utility function brought by the input cost, C ( e , a ) , of the agent storage enterprise, where f H is the opportunity income of the enterprise (in practice, the value can be selected by referring to the average profit rate of the industry). When the expected revenue is less than the maximum opportunity revenue, the storage agent will not sign a production capacity reserve contract with NPOs. In such a case, the expression of the firm’s participation constraint is E u ( f H ) u ( f H ) . This condition is equivalent to the certainty equivalent income of the enterprise being higher than its opportunity income:
ω 0 i φ + ω 1 ( α 1 e P ) + ω 2 ( α 2 e Q ) + τ ω 0 m e 1 2 n e 2 r ( ω 1 2 σ 2 + ω 2 2 δ 2 ) 2 f H
Meanwhile, as we hypothesized, the productive capacity reserve enterprise has a risk-averse attitude toward risk, and the premise of its cooperation with NPOs is the ensured maximization of its own interests, Π H . Therefore, the incentive constraint in the model is the maximization of the firm’s deterministic equivalent revenue, which can be expressed as follows:
max Π H e = ω 0 i φ + ω 1 ( α 1 e P ) + ω 2 ( α 2 e Q ) + τ ω 0 m e 1 2 n e 2 r ( ω 1 2 σ 2 + ω 2 2 δ 2 ) 2
In sum, we obtained the objective function and constraint conditions of the model. The incentive model of the reserve system for emergency medical supplies constructed in this study can be shown as follows:
max Π Z ω 1 . ω 2 = ( h ω 1 α 1 ω 2 α 2 ) e + ω 1 P + ω 2 Q ω 0 i φ s . t . ω 0 i φ + ω 1 ( α 1 e P ) + ω 2 ( α 2 e Q ) + τ ω 0 m e 1 2 n e 2 r ( ω 1 2 σ 2 + ω 2 2 δ 2 ) 2 f H max Π H e = ω 0 i φ + ω 1 ( α 1 e P ) + ω 2 ( α 2 e Q ) + τ ω 0 m e 1 2 n e 2 r ( ω 1 2 σ 2 + ω 2 2 δ 2 ) 2 ω 1 . ω 2 0

5. Model Analysis

The incentive model for reserve emergency medical supply production capacity is a bi-level optimization problem, which is difficult to solve directly. The approach toward the enterprise incentive constraints is crucial to transforming the bi-level optimization problem into a single-level one. First, we transform the incentive and constraint conditions of enterprises in Model 9. We solved for the first and second order derivatives of the enterprise’s deterministic equivalent income, Π H , with respect to its own level of effort, e.
Specifically, given that Π H e = ω 1 α 1 + ω 2 α 2 m n e , 2 Π H e 2 = n , n < 0 , then Π H is judged to be a concave function, indicating an optimal level of effort. If Π H e = ω 1 α 1 + ω 2 α 2 m n e = 0 , this yields the following equation:
e * = ω 1 α 1 + ω 2 α 2 m n
The incentive function constraint is represented by Equation (10). In order to solve the conditional extremum problem with inequality, we introduce Lagrangian multipliers β 1 and β 2 to deal with the participation constraint, Π H f H , in Model 9.
F ( ω 1 , ω 2 , β 1 , β 2 ) = ( h ω 1 α 1 ω 2 α 2 ) e + ω 1 P + ω 2 Q ω 0 i ϕ + β 1 ( Π H f H ) + β 2 ( ω 1 α 1 + ω 2 α 2 m n e * )
According to the KKT condition, β 1 = i φ i φ + τ 0 , which makes the “participation constraint” a tight constraint.
Bringing the participation and incentive constraints into the objective function yields the following equation:
max Π Z ω 1 . ω 2 = ( h m ) e 1 2 n e 2 + τ ω 0 r ( ω 1 2 σ 2 + ω 2 2 δ 2 ) 2 f H = ( h m ) ( ω 1 α 1 + ω 2 α 2 m ) n ( ω 1 α 1 + ω 2 α 2 m ) 2 2 n r ( ω 1 2 σ 2 + ω 2 2 δ 2 ) 2 + τ ω 0 f H
The Hesse matrix is given as
2 Π z ω 1 2 Π z ω 1 ω 2 Π z ω 2 ω 1 2 Π z ω 2 2 = r ( α 1 2 δ 2 + α 2 2 σ 2 ) n + r 2 σ 2 δ 2 > 0 ,
providing an optimal solution.
If Π z ω 1 = 0 , Π z ω 2 = 0 , the following equations can be obtained:
ω 1 * = h α 1 δ 2 n r σ 2 δ 2 + α 1 2 δ 2 + α 2 2 σ 2
ω 2 * = h α 2 σ 2 n r σ 2 δ 2 + α 1 2 δ 2 + α 2 2 σ 2
Integrating Equations (13) and (14) into Equation (10) yields the following equation:
e * = h n α 1 2 δ 2 + α 2 2 σ 2 n r σ 2 δ 2 + α 1 2 δ 2 + α 2 2 σ 2 m n
Proposition 1.
In the case of information asymmetry, the optimal productivity reward and punishment coefficient for NPOs ω 1 * decreases with the increase in the variance in the random factor ε , the risk of the enterprise avoidance coefficient, r, the variable input cost, n, and the sustainable production capacity of the enterprise α 2 . Likewise, it increases with the increase in the conversion coefficient of disaster reduction efficiency, h, and the variance in the random factor ζ . It increases first and then decreases with the increase in the production efficiency of the enterprise α 1 .
Proof of Proposition 1.
In Equation (13), one can solve the first-order derivative of the optimal productivity reward and punishment coefficient ω 1 * with respect to ε , ζ , r, n, h, and α 1 , and obtain ω 1 * σ 2 = h α 1 δ 2 ( δ 2 n r + α 2 2 ) ( n r σ 2 δ 2 + α 1 2 δ 2 + α 2 2 σ 2 ) 2 < 0 , α 2 ω 1 * δ 2 = α 1 α 2 2 σ 2 h ( n r σ 2 δ 2 + α 1 2 δ 2 + α 2 2 σ 2 ) 2 > 0 , ω 1 * r = h α 1 δ 4 σ 2 n ( n r σ 2 δ 2 + α 1 2 δ 2 + α 2 2 σ 2 ) 2 < 0 , ω 1 * n = h α 1 δ 4 σ 2 r ( n r σ 2 δ 2 + α 1 2 δ 2 + α 2 2 σ 2 ) 2 < 0 , ω 1 * h = α 1 δ 2 ( n r σ 2 δ 2 + α 1 2 δ 2 + α 2 2 σ 2 ) 2 < 0 , ω 1 * α 2 = 2 h α 1 δ 2 α 2 σ 2 ( n r σ 2 δ 2 + α 1 2 δ 2 + α 2 2 σ 2 ) 2 < 0 , ω 1 * α 1 = h δ 2 [ ( n r σ 2 α 1 2 ) δ 2 + α 2 2 σ 2 ] ( n r σ 2 δ 2 + α 1 2 δ 2 + α 2 2 σ 2 ) 2 . □
If 0 < α 1 < n r δ 2 + α 2 2 σ δ , then ω 1 * α 1 = h δ 2 [ ( n r σ 2 α 1 2 ) δ 2 + α 2 2 σ 2 ] ( n r σ 2 δ 2 + α 1 2 δ 2 + α 2 2 σ 2 ) 2 > 0 . Under this condition, the optimal productivity reward and punishment coefficient of NPOs, ω 1 * , increases as the enterprise’s productivity, α 1 , increases. If α 1 > n r δ 2 + α 2 2 σ δ , then ω 1 * α 1 = h δ 2 [ ( n r σ 2 α 1 2 ) δ 2 + α 2 2 σ 2 ] ( n r σ 2 δ 2 + α 1 2 δ 2 + α 2 2 σ 2 ) 2 < 0 . Under this condition, the optimal productivity reward and punishment coefficient for NPOs, ω 1 * , decreases as the productivity of the enterprise, α 1 , increases.
Proposition 1 shows that under information asymmetry, the more the enterprise’s production efficiency is affected by random factors not related to effort level—such as temperature, humidity, labor, and production equipment failures—the more variable costs are invested, the weaker the enterprise’s ability to take risks, and the more difficult it is for the enterprise to improve its emergency medical supply production efficiency. Moreover, the enterprise is prone to negativity, which leads to a lowered optimal production efficiency reward and punishment coefficient set by the NPO.
Proposition 2.
The optimal sustainable production capacity reward and punishment coefficient decreases as the variance in the sustainable supply capacity random factor of the supply chain, enterprise risk aversion coefficient, variable input cost, and enterprise productivity increase. Meanwhile, it increases as the conversion factor of disaster reduction efficiency increases and decreases as the enterprise’s sustained production capacity first increases and then decreases.
Proof of Proposition 2.
In Equation (14), one can solve the first-order derivative of the optimal productivity reward and punishment coefficient, ω 2 * , with respect to ε , ζ , r, n, h, and α 1 and obtain ω 2 * σ 2 = α 1 2 σ 2 h α 2 ( n r σ 2 δ 2 + α 1 2 δ 2 + α 2 2 σ 2 ) 2 > 0 , ω 2 * δ 2 = h α 2 σ 2 ( σ 2 n r + α 1 2 ) ( n r σ 2 δ 2 + α 1 2 δ 2 + α 2 2 σ 2 ) 2 < 0 , ω 2 * r = n h α 2 σ 4 δ 2 ( n r σ 2 δ 2 + α 1 2 δ 2 + α 2 2 σ 2 ) 2 < 0 , ω 2 * n = r h α 2 σ 4 δ 2 ( n r σ 2 δ 2 + α 1 2 δ 2 + α 2 2 σ 2 ) 2 < 0 , ω 2 * h = α 2 σ 2 n r σ 2 δ 2 + α 1 2 δ 2 + α 2 2 σ 2 > 0 , ω 2 * α 1 = 2 h α 1 α 2 σ 2 δ 2 ( n r σ 2 δ 2 + α 1 2 δ 2 + α 2 2 σ 2 ) < 0 , ω 2 * α 2 = σ 2 h [ ( n r σ 2 δ 2 + α 1 2 δ 2 α 2 2 σ 2 ] ( n r σ 2 δ 2 + α 1 2 δ 2 + α 2 2 σ 2 ) 2 . □
If 0 < α 2 < n r σ 2 + α 1 2 δ σ , then ω 2 * α 2 = σ 2 h [ ( n r σ 2 δ 2 + α 1 2 δ 2 α 2 2 σ 2 ] ( n r σ 2 δ 2 + α 1 2 δ 2 + α 2 2 σ 2 ) 2 > 0 . Under this condition, the optimal sustained production capacity coefficient, ω 2 * , increases as the enterprise’s sustained production capacity, α 2 , increases. If α 2 > n r σ 2 + α 1 2 δ σ , then ω 2 * α 2 = σ 2 h [ ( n r σ 2 δ 2 + α 1 2 δ 2 α 2 2 σ 2 ] ( n r σ 2 δ 2 + α 1 2 δ 2 + α 2 2 σ 2 ) 2 < 0 . Under this condition, the optimal sustained capacity coefficient of reward and punishment, ω 2 * , decreases as the enterprise’s sustained capacity, α 2 , increases.
Proposition 2 shows that under information asymmetry, the more the sustained production capacity of an enterprise is affected by random factors that are not related to its level of effort (e.g., supply chain reliability and production line sustained production stability), the more variable costs are invested and the weaker the ability to take risks. Consequently, the enterprise has more difficulty enhancing its sustained emergency medical supply production capacity and becomes prone to negative idleness. Therefore, the optimal reward and punishment coefficient for the enterprise’s sustained production capacity set by the NPOs would be lower. When the enterprise’s sustainable production capacity is weak, the NPOs’ optimal sustainable production capacity reward and punishment coefficient is positively correlated with the enterprise’s sustainable production capacity, within which the NPOs are most effective in rewarding and punishing the enterprise’s sustainable production capacity. When the enterprise’s sustainable production capacity exceeds a certain level, then the enterprise supply chain management has reached a particular level, and the optimal sustained production capacity reward and punishment coefficient of NPOs decreases instead, tending toward a stable state.
Proposition 3.
With information asymmetry, the enterprise’s optimal level of effort, e * , decreases with an increase in the variance in random factors, ε and ζ ; the enterprise’s risk aversion coefficient, r; the marginal cost of conventional inputs, m; and the marginal cost of variable inputs, n. It also increases with increases in the conversion coefficient of disaster reduction benefits, h, the enterprise’s production efficiency, α 1 , and sustained production capacity, α 2 .
Proof of Proposition 3.
In Equation (15), we can solve the first-order condition for the enterprise’s optimal level of effort, with respect to ε , ζ , r, m, n, h, α 1 , and α 2 , to obtain e * σ 2 = α 1 2 δ 4 h r ( n r σ 2 δ 2 + α 1 2 δ 2 + α 2 2 σ 2 ) 2 < 0 , e * δ 2 = α 2 2 σ 4 h r ( n r σ 2 δ 2 + α 2 2 σ 2 + α 1 2 δ 2 ) 2 < 0 , e * r = σ 2 δ 2 h ( α 1 2 δ 2 + α 2 2 σ 2 ) ( n r σ 2 δ 2 + α 1 2 δ 2 + α 2 2 σ 2 ) 2 < 0 , e * m = 1 n < 0 , e * n = ( m h ) δ 4 α 1 2 ( α 1 2 + 2 n r σ 2 ) + ( m h ) α 2 2 σ 2 ( 2 n r σ 2 + 2 α 1 2 + α 2 2 σ 2 ) + m n 2 r 2 σ 4 ( n r σ 2 δ 2 + α 1 2 δ 2 + α 2 2 σ 2 ) 2 n 2 < 0 , e * h = α 1 2 δ 2 + α 2 2 σ 2 ( n r σ 2 δ 2 + α 1 2 δ 2 + α 2 2 σ 2 ) n > 0 , e * α 1 = 2 α 1 δ 4 h r σ 2 ( n r σ 2 δ 2 + α 1 2 δ 2 + α 2 2 σ 2 ) 2 > 0 , e * α 2 = 2 α 2 δ 2 h r σ 4 ( n r σ 2 δ 2 + α 1 2 δ 2 + α 2 2 σ 2 ) 2 > 0 . □
Proposition 3 shows that under information asymmetry, the more the enterprise is influenced by external random factors, the more fixed and variable costs are invested, the weaker the ability to take risks, and the more likely it is to experience burnout or demonstrate lazy behavior, which lower its effort level. Meanwhile, the higher the enterprise’s production efficiency and sustainable production capacity, the more perfect and mature its supply chain management system, the easier it is for it to improve its efforts, and the more disaster reduction benefits are obtained.

6. Numerical Simulation

6.1. Calculation Example

Based on the above model solving analysis, we set the relevant parameters in the model to conduct a deeper analysis of the complex relation between the variables as follows: Q = 10 , r = 0.8 , h = 20 , α 1 = 2 , α 2 = 1.5 , P = 3 , τ = 0.1 , m = 1 , n = 1 , f H = 20 , ω 0 = 30 , σ 2 = 1 , δ 2 = 1 , i = 0.1 , ϕ = 1 . Under the condition of information asymmetry, the optimal reward and punishment coefficients for the production efficiency of NPOs is ω 1 * = 5.6738 ; the reward and punishment coefficients for sustained production capacity is ω 2 * = 4.2553 ; NPO earnings are Π z = 140.8050 ; optimal enterprise effort is e* = 16.7306; and enterprise earnings are Π H = 20 .

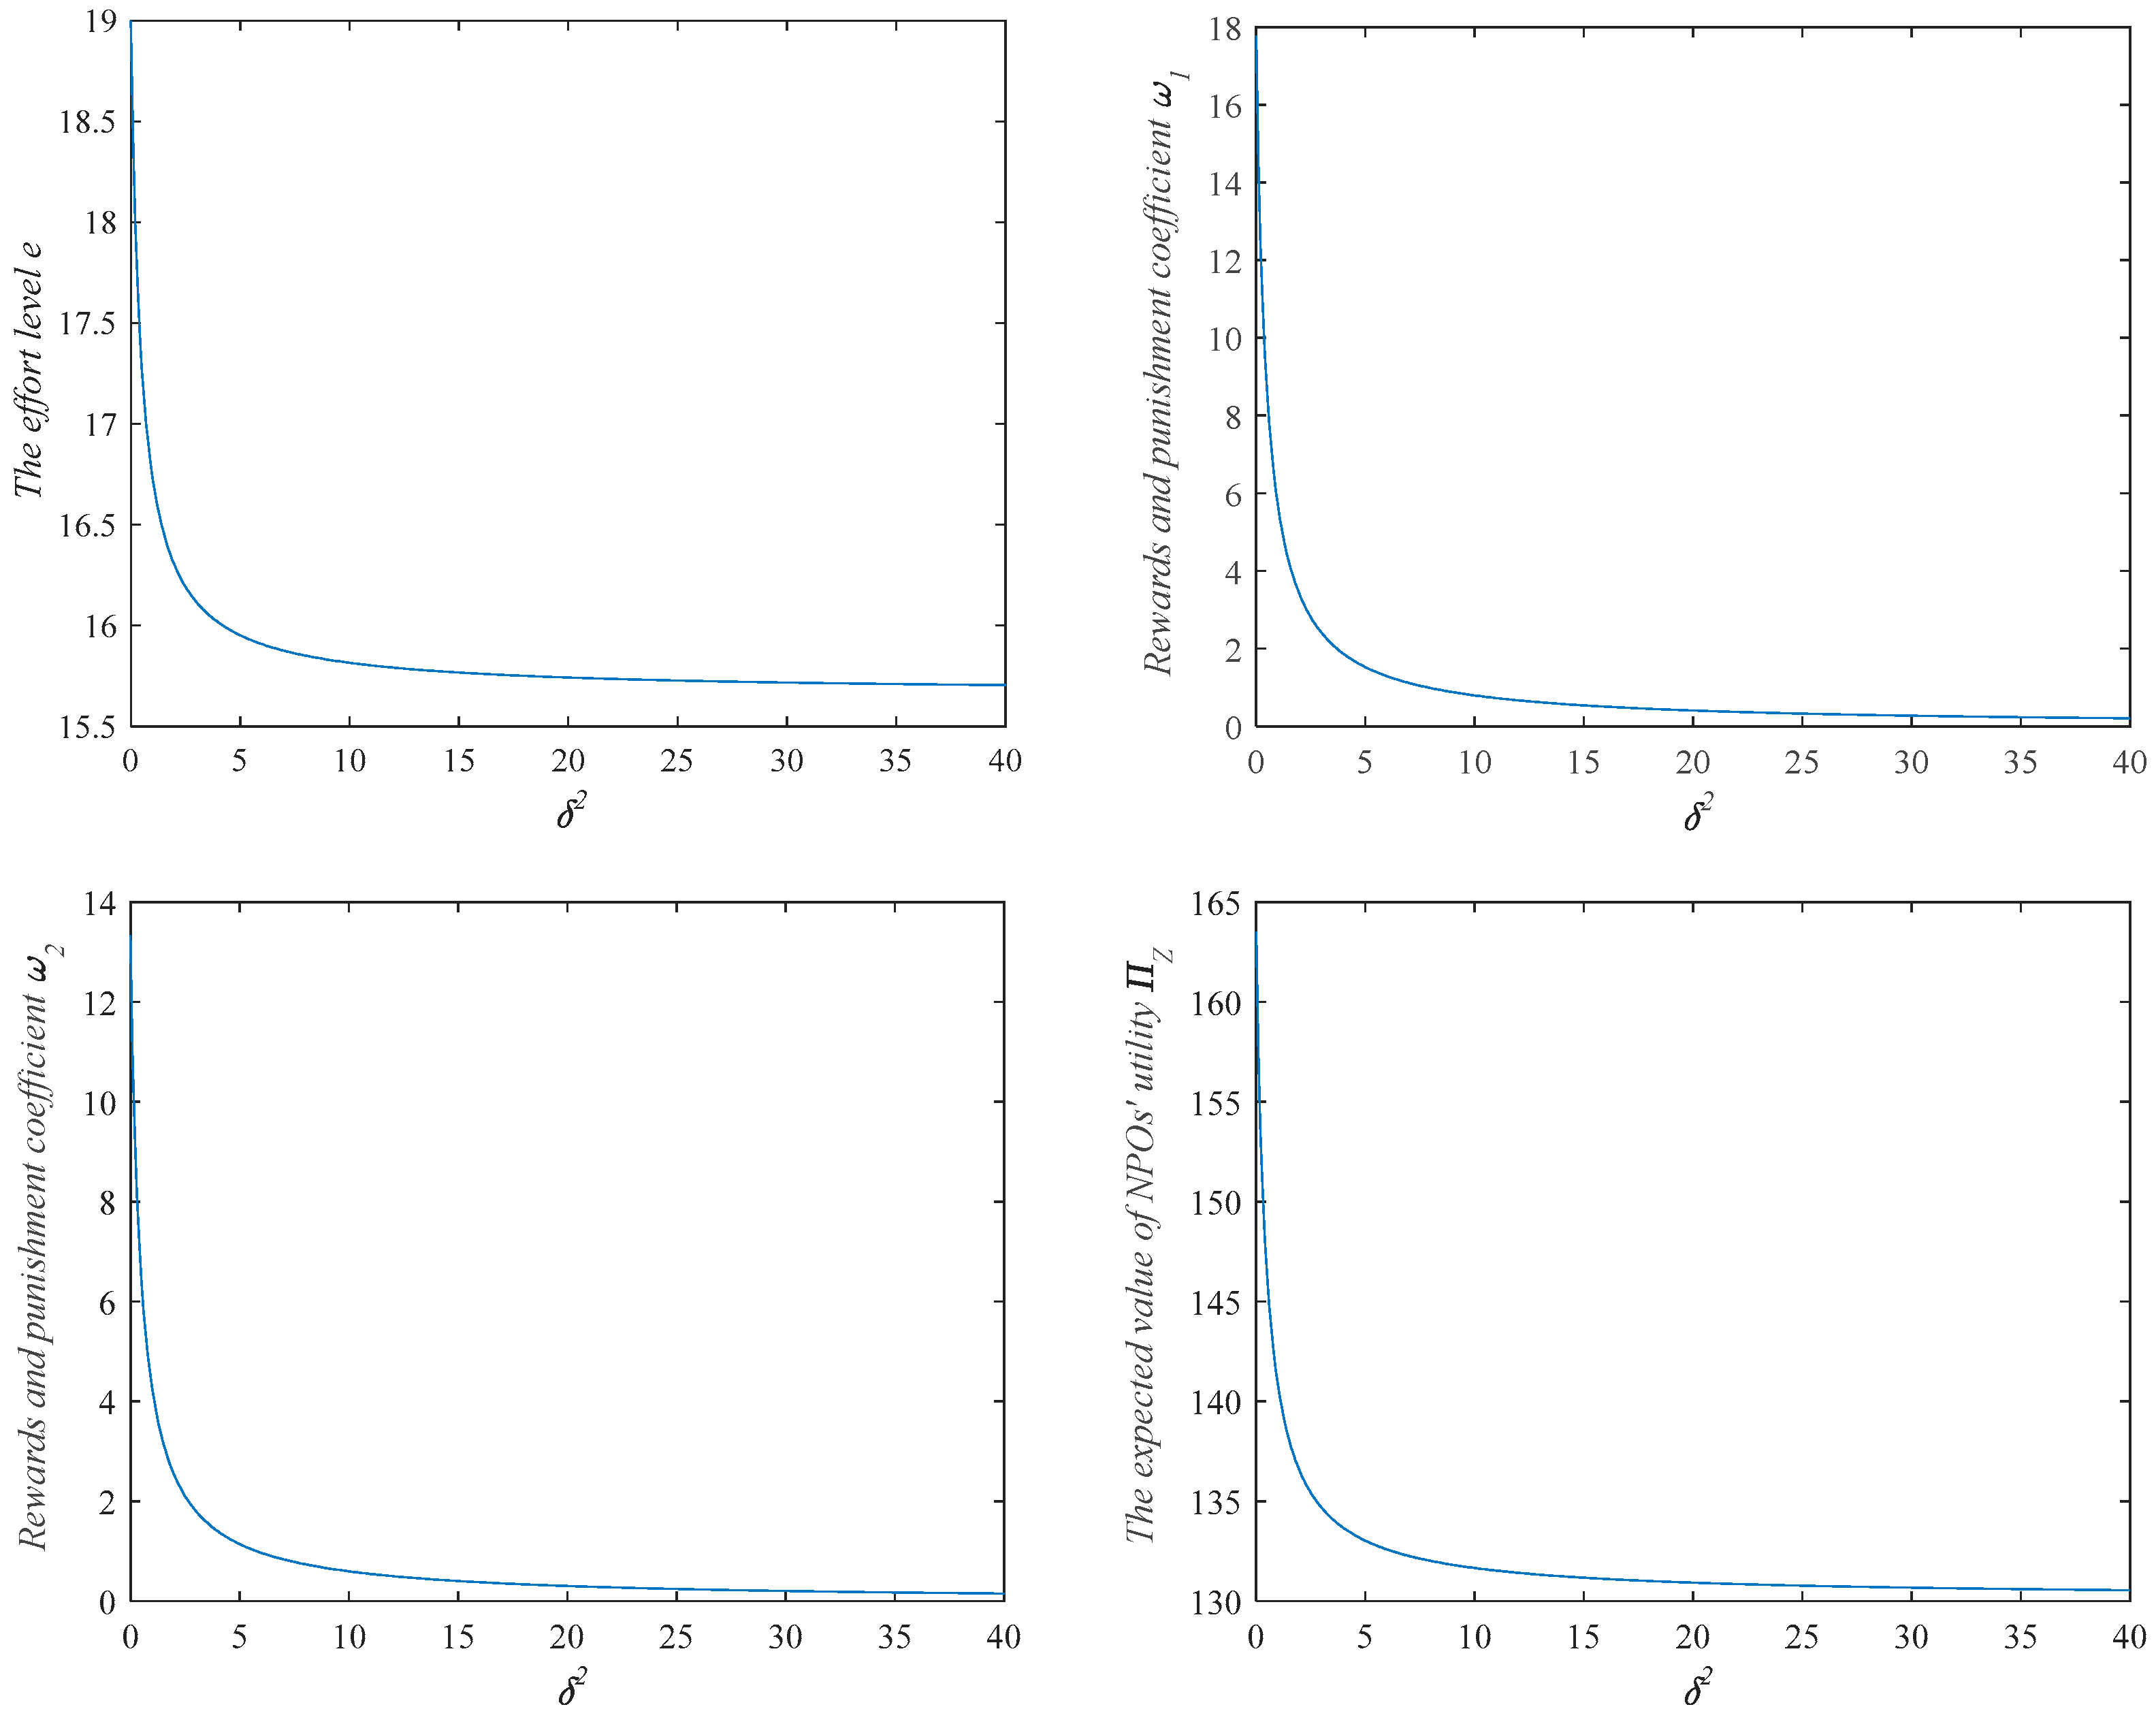
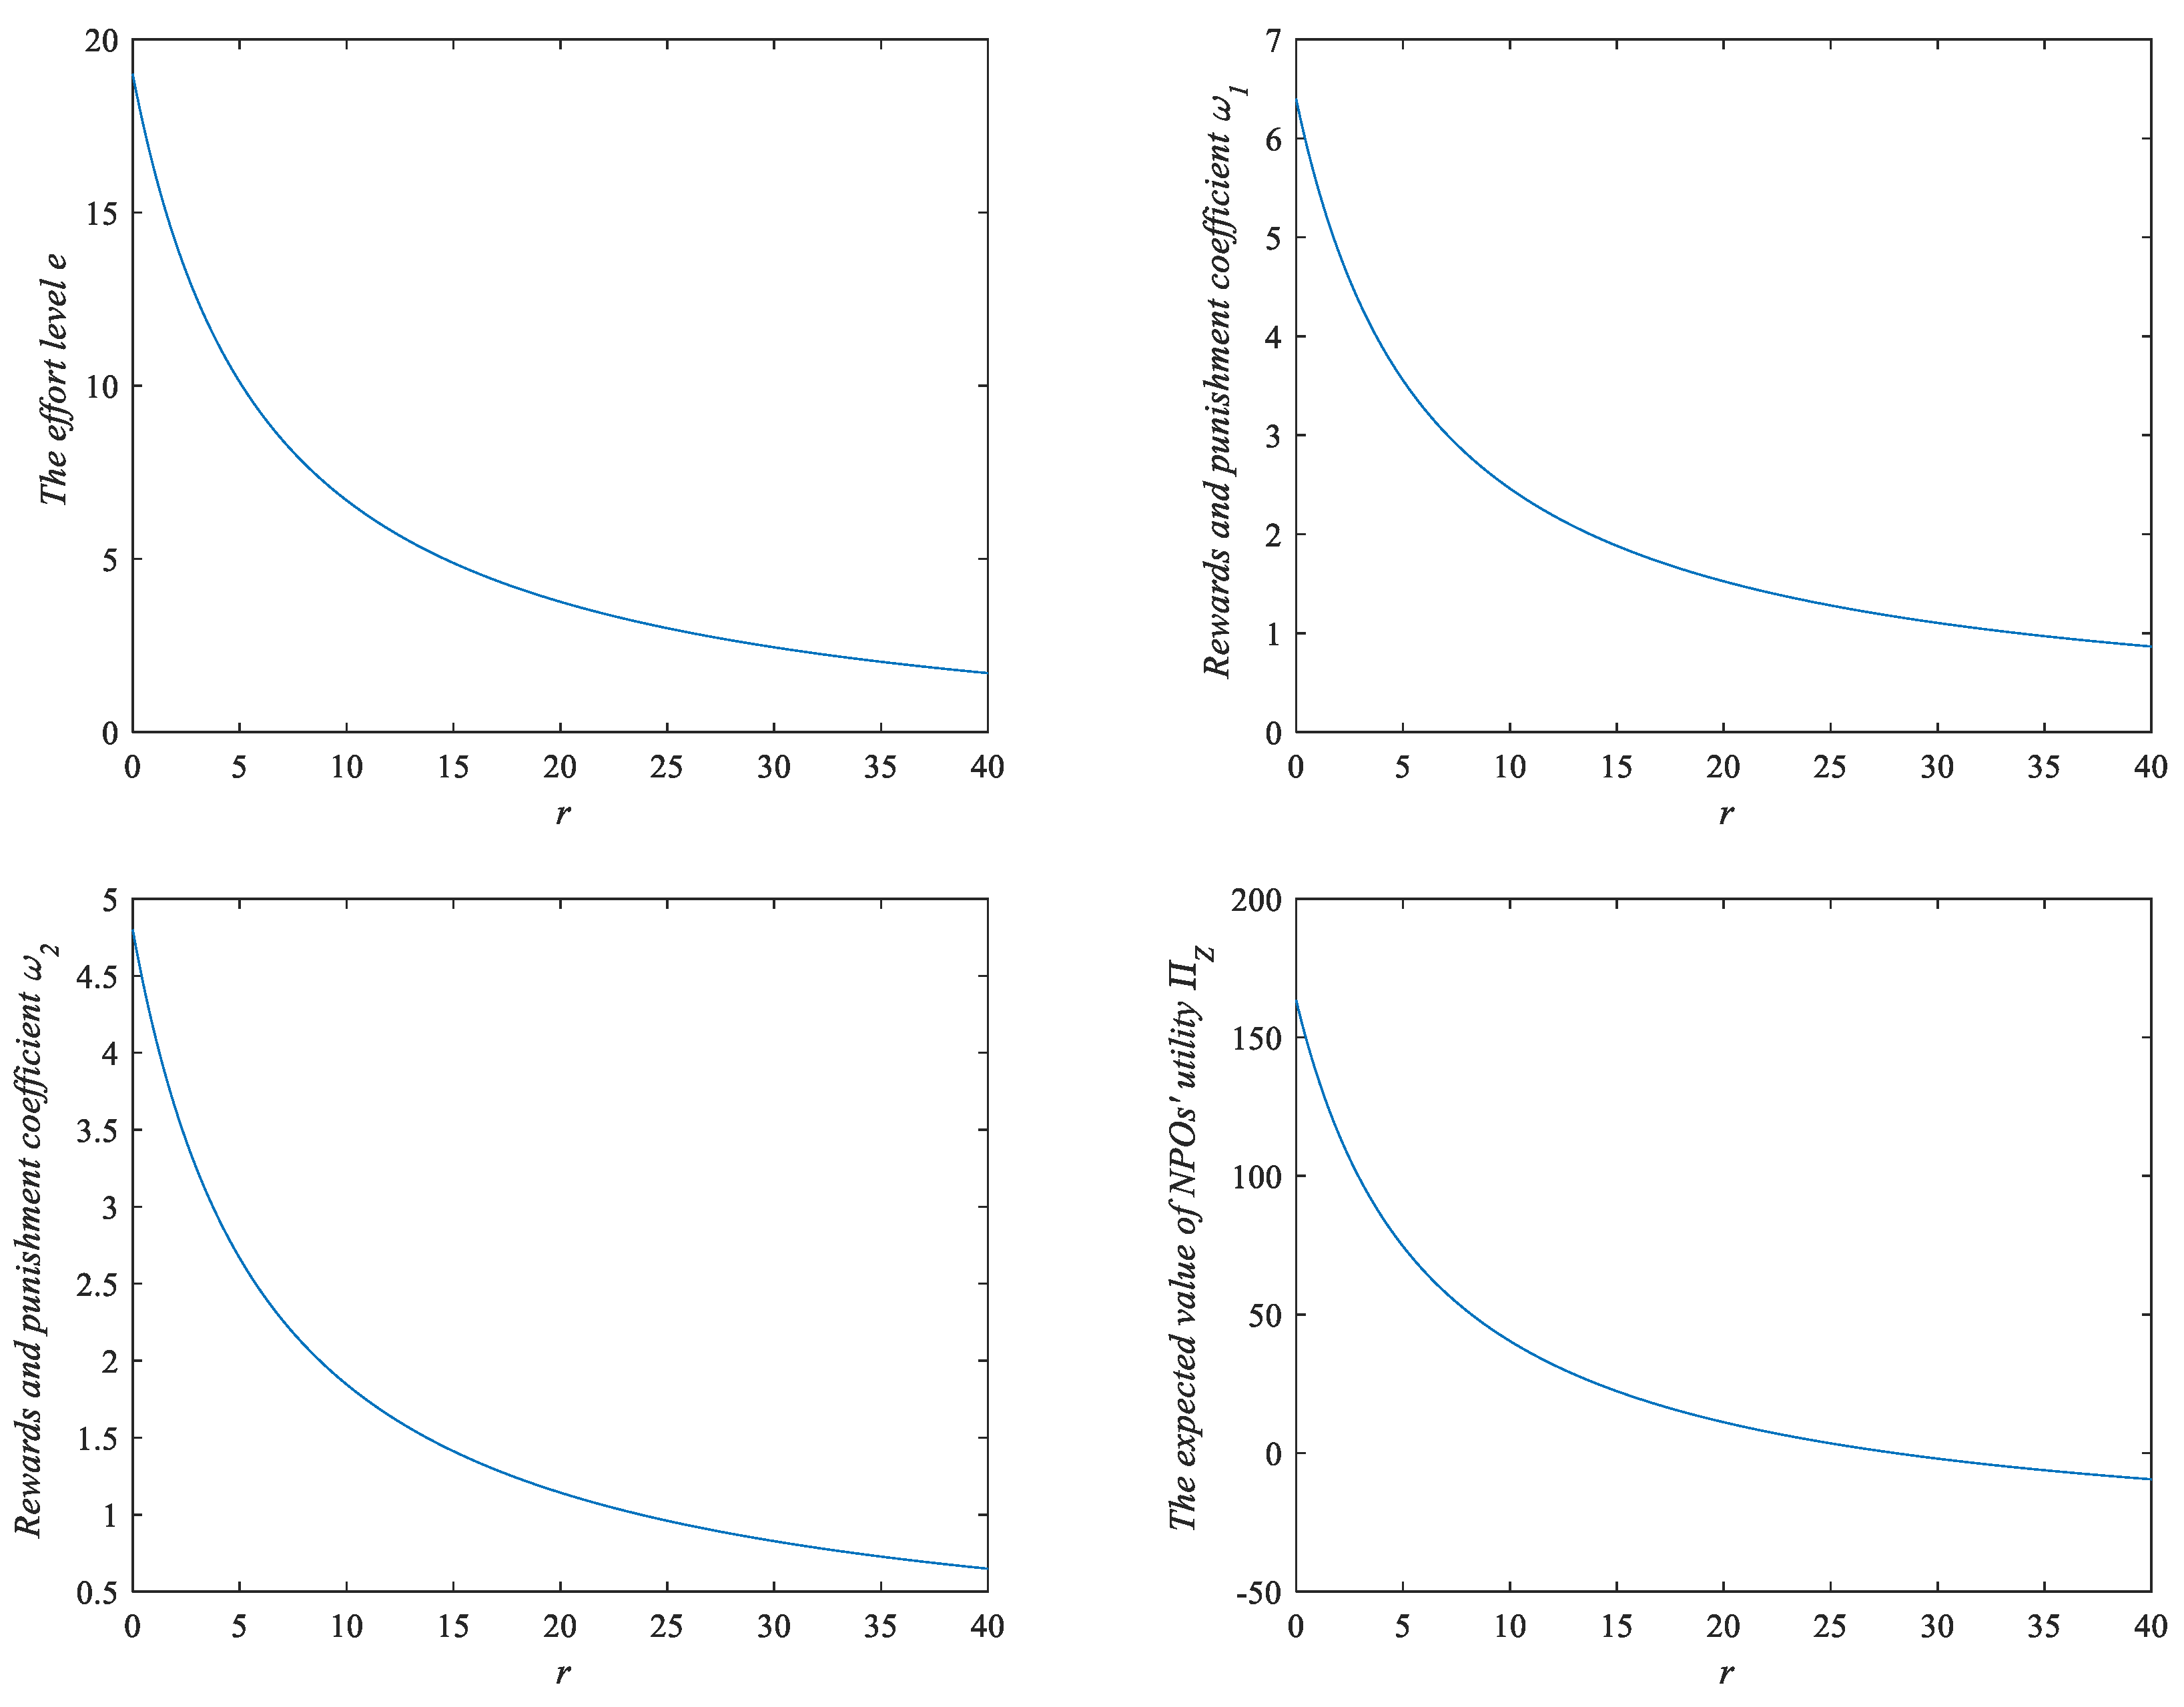
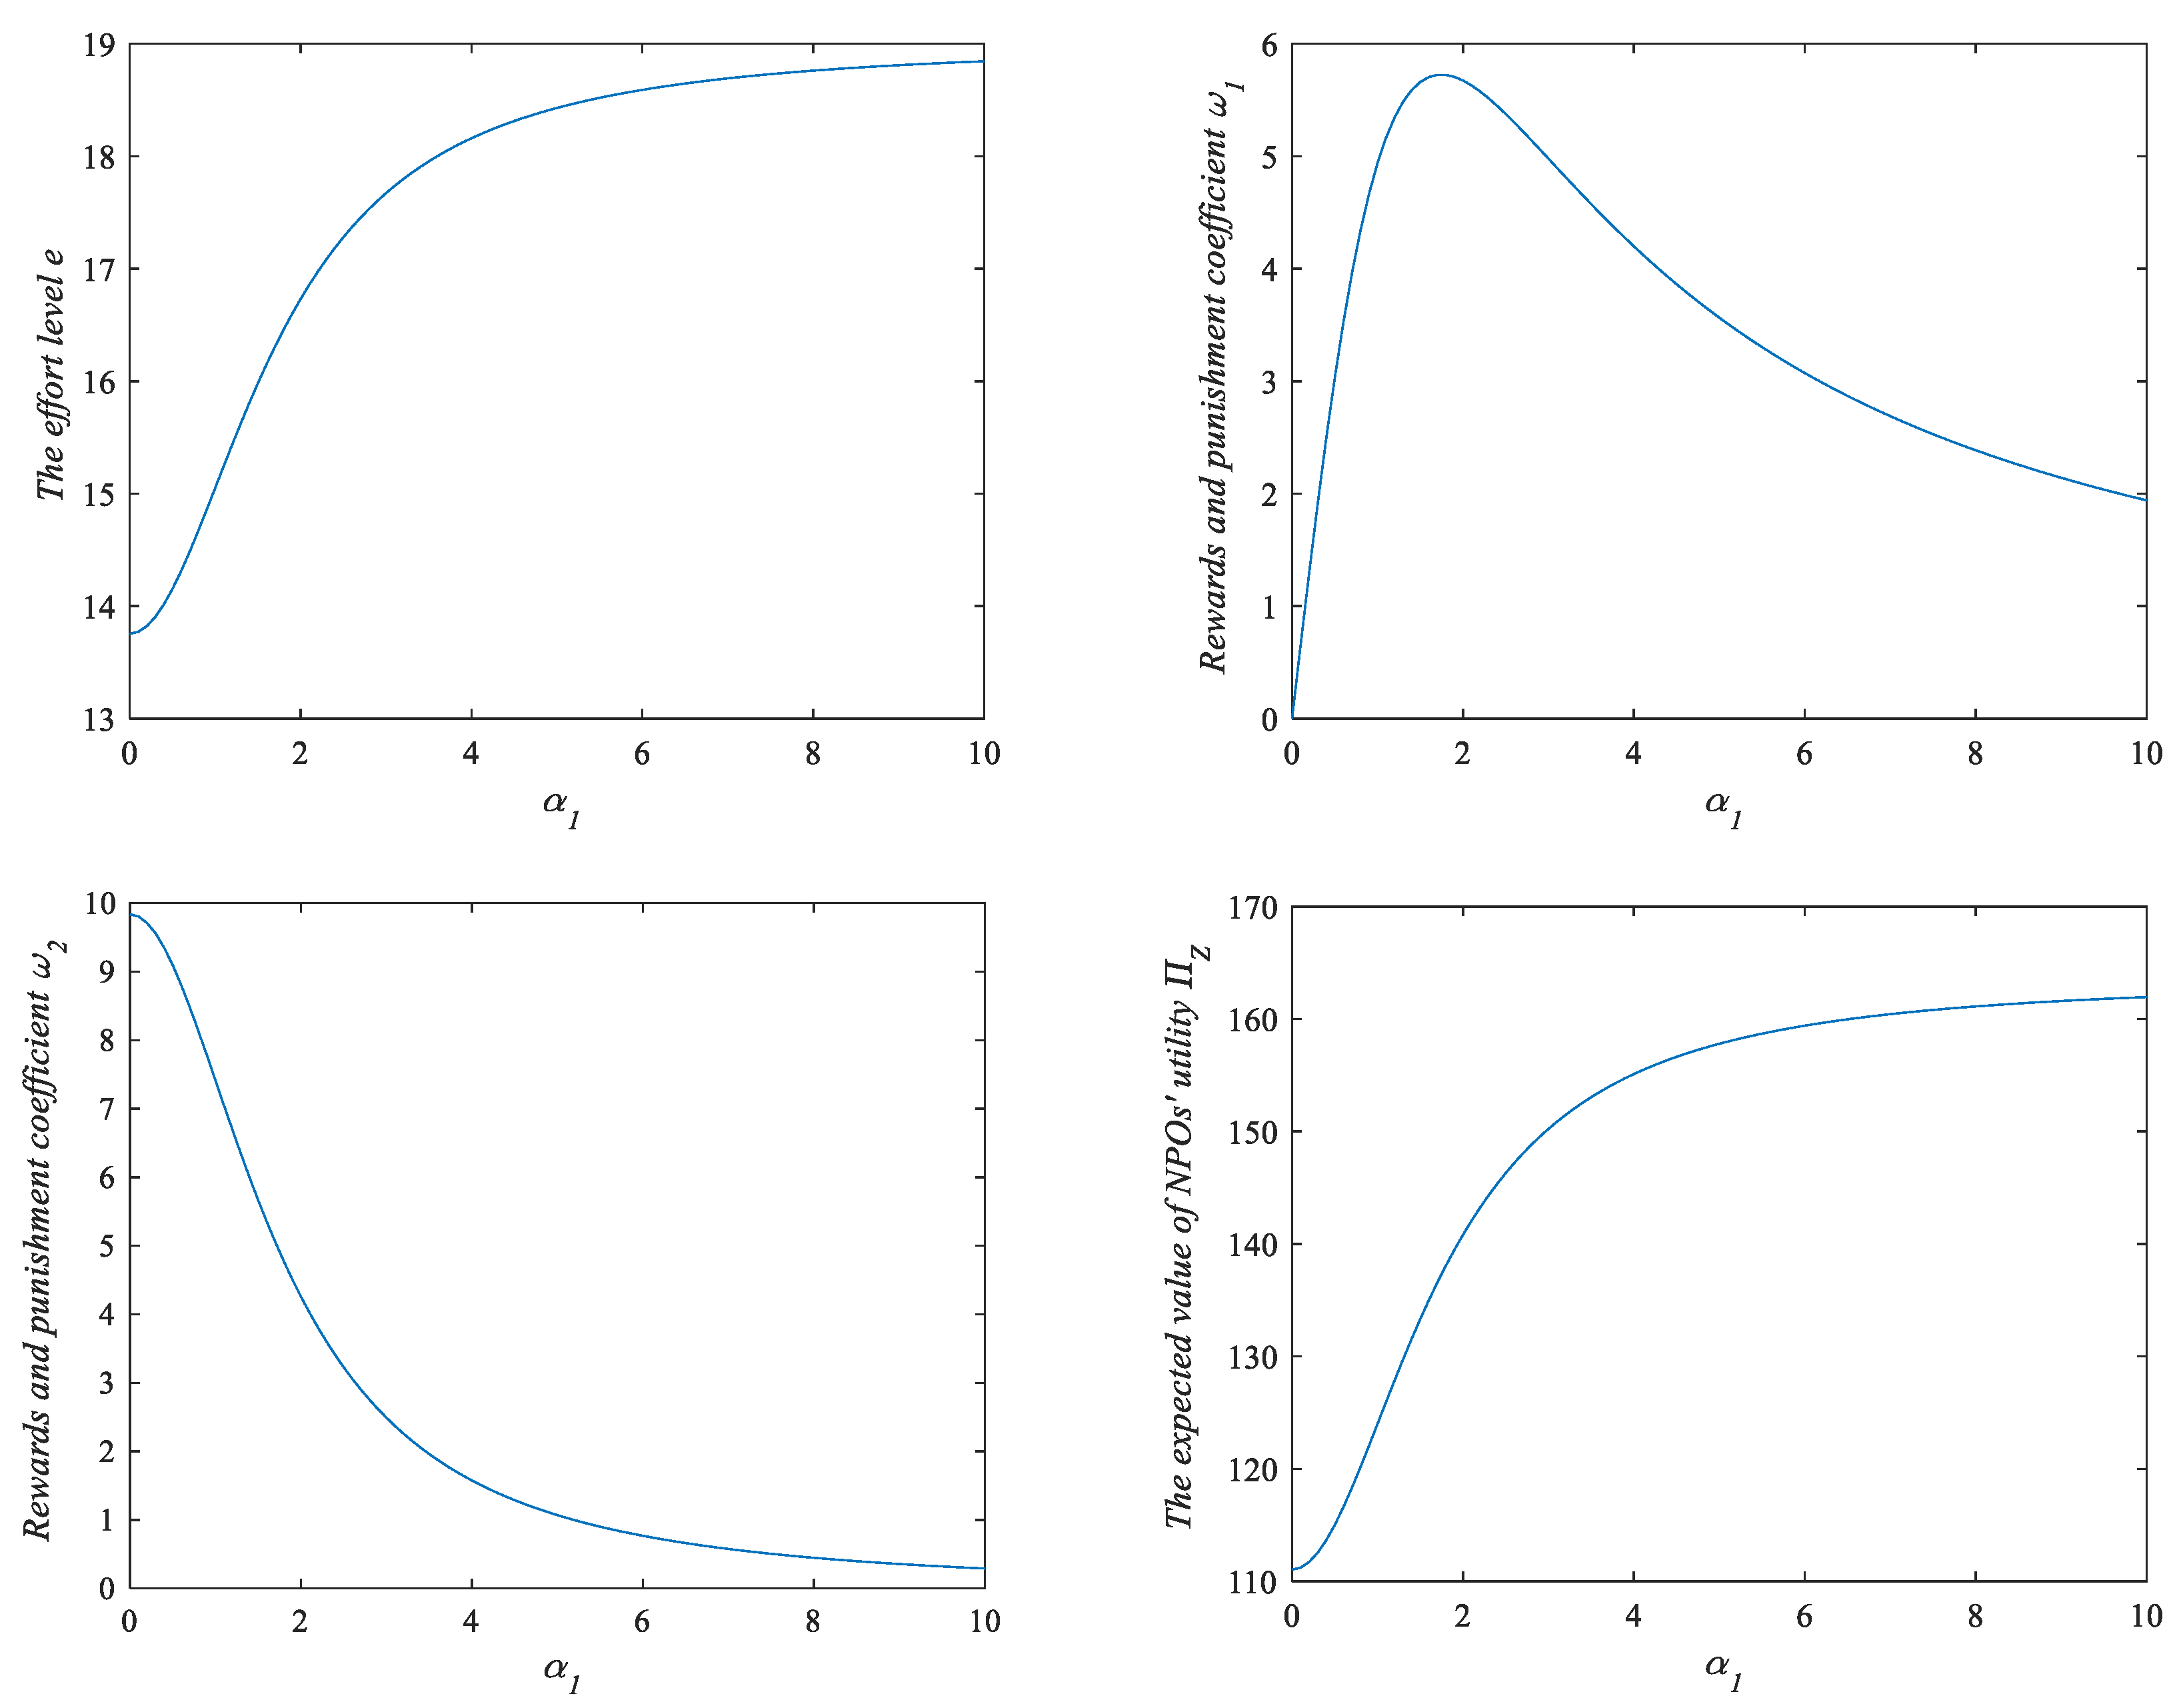
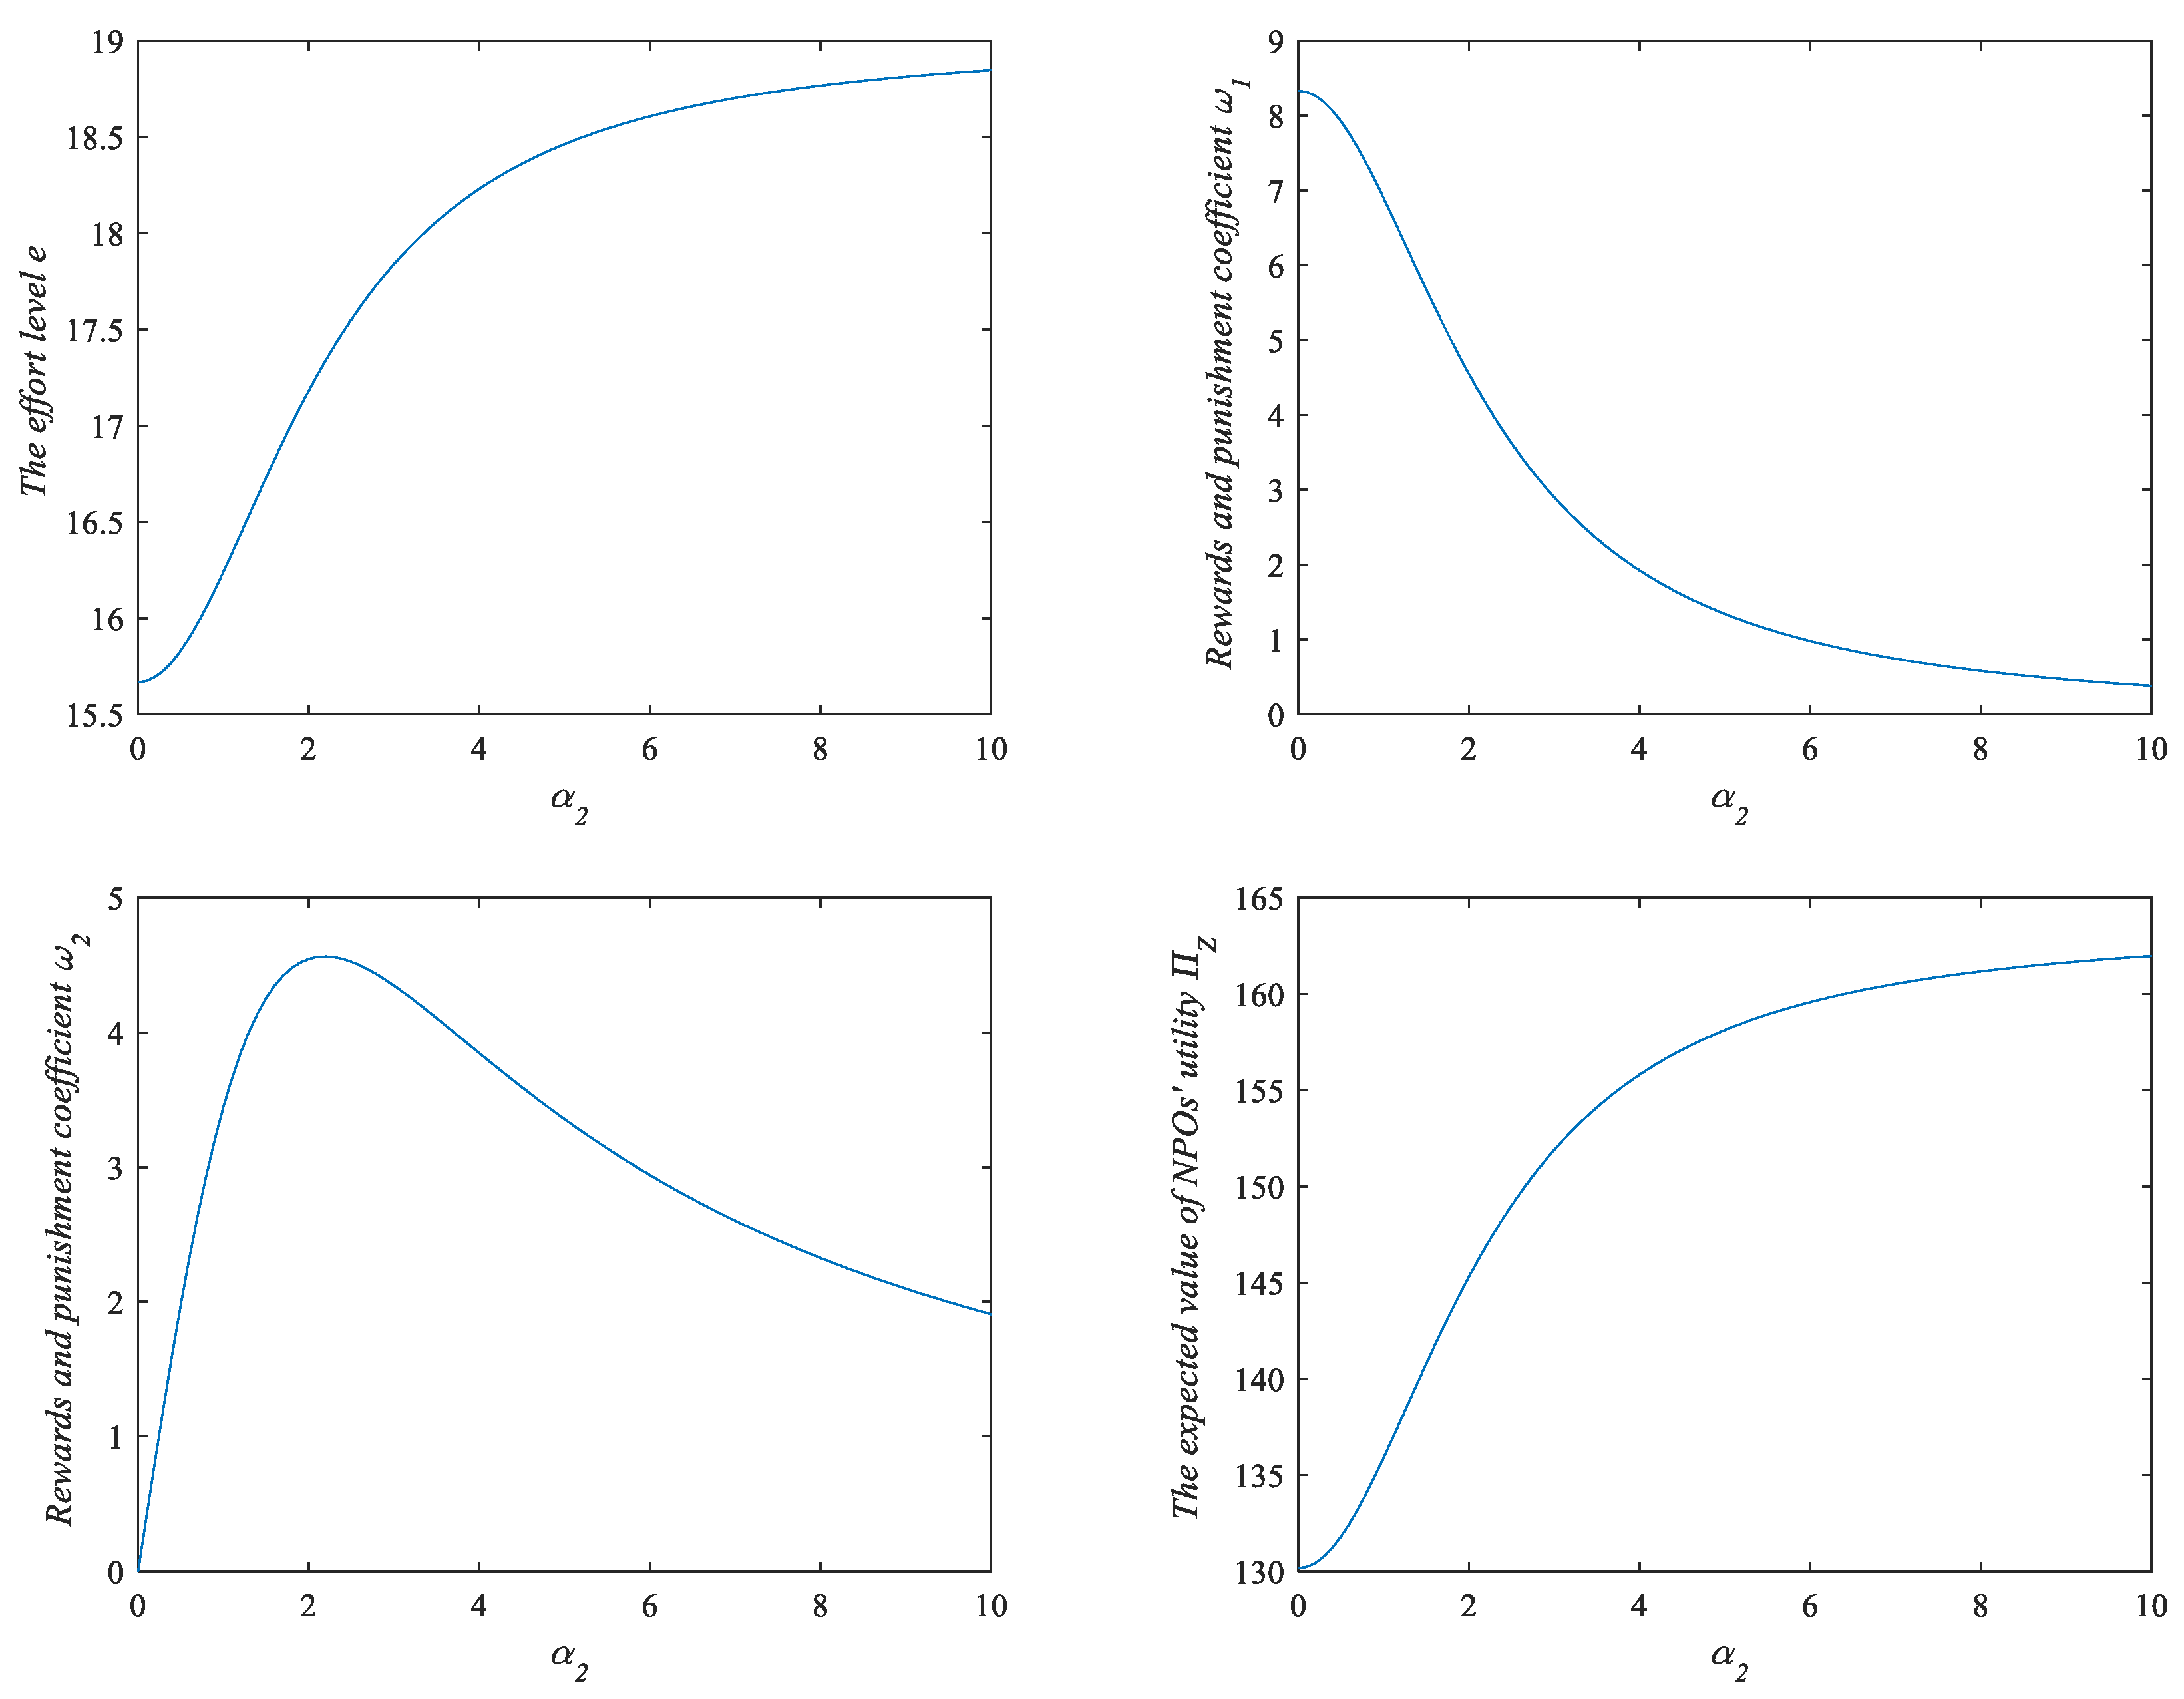
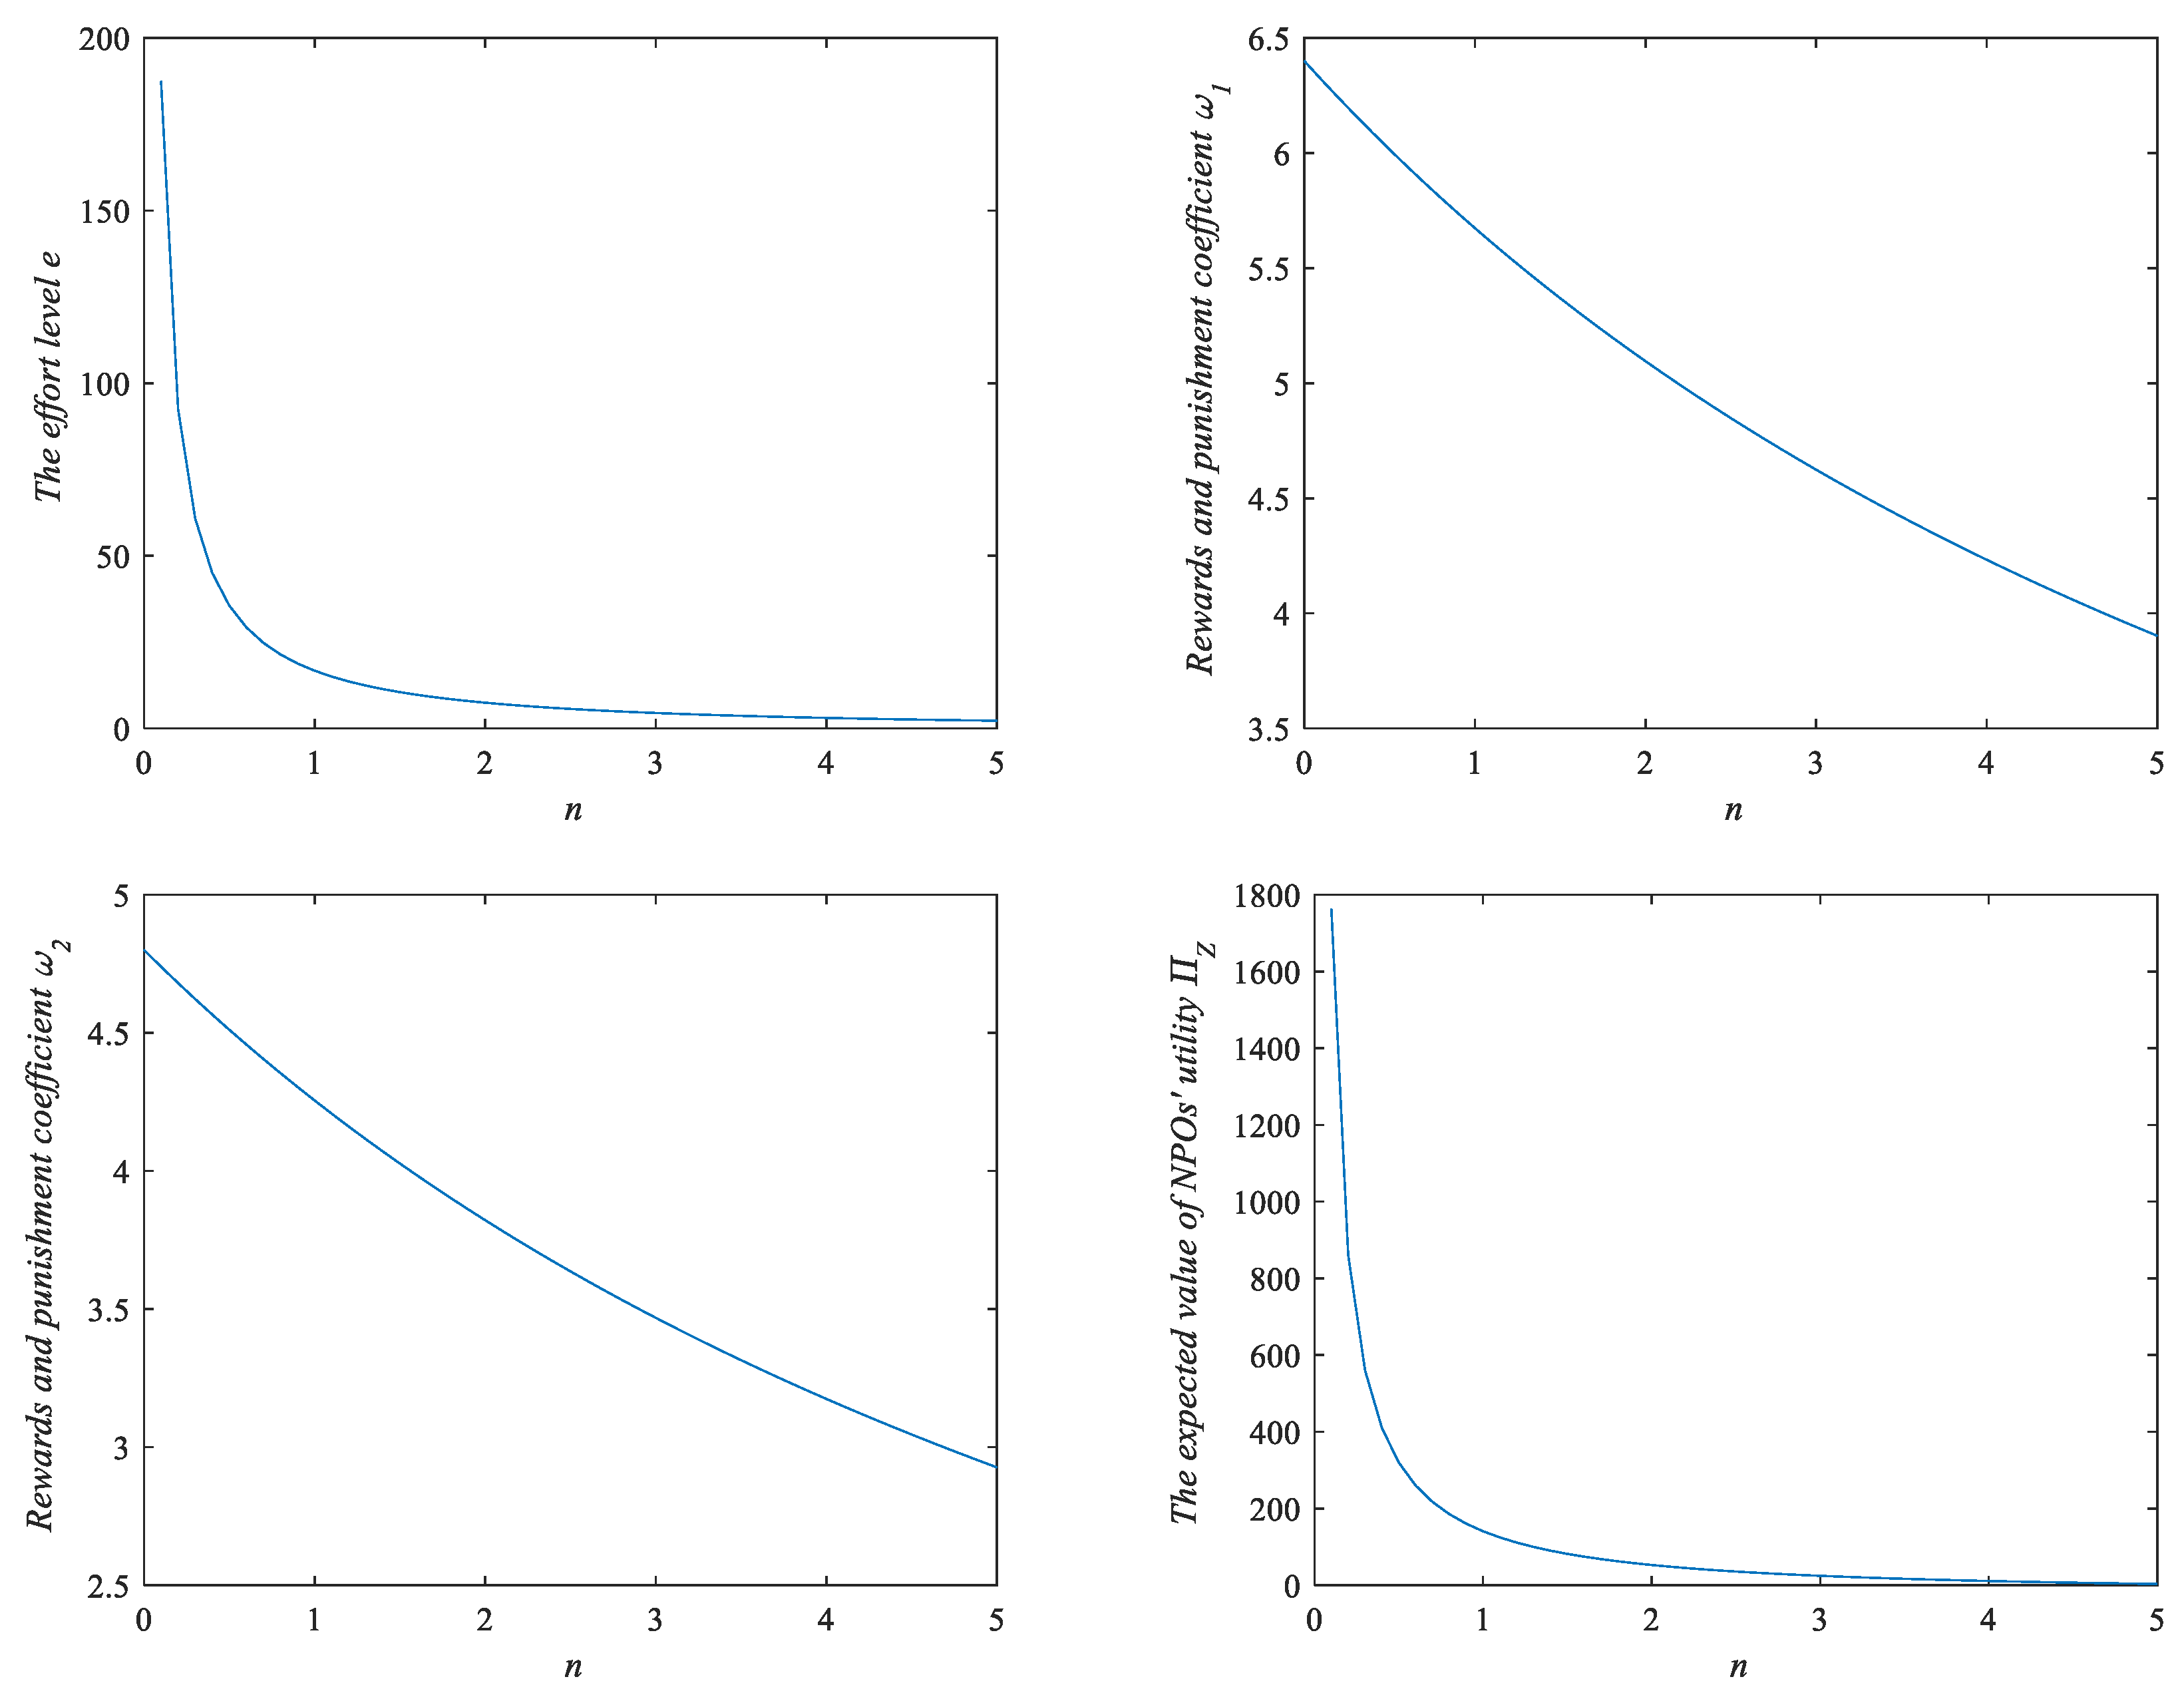
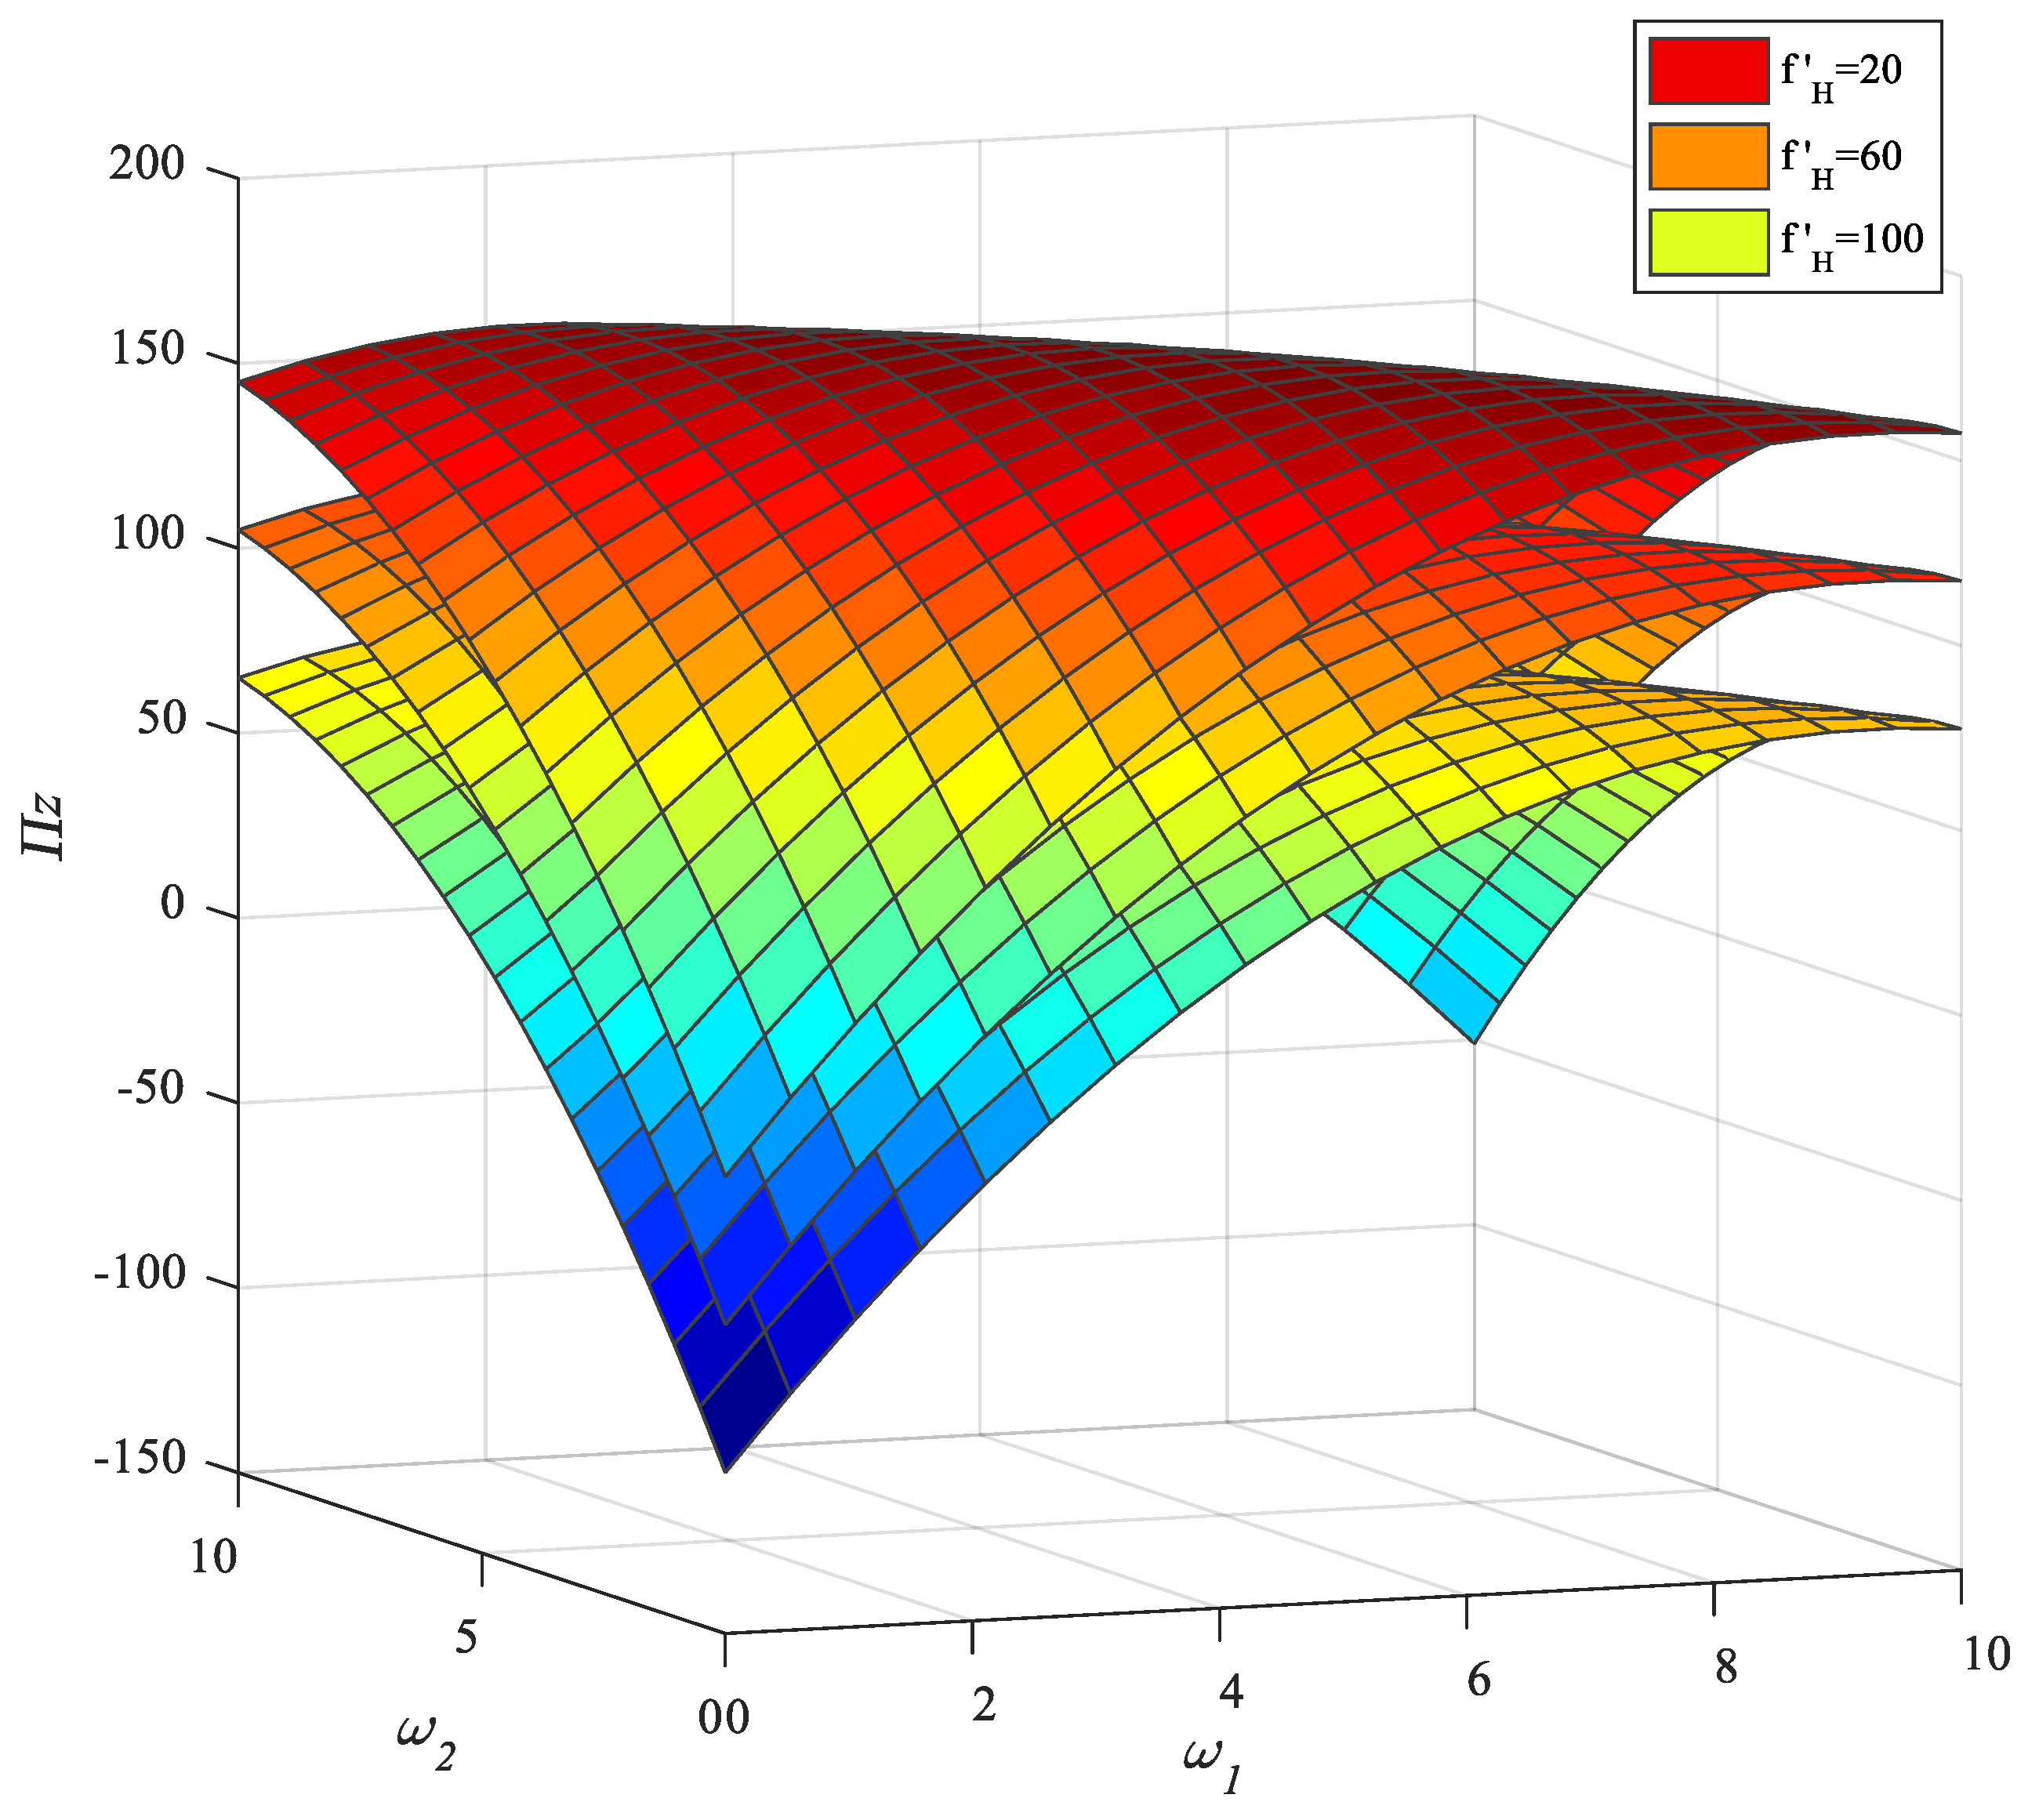
6.2. Sensitivity Analysis

Figure 1 and Figure 2 show the trend plots of optimal enterprise effort, NPO incentive strategy, and maximum returns with random factor variances ε and ζ . The increase caused by σ 2 instabilities in temperature, humidity, labor, and production equipment failure or by δ 2 fluctuations in supply chain reliability and sustained production stability of the production line makes enterprises prone to negativity, which decreases effort and reduces NPO earnings.
Figure 3 shows the trend diagram of the optimal level of effort, NPO incentive strategy, and maximum return with the change in risk aversion coefficient of the enterprise. As the risk aversion coefficient of the enterprise increases, its ability to take risks becomes weaker and it becomes unwilling to improve its own efforts. This makes it difficult for the enterprise to have sufficient production capacity in the case of an unexpected accident, which decreases NPO revenue and the optimal reward and punishment coefficient.
Figure 4 is a trend diagram of the changes in the optimal level of effort, the NPOs’ decision strategy, and the maximum revenue of the enterprise with the change in enterprise production efficiency. With the increase in enterprise production efficiency, optimal effort and NPO revenue increase continuously, attributable to the fact that the higher the enterprise production efficiency, the more it is conducive to improving emergency medical supply production capacity and to keeping a high level of single-day maximum capacity. Thus, NPOs can increase their revenue and decrease disaster risk.
Figure 5 shows the trend graphs of optimal enterprise effort, NPO decision strategy, and maximum revenue with the change in enterprise sustained production capacity. With the increase in enterprise sustained production capacity, optimal effort and NPO revenue NPOs also increase. The reason is that the stronger the enterprise’s sustained production capacity, the better its capability to enhance its emergency medical supply production capacity and the more beneficial it is to provide stable production in case of disasters. Thus, NPOs can secure more revenue and reduce disaster risk. Figure 4 and Figure 5 highlight an important implication on reward and punishment measures—the amount of reward will not continue to increase with the enhancement of production efficiency or continuous production capacity, which means that NPOs do not need to keep increasing subsidies; instead, they can engage in a “subsidy rollback” at a critical point as appropriate.
Figure 6 shows the trend diagrams of optimal effort, NPO decision strategy, and maximum enterprise revenue with the change in the marginal cost of variable inputs. Optimal effort, NPO revenue, NPO decision strategy, and the optimal sustainable production capacity reward and punishment coefficient decrease with the increase in the enterprises’ variable input marginal costs. Enterprises with a relatively low variable cost, where effort and NPO revenue can be maintained at a high level, should be selected for piloting.
Figure 7 shows the trend diagram of optimal enterprise effort, NPO incentive strategy, and maximum revenue with the change in the conversion coefficient of disaster reduction efficiency. Optimal corporate effort, NPO revenue, production efficiency, and the sustained production capacity reward and punishment coefficients all increase with the increase in the conversion coefficient of disaster reduction benefits. Thus, NPOs can improve their disaster reduction efficiency conversion coefficient by spreading disaster reduction knowledge, improving logistics capacity, and improving reserve production capacity.
Figure 8 gives the trend diagram of the changes in NPO returns with the enterprise production efficiency and sustainable production capacity reward and punishment coefficients, with different maximum opportunity returns. NPO returns increase and then decrease with the increase in the reward and punishment coefficients of production efficiency and sustained production capacity. Blindly formulating reward and punishment coefficients that are too high will reduce the benefits of disaster reduction. Thus, NPOs should adopt appropriate reward and punishment mechanisms. Increasing the maximum opportunity earnings of the enterprise will reduce the returns of the NPOs, while keeping the reward and punishment mechanism constant.

7. Conclusions

This study analyzed the interest game between NPOs and enterprises responsible for reserve production capacity under the condition of information asymmetry, and constructed an incentive model for the reserve production capacity system for emergency medical supplies. We introduced the two indicators of productivity and sustained productivity to solve the optimal incentive strategy of the NPO under dual incentives, and then discussed the influence of each exogenous variable on the optimal strategy. Our findings offer the following insights for management.
First, the fewer uncontrollable factors in the reserve production capacity strategy, the more likely it is that the parties will enter into a cooperative contract. For enterprises, the fewer market uncertainties, the more sensitive the production efficiency and sustained production capacity, and the more effort they are willing to exert. Meanwhile, the more NPOs tend to increase the reward and punishment coefficients, the more effective the incentive contract will be. Therefore, NPOs should assist enterprises in reducing market uncertainty risks and creating a steadily controllable reserve environment.
Second, the functions of the optimal reward and punishment coefficients on the enterprise’s production efficiency and sustained production capacity have extreme value points. From the enterprise perspective, improvements in production efficiency and supply chain stability can, at the outset, increase their subsidies, which in turn incentivizes them to sign cooperation contracts. When the enterprise’s production efficiency and level of supply chain management are standardized, measures that improve the production level (e.g., personnel introduction, system reform, and investment in fixed assets) rapidly increase the enterprise’s marginal costs. In this case, the effect of the rewards and punishments NGOs give to enterprises gradually diminishes, and enterprises no longer enhance their efforts by pursuing rewards.
Third, in designing a subsidy mechanism, NPOs should fully consider the industrial characteristics of enterprises. To maximize the utility of the incentive model, NPOs should select enterprises that are less affected by external random factors, have a strong ability to convert loan proceeds, have a high level of production efficiency and supply chain management, and are of moderate scale as pilots, while encouraging enterprises to improve their own risk-taking ability.
The incentive model we constructed for reserve emergency medical supply production capacity has important practical value, as it can serve as a guide for improving enterprises’ efforts, increasing the benefits of disaster reduction, and reducing disaster risks. However, it is important to note that this study focused on uncapped NPO incentive subsidies for enterprises; future studies should consider incentive subsidies with constraints.

Author Contributions

Conceptualization, H.X. (Hua Xiao) and M.T.; methodology, T.X.; software, Y.L.; validation, H.X. (Hua Xiao); formal analysis, T.X..; investigation, H.X. (Hua Xiao); resources, H.X. (Hua Xiao); data curation, H.X. (Huyang Xu); writing—original draft preparation, H.X. (Hua Xiao); writing—review and editing, H.X. (Hua Xiao); visualization, H.X. (Hua Xiao); supervision, M.T.; project administration, M.S.; funding acquisition, Y.L. All authors have read and agreed to the published version of the manuscript.

Funding

This research was funded by the National Social Science Foundation of China, grant numbers 21BGL220 and 19BGL290; the Chengdu Office of Philosophy and Social Science, grant number 2021CS025.

Institutional Review Board Statement

Not applicable.

Informed Consent Statement

Not applicable.

Data Availability Statement

Not applicable.

Conflicts of Interest

The authors declare no conflict of interest.

References

  1. World Health Organization. Shortage of Personal Protective Equipment Endangering Health Workers Worldwide. Available online: https://www.who.int/news-room/detail/03-03-2020-shortage-of-personal-protective-equipment-endangering-health-workers-worldwide (accessed on 1 January 2021).
  2. He, D.Y.; Jiang, D.L.; Wang, Y.S.; Chen, Y.W. Research on incentive and constraint mechanism of government entrust to enterprise agent reserve emergency material. Open Cybern. Syst. J. 2014, 8, 695–701. [Google Scholar]
  3. Basu, A.K.; Lai, R.; Srinivasan, V.; Staelin, R. Salesforce compensation plans: An agency theoretic perspective. Mark. Sci. 1985, 4, 267–291. [Google Scholar] [CrossRef]
  4. Holmstrom, B.; Milgrom, P. Aggregation and linearity in the provision of intertemporal incentives. Econometrica 1987, 55, 303–328. [Google Scholar] [CrossRef]
  5. Chu, L.Y.; Sappington, D.E.M. Procurement contracts: Theory vs practice. Int. J. Ind. Organ. 2009, 27, 51–59. [Google Scholar] [CrossRef]
  6. Gary, H.; Chao, S.M.R.; Iravani, R.; Savaskan, R.C. Quality Improvement Incentives and Product Recall Cost Sharing Contracts. Manag. Sci. 2009, 55, 1122–1138. [Google Scholar] [CrossRef]
  7. Yan, D.; Xu, K.F.; Pholip, T.E. Transshipment incentive contracts in a multi-level supply chain. Eur. J. Oper. Res. 2012, 223, 430–440. [Google Scholar] [CrossRef]
  8. Cai, W.; Singham, D. A Principal-Agent Problem with Heterogeneous Demand Distributions for a Carbon Capture and Storage System. Eur. J. Oper. Res. 2018, 264, 239–256. [Google Scholar] [CrossRef]
  9. Zhou, C.; Peng, J.; Liu, Z. Optimal incentive contracts under loss aversion and inequity aversion. Fuzzy Optim. Decis. Mak. 2018, 18, 85–102. [Google Scholar] [CrossRef]
  10. Nan, Z.; Yang, C.; Rui, L.; Wu, M.; Wei, X. Monitoring strategy for relay incentive mechanism in cooperative communication networks. Comput. Electr. Eng. 2017, 60, 14–29. [Google Scholar] [CrossRef]
  11. Euch, O.E.; Mastrolia, T.; Rosenbaum, M.; Touzi, N. Optimal make-take fees for market making regulation. Math. Financ. 2021, 31, 109–148. [Google Scholar] [CrossRef]
  12. Bi, H.; Lu, F.; Duan, S.; Huang, M.; Zhu, J.; Liu, M. Two-level principal–agent model for schedule risk control of IT outsourcing project based on genetic algorithm. Eng. Appl. Artif. Intell. 2020, 91, 103584. [Google Scholar] [CrossRef]
  13. Ai, F.; Zhang, L. Incentive mechanism system of the management of IC design enterprises. J. Ambient. Intell. Humaniz. Comput. 2021. [Google Scholar] [CrossRef]
  14. Yao, M.; Wang, F.; Chen, Z.; Ye, H. Optimal Incentive Contract with Asymmetric Cost Information. J. Constr. Eng. Manag. 2020, 146, 04020054. [Google Scholar] [CrossRef]
  15. Zhang, H.; Li, J. An Optimal Water Resource Allocation Mechanism Based on Ex-Post Verification and Reward in Huangbai River. Water 2021, 13, 1588. [Google Scholar] [CrossRef]
  16. Dawande, M.; Janakiraman, G.; Qi, A.; Wu, Q. Optimal Incentive Contracts in Project Management. Prod. Oper. Manag. 2019, 28, 1431–1445. [Google Scholar] [CrossRef]
  17. Kerkhove, L.P.; Vanhoucke, M. Incentive contract design for projects: The owner’s perspective. Omega 2016, 262, 93–114. [Google Scholar] [CrossRef]
  18. Lin, Z.; Jun, T.; Fung, R.; Dang, C. Materials procurement and reserves policies for humanitarian logistics with recycling and replenishment mechanisms. Comput. Ind. Eng. 2019, 127, 709–721. [Google Scholar] [CrossRef]
  19. Zhao, L.; Chen, Y. Optimal Subsidies for Green Products: A Maximal Policy Benefit Perspective. Symmetry 2019, 11, 63. [Google Scholar] [CrossRef]
  20. Wang, X.; Wu, W.; Song, P.; He, J. An international comparison analysis of reserve and supply system for emergency medical supplies between China, the United States, Australia, and Canada. Biosci. Trends 2020, 14, 231–240. [Google Scholar] [CrossRef]
  21. Peng, S.; Feng, T. Optimal Contract to Induce Continued Effort. Manag. Sci. 2018, 64, 4193–4217. [Google Scholar] [CrossRef]
  22. Singham, D.I. Sample Average Approximation for the Continuous Type Principal-Agent Problem. Eur. J. Oper. Res. 2018, 275, 1050–1057. [Google Scholar] [CrossRef]
  23. Liang, L.; Atkins, D. Rewarding Suppliers’ Performance via Allocation of Business. Manuf. Serv. Oper. Manag. 2020, 23, 267–545. [Google Scholar] [CrossRef]
  24. Liu, J.; Wang, X. A Penalty Function Method for the Principal-Agent Problem with an Infinite Number of Incentive-Compatibility Constraints under Moral Hazard. Acta Math. Sci. 2021, 41, 1749–1763. [Google Scholar] [CrossRef]
  25. Wang, W.; Sun, X.; Zhang, M. Does the central environmental inspection effectively improve air pollution?-An empirical study of 290 prefecture-level cities in China. J. Environ. Manag. 2021, 286, 112274. [Google Scholar] [CrossRef]
  26. Tanner, A.; Doberstein, B. Emergency preparedness amongst university students. Int. J. Disaster Risk Reduct. 2015, 13, 409–413. [Google Scholar] [CrossRef]
  27. Hiroki, O.; Kong, J.S.; Shunsuke, M. Household preparedness for natural disasters: Impact of disaster experience and implications for future disaster risks in Japan. Int. J. Disaster Risk Reduct. 2017, 21, 148–158. [Google Scholar] [CrossRef]
  28. Lin, A.; Wu, H.; Liang, G.; Cardenas-Tristan, A.; Li, D. A big data-driven dynamic estimation model of relief supplies demand in urban flood disaster. Int. J. Disaster Risk Reduct. 2020, 49, 101682. [Google Scholar] [CrossRef]
  29. Hu, S.L.; Han, C.F.; Meng, L.P. A stochastic programming model for emergency supplies allocation with consider ation of production capacity reserves of enterprise. Syst. Eng. Theory Pract. 2018, 38, 1537–1544. [Google Scholar] [CrossRef]
  30. Al-Hajj, S.; Abou-El-Hassan, H.; Khalil, L.; Kaafarani, H.M.A.; El, S.M. Hospital disaster and emergency preparedness (HDEP) in Lebanon: A national comprehensive assessment. Int. J. Disaster Risk Reduct. 2020, 51, 101889. [Google Scholar] [CrossRef]
  31. Liu, J.; Guo, L.; Jiang, J.; Jiang, D.; Liu, R.; Wang, P. A two-stage optimization model for emergency material reserve layout planning under uncertainty in response to environmental accidents. J. Hazard. Mater. 2016, 310, 30–39. [Google Scholar] [CrossRef]
  32. Mohamadi, A.; Yaghoubi, S. A bi-objective stochastic model for emergency medical services network design with backup services for disasters under disruptions: An earthquake case study. Int. J. Disaster Risk Reduct. 2017, 23, 204–217. [Google Scholar] [CrossRef]
  33. Boonmee, C.; Arimura, M.; Asada, T. Facility location optimization model for emergency humanitarian logistics. Int. J. Disaster Risk Reduct. 2017, 24, 485–498. [Google Scholar] [CrossRef]
  34. Zhuang, L.; He, J.; Deng, X. The influence of professionals on the general public in the choice of earthquake disaster preparedness: Based on the perspective of peer effects. Int. J. Disaster Risk Reduct. 2021, 66, 102593. [Google Scholar] [CrossRef]
  35. Tamal, M.; Naiwrita, B.; Indrajit, B. Distribution of deficient resources in disaster response situation using particle swarm optimization. Int. J. Disaster Risk Reduct. 2019, 41, 101308. [Google Scholar] [CrossRef]
  36. Ogo, A.; Zsd, A.; Sh, B. Supplier selection decision making in disaster response. Comput. Ind. Eng. 2020, 143, 106412. [Google Scholar] [CrossRef]
  37. Ertem, M.A.; Akdogan, M.A.; Kahya, M. Intermodal transportation in humanitarian logistics with an application to a Turkish network using retrospective analysis. Int. J. Disaster Risk Reduct. 2022, 72, 102828. [Google Scholar] [CrossRef]
  38. Min, L.; Chao, Z.; Ming, D.; Ruipu, L. A two-stage stochastic variational inequality model for storage and dynamic distribution of medical supplies in epidemic management. Appl. Math. Model. 2022, 102, 35–61. [Google Scholar] [CrossRef]
  39. Jiang, J.; Shi, Y.; Wang, X.; Chen, X. Regularized Two-stage stochastic variational inequalities for Cournot-Nash equilibrium under uncertainty. J. Comput. Math. 2019, 37, 813–842. [Google Scholar] [CrossRef]
  40. Hu, Z.Q.; Tian, J.; Feng, G.Z. Research on emergency supplies reserve strategy and procurement pricing under agreement enterprise reserve. Syst. Eng. Theory Pract. 2020, 40, 605–616. [Google Scholar] [CrossRef]
  41. Hu, Z.Q.; Tian, J.; Shen, A. The model of emergency supplies storing and purchase pricing based on production capacity reserve. J. Ind. Eng. Eng. Manag. 2021, 35, 200–210. [Google Scholar] [CrossRef]
  42. Wei, J.; Zheng, Y.; Liu, C. Research on the Decision-making of Emergency Eedical Supplies under Government-Subsidized Government-Enterprise Agreement Reserve. Chin. J. Manag. Sci. 2021. [Google Scholar] [CrossRef]
  43. Gao, X.N.; Tian, J. Multi-period incentive contract design in the agent emergency supplies reservation strategy with asymmetric information. Comput. Ind. Eng. 2018, 120, 94–102. [Google Scholar] [CrossRef]
  44. Liu, Y.; Tian, J.; Feng, G. A Dynamic Incentive Model for the Prepositioning System of Relief Supplies Basedon Reputation Effect. J. Syst. Manag. 2022, 31, 1–15. [Google Scholar] [CrossRef]
  45. Zhang, H.; Yu, L.; Zhang, W. Dynamic performance incentive model with supervision mechanism for PPP projects. Eng. Constr. Archit. Manag. 2020, 27, 2643–2659. [Google Scholar] [CrossRef]
  46. Liu, J.; Ma, G. Study on incentive and supervision mechanisms of technological innovation in megaprojects based on the principal-agent theory. Eng. Constr. Archit. Manag. 2020, 28. [Google Scholar] [CrossRef]
Figure 1. Relation diagram of e , ω 1 , ω 2 , Π z , and σ 2 .
Sustainability 14 11612 g001
Figure 2. Relation diagram of e , ω 1 , ω 2 , Π z , and δ 2 .
Sustainability 14 11612 g002
Figure 3. Relation diagram of e , ω 1 , ω 2 , Π z , and r .
Sustainability 14 11612 g003
Figure 4. Relation diagram of e , ω 1 , ω 2 , Π z , and α 1 .
Sustainability 14 11612 g004
Figure 5. Relation diagram of e , ω 1 , ω 2 , Π z , and α 2 .
Sustainability 14 11612 g005
Figure 6. Relation diagram of e , ω 1 , ω 2 , Π z , and n .
Sustainability 14 11612 g006
Figure 7. Relation diagram of e , ω 1 , ω 2 , Π z , and h .
Sustainability 14 11612 g007
Figure 8. Relation diagram of ω 1 , ω 2 , and Π z ( f H = 20 , f H = 60 , f H = 100 ).
Sustainability 14 11612 g008
Table 1. Parameter and variable definitions.
SymbolDefinition
Parameters
ω 0 Loan amount of emergency medical supplies
i Bank loan interest rate
φ Discount rate of loan decided by NPOs, 0 < φ < 1
τ Conversion coefficient of enterprise loan proceeds
α 1 Production efficiency of enterprises
α 2 Sustainable production capacity of enterprises
ε Random factor of enterprise production efficiency, ε ~ N ( 0 , σ 2 )
ζ Random factor of the enterprise’s sustainable production capacity, ζ ~ N ( 0 , δ 2 )
ξ Random factor that affects the earnings of NPOs, ξ ~ N ( 0 , μ 2 )
h Conversion coefficient of the marginal disaster reduction benefit of the enterprise’s degree of effort
m Marginal cost of the fixed input
n Effort cost coefficient
Decision
ω 1 Reward and punishment coefficient of production efficiency
ω 2 Reward and punishment coefficient of continuous production capacity
e Level of effort the enterprise demonstrates for reserve production capacity
Publisher’s Note: MDPI stays neutral with regard to jurisdictional claims in published maps and institutional affiliations.

