Article

Water Quality Index Prediction for Improvement of Treatment Processes on Drinking Water Treatment Plant

1
Department of Hydraulic Engineering, Faculty of Civil Engineering, University of Rijeka, 51000 Rijeka, Croatia
2
Istarski Vodovod d.o.o., 52420 Buzet, Croatia
*
Author to whom correspondence should be addressed.
Sustainability 2022, 14(18), 11481; https://doi.org/10.3390/su141811481
Submission received: 6 July 2022 / Revised: 6 September 2022 / Accepted: 10 September 2022 / Published: 13 September 2022

Abstract

:
In order to improve the treatment processes of the drinking water treatment plant (DWTP) located near the Butoniga reservoir in Istria (Croatia), a prediction of the water quality index (WQI) was done. Based on parameters such as temperature, pH, turbidity, KMnO4, NH4, Mn, Al and Fe, the calculation of WQI was conducted, while for the WQI prediction models, along with the mentioned parameters, O2, TOC and UV254 were additionally used. Four models were built to predict WQI with a time step of one, five, ten, and fifteen days in advance, in order to improve treatment processes of the DWTP regarding the changes in raw water quality in the Butoniga reservoir. Therefore, obtained models can help in the optimization of treatment processes, which depend on the quality of raw water, and overall, in the sustainability of the treatment plant. Results showed that the obtained correlation coefficients for all models are relatively high and, as expected, decrease as the number of prediction days increases; conversely, the number of rules, and related linear equations, depends on the parameters set in the WEKA modelling software, which are set to default settings which give the highest values of correlation coefficient (R) for each model and the optimal number of rules. In addition, all models have high accuracy compared to the measured data, with a good prediction of the peak values. Therefore, the obtained models, through the prediction of WQI, can help to manage the treatment processes of the DWTP, which depend on the quality of raw water in the Butoniga reservoir.

1. Introduction

Nowadays, because of increasing demand for potable water, problems concerning water quantity and quality are very important, and, indeed, a crucial issue for urban sustainable development and ecological environment [1]. During significant climate changes and other (mainly human) impacts which currently influence on the quality, quantity and availability of water and water resources, their proper management is needed. As such, an adequate supply of safe potable water is vital to human health and survival [2,3,4].
Water quality is mainly assessed using traditional water quality assessment methods that measure chemical parameters against established standards [5]. The water quality index (WQI) is used worldwide for water quality assessment, and to cope with big and complex water quality data. Moreover, the WQI method is most often used because this method’s main objective is to turn complex water quality data into understandable and usable information [6]. Today, various versions of WQI methods are widespread and are receiving more and more attention all over the world for representing and modeling water quality data [7]. The WQI method is also a useful tool to manage and/or reveal the performance and sustainability of the drinking water treatment plant (DWTP) [7,8]. To provide the best treatment efficiency so that the treatment processes are determined by prioritizing water quality in a more prominent way in the preferred water source, DWTPs are constantly changing both in terms of easy operation and functionality. The most preferred DWTP, which can treat all types of water with a certain quality, regardless of the water source, is called the conventional DWTP [7]. With these plants, the chemical and microbiological parameters in water can be treated with sufficient quality. As such, according to this, treatment plant strategies should be developed considering the reduction of human health risks and the improvement of water quality after water purification on DWTP. Moreover, it is important to determine and assess the parameters affecting water quality [7].
In this research, the WQI method was used to reveal the performance of the Butoniga DWTP located in Istria (Croatia), together with use of machine learning (ML) tools, if necessary, to help in the optimization of certain treatment processes which are dependent on the quality of raw water, and overall, for the sustainability of the DWTP. Calculation of WQI is based on a number of physical, chemical, and bacteriological parameters [6]. Detailed calculation of WQI is presented in Section 3.2.
A previous modelling attempt regarding a similar problem was done in [7], where the effluent water quality of a DWTP in Turkey according to WQI and health risk assessment (HRA) was investigated using principal component analysis (PCA). Other authors, such as [9,10,11,12,13,14,15,16], used in their research various ML algorithms and artificial intelligence (AI) methods in predicting WQI. Authors in [9] developed a model for predicting WQI using artificial neural networks (ANNs), namely, the nonlinear autoregressive neural network (NARNET) and the long short-term memory (LSTM) deep learning algorithm. Improvement of WQI prediction was done in research conducted in [10], where prediction was done using ML algorithms such as multilayer perceptron (MLP), convolutional neural network (CNN) and LSTM. In other research [11], prediction of WQI was done with ML techniques such as random forest (RF), neural networks (NN), multinomial logistic regression (MLR), support vector machine (SVM), and bagged tree models (BTM). In other research [12], eight artificial intelligence algorithms were used, e.g., MLR, RF, M5P tree, random subspace (RSS), additive regression (AR), ANNs, support vector regression (SVR), and locally weighted linear regression (LWLR) to generate WQI prediction. In another study [13], WQI prediction was done using supervised ML, e.g., MLP, Guassian naïve Bayes (GNB), MLR, stochastic gradient descent (SGD), k-nearest neighbors (KNN), decision tree (DT), RF, SVM, gradient boosting classifier (GBC) and bagging classifier (BC). Moreover, various ML models such as boosting-based algorithms, DT-based algorithms and ANN-based algorithms were used for predicting WQI in research [14]. ANNs were also used for the WQI model in research [15], while in research [16], simple prediction of WQI was done through supervised ML, e.g., simple linear regression (SLR), MLR, and ridge and lasso regression (RLR). This confirms the fact that the WQI method is used worldwide for water quality assessment.
Previous studies regarding functioning and problems on Butoniga DWTP were made in studies [17,18]. The first study, [17], describes the first experiences of the use of Butoniga DWTP for drinking water supply. In addition, this study analyzed raw water quality data from the Butoniga reservoir, and some management guidelines regarding the Butoniga reservoir and the related DWTP were given. In the second study, [18], the impact of the Butoniga reservoir raw water quality on water treatment was considered. This study provided some interesting conclusions, mentioning that the main problem with the Butoniga reservoir, and thus the related DWTP, appears in the summer months when water temperature is the most critical parameter, because, in order to be suitable for use and for treatment processes, water must not exceed the maximum allowable concentration (MAC) of 25 °C, according to Croatian regulations for drinking water [19]. In that time period, water is captured from the lowest water intake, which captures water from the lowest water layer in the Butoniga reservoir, which have increased concentrations of manganese (Mn), iron (Fe), ammonium (NH4) and lower pH values. Increased concentration of Mn, Fe, NH4 and lower pH values of water from the lowest water intake requires enhanced continuous process control and higher consumption of chemicals for the treatment process on DWTP; however, the process is also stable in these conditions, and all samples of the effluent are in accordance with the Croatian regulations for drinking water [19], while the exceeded temperature values due to the heating of untreated water from the reservoir cannot be influenced [18]. This is also the main reason why this research was conducted.
To cope with these problems, the ML technique was applied on data measured at the intake of raw water from the Butoniga reservoir, which is after the purification process of the DWTP used for drinking water purposes. The first step was to calculate WQI from a long-term dataset (2011–2020) consisting of physical and chemical parameters measured once a day, to obtain usable and understandable information about the water quality of the Butoniga DWTP. Second, based on calculated WQI, the rule-based ML method in the form of rule-based models was applied to predict WQI with a time step of one, five, ten and fifteen days in advance, in order to improve specific treatment processes on the DWTP regarding changes in raw water quality in the Butoniga reservoir. The rule-based models for numeric prediction use regression equations in the terminal nodes which allow a more accurate prediction of the target attribute. The models are interpreted as a set of IF THEN rules, where each rule is associated with a multivariate linear model (equation). Unlike other AI-based methods, which provide very good predictions, but sometimes are limited in terms of interpretability (black box models), the rule-based models tend to be more descriptive and interpretable (white box models) [20]. Therefore, the specific objective of this study is to obtain WQI prediction models that can be used in the performance and optimization of treatment processes which are dependent on the quality of raw water, and overall, for the sustainability of the Butoniga DWTP.
The paper is organized as follows: Section 2 describes the study area and measured data used in the modelling exercise. Section 3 describes the modelling method, calculation of WQI and description of the modelling experiment for the modelling task. In Section 4, the results are presented, i.e., constructed prediction models. Discussion of the results is presented in Section 5, and finally, Section 6 contains the conclusions of this research.

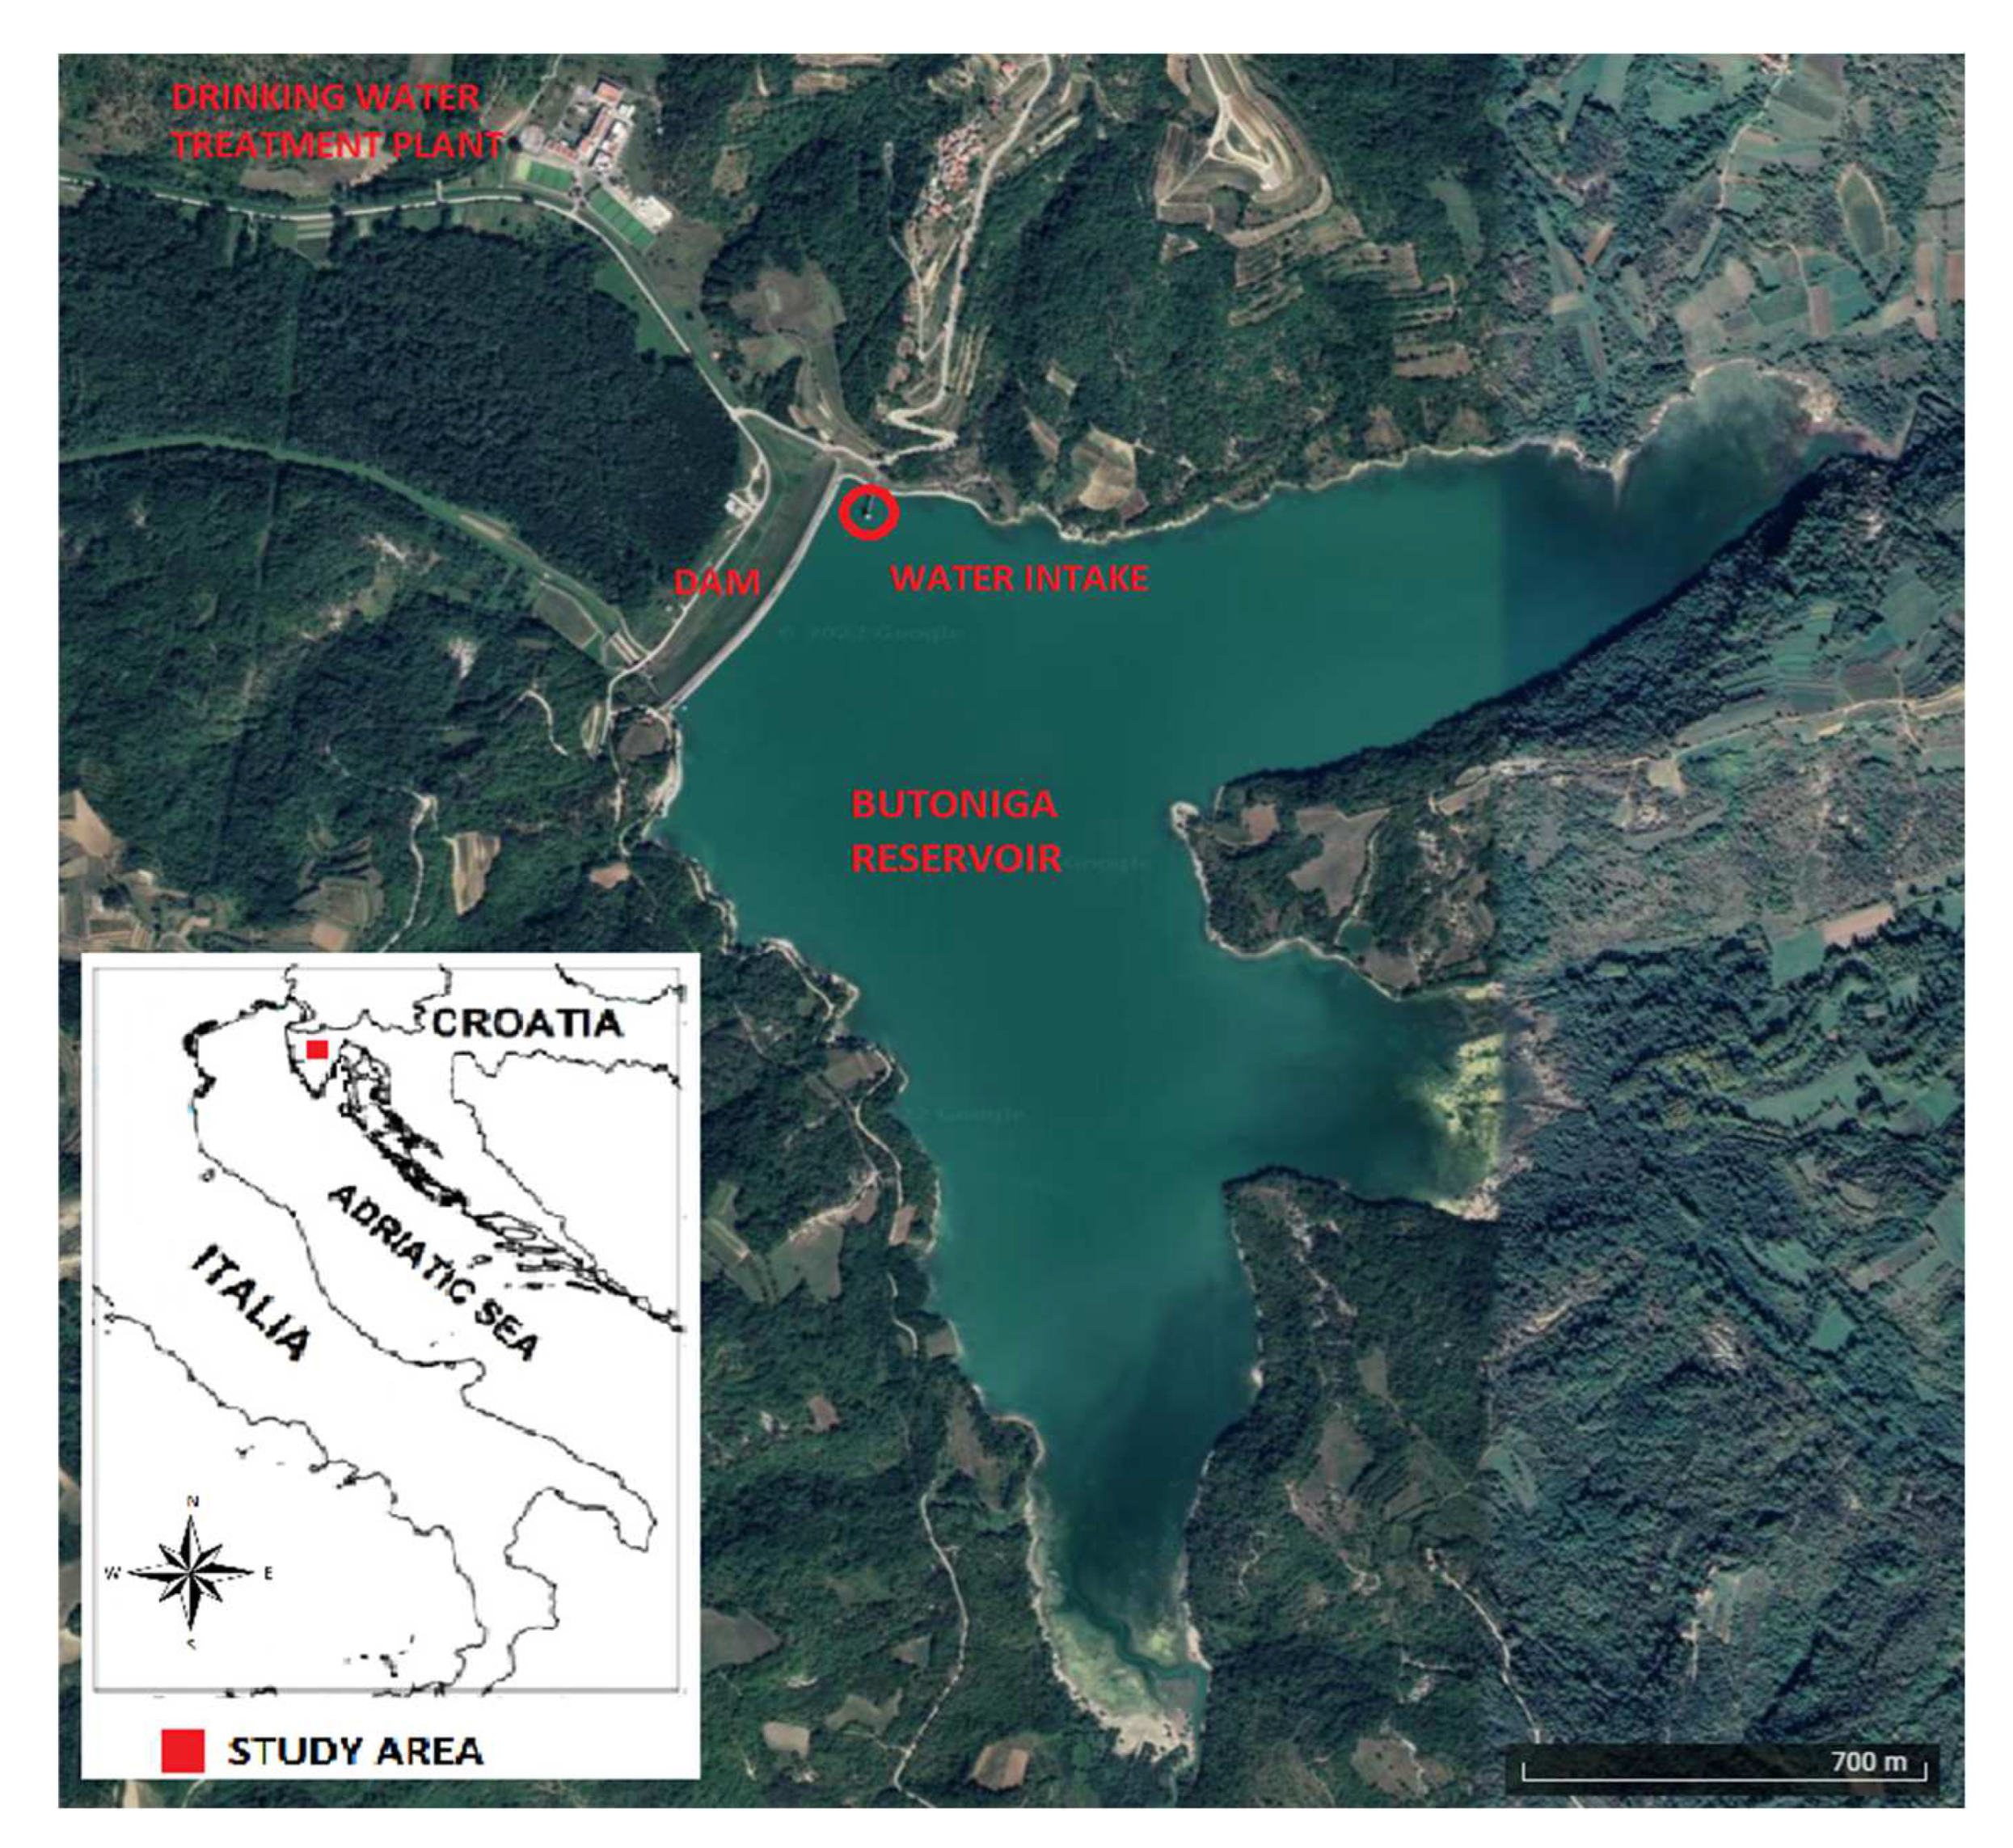
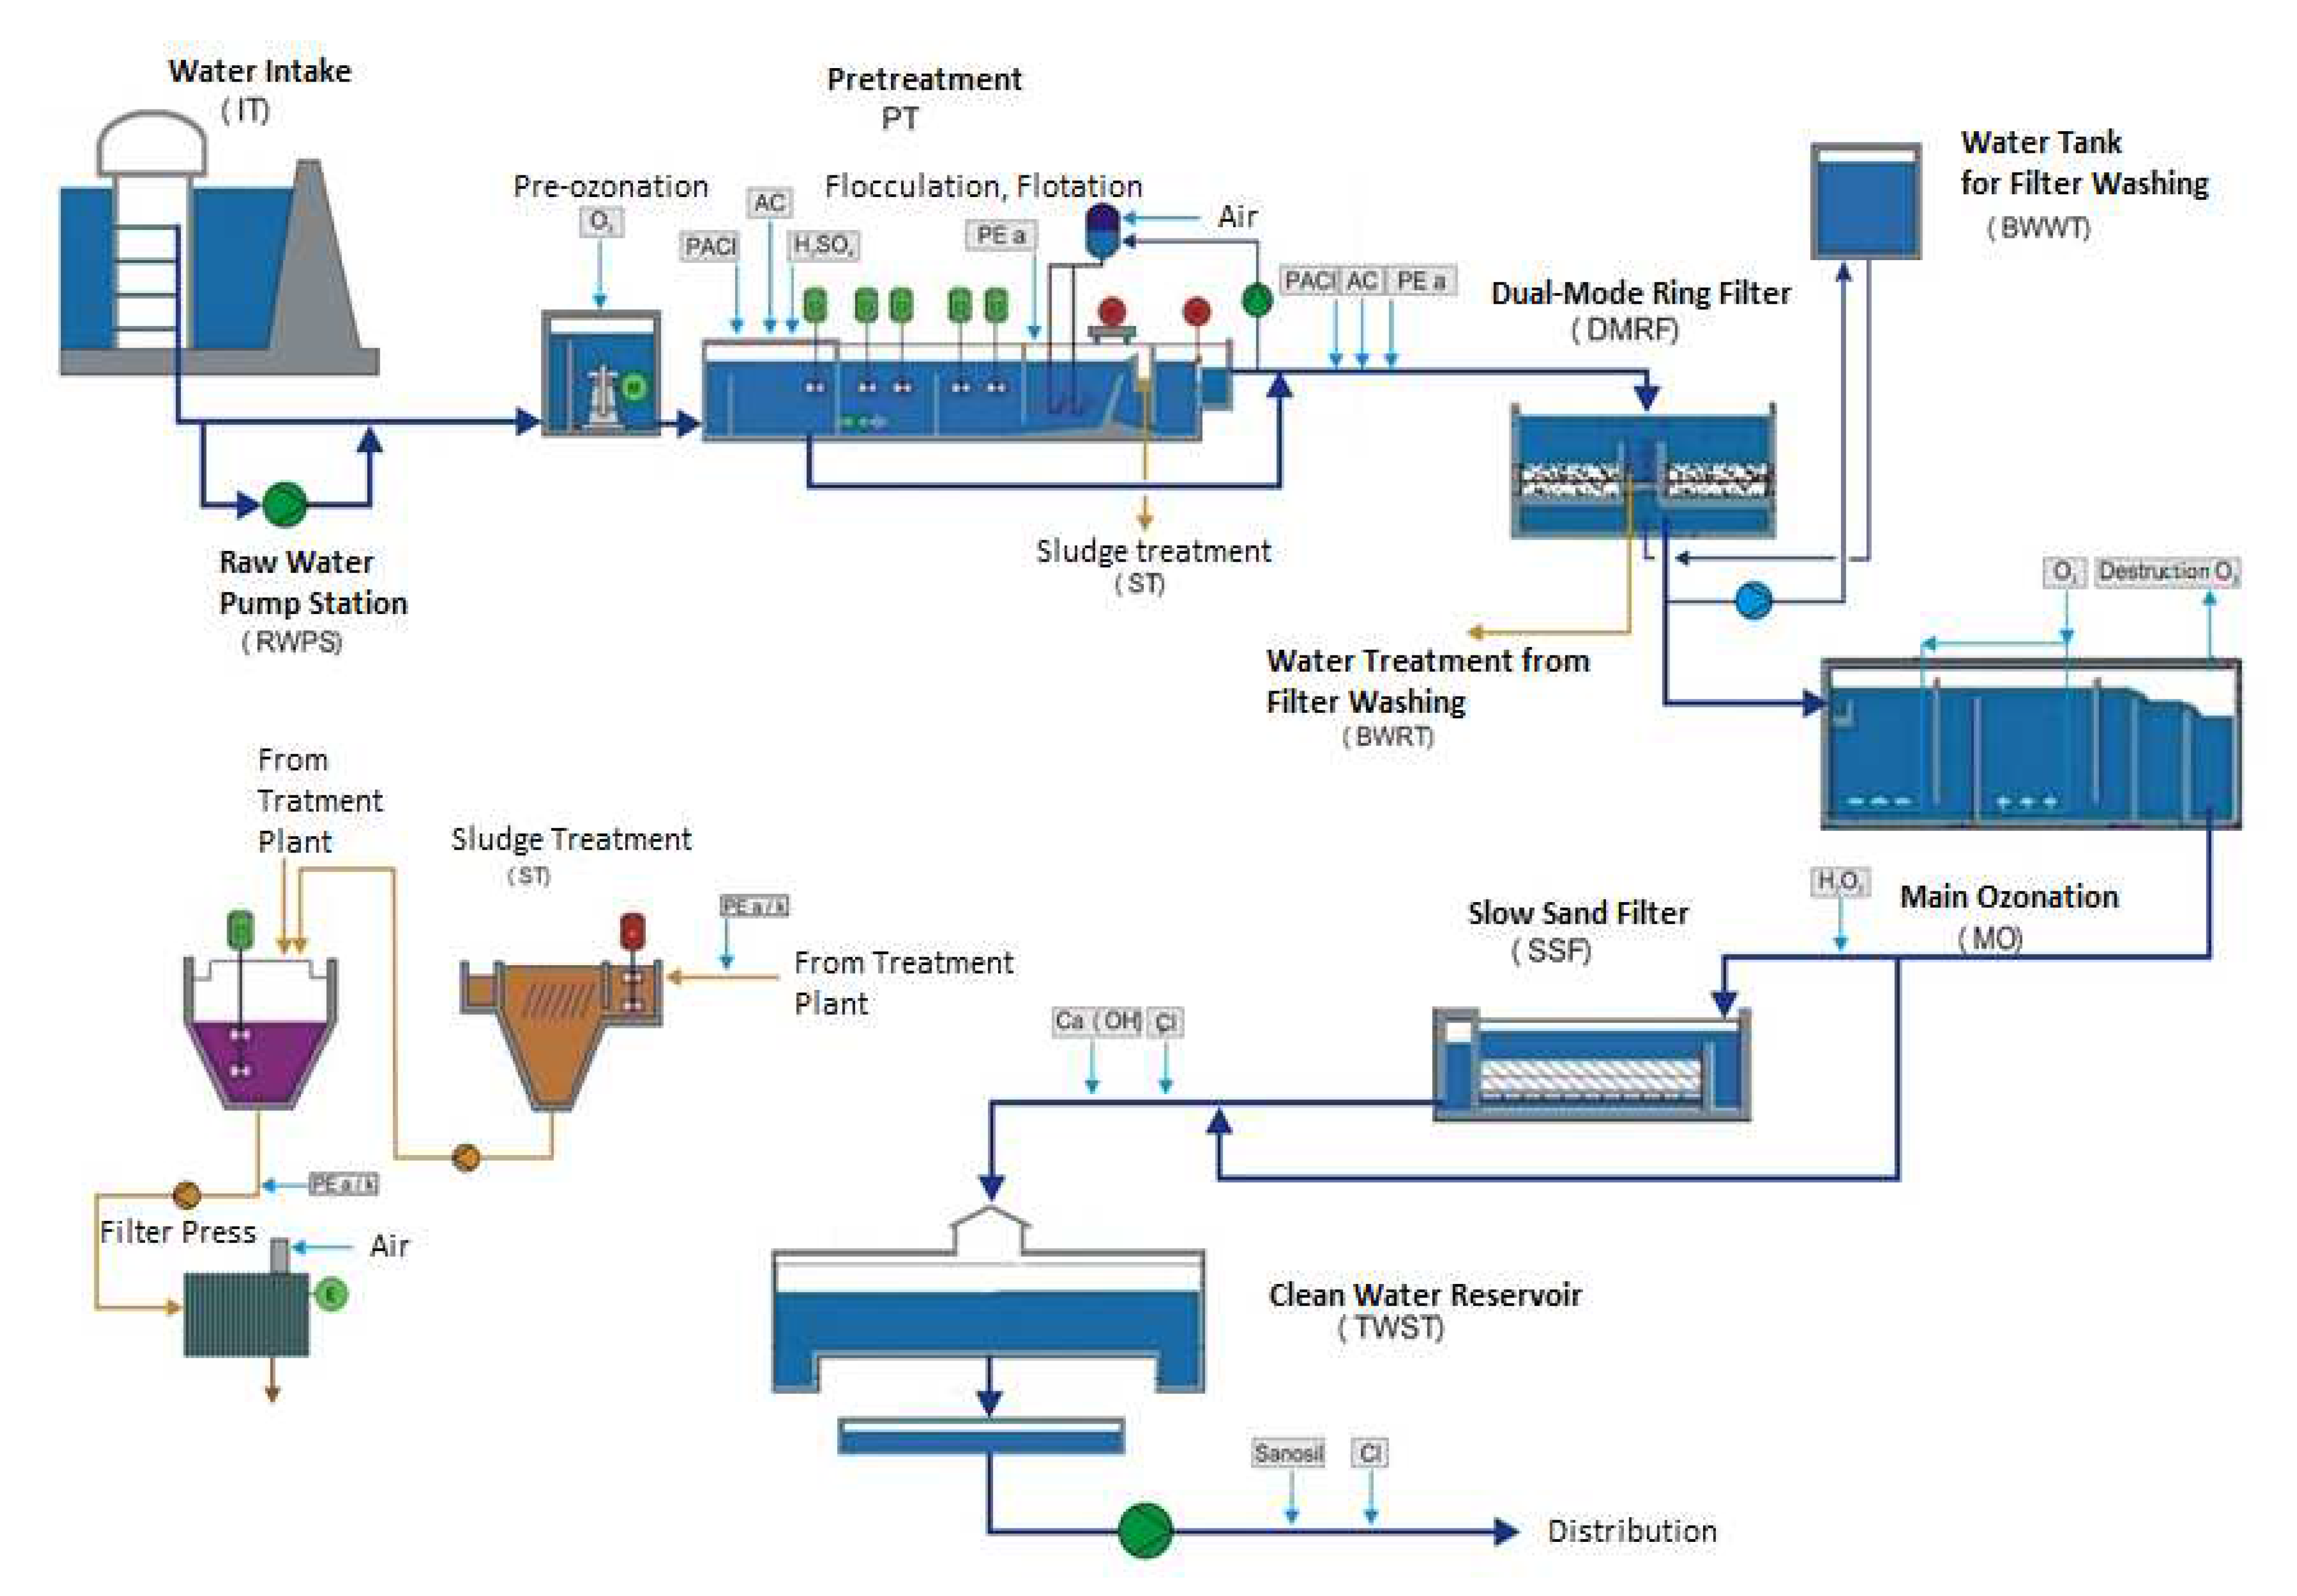
2. Study Area and Data Description

For the process of obtaining drinking water on the DWTP, raw water was taken from the Butoniga reservoir (Figure 1). The Butoniga reservoir is an artificial lake created in 1987 with two main objectives: I) protection from adverse water impacts, and II) drinking water supply. It has a watershed area of about 73 km2, ranging in elevation from 40 to 500 masl. The volume of the reservoir is 19.5 million m3, the surface area about 2.5 km2, with an average depth of 7.8 m and a maximum depth of 17.5 m.
As a small and relatively shallow reservoir, it is very sensitive to eutrophication and degradation processes caused by climate change and human activities. Known and conventional pressures in the surrounding watershed include erosion and leaching of nutrients from agricultural lands, as well as from untreated wastewater from settlements that are drained to the reservoir through black pits or open sewers [17].
The Butoniga DWTP is located about 600 m downstream from the dam of the Butoniga reservoir, on an area of 80,000 m2 (Figure 1). The first phase of the Butoniga DWTP is designed to process 1000 L/s or 3600 m3/h. Parts of the process are designed for a final capacity of 2000 L/s, which is planned in the second phase. All process units are designed for 24-h full capacity with a hydraulic reserve of 25%. The plant can operate flexibly by changing the capacity from 20 to 100% of the nominal capacity. The main drinking water treatment process (Figure 2) consists of the following units: raw water intake, pre-ozonation, coagulation–flocculation, flotation, rapid filtration, main ozonation, slow sand filter, disinfection, final pH correction, pressure pumping and chlorination. The auxiliary process (Figure 2) of drinking water treatment consists of the following units: station for cleaning sand from slow sand filters, treatment of water from washing filters, sludge treatment, and neutralization of wastewater from chemicals. The plant was completed and put into operation in June 2002, while it has been in continuous operation since the spring of 2004 [18].
The operation of the DWTP is mainly related to the tourist season, and, of the 5,000,000 m3 of produced and distributed water annually, 3,000,000 m3 is produced and distributed during 15 June to 15 September, when the water quality in the Butoniga reservoir is the worst [18].
As mentioned in the introduction, the main problem with the Butoniga reservoir, and thus the DWTP, appears in the summer months when the water temperature is the most critical parameter, and water for the treatment process must be captured from the lowest layer which have increased concentrations of Mn, Fe, NH4 and lower pH values, and thus influence the treatment processes [18].
The data set for the calculation and prediction of WQI consists of physical and chemical parameters measured once a day at the input of raw water to the DWTP, from 2011 to 2020. Physiochemical parameters include temperature (Temp), pH, turbidity (Tur), oxygen concentration (O2), total organic carbon (TOC), potassium permanganate (KMnO4), ammonia (NH4), manganese (Mn), aluminum (Al), iron (Fe) and the amount of organic substances (UV254), whose concentrations are determined in the internal laboratory of the Butoniga DWTP by standard analytical methods according to ISO standards [21] and standard methods for the examination of water and wastewater [22].
For the calculation of WQI, the following parameters were used: temperature, pH, turbidity, KMnO4, NH4, Mn, Al and Fe; while for the prediction of WQI, along with the other parameters, oxygen concentration, total organic carbon and UV254 were additionally used.
The data were pre-processed regarding to the modelling and research goal. For the WQI prediction models, the entire span of the measured data was used, from 2011 to 2020, while missing data were managed with a cubic spline interpolation.

3. Materials and Methods

3.1. Modelling Methods; Rule-Based Models

Rule-based regression models for numeric prediction are yet another model representation, where the models are interpreted as a set of IF THEN rules, where each rule is associated with a multivariate linear model. A rule indicates that, whenever a case satisfies all the conditions, the linear model is appropriate for predicting the value of the target attribute. The algorithms for rule induction mostly represent different variations of the M5 algorithm. The algorithm implemented in a software package WEKA [23] was applied for modelling, in which the variation of the M5 algorithm (M5P) was enhanced by combining model-based and instance-based learning [24].
After the rule-based models are constructed from the training (learning) set of data, it is necessary to assess the model quality, i.e., the accuracy of prediction. This can be done by simulating the model on a testing set of data and comparing the predicted values of the target with the actual values. Another option is to employ a cross-validation method. The given (training) dataset is partitioned into a chosen number of folds (n). In turn, each fold is used for testing, while the remainder (n−1 folds) is used for training. The final error is the averaged error of all the models throughout the procedure. The size of the error between the actual and the predicted values can be calculated by several measures to evaluate the model accuracy: root mean-squared error, mean absolute error, root relative squared error, relative absolute error, and correlation coefficient (R) [23].
In this research, for the experiments, the accuracy of the prediction models was evaluated through the correlation coefficient, and the quality of the models was done using the cross-validation method in the software package WEKA [23].

3.2. Water Quality Index

To calculate WQI, Croatian drinking water quality standards and recommendations were used [19], so that the resulting WQI represents water appropriateness for use in the drinking water supply. The WQI was conducted in three steps.
In the first step, each of the 8 parameters is assigned weight (wi) according to its relative importance in the total quality of the drinking water (Table 1). A maximum weight of 5 is assigned to Mn, Al and Fe as a parameter, which has great impact in water quality assessment for the Butoniga reservoir and for drinking water production [18]. Furthermore, temperature, oxygen concentration and UV254 were assigned a minimum weight of 1, because these parameters are not harmful or toxic at the expected concentrations for drinking water production [18].
In the second step, relative weight (Wi) is calculated from the formula:
W i = w i i n w 1 ,
where Wi is relative weight; wi is the weight of each parameter; and n is the number of parameters.
Calculated values of the relative weights (Wi) of each parameter are shown in Table 1.
In the third step, the quality based on concentration of the ith parameter (qi) is determined by dividing its concentration in each water sample and its corresponding limit values according to the Croatian guidelines for drinking water quality standards and recommendations [19], and the result is multiplied by 100.
q i = C i S i × 100 ,
where qi is the rating based on concentration of ith parameter; Ci is the concentration of each analyzed parameter expressed in mg/L; and Si is the recommendation of Croatian legislation for each analyzed parameter expressed in mg/L.
To calculate WQI, first, the sub-index for each analyzed parameter (SIi) used for determination of WQI is determined.
S I i = W i × q i ,
WQI = i 1 n S I i ,
where SIi is the sub-index of each analyzed parameter; qi is the rating based on concentration of ith parameter; and n is the number of parameters.
If the WQI is calculated with a smaller number of indicators (less than 12), as in this case, then the sum of sub-indices of all parameters are divided by the sum weighting factors of available analyzed parameters.
Based on the calculated WQI values, tested water samples are classified into five categories of “excellent water” to “unfit for drinking” (Table 2) [25].

3.3. Description of the Modelling Experiment
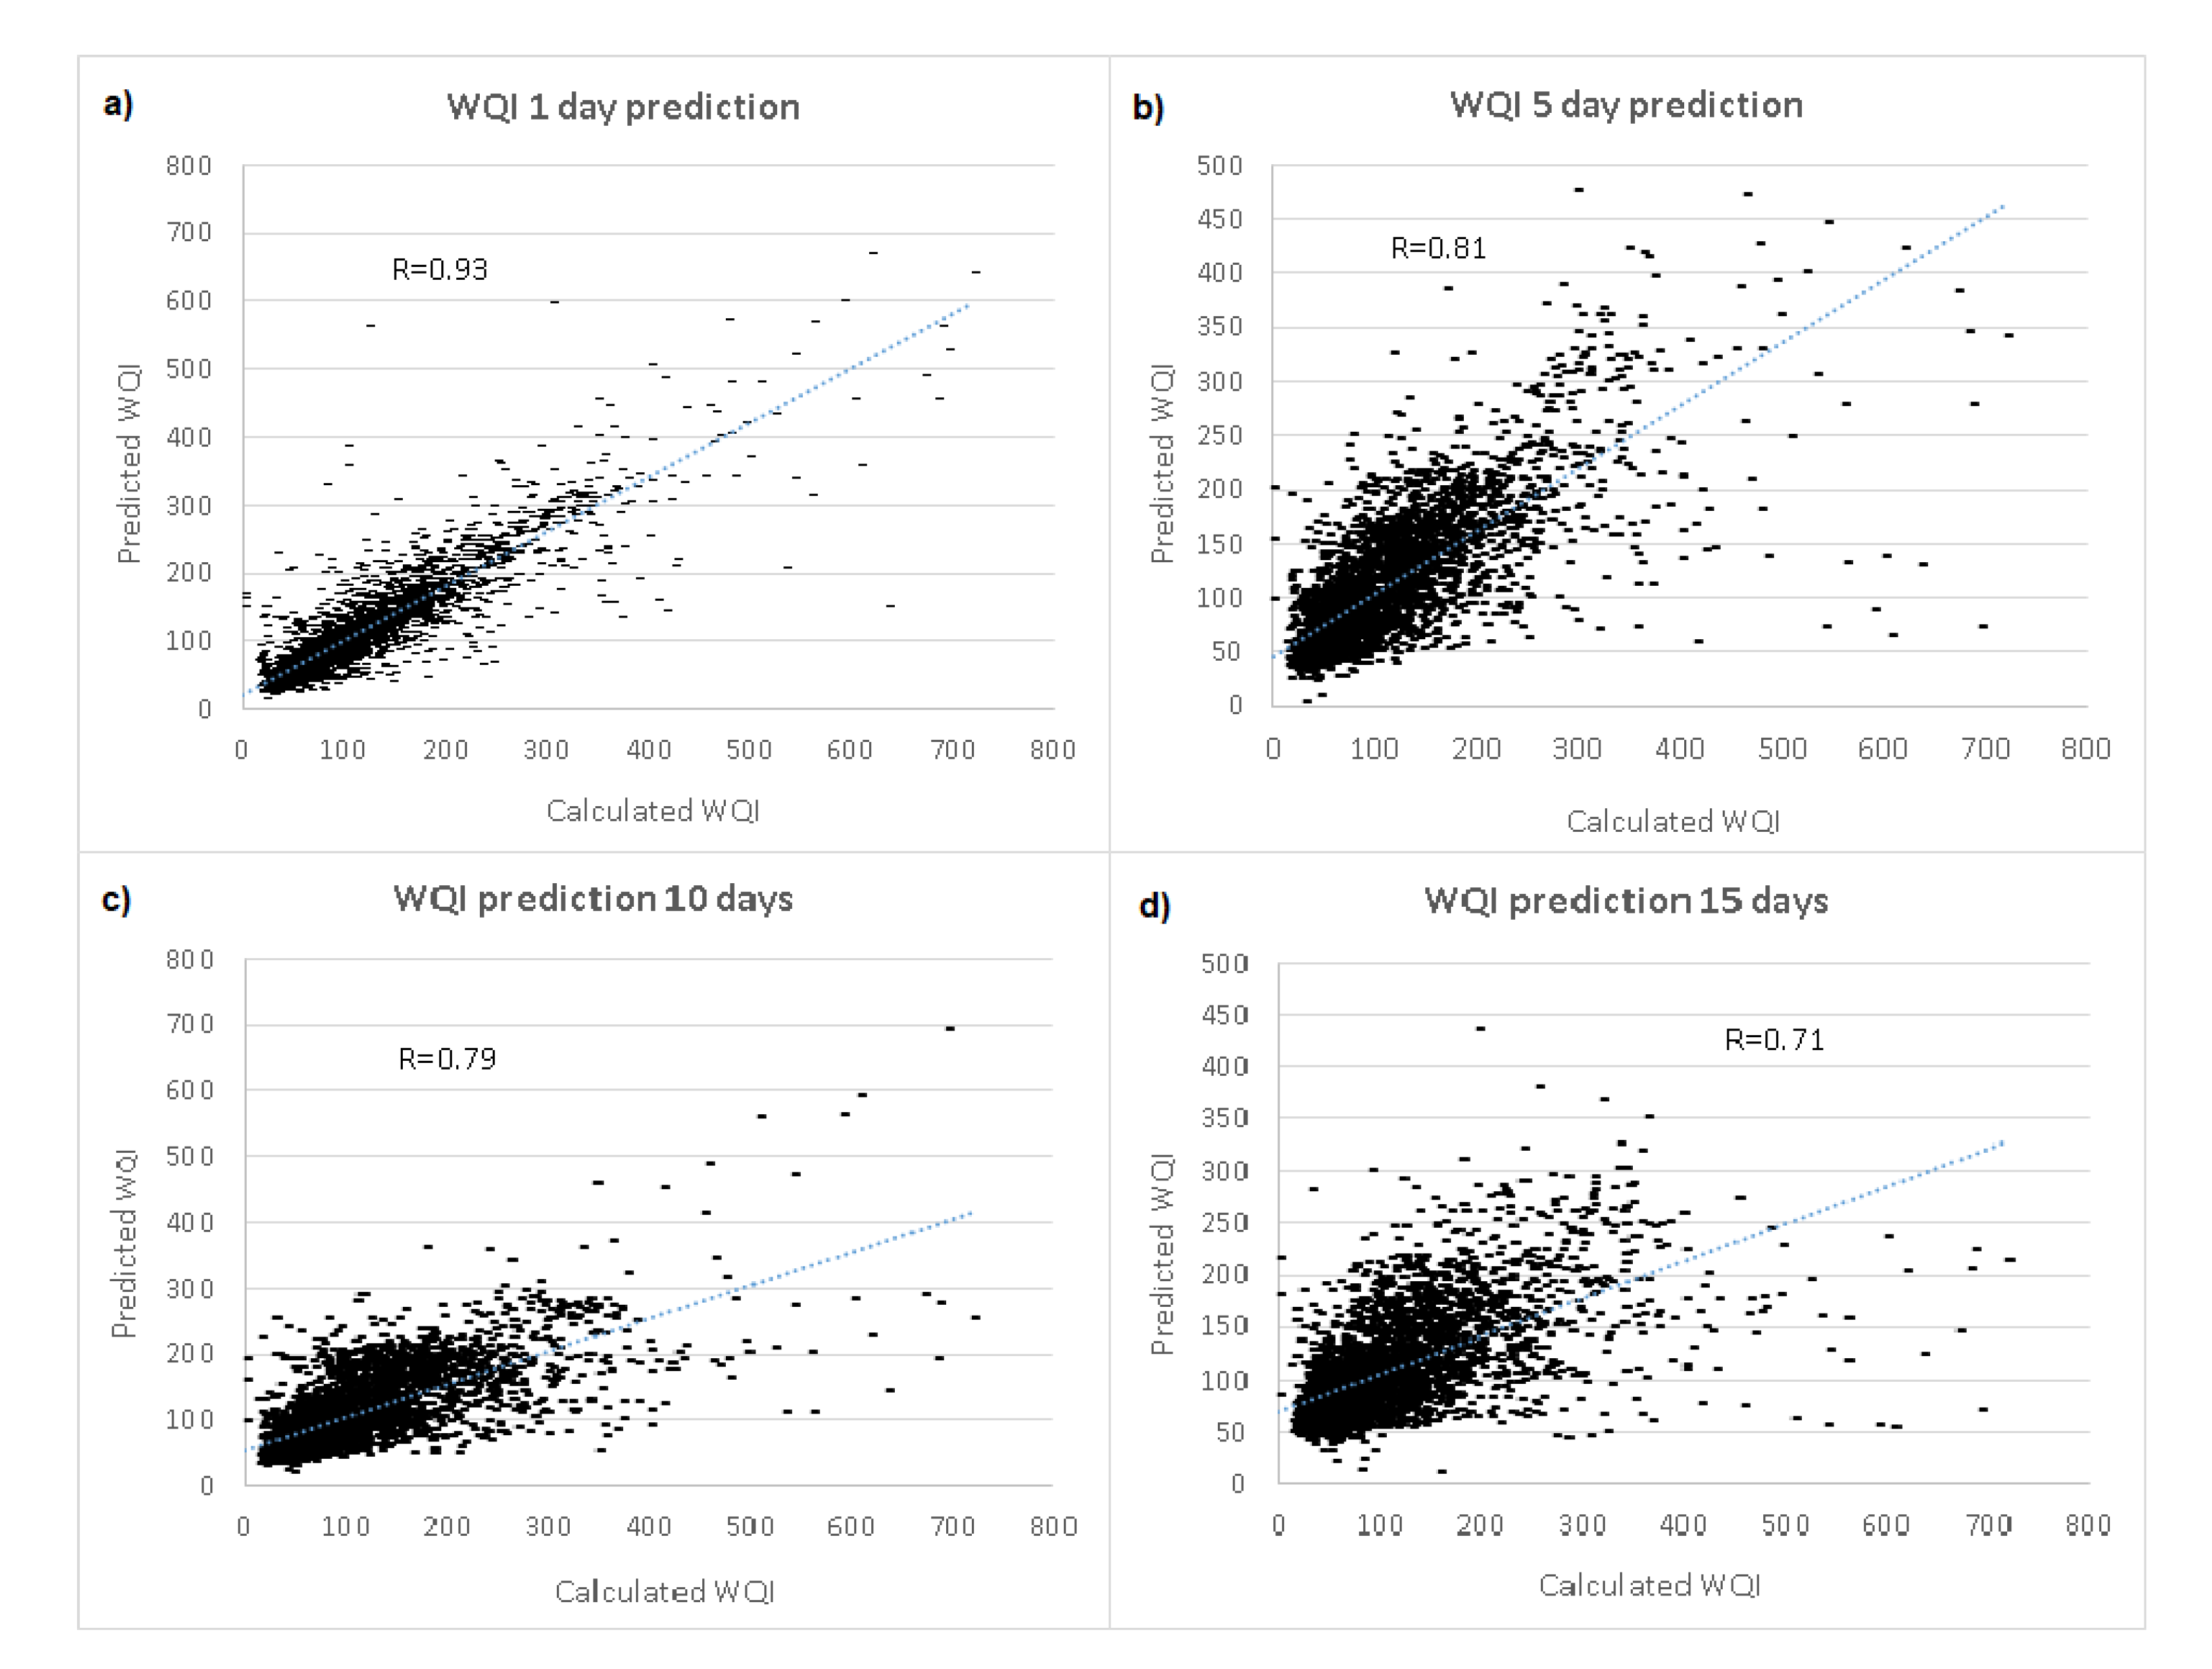
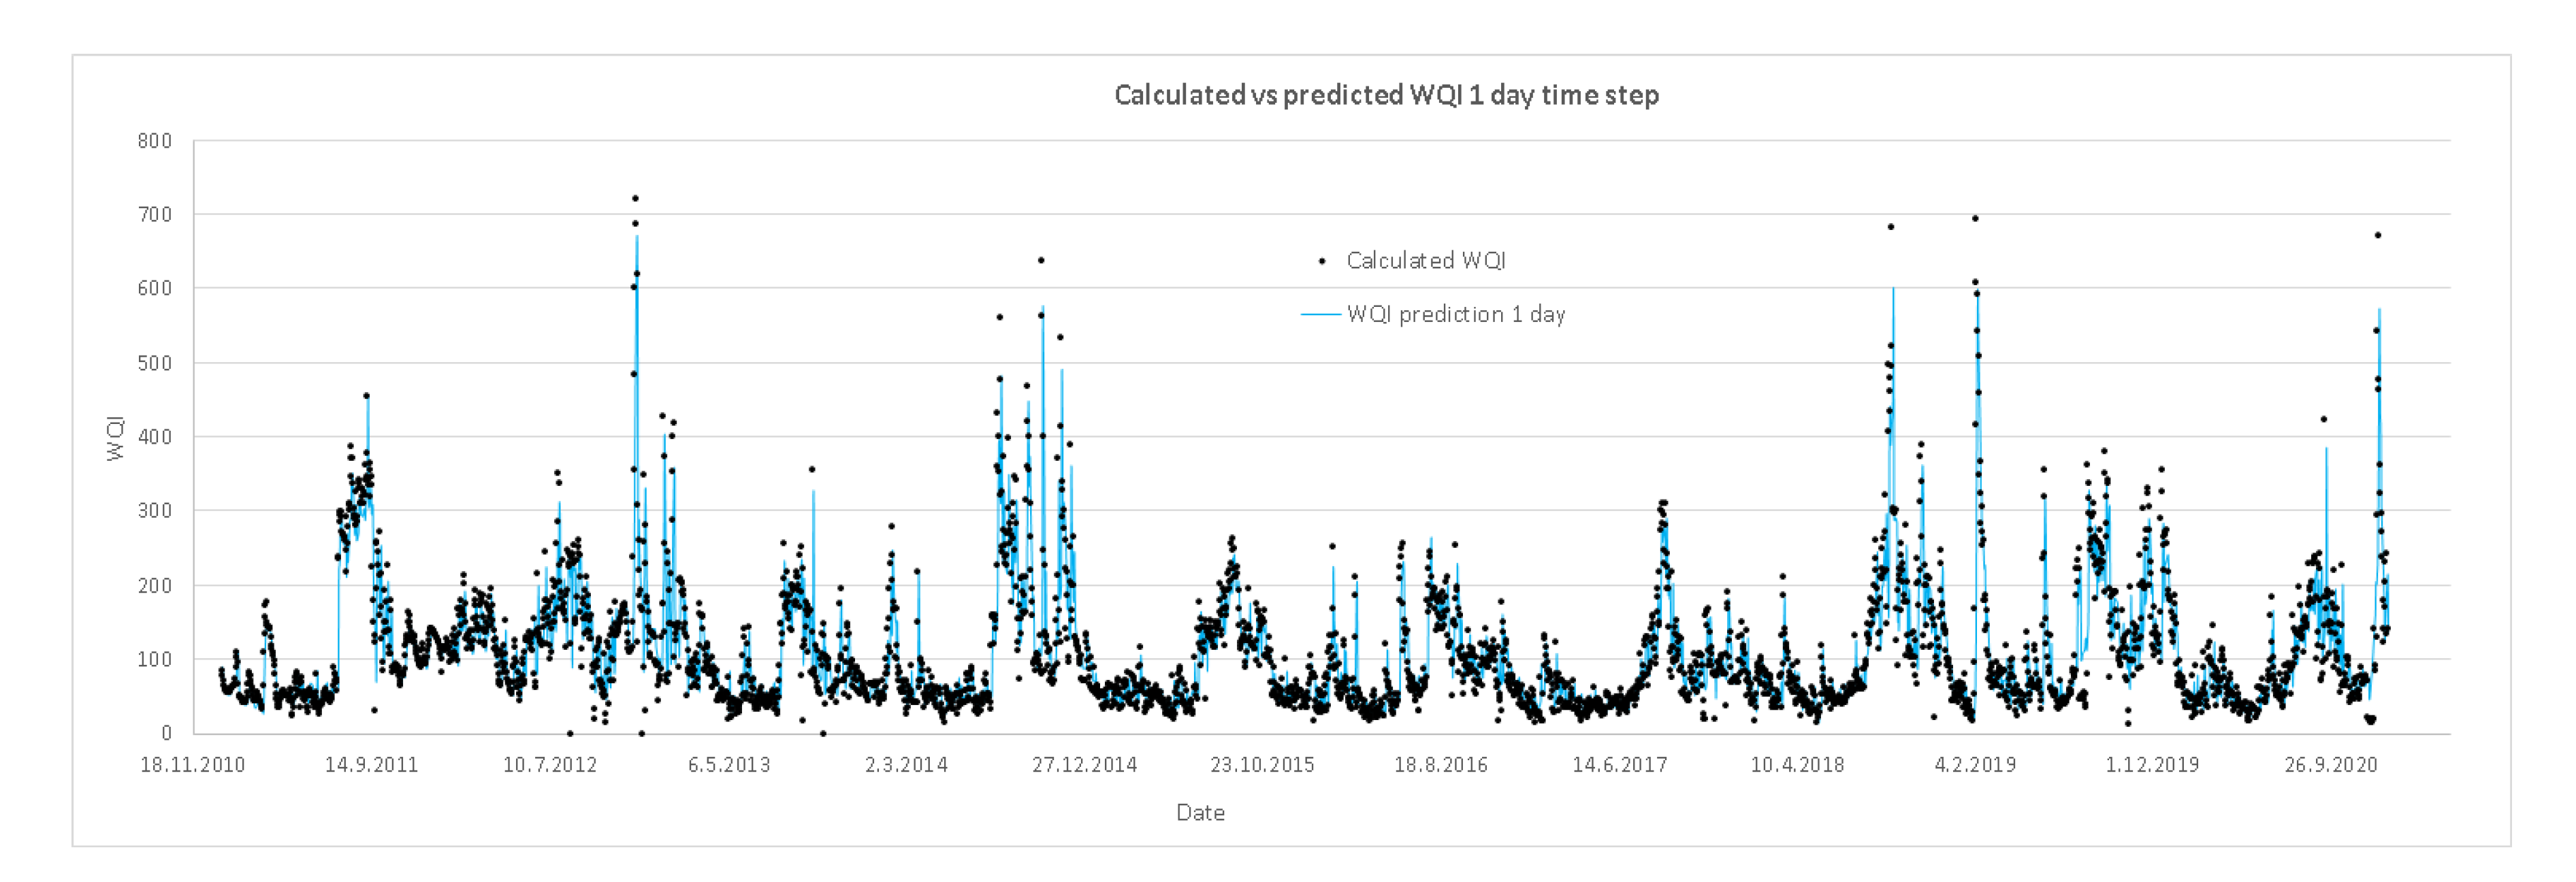
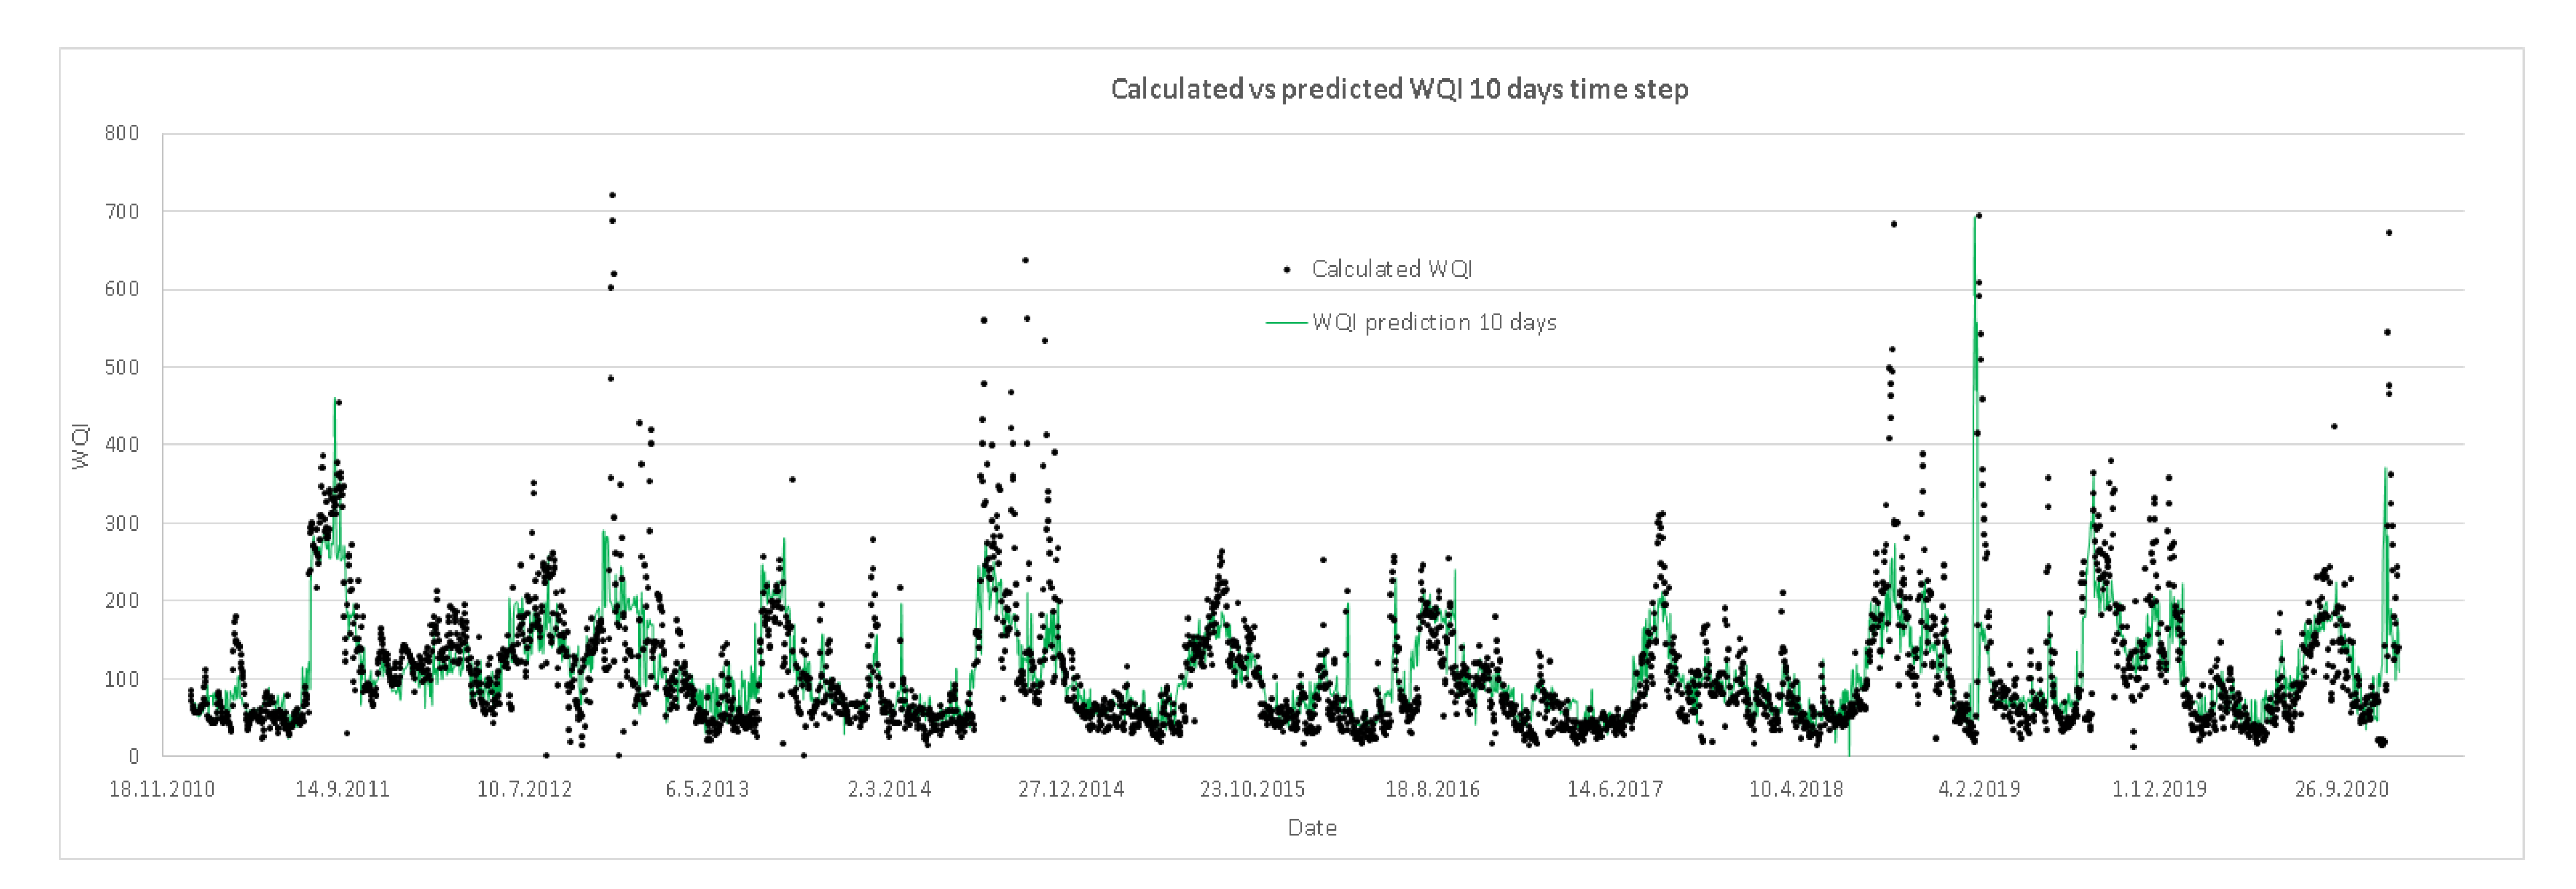
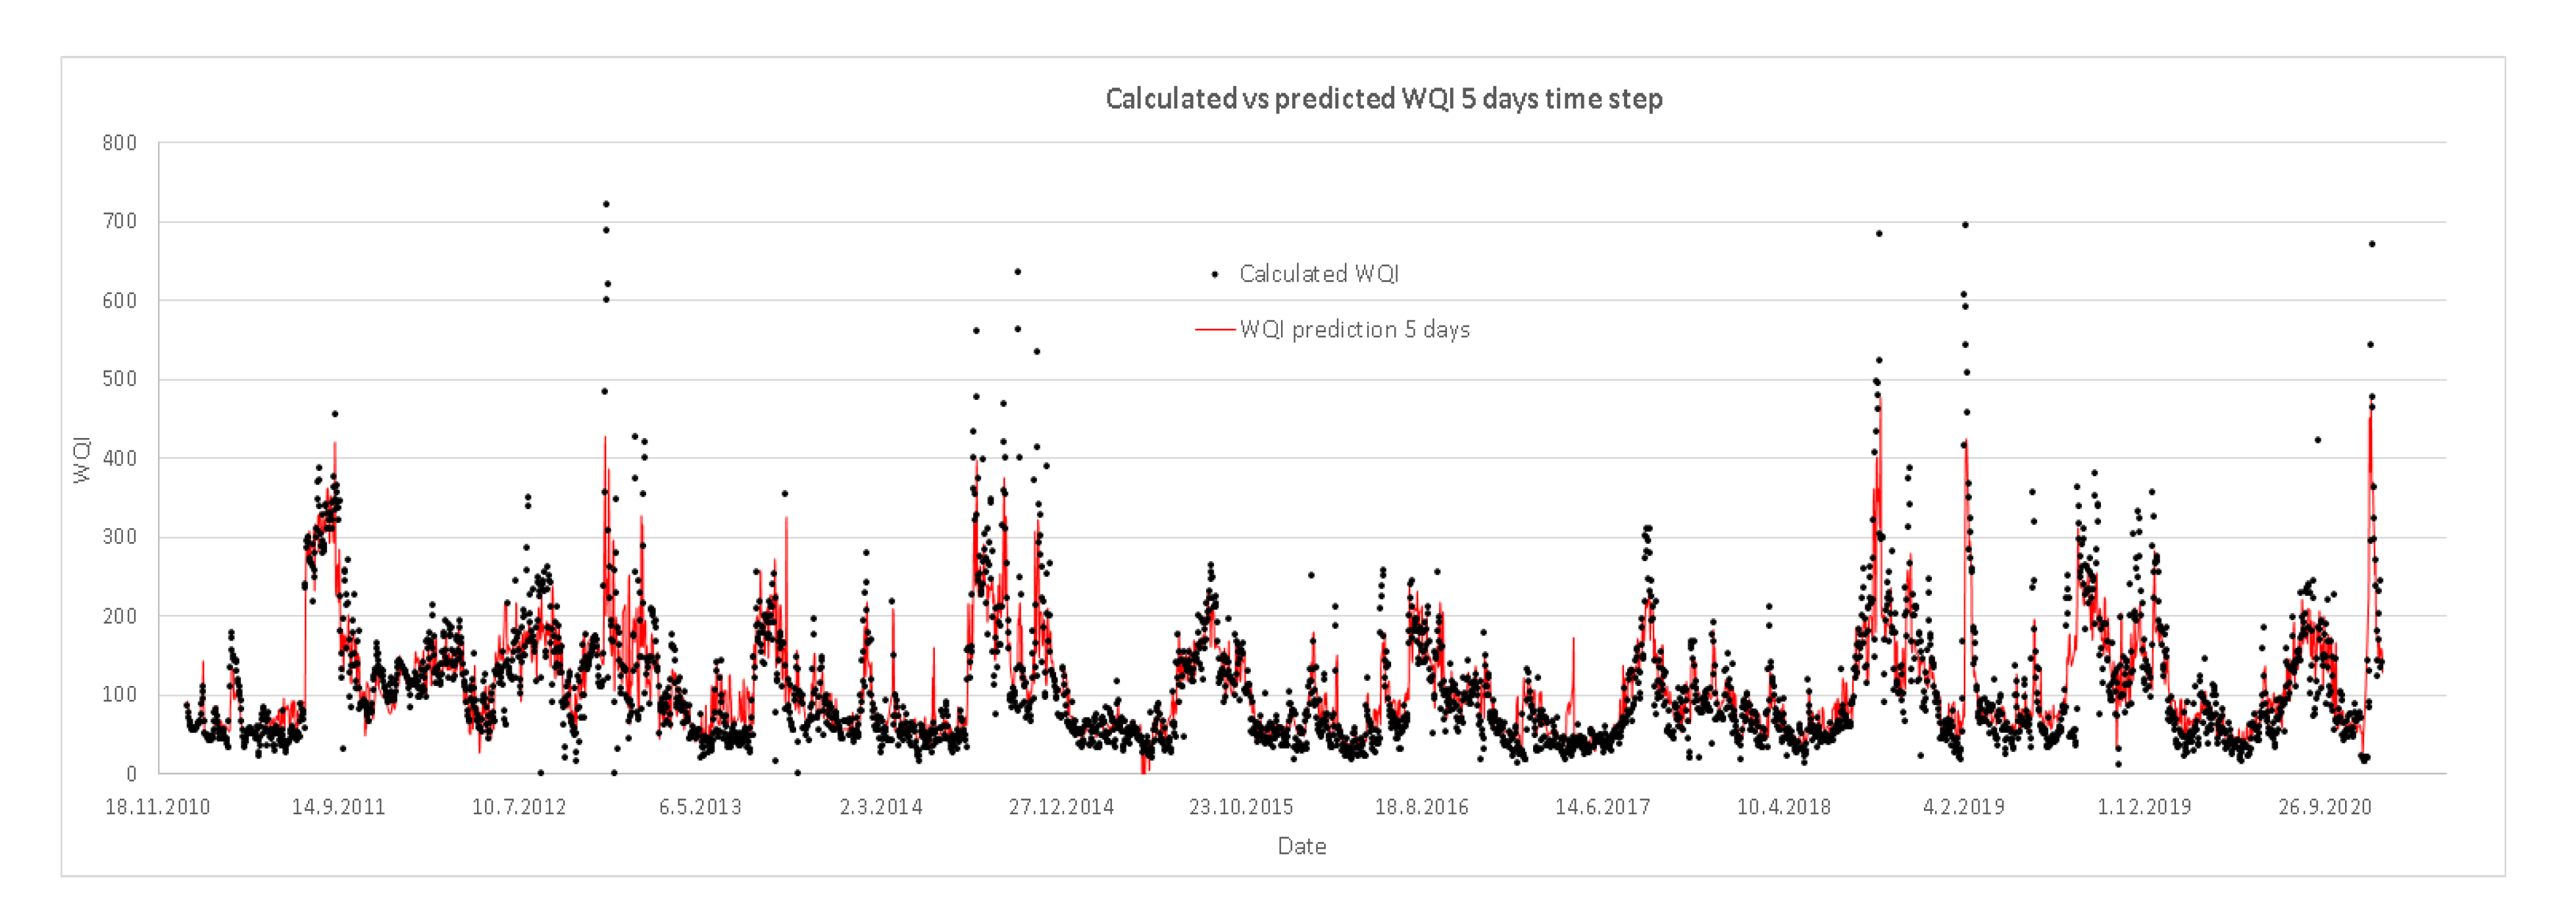
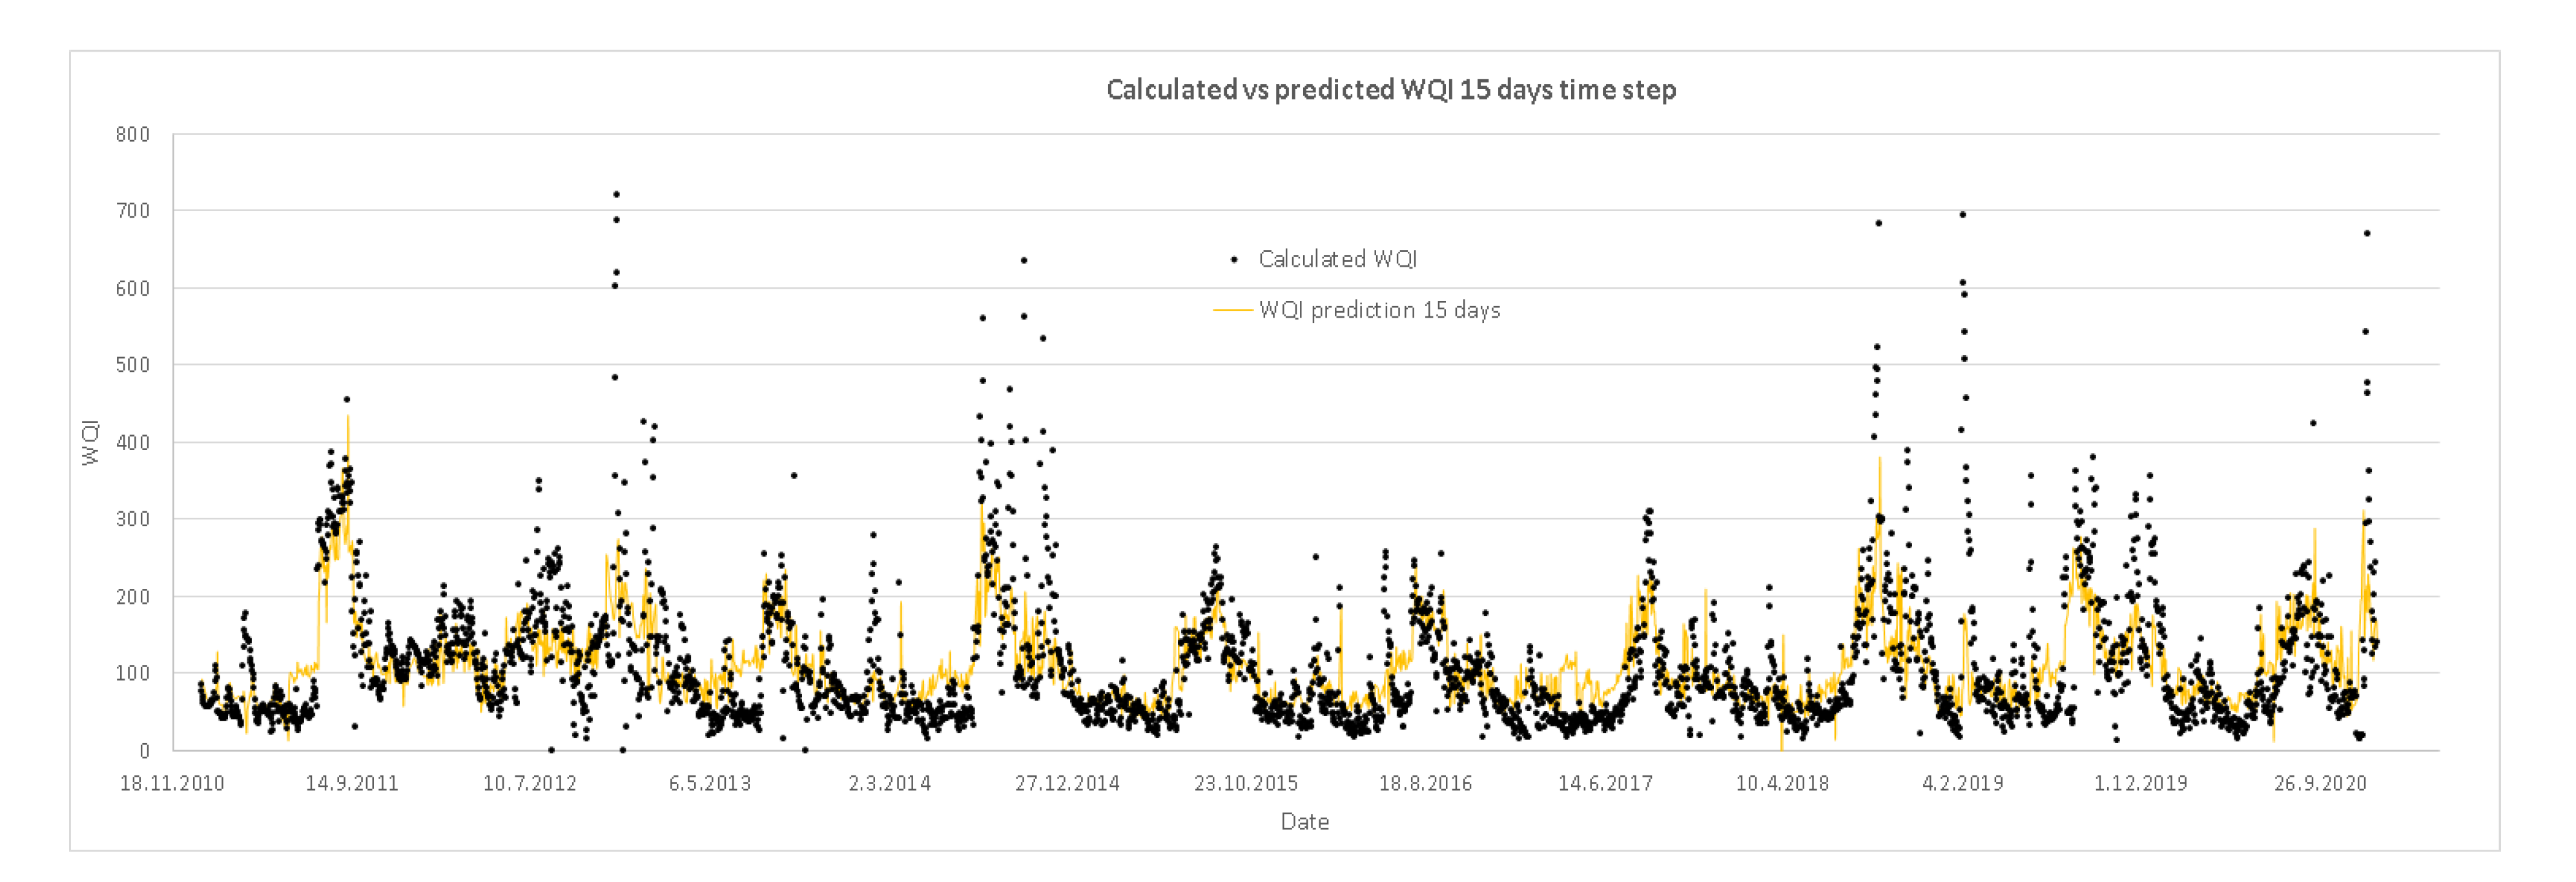
The data used for building WQI prediction models are depicted in Table 3. All data were pre-processed with respect to modelling and research goals based on the knowledge of modelling experts on the analyzed DWTP. Four models were built to predict WQI one, five, ten and fifteen days in advance, with the purpose to improve treatment processes on DWTP regarding changes of raw water quality in the Butoniga reservoir. Therefore, these models would help to manage treatment processes which are dependent on the quality of raw water in the Butoniga reservoir.
For the experiment, the ML algorithm M5P for rule-based models integrated in the WEKA modelling software [23] was used. Predicted WQI (one, five, ten and fifteen days) was set as a target (dependent) variable, whereas water temperature, pH, turbidity, KMnO4, NH4, Mn, Al, Fe, O2, TOC and UV254 (Table 3) were set as independent variables (descriptors) from which the predicted values of WQI were modelled. The above parameters were mainly used because they best represent the parts of the system (DWTP) on top of which the target variable relays.
The aim of all prediction models is to be as much as possible applicable and valid for the prediction of WQI, meaning that they should perform as accurately as possible. To achieve this, the most commonly used procedures of building and testing models was applied; the entire data set was taken for training while validating with 10-fold cross-validation (see Section 3.1). To achieve the highest correlation coefficient (R) and the optimal number of rules, default values of parameters for building models were used in WEKA modelling software [23].
The model performing most accurately according to the validation method was selected as a representative model for the prediction purposes. The accuracy of the models is evaluated through the correlation coefficient (R).

4. Results

The models for predicting WQI with a time step of one, five, ten and fifteen days in advance were built with the M5P algorithm for induction of rule-based models, which was implemented in the software package WEKA [23]. For the prediction models, the entire span of the measured data was used, from 2011 to 2020, with daily sampling frequency. Missing data were managed by using a cubic spline interpolation, and to select the best model, the model selection procedure described in Section 3.1 was used.
First, the built prediction model with a time step of one day is presented in Table 4. The model has only one rule/equation with a very high correlation coefficient (R) of 0.93 when tested with 10-fold cross validation. To predict WQI, the following parameters are needed at present: O2, pH, turbidity, UV254, NH4, Mn, Al, Fe and value of WQI calculated from present data. Using this data in the prediction model, the WQI with a time step of one day can be obtained.
The second prediction model with time step of five days has twelve rules/equations (Table 5), with also a very high correlation coefficient (R) of 0.81 when tested with 10-fold cross validation. To predict WQI, all parameters presented in Table 3 are needed at present. The rule selection depends on the values of the variables in the rule (second column in Table 5). When a rule is selected, a corresponding equation is applied to obtain the WQI five days in advance.
In Table 6, the third prediction model with a time step of ten days is presented, which has fourteen rules/equations with a slightly lower correlation coefficient (R) than the second model of 0.79, but also very high when tested with 10-fold cross-validation. To predict WQI, all parameters presented in Table 3 are needed at present. The rule selection is the same as for the second model, which depends on the values of the variables in the rule, and when a rule is selected, a corresponding equation is applied to calculate the WQI ten days in advance.
The fourth and final model with a prediction of fifteen days’ time step is presented in Table 7. The prediction model has only five rules/equations, but with a slightly low correlation coefficient (R) of 0.71 when tested with 10-fold cross-validation. To predict WQI, all parameters presented in Table 3 are needed at present. The rule selection is the same as for other models, from which the WQI can be calculated fifteen days in advance. The number of rules was expected to be higher as the time step increases and with given default values of the parameters in WEKA to obtain a higher correlation coefficient and the optimal number of rules, as explained in Section 3.3; however, surprisingly, the number of rules is less than for the second and third model.
The correlation between the calculated and the modelled (predicted) values of WQI is presented on Figure 3, as the correlation coefficient (R). From Figure 3, it can be seen that as the time step increases, the accuracy of the model slowly decreases as expected: for the one day prediction model, the correlation coefficient is 0.93; for the five days prediction model, 0.81; for the ten days prediction model, 0.79; and finally, for the fifteen days prediction model, 0.71.
The performance of the prediction models is presented in Figure 4, Figure 5, Figure 6 and Figure 7. Each figure represents the modelled (predicted) vs. calculated values of the WQI for the given time period of one, five, ten and fifteen days in advance. Figure 4 indicates very high accuracy of the first prediction model with a one day time step compared to the calculated data of the WQI, with a good prediction of the peak values included. Increasing the time step to five (Figure 5), ten (Figure 6) and fifteen days (Figure 7), the accuracy of the models slowly decreases, as can also be seen from Figure 3; however, regardless of that, the good prediction of the peak values remains, and as such, models can be used in prediction purposes.
Overall, obtained results, i.e., prediction models, are at an acceptable level when considering the correlation coefficients and the prediction of the peak values. As such, they can help in optimization of the treatment processes which are dependent on the quality of raw water in the Butoniga reservoir, and overall, in the sustainability of the DWTP.

5. Discussion

Within this research, simple and yet efficient WQI prediction models were developed for the Butoniga DWTP using ML tools. The models predict the values of WQI one, five, ten and fifteen days in advance, given the present observed values of thirteen variables, and can thus be used as a warning tool and to manage treatment processes of the DWTP which are dependent on the quality of raw water in the Butoniga reservoir. The WQI method was used to determine the water quality of influent at the DWTP.
Simple statistical analysis of WQI showed that only 23% of WQI falls under the “Excellent” water rank according to Table 2; 36% of the WQI falls under the “Good” water rank, 29% falls under the “Bad” water rank, only 8% under the “Very bad” and 4% under the “Unfit for drinking” water rank. Generally, it can be said that most of the water (52%; “Excellent” plus “Good” water rank) is suitable for drinking according to the WQI. As such, much more attention should be addressed to these samples with “Excellent” and “Good” water quality because there is no need to worry about the quality of water and these waters are marginally suitable for drinking and do not need to go through all treatment processes, while the rest of the samples must go through all treatment processes on the Butoniga DWTP. Regardless of that, the DWTP provides water that is safe for drinking according to all examined parameters prescribed by the Croatian regulations [19].
Prediction models for the WQI with a time step of one, five, ten and fifteen days in advance were built with the use of rule-based models integrated in WEKA modelling software [23]. Prediction models are interpreted as a set of IF THEN rules, where each rule is associated with a multivariate linear model. A rule indicates that, whenever a case satisfies all the conditions, the linear model (equation) is appropriate for predicting the value of the target attribute, in this case, WQI. In its structure (rules and equations), the models contain variables (parameters) from Table 3 measured at present to predict WQI one, five, ten and fifteen days in advance in order to improve the treatment processes of the DWTP regarding changes in raw water quality in the Butoniga reservoir.
Previous modelling attempts regarding a similar problem was done in [7], where the effluent water quality of a treatment plant in Turkey, according to WQI and HRA, was investigated using PCA. Generally, the main conclusion of this study is that the water was suitable for drinking purposes, and the treatment plant provides excellent stable water quality; as a result of HRA, parallel with WQI results, it has been found that the risk for people is “negligible”.
In other research, such as [7,9,10,11,12,13,14,15,16], various ML algorithms and methods were used, such as PCA, ANN, NARNET, LSTM, MLP, CNN, RF, NN, MLR, SVM, BTM, RSS, AR, SVR, LWLR, GNB, SGD, KNN, DT, GBC, BC, SLR and RLR in predicting WQI for various purposes, i.e., efficient and better prediction of WQI [9,11,13], water quality management [10], health risk assessment and water supply quality for drinking purposes [7], water quality classification of rivers, lakes, reservoirs [14,15,16], etc.
As mentioned in the introduction, the main problem with the Butoniga reservoir, and thus affecting treatment processes on DWTP, appears in the summer months when the water temperature is the most critical parameter, and water for the treatment process must be captured from the lowest layer of the reservoir which has increased concentrations of Mn, Fe, NH4 and lower pH values, and thus has influence on the treatment processes of the DWTP [18]. To help to manage treatment processes in mentioned situations during the summer months, the obtained prediction models can be used in the prediction of the WQI, i.e., the quality of raw water in the Butoniga reservoir, and thus prepare and define water treatment steps and methods to be used.
Finally, the aim of these models was the prediction of the WQI, and given the accuracy of the models’ performance on unseen data, they can help in the optimization and management of treatment processes on the DWTP which are dependent on the quality of raw water in the Butoniga reservoir, and overall, in the sustainability of the DWTP.

6. Conclusions

In times of increasing demand for potable water, proper optimization and management of DWTPs is needed, both in terms of obtaining the required water quality, and also in terms of the adequate treatment processes used and the consumption of the electric energy. In light of this, in this research, prediction of the WQI was done for the improvement of specific treatment processes of the Butoniga DWTP.
ML methods in the form of rule-based models were applied on the data measured at the intake of raw water from the Butoniga reservoir to predict the WQI one, five, ten and fifteen days in advance. Predictions of the WQI are done according to current values of measured parameters at the intake of raw water. Obtained models have high correlation coefficients and provide accurate predictions of the WQI, correctly predicting the peak values when compared to calculated data of the WQI. As expected, the highest correlation coefficient was the one day prediction, followed by five and ten days; the lowest correlation coefficient was with the fifteen-day prediction.
As such, obtained prediction models can help with the optimization and management of treatment processes of the DWTP, especially during the summer months (tourist season) when the quality of raw water in the Butoniga reservoir is the worst, and where changes in the raw water quality can result in direct action and optimization of the operation of the DWTP. Overall, in this way, obtained models will also help in the sustainability of the DWTP and will improve the operation of the DWTP, which will result in a better water quality, thus benefiting overall public safety.
Future work of this research is focused on defining boundaries, i.e., limit values of the WQI obtained through the prediction models to manage and control specific treatment processes of the Butoniga DWTP. For this, an analysis of the output water quality, the treatment processes included, and the consumed electric energy on the DWTP will be conducted.

Author Contributions

Conceptualization, G.V. and I.S.Č.; methodology, G.V.; software, G.V.; validation, G.V., I.S.Č. and E.Ž.; formal analysis, G.V. and S.Z.; investigation, G.V.; resources, S.Z.; data curation, S.Z.; writing—original draft preparation, G.V.; writing—review and editing, G.V., I.S.Č., E.Ž. and S.Z.; visualization, G.V.; supervision, G.V. All authors have read and agreed to the published version of the manuscript.

Funding

This research received no external funding.

Institutional Review Board Statement

Not applicable.

Informed Consent Statement

Informed consent was obtained from all subjects involved in the study.

Data Availability Statement

Restrictions apply to the availability of these data. Data were obtained from Istarski vodovod d.o.o. Buzet and are available [www.ivb.hr] with the permission of Istarski vodovod d.o.o. Buzet.

Acknowledgments

This research has been fully supported by the University of Rijeka under projects: “Sustainable River Basin Management by Implementation of Innovative Methodologies, Approaches and Tools” (uniri-tehnic-18-129) and “Hydrology of Water Resources and Identification of Flood and Mudflow Risk in Karst” (uniri-tehnic-18-54). Also this research has been supported by project “Influence of Summer Fire on Soil and Water Quality”, founded by the Croatian Science Foundation (IP-2018-01-1645). Authors greatly appreciate the comments of the three anonymous reviewers who helped substantially in improving the paper.

Conflicts of Interest

The authors declare no conflict of interest.

Abbreviations

AIArtificial Intelligence
ANN Artificial Neural Network
AR Additive Regression
BC Bagging Classifier
BTM Bagged Tree Models
CNN Convolutional Neural Network
DT Decision Tree
DWTP Drinking Water Treatment Plant
GBC Gradient Boosting Classifier
GNB Guassian Naïve Bayes
HRA Health Risk Assessment
KNN k-Nearest Neighbors
LSTM Long Short-Term Memory
LWLR Locally Weighted Linear Regression
MAC Maximum Allowable Concentration
ML Machine Learning
MLP Multilayer Perceptron
MLR Multinomial Logistic Regression
NARNET Nonlinear Autoregressive Neural Network
NN Neural Network
PCA Principal Component Analysis
R Correlation Coefficient
RF Random Forest
RLR Ridge and Lasso Regression
RSS Random Subspace
SGD Stochastic Gradient Descent
SLR Simple Linear Regression
SVM Support Vector Machine
SVR Support Vector Regression
WQI Water Quality Index

References

  1. Aalipour Erdi, M.; Gasempour Niari, H.; Meshkini, S.R.M.; Foroug, S. Surveying drinking water quality (Balikhlou River, Ardabil Province, Iran). Appl. Water Sci. 2018, 8, 34. [Google Scholar] [CrossRef]
  2. Kumar, A.; Sharma, M.P.; Rai, S.P. A novel approach for river health assessment of Chambal using fuzzy modeling, India. Desalination Water Treat. 2017, 58, 72–79. [Google Scholar] [CrossRef]
  3. Kumar, A.; Taxak, A.K.; Mishra, S.; Pandey, R. Long term trend analysis and suitability of water quality of River Ganga at Himalayan hills of Uttarakhand, India. Environ. Technol. Inno. 2021, 22, 101405. [Google Scholar] [CrossRef]
  4. Tiri, A.; Belkhiri, L.; Mouni, L. Evaluation of surface water quality for drinking purposes using fuzzy inference system. Groundw. Sustain. Dev. 2018, 6, 235–244. [Google Scholar] [CrossRef]
  5. Braga, F.H.R.; Dutra, M.L.S.; Lima, N.S.; Silva, G.M.; Miranda, R.C.M.; Firmo, W.C.A.; Moura, A.R.L.; Monteiro, A.S.; Silva, L.C.N.; Silva, D.F.; et al. Study of the Influence of Physicochemical Parameters on the Water Quality Index (WQI) in the Maranhão Amazon, Brazil. Water 2022, 14, 1546. [Google Scholar] [CrossRef]
  6. Xiao, J.; Wang, L.; Deng, L.; Jin, Z. Characteristics, sources, water quality and health risk assessment of trace elements in river water and well water in the Chinese Loess Plateau. Sci. Total Environ. 2019, 650, 2004–2012. [Google Scholar] [CrossRef] [PubMed]
  7. Alver, A. Evaluation of conventional drinking water treatment plant efficiency according to water quality index and health risk assessment. Environ. Sci. Pollut. Res. 2019, 26, 27225–27238. [Google Scholar] [CrossRef] [PubMed]
  8. Mbavarira, T.M.; Grimm, C. A Systemic View on Circular Economy in the Water Industry: Learnings from a Belgian and Dutch Case. Sustainability 2021, 13, 3313. [Google Scholar] [CrossRef]
  9. Aldhyani, T.H.H.; Al-Yaari, M.; Alkahtani, H.; Maashi, M. Water Quality Prediction Using Artificial Intelligence Algorithms. Appl. Bionics Biomech. 2020, 2020, 6659314. [Google Scholar] [CrossRef] [PubMed]
  10. Sheikh Khozani, Z.; Iranmehr, M.; Wan Mohtar, W.H.M. Improving Water Quality Index prediction for water resources management plans in Malaysia: Application of machine learning techniques. Geocarto Int. 2022, 1–18. [Google Scholar] [CrossRef]
  11. Hassan, M.; Hassan, M.; Akter, L.; Rahman, M.; Zaman, S.; Hasib, K.; Jahan, N.; Smrity, R.N.; Farhana, J.; Raihan, M.; et al. Efficient Prediction of Water Quality Index (WQI) Using Machine Learning Algorithms. Hum. Cent. Intell. Syst. 2021, 1, 86–97. [Google Scholar] [CrossRef]
  12. Kouadri, S.; Elbeltagi, A.; Islam, A.R.M.T.; Kateb, S. Performance of machine learning methods in predicting water quality index based on irregular data set: Application on Illizi region (Algerian southeast). Appl. Water. Sci. 2021, 11, 190. [Google Scholar] [CrossRef]
  13. Ahmed, U.; Mumatz, R.; Anwar, H.; Shah, A.A.; Irfan, R.; Garcia-Nieto, J. Efficient Water Quality Prediction Using Supervised Machine Learning. Water 2019, 11, 2210. [Google Scholar] [CrossRef]
  14. Khoi, D.N.; Quan, N.T.; Linh, D.Q.; Nhi, P.T.T.; Thuy, N.T.D. Using Machine Learning Models for Predicting the Water Quality Index in the La Buong River, Vietnam. Water 2022, 14, 1552. [Google Scholar] [CrossRef]
  15. Aalipour, M.; Št’astný, B.; Horký, F.; Jabbarian Amiri, B. Scaling an Artificial Neural Network-Based Water Quality Index Model from Small to Large Catchments. Water 2022, 14, 920. [Google Scholar] [CrossRef]
  16. Fernández del Castillo, A.; Yebra-Montes, C.; Verduzco Garibay, M.; de Anda, J.; Garcia-Gonzalez, A.; Gradilla-Hernández, M.S. Simple Prediction of an Ecosystem-Specific Water Quality Index and the Water Quality Classification of a Highly Polluted River through Supervised Machine Learning. Water 2022, 14, 1235. [Google Scholar] [CrossRef]
  17. Hajduk Černeha, B. Akumulacija Butoniga u Istri—Prva iskustva u korištenju za vodoopskrbu. In Proceedings of the Vodni dnevi 2021, Rimske Toplice, Slovenia, 7–8 October 2021. [Google Scholar]
  18. Zorko, S. Akumulacija Butoniga—pritisci u slijevu i zaštita voda. In Proceedings of the Zbornik radova—Upravljanje jezerima i akumulacijama u Hrvatskoj i Okrugli stol o aktualnoj problematici Vranskog jezera kod Biograda na Moru, Biograd na Moru, Croatia, 4–6 May 2017. [Google Scholar]
  19. Republic of Croatia regulations, Act on water intended for human consumption. 2020. In Cro., Zakon o Vodi za Ljudsku Potrošnju; NN 56/13, 64/15, 104/17, 115/18, 16/20; Effective from 20 February 2020. Available online: https://narodne-novine.nn.hr/clanci/sluzbeni/2013_05_56_1138.html (accessed on 9 March 2022).
  20. Volf, G.; Atanasova, N.; Kompare, B.; Precali, R.; Ožanić, N. Descriptive and prediction models of phytoplankton in the northern Adriatic. Ecol. Model. 2011, 222, 2502–2511. [Google Scholar] [CrossRef]
  21. Technical Committees, ISO/TC 147, Water Quality. Available online: https://www.iso.org/committee/52834/x/catalogue (accessed on 4 February 2022).
  22. Baird, R.B.; Eaton, A.D.; Rice, E.W. Standard Methods for the Examination of Water and Wastewater, 23rd ed.; AWWA: Washington, DC, USA, 2017. [Google Scholar]
  23. Witten, I.H.; Frank, E. Data Mining: Practical Machine Learning Tools and Techniques, 2nd ed.; Elsevier: Amsterdam, The Netherlands, 2005. [Google Scholar]
  24. Quinlan, J.R. C4.5: Programs for Machine Learning; Morgan Kaufmann: San Francisco, CA, USA, 1993. [Google Scholar]
  25. Yisa, J.; Jimoh, T. Analytical Studies on Water Quality Index of River Landzu. Am. J. Appl. Sci. 2010, 7, 453–458. [Google Scholar] [CrossRef] [Green Version]
Figure 1. Study area; location of the Butoniga reservoir and the drinking water treatment plant.
Sustainability 14 11481 g001
Figure 2. Butoniga drinking water treatment plant processes scheme [18].
Sustainability 14 11481 g002
Figure 3. Correlation coefficient between calculated and predicted values for WQI: (a) one day time step, (b) five days’ time step, (c) ten days’ time step, and (d) fifteen days’ time step.
Sustainability 14 11481 g003
Figure 4. Performance of the prediction models; calculated vs. predicted values of the WQI for the one day time step.
Sustainability 14 11481 g004
Figure 5. Performance of the prediction models; calculated vs. predicted values of the WQI for the five days’ time step.
Sustainability 14 11481 g005
Figure 6. Performance of the prediction models; calculated vs. predicted values of the WQI for the ten days’ time step.
Sustainability 14 11481 g006
Figure 7. Performance of the prediction models; calculated vs. predicted values of the WQI for the fifteen days’ time step.
Sustainability 14 11481 g007
Table 1. Relative weight of each parameter.
ParameterLimit Values [19]Water Quality Index (WQI)
wiWi
Temperature25 °C10.034
pH830.103
Turbidity4 NTU20.069
KMnO45 mg/L40.138
NH40.5 mg/L40.138
Mn0.05 mg/L50.172
Al0.2 mg/L50.172
Fe0.2 mg/L50.172
Table 2. Water quality classification based on WQI [25].
WQIWater Quality
<50Excellent
50–100Good
100–200Bad
200–300Very bad
>300Unfit for drinking
Table 3. Physico-chemical data used for building models.
SymbolInterpretationUnit
TempWater temperature-
pHpH-
TurbTurbidityNTU
KMnO4Potassium permanganatemg/L
NH4Ammoniummg/L
MnManganesemg/L
AlAluminummg/L
FeIronmg/L
O2Oxygen concentrationmg/L
O2pOxygen saturation%
TOCTotal organic carbonmg/L
UV254Organic matter in water1/cm
WQICalculated water quality index-
WQI_1_day_predWQI 1 day prediction-
WQI_5_day_predWQI 5 days prediction-
WQI_10_day_predWQI 10 days prediction-
WQI_15_day_predWQI 15 days prediction-
Table 4. Prediction model for WQI with a time step of one day (units for the parameters used are reported in Table 3).
Rule No.RuleEquation
1.-WQI_1_day_pred = −2.1437 × O2 − 6.613 × pH − 0.6083 × Tur + 78.459 × UV254 + 20.5083 × NH4 + 72.6239 × Mn + 168.8286 × Al + 74.7368 × Fe + 0.5695 × WQI + 76.5001
Table 5. Prediction model for WQI with a time step of five days (units for the parameters used are reported in Table 3).
Rule No.RuleEquation
1.Mn ≤ 0.178
UV254 > 0.05
O2p ≤ 91.263
WQI ≤ 67.5
Temp ≤ 14.647
WQI_5_day_pred = 0.0492 × Temp − 0.1442 × O2 + 0.0116 × O2p + 18.4678 × pH + 0.1147 × Tur + 0.1954 × TOC − 0.0833 × KMnO4 + 1.0771 × UV254 + 0.359 × NH4 + 3.4449 × Mn + 1.4357 × Al + 194.1906 × Fe + 0.0154 × WQI − 117.4061
2.Mn ≤ 0.178
UV254 > 0.05
NH4 > 0.116
NH4 ≤ 0.217
WQI_5_day_pred = −0.0314 × Temp − 4.0616 × O2 + 0.4277 × O2p − 30.9666 × pH + 0.0146 × Tur + 0.409 × TOC - 0.1268 × KMnO4 + 1.9415 × UV254 + 0.4537 × NH4 + 5.6159 × Mn + 8.273 × Al + 218.0231 × Fe + 0.2294 × WQI + 271.4172
3.Mn ≤ 0.238
UV254 > 0.05
WQI_5_day_pred = −1.3998 × Temp − 3.7955 × O2 + 0.2478 × O2p − 73.5681 × pH + 0.0134 × Tur − 0.0776 × TOC − 13.3644 × KMnO4 − 234.667 × UV254 + 0.4444 × NH4 + 1.6204 × Mn + 1.9645 × Al + 132.2723 × Fe − 0.2347 × WQI + 717.3281
4.Mn > 0.154
Mn ≤ 0.556
pH > 7.514
Mn > 0.273
NH4 ≤ 0.444
NH4 > 0.168
WQI_5_day_pred = 2.3592 × Temp − 0.344 × O2 − 0.0068 × O2p − 1.3764 × pH + 0.2721 × Tur − 1.6152 × TOC − 19.6394 × KMnO4 − 13.095 × UV254 + 6.8627 × NH4 + 4.9796 × Mn + 45.1687 × Al + 69.3252 × Fe + 0.0377 × WQI + 137.004
5.Mn > 0.154
Mn ≤ 0.625
WQI > 145.5
O2 > 4.29
TOC > 2.144
WQI_5_day_pred = −2.2601 × Temp + 1.0762 × O2 − 0.5878 × O2p − 51.0854 × pH + 4.2073 × Tur + 0.4781 × TOC − 442.8518 × UV254 + 53.2808 × NH4 + 83.5576 × Mn − 462.669 × Al − 14.6656 × Fe + 0.0126 × WQI + 598.894
6.Mn > 0.154
WQI ≤ 145.5
WQI_5_day_pred = −0.1431 × Temp − 15.6738 × O2 + 0.9714 × O2p − 2.2167 × pH + 1.5839 × Tur + 29.7531 × TOC + 3.9299 × NH4 + 119.515 × Mn + 41.3706 × Al + 146.8431 × Fe + 0.4928 × WQI − 18.3667
7.Mn > 0.196
NH4 ≤ 0.656
Temp > 14.521
WQI_5_day_pred = −0.2457 × Temp + 16.8424 × O2 - 2.17 × O2p - 1.9383 × pH + 4.5045 × Tur + 1.5087 × TOC + 36.4246 × UV254 + 4.2032 × NH4 + 466.3063 × Mn + 68.4722 × Al − 11.5351 × Fe − 1.1276 × WQI + 250.7915
8.UV254 ≤ 0.051
Tur > 1.77
O2 > 6.671
WQI_5_day_pred = −0.1311 × Temp − 0.8676 × O2 + 0.0209 × O2p − 4.7746 × pH + 0.2683 × Tur − 11.8676 × TOC + 12.0203 × KMnO4 − 1084.1325 × UV254 + 0.9434 × NH4 - 197.3272 × Mn + 28.2832 × Al - 11.6473 × Fe + 0.4091 × WQI + 149.8425
9.UV254 ≤ 0.051
O2 > 6.685
WQI_5_day_pred = −2.1766 × Temp − 12.4999 × O2 + 1.0932 × O2p − 30.7421 × pH + 6.042 × Tur − 9.7481 × TOC + 0.5713 × KMnO4 + 60.3924 × UV254 − 44.7147 × NH4 + 7.7437 × Mn + 55.508 × Al + 69.3385 × Fe + 345.6699
10.UV254 > 0.051
O2 ≤ 1.646
WQI_5_day_pred = −5.4435 × Temp + 1.8677 × O2 − 0.6007 × O2p − 5.9718 × pH − 0.8719 × Tur + 37.473 × TOC + 12.2012 × KMnO4 − 2209.8031 × UV254 − 45.2861 × NH4 + 171.9741 × Mn − 12.49 × Fe + 416.9164
11.UV254 > 0.051
Temp ≤ 14.146
NH4 > 0.243
WQI_5_day_pred = 7.2088 × O2 − 0.3865 × O2p − 10.7903 × pH + 6.4896 × Tur + 4.3084 × TOC + 7.6783 × KMnO4 + 68.6909 × UV254 − 22.0766 × NH4 − 78.7705 × Mn − 16.5265 × Fe + 173.4252
12.-WQI_5_day_pred = −12.6524 × Temp − 51.1841 × O2 + 4.544 × O2p − 169.1456 × pH + 43.3802 × KMnO4 + 723.3245 × UV254 + 36.264 × NH4 + 99.2001 × Mn + 1428.6758 × Al + 1506.6314
Table 6. Prediction model for WQI with a time step of ten days (units for the parameters used are reported in Table 3).
Rule No.RuleEquation
1.Mn ≤ 0.161
UV254 > 0.049
Fe > 0.08
pH > 7.903
UV254 ≤ 0.07
WQI_10_day_pred = 1.5616 × Temp − 0.1592 × O2 + 0.2154 × O2p + 31.8486 × pH − 0.1474 × Tur + 16.4278 × TOC + 0.0481 × KMnO4 − 6.5069 × UV254 + 0.3496 × NH4 − 0.7361 × Mn + 2.4 × Al + 246.8828 × Fe + 0.0231 × WQI − 292.6473
2.Mn ≤ 0.228
UV254 > 0.049
O2 > 6.037
TOC > 2.068
WQI_10_day_pred = −1.3609 × Temp − 10.3742 × O2 + 1.3011 × O2p − 33.9897 × pH − 3.2088 × Tur + 0.0438 × TOC − 565.14 × UV254 + 0.3834 × NH4 + 65.7253 × Mn − 221.5725 × Al + 188.8055 × Fe + 0.1485 × WQI + 360.0167
3. Mn > 0.131
pH > 7.63
Mn ≤ 0.42
WQI_10_day_pred = 1.5174 × Temp − 0.4902 × O2 + 0.0296 × O2p − 1.0916 × pH − 2.1281 × Tur + 0.0978 × TOC − 362.8943 × UV254 + 58.198 × NH4 + 11.7774 × Mn + 436.819 × Al + 110.5269 × Fe + 0.1953 × WQI + 70.6604
4.Mn > 0.147WQI_10_day_pred = −4.7909 × Temp − 29.3983 × O2 + 1.9398 × O2p + 27.2021 × pH − 3.6554 × Tur + 0.4596 × TOC + 36.9032 × NH4 + 176.6099 × Mn + 556.3115 × Al + 56.7678 × Fe − 0.3055 × WQI + 79.0885
5.UV254 ≤ 0.05
Tur ≤ 1.349
Temp > 13.085
WQI_10_day_pred = −1.1396 × Temp − 6.1336 × O2 + 0.4967 × O2p − 31.8387 × pH + 0.4681 × Tur − 13.8161 × TOC + 5.2705 × KMnO4 + 90.5952 × UV254 − 4.0772 × NH4 − 234.7263 × Mn − 22.4896 × Al + 8.6443 × Fe + 0.041 × WQI + 349.673
6.UV254 > 0.05
Al ≤ 0.002
Temp ≤ 19.35
WQI_10_day_pred = 0.0935 × Temp + 12.3922 × O2 − 1.4555 × O2p − 21.8854 × pH + 4.3067 × Tur + 31.5541 × TOC − 28.5229 × KMnO4 − 107.7914 × UV254 + 15.9927 × NH4 + 21.5347 × Al + 131.9561 × Fe - 0.7713 × WQI + 263.7697
7.UV254 > 0.05
UV254 > 0.052
WQI_10_day_pred = 9.6063 × Temp + 36.7844 × O2 - 3.7629 × O2p - 29.6123 × pH + 14.0689 × Tur + 7.3178 × TOC - 66.8263 × UV254 + 439.762 × Mn - 692.8787 × Al - 313.2304 × Fe + 0.0563 × WQI + 146.4862
8.UV254 ≤ 0.048
O2 ≤ 7.389
pH > 7.755
WQI_10_day_pred = −0.3282 × Temp − 8.0303 × O2 + 0.5504 × O2p + 37.8754 × pH + 18.7798 × Tur + 3.8309 × TOC + 339.0088 × UV254 − 62.2836 × NH4 − 173.1733 × Mn − 83.2919 × Al + 21.4339 × Fe + 0.0471 × WQI - 263.5586
9.UV254 ≤ 0.049
pH > 7.785
Tur ≤ 1.468
WQI_10_day_pred = −0.2551 × Temp − 0.1407 × O2 − 11.9135 × pH + 9.0883 × Tur − 5.6761 × TOC + 7.0392 × KMnO4 + 406.0863 × UV254 − 29.4935 × Mn − 60.929 × Al + 69.954 × Fe + 109.2525
10.Tur > 1.504
pH > 7.762
pH ≤ 8.157
WQI_10_day_pred = 0.6663 × Temp + 0.2275 × O2 − 11.1661 × pH + 4.3653 × Tur − 8.2495 × TOC + 5.6081 × KMnO4 + 564.6441 × UV254 − 10.1607 × NH4 − 92.4626 × Mn + 216.0347 × Fe − 0.4035 × WQI + 109.4049
11.WQI > 38.5
O2 > 6.874
Tur ≤ 2.111
O2 > 8.921
WQI_10_day_pred = −3.2172 × Temp − 0.7486 × O2 − 59.4558 × pH − 0.6238 × Tur + 6.9855 × TOC + 8.644 × KMnO4 + 1134.6654 × UV254 − 174.1622 × Al − 55.1062 × Fe + 0.2754 × WQI + 496.4482
12.UV254 ≤ 0.049
pH > 7.673
WQI_10_day_pred = −1.5223 × Temp + 9.0823 × O2 − 0.84 × O2p − 43.5423 × pH + 8.2979 × Tur + 13.9948 × KMnO4 + 2670.0583 × UV254 + 272.8255
13.Temp > 9.654WQI_10_day_pred = −7.5086 × Temp − 112.8856 × pH + 69.6063 × TOC + 967.9153
14.-WQI_10_day_pred = −61.5182 × O2 − 751.5462 × Tur + 1847.615
Table 7. Prediction model for WQI with a time step of fifteen days (units for the parameters used are reported in Table 3).
Rule No.RuleEquation
1.pH > 7.722
Mn ≤ 0.182
Tur > 1.675
Temp ≤ 15.32
WQI_15_day_pred = −2.308 × Temp − 7.9764 × O2 + 1.0935 × O2p + 28.5839 × pH + 3.8658 × Tur + 0.2701 × TOC + 0.183 × KMnO4 − 12.663 × UV254 + 1.2919 × NH4 + 2.8251 × Mn − 224.3635 × Al + 119.207 × Fe + 0.0008 × WQI − 184.4439
2.pH > 7.703
Mn > 0.134
pH > 7.948
WQI_15_day_pred = −1.1171 × Temp − 9.6787 × O2 + 0.7265 × O2p − 47.8948 × pH − 1.7395 × Tur + 10.9147 × TOC − 16.9889 × KMnO4 − 571.2309 × UV254 + 2.2305 × NH4 + 6.0254 × Mn + 431.2766 × Al + 209.4744 × Fe + 0.0623 × WQI + 518.4762
3.Mn > 0.134
Mn ≤ 0.52
Temp ≤ 21.01
pH > 7.63
WQI > 114.5
WQI_15_day_pred = −2.3239 × Temp − 4.9107 × O2 + 0.1752 × O2p − 5.5331 × pH − 5.4288 × Tur − 1.1149 × TOC + 7.5097 × NH4 + 145.6845 × Mn + 676.501 × Al + 5.0832 × Fe − 0.0928 × WQI + 201.3688
4.Mn > 0.134
Temp ≤ 21.065
Tur > 3.084
UV254 ≤ 0.071
WQI_15_day_pred = −0.2501 × Temp + 5.9114 × O2 + 0.2627 × O2p − 73.2176 × pH − 6.2534 × Tur + 1.7585 × TOC − 1.2392 × KMnO4 + 1308.1435 × UV254 + 117.9952 × NH4 + 11.2328 × Mn + 1364.4201 × Al + 1.451 × Fe − 0.0057 × WQI + 584.6712
5.-WQI_15_day_pred = −3.1871 × Temp − 11.7564 × O2 + 0.7338 × O2p − 101.7279 × pH − 1628 × Tur + 24.9861 × TOC − 245.935 × UV254 + 48.1042 × NH4 + 151.9509 × Mn + 417.6806 × Al + 108.3222 × Fe − 0.1082 × WQI + 918.6201
Publisher’s Note: MDPI stays neutral with regard to jurisdictional claims in published maps and institutional affiliations.

