
The Impact of Individual Differences on the Acceptance of Self-Driving Buses: A Case Study of Nanjing, China


Abstract
:1. Introduction
2. Literature Review
2.1. Acceptance
2.2. Individual Differences
3. Method
3.1. Survey
3.2. Data Analysis
4. Results
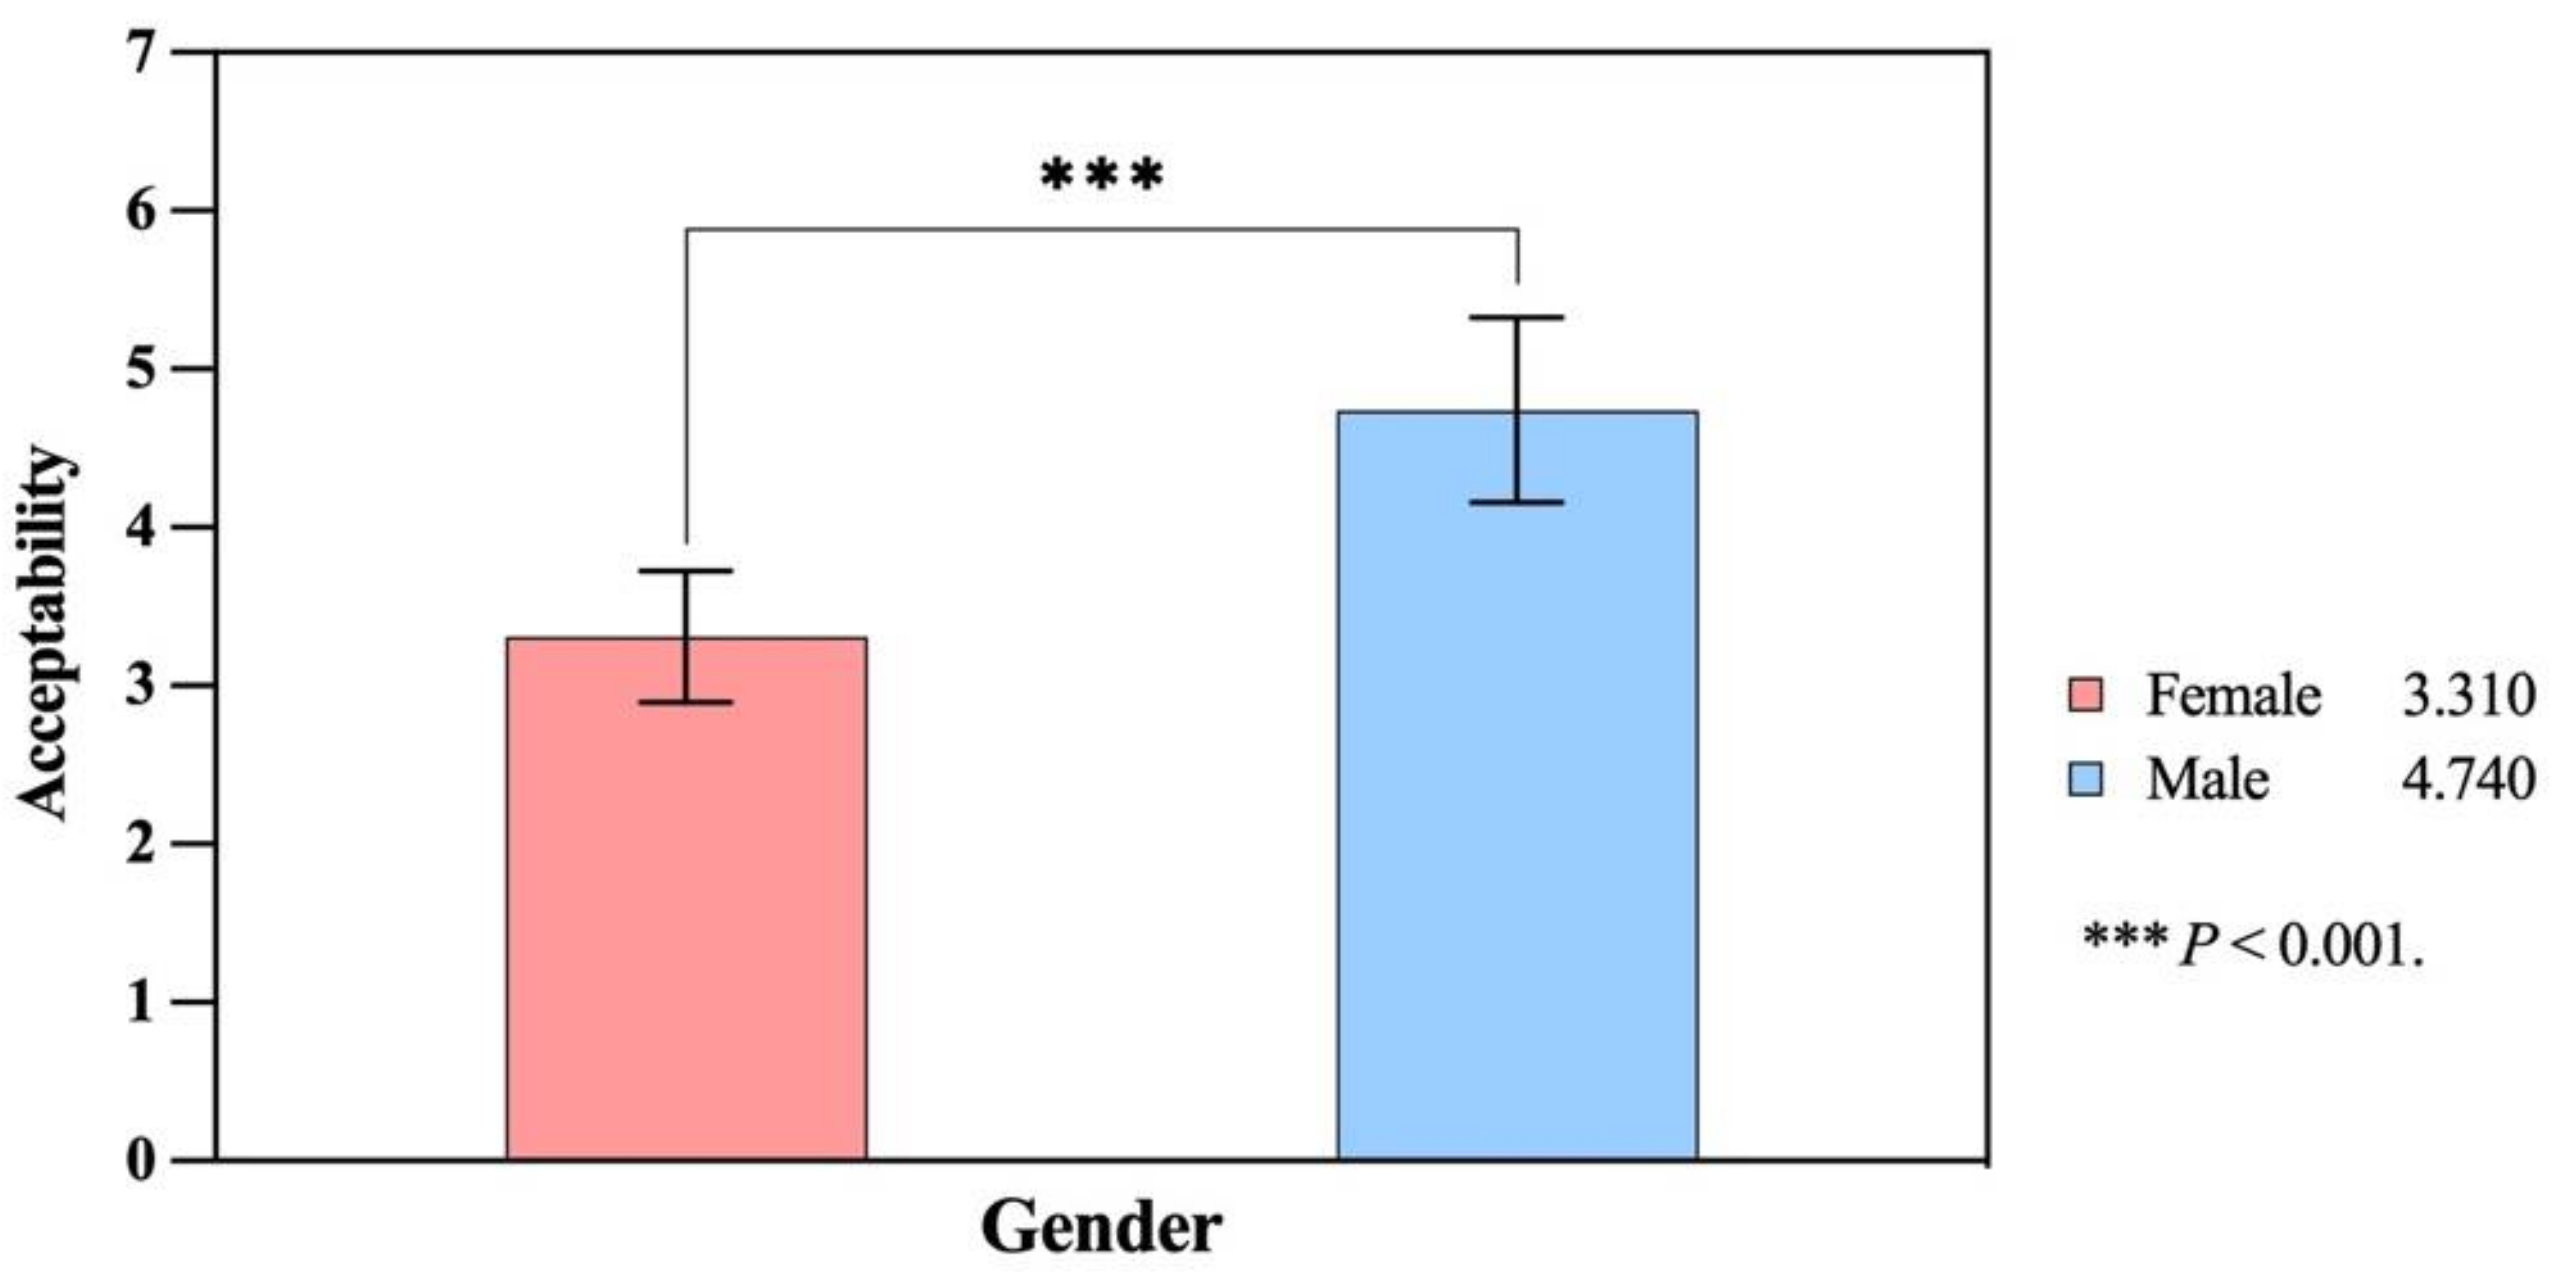
4.1. Gender
4.2. Age
4.3. Region
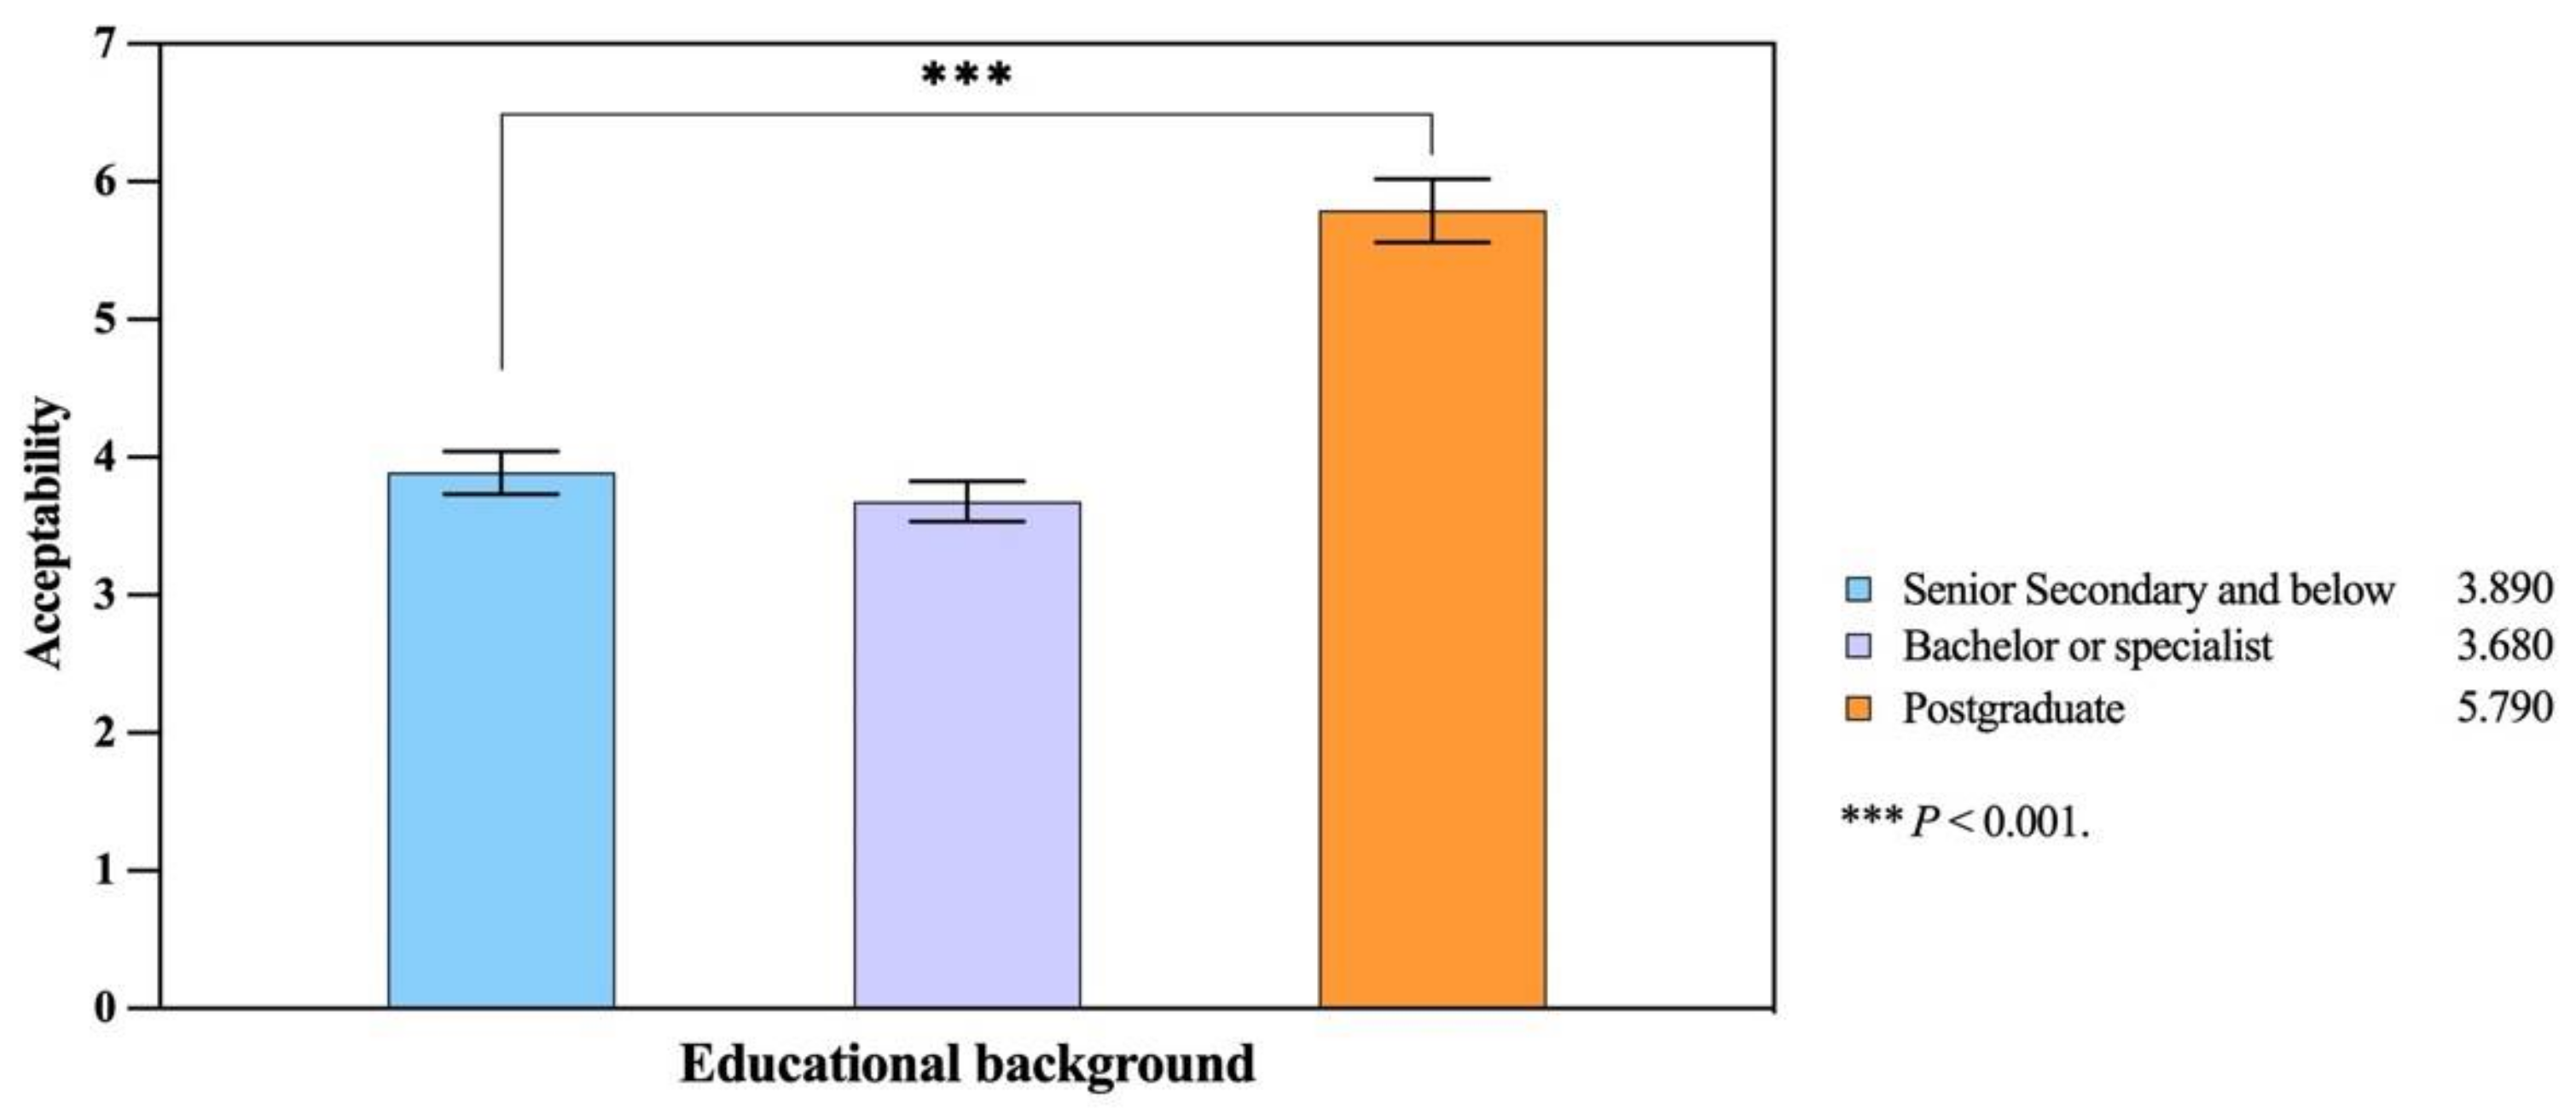
4.4. Educational Background
4.5. Marital Status
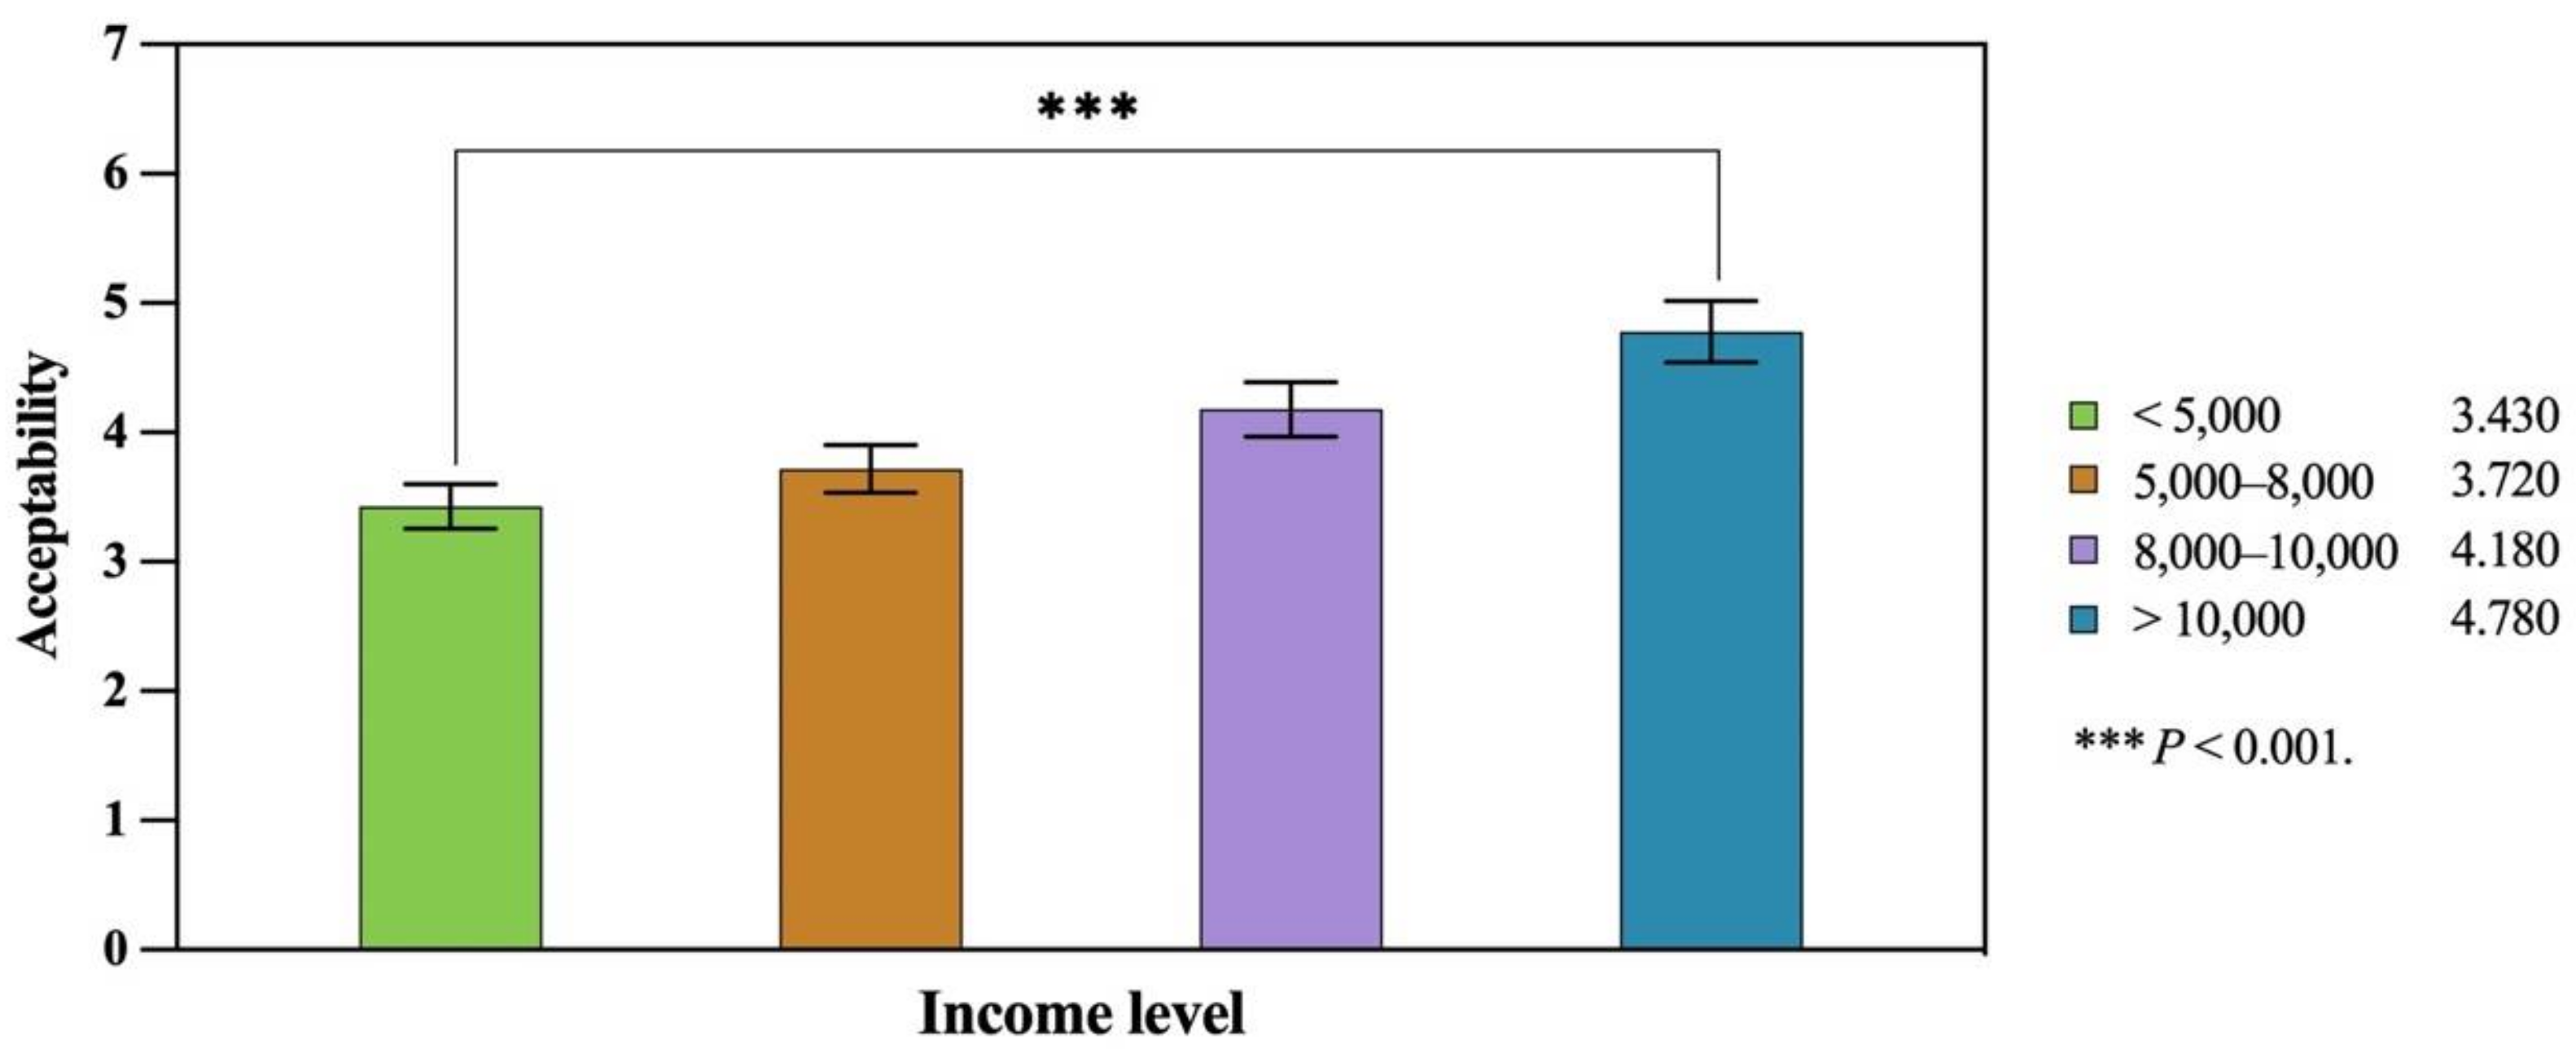
4.6. Income Level
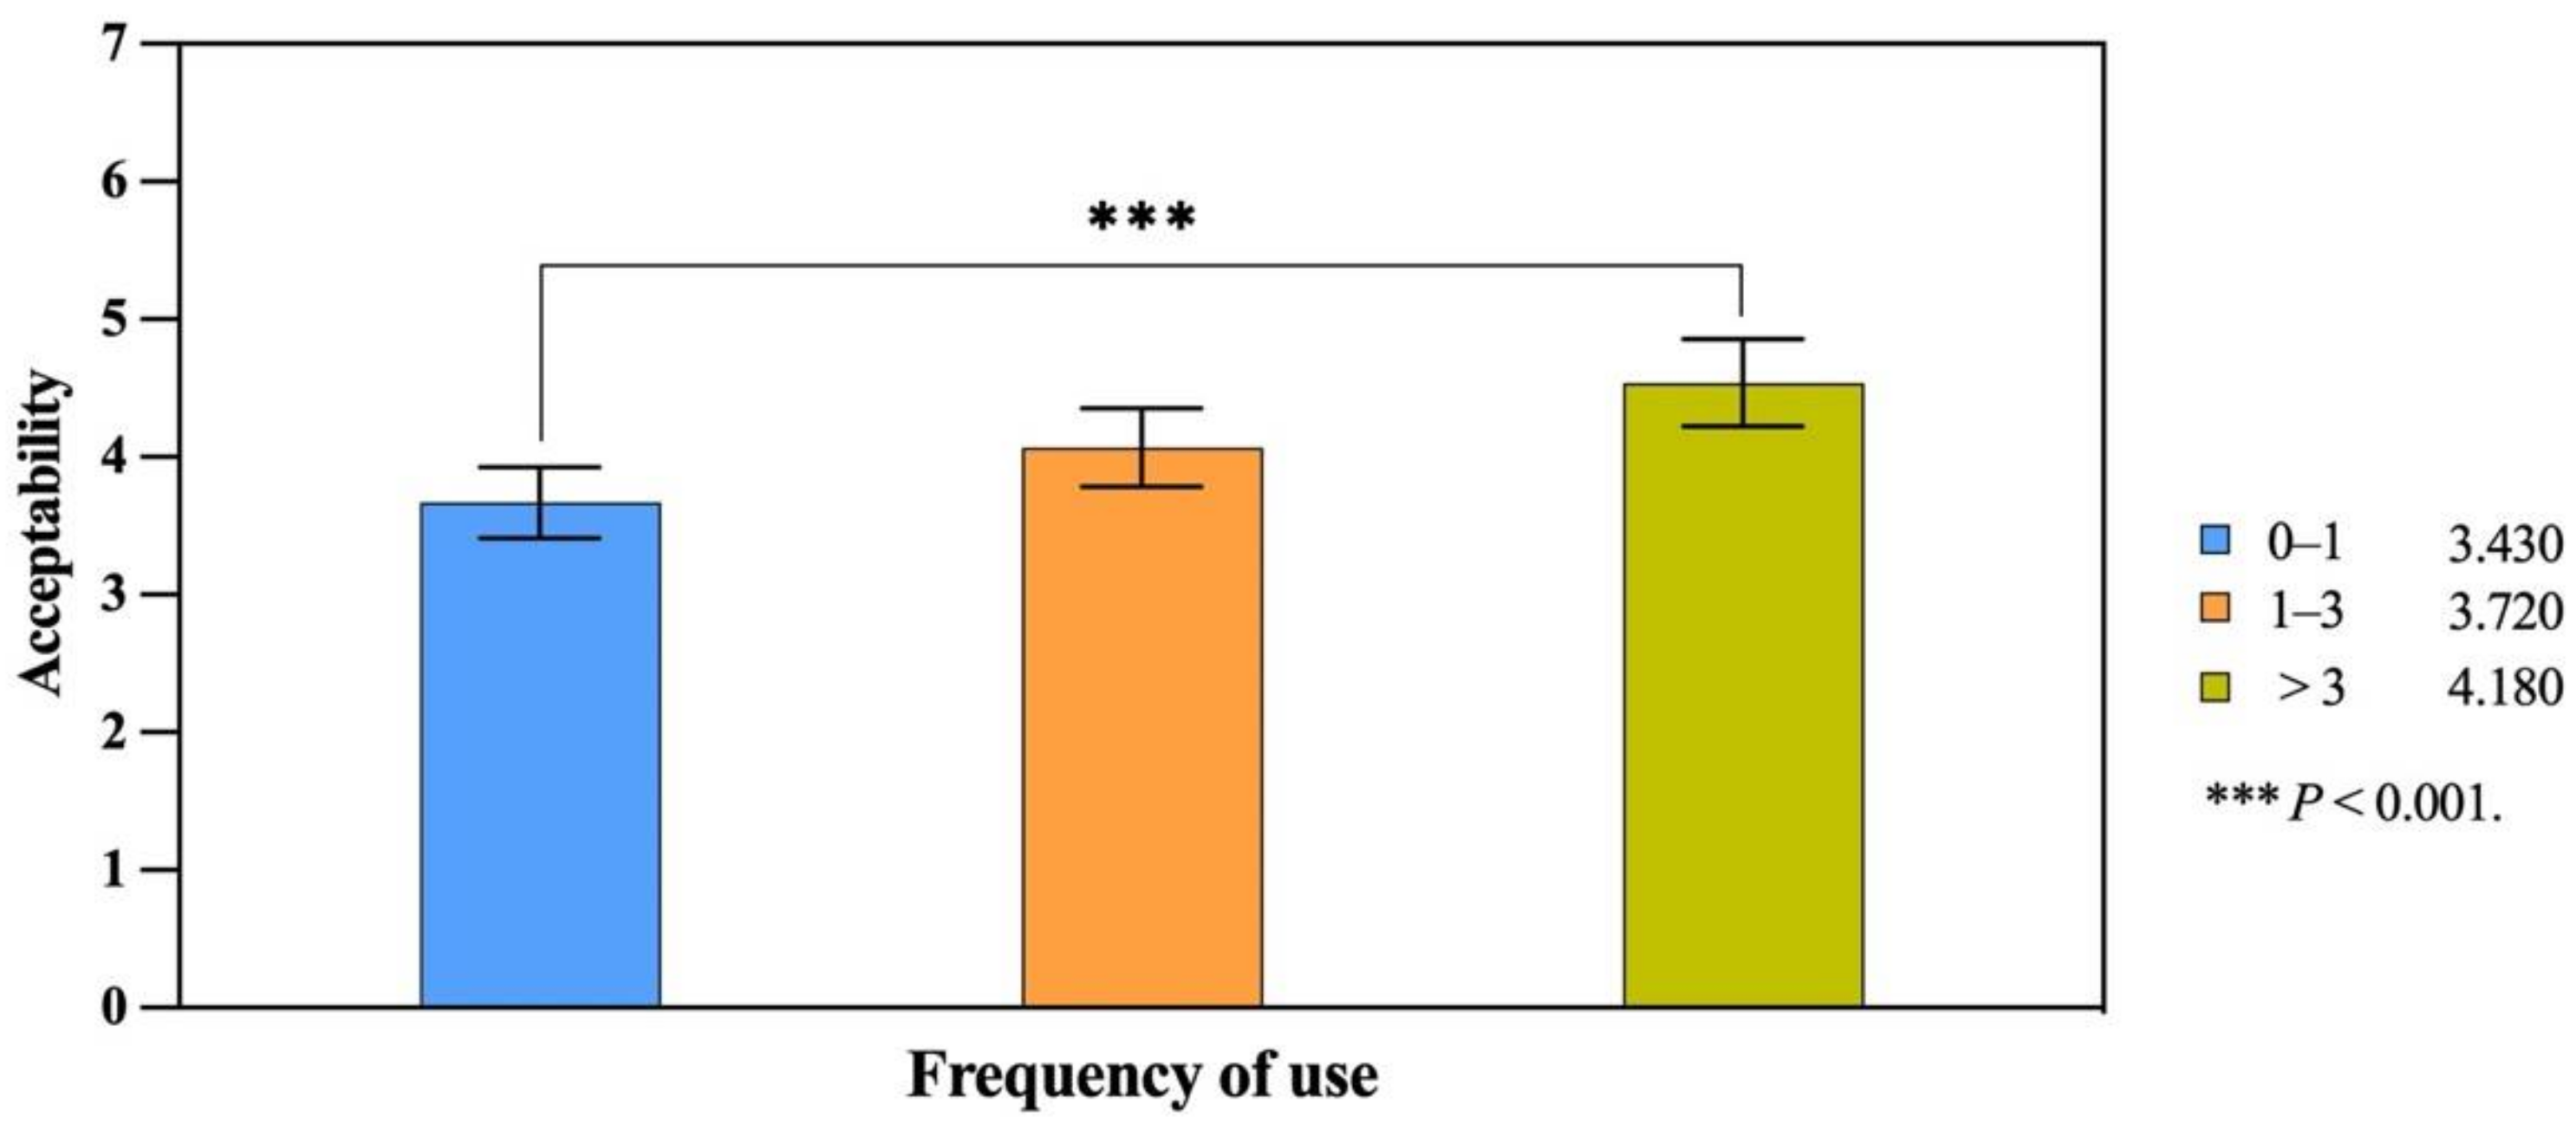
4.7. Frequency of Use
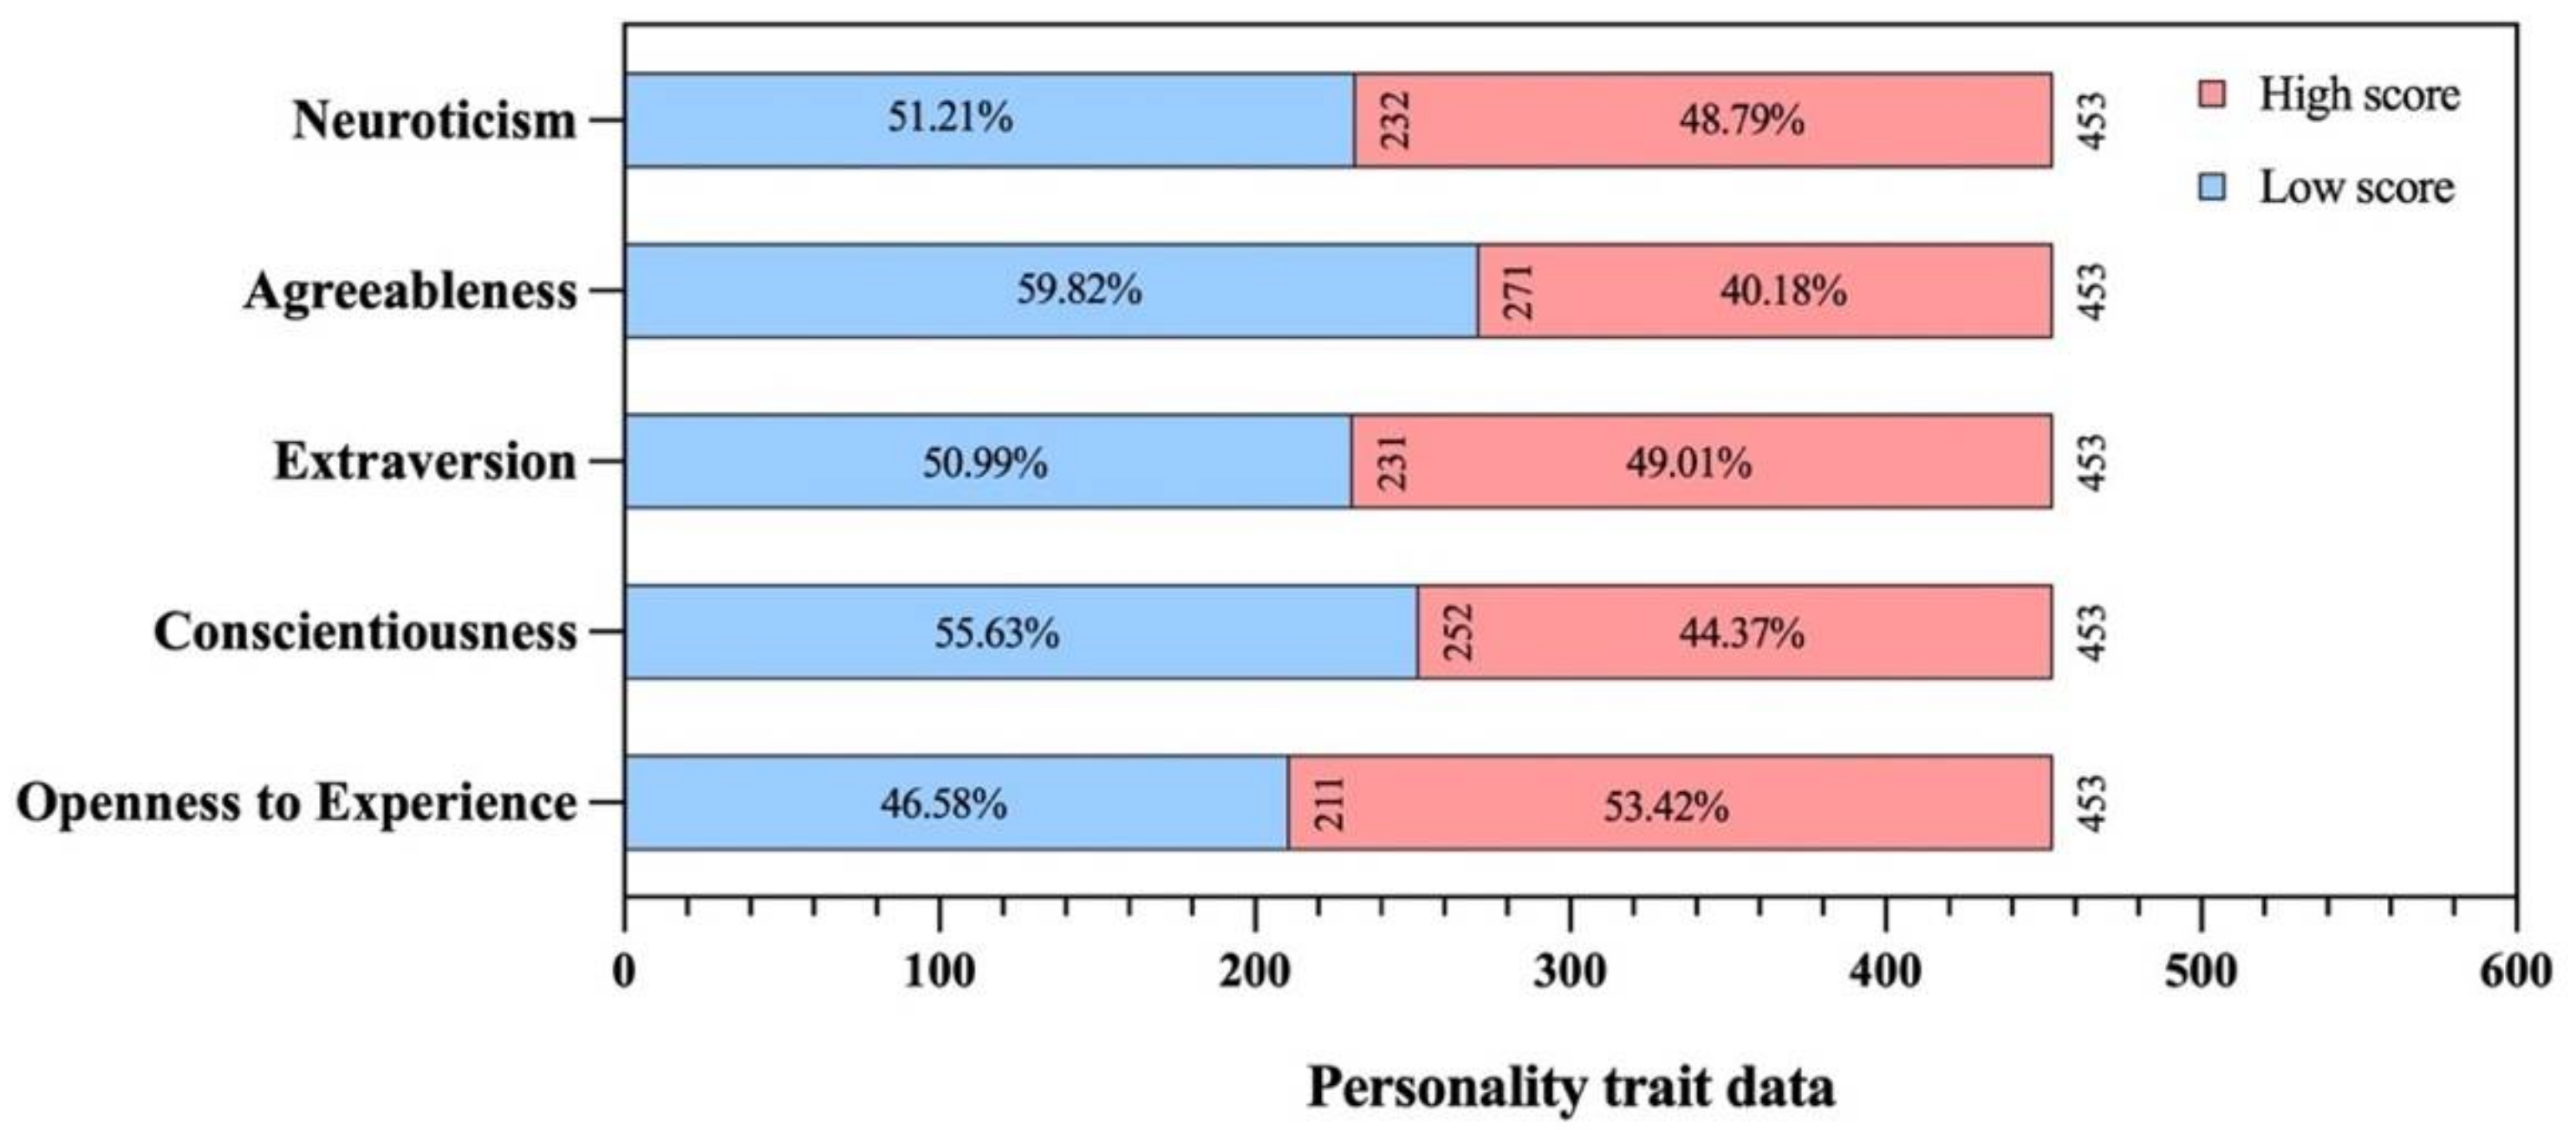
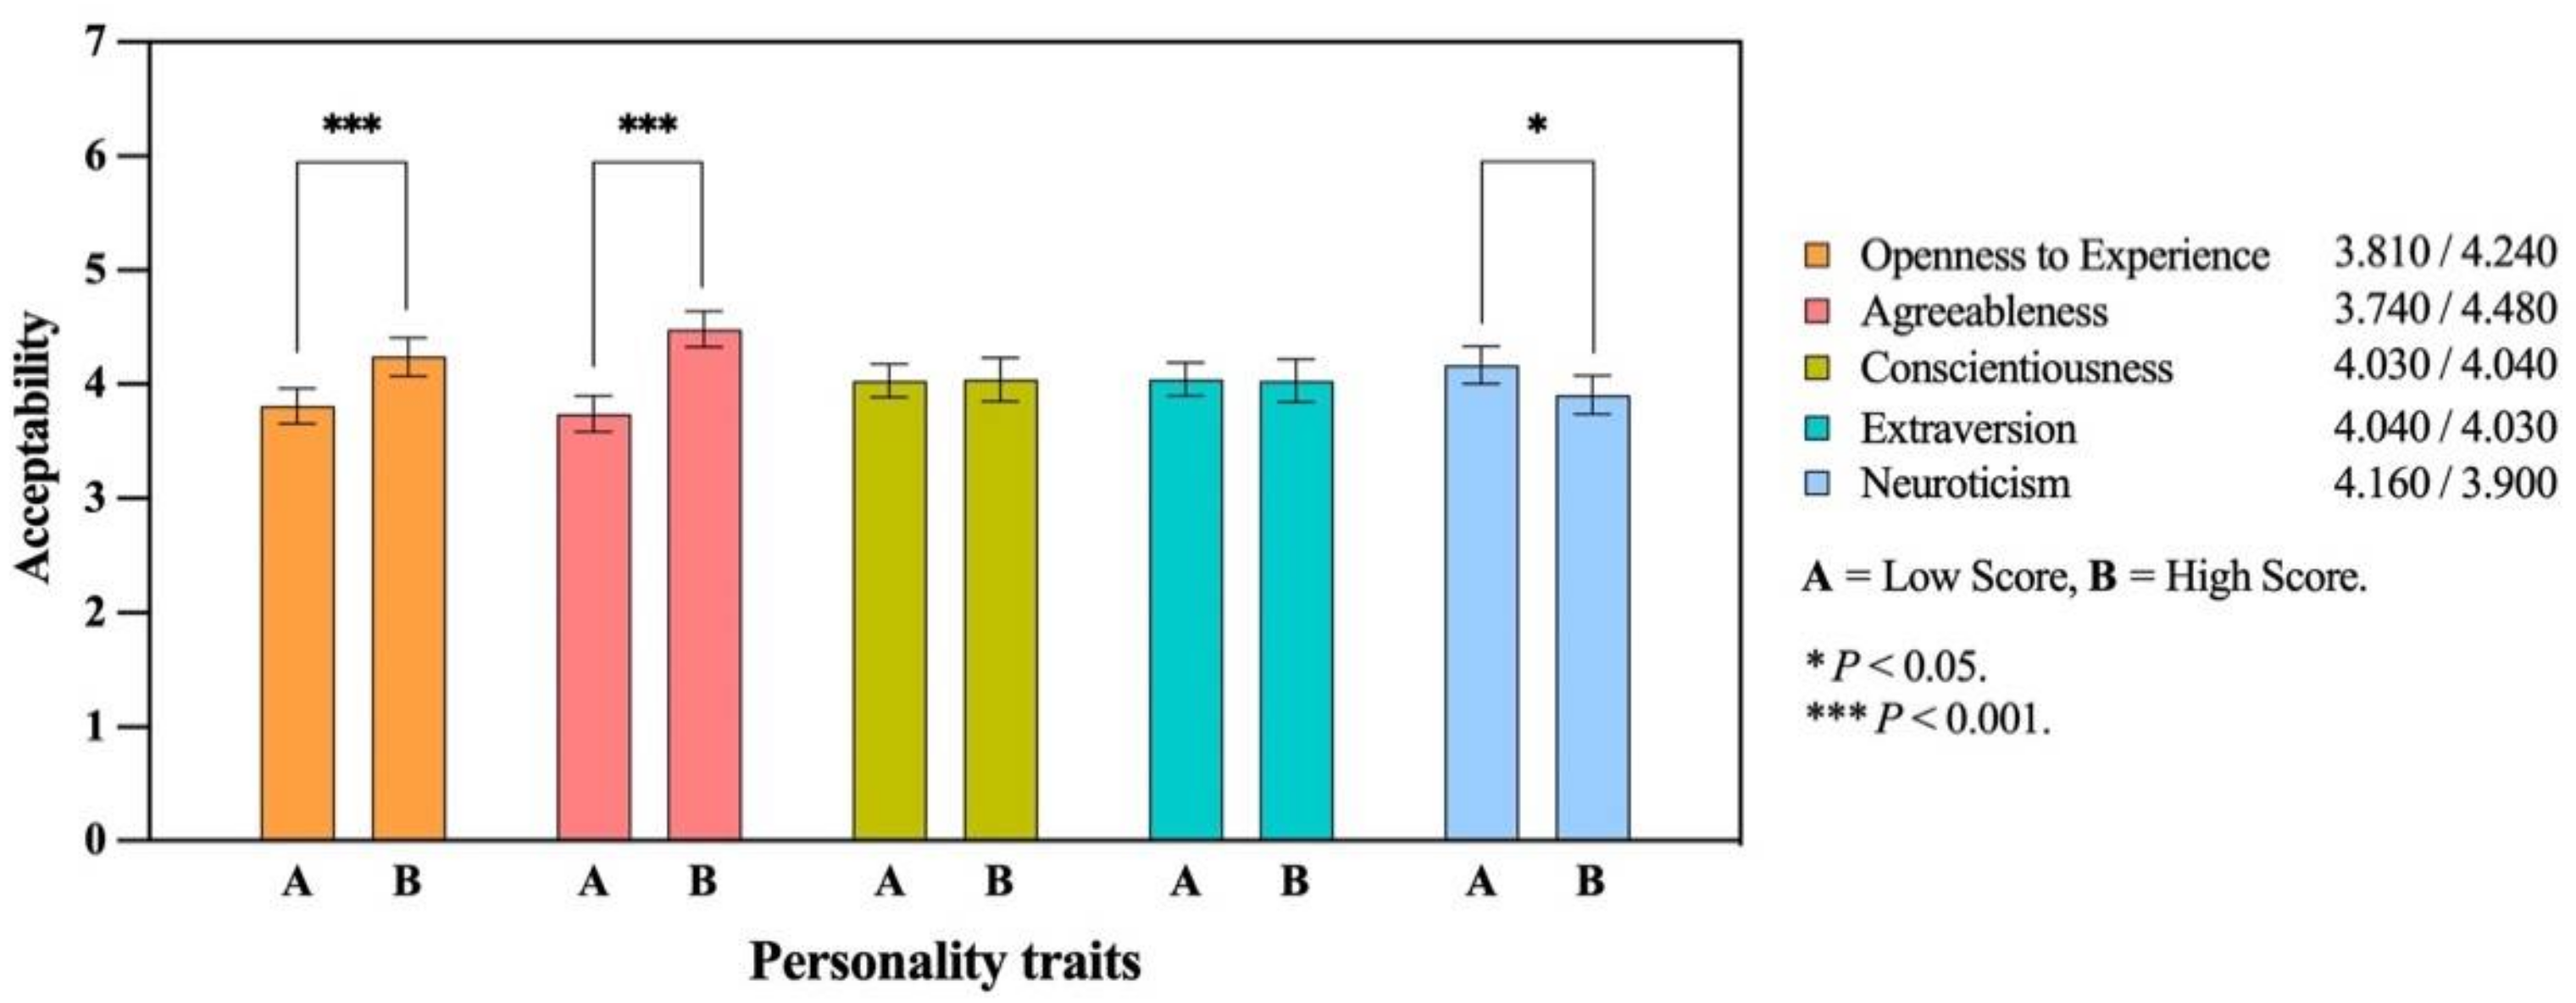
4.8. Personality Traits
5. Discussion
6. Conclusions
Author Contributions
Funding
Institutional Review Board Statement
Informed Consent Statement
Data Availability Statement
Acknowledgments
Conflicts of Interest
References
- World Health Organization. Global Status Report on Road Safety 2018. 2019. Available online: www.who.int/publications/i/item/9789241565684 (accessed on 5 December 2021).
- Bansal, P.; Kockelman, K.M.; Singh, A. Assessing public opinions of and interest in new vehicle technologies: An Austin perspective. Transp. Res. Part C Emerg. Technol. 2016, 67, 1–14. [Google Scholar] [CrossRef]
- Fagnant, D.J.; Kockelman, K. Preparing a nation for autonomous vehicles: Opportunities, barriers and policy recommendations. Transp. Res. Part A Policy Pract. 2015, 77, 167–181. [Google Scholar] [CrossRef]
- Biondi, F.; Alvarez, I.; Jeong, K.-A. Human–vehicle cooperation in automated driving: A multidisciplinary review and appraisal. Int. J. Hum. Comput. Interact. 2019, 35, 932–946. [Google Scholar] [CrossRef]
- Du, N.; Haspiel, J.; Zhang, Q.; Tilbury, D.; Pradhan, A.K.; Yang, X.J.; Robert, L.P., Jr. Look who’s talking now: Implications of AV’s explanations on driver’s trust, AV preference, anxiety and mental workload. Transp. Res. Part C Emerg. Technol. 2019, 104, 428–442. [Google Scholar] [CrossRef]
- Zhang, Q.; Yang, X.J.; Robert, L.P. Drivers’ age and automated vehicle explanations. Sustainability 2021, 13, 1948. [Google Scholar] [CrossRef]
- Azevedo-Sa, H.; Zhao, H.; Esterwood, C.; Yang, X.J.; Tilbury, D.M.; Robert, L.P. How internal and external risks affect the relationships between trust and driver behavior in automated driving systems. Transp. Res. Part C Emerg. Technol. 2021, 123, 102973. [Google Scholar] [CrossRef]
- Jayaraman, S.; Creech, C.; Dawn, T.; Yang, X.J.; Pradhan, A.; Tsui, K.; Robert, L. Pedestrian Trust in Automated Vehicles: Role of Traffic Signal and AV Driving Behavior. Frontiers in Robotics and AI. Available online: https://www.frontiersin.org/articles/10.3389/frobt.2019.00117/full (accessed on 28 November 2019).
- Petersen, L.; Robert, L.; Yang, X.J.; Tilbury, D. Situational awareness, driver’s trust in automated driving systems and secondary task performance. SAE Int. J. CAV 2019, 2, 129–141. [Google Scholar] [CrossRef]
- Tan, H.; Chen, C.; Hao, Y. How people perceive and expect safety in autonomous vehicles: An empirical study for risk sensitivity and risk-related feelings. Int. J. Hum. Comput. Interact. 2021, 37, 340–351. [Google Scholar] [CrossRef]
- Iclodean, C.; Cordos, N.; Varga, B.O. Autonomous shuttle bus for public transportation: A review. Energies 2020, 13, 2917. [Google Scholar] [CrossRef]
- Gkartzonikas, C.; Gkritza, K. What have we learned? a review of stated preference and choice studies on autonomous vehicles. Transp. Res. Part C Emerg. Technol. 2019, 98, 323–337. [Google Scholar] [CrossRef]
- Faisal, A.; Yigitcanlar, T.; Kamruzzaman, M.; Currie, G. Understanding autonomous vehicles: A systematic literature review on capability, impact, planning and policy. J. Transp. Land Use 2019, 12, 45–72. [Google Scholar] [CrossRef]
- Paddeu, D.; Parkhurst, G.; Shergold, I. Passenger comfort and trust on first-time use of a shared autonomous shuttle vehicle. Transp. Res. Part C Emerg. Technol. 2020, 115, 102604. [Google Scholar] [CrossRef]
- Li, Z.; Li, X.; Jiang, B. How People Perceive the Safety of Self-Driving Buses: A Quantitative Analysis Model of Perceived Safety. Transp. Res. Rec. 2022. [Google Scholar] [CrossRef]
- Haspiel, J.; Du, N.; Meyerson, J.; Robert, L.P.; Tilbury, D.; Yang, X.J.; Pradhan, A.K. Explanations and expectations: Trust building in automated vehicles. In Proceedings of the ACM/IEEE International Conference on Human-Robot Interaction, Chicago, IL, USA, 5–8 March 2018; pp. 119–120. [Google Scholar] [CrossRef]
- Zhang, Q.; Robert, L., Jr.; Lionel, P.; Du, N.; Yang, X.J. Trust in AVs: The impact of expectations and individual differences. In Proceedings of the Conference on Autonomous Vehicles in Society: Building a Research Agenda, East Lansing, MI, USA, 18–19 May 2018. [Google Scholar]
- Lee, J.D.; See, K.A. Trust in automation: Designing for appropriate reliance. Hum. Factors 2004, 46, 50–80. [Google Scholar] [CrossRef]
- Bansal, P.; Kockelman, K.M. Are we ready to embrace connected and self-driving vehicles? A case study of Texans. Transportation 2018, 45, 641–675. [Google Scholar] [CrossRef]
- Choi, J.K.; Ji, Y.G. Investigating the Importance of Trust on Adopting an Autonomous Vehicle. Int. J. Hum. Comput. Interact. 2015, 31, 692–702. [Google Scholar] [CrossRef]
- Zhang, T.; Tao, D.; Qu, X.; Zhang, X.; Lin, R.; Zhang, W. The roles of initial trust and perceived risk in public’s acceptance of automated vehicles. Transp. Res. Part C Emerg. Technol. 2019, 98, 207–220. [Google Scholar] [CrossRef]
- Schoettle, B.; Sivak, M. A Survey of Public Opinion about Autonomous and Self-Driving Vehicles in the US, the UK, and Australia; University of Michigan: Ann Arbor, MI, USA, 2014. [Google Scholar]
- Harrison, A.W.; Rainer, R.K., Jr. The influence of individual differences on skill in end-user computing. J. Manag. Inf. Syst. 1992, 9, 93–111. [Google Scholar] [CrossRef]
- Robert, L.P. Personality in the human robot interaction literature: A review and brief critique. In Proceedings of the 24th Americas Conference on Information Systems, New Orleans, LA, USA, 16–18 August 2018; pp. 16–18. [Google Scholar]
- Zhang, Q.; Yang, X.J.; Robert, L.P., Jr. Individual Differences and Expectations of Automated Vehicles. Int. J. Hum. Comput. Interact. 2022, 38, 825–836. [Google Scholar] [CrossRef]
- Kaan, J. User Acceptance of Autonomous Vehicles: Factors & Implications. Master’s Thesis, Delft University of Technology, Delft, The Netherlands, 2017. [Google Scholar]
- Azevedo-Sa, H.; Jayaraman, S.K.; Yang, X.J.; Robert, L.P.; Tilbury, D.M. Context-adaptive management of drivers’ trust in automated vehicles. IEEE Robot. Autom. Lett. 2020, 5, 6908–6915. [Google Scholar] [CrossRef]
- Brown, S.A.; Venkatesh, V.; Goyal, S. Expectation confirmation in technology use. Inf. Syst. Res. 2012, 23, 474–487. [Google Scholar] [CrossRef]
- Maruping, L.M.; Bala, H.; Venkatesh, V.; Brown, S.A. Going beyond intention: Integrating behavioral expectation into the unified theory of acceptance and use of technology. J. Assoc. Inf. Sci. Technol. 2017, 68, 623–637. [Google Scholar] [CrossRef]
- Martinez, L.M.; De Correia, G.H.A.; Moura, F.; Mendes Lopes, M. Insights into carsharing demand dynamics: Outputs of an agent-based model application to Lisbon, Portugal. Int. J. Sustain. Transp. 2017, 11, 148–159. [Google Scholar] [CrossRef]
- Deloitte. Global Automotive Consumer Study: Exploringconsumers’ Mobility Choices and Transportation Decisions. 2014. Available online: https://www2.deloitte.com/content/dam/Deloitte/us/Documents/manufacturing/us-auto-global-automotive-consumer-study-100914.pdf (accessed on 11 June 2022).
- Payre, W.; Cestac, J.; Delhomme, P. Intention to use a fully automated car: Attitudes and a priori acceptability. Transp. Res. Part F Traffic Psychol. Behav. 2014, 27, 252–263. [Google Scholar] [CrossRef]
- Gefen, D.; Karahanna, E.; Straub, D.W. Trust and TAM in online shopping: An integrated model. MIS Q. 2003, 27, 51–90. [Google Scholar] [CrossRef]
- Alsghan, I.; Gazder, U.; Assi, K.; Hakem, G.H.; Sulail, M.A.; Alsuhaibani, O.A. The Determinants of Consumer Acceptance of Autonomous Vehicles: A Case Study in Riyadh, Saudi Arabia. Int. J. Hum. Comput. Interact. 2021, 38, 1375–1387. [Google Scholar] [CrossRef]
- Glancy, D.J. Privacy in autonomous vehicles. St. Clara Law Rev. 2012, 52, 1171–1239. [Google Scholar]
- Tay, B.; Jung, Y.; Park, T. When stereotypes meet robots: The double-edge sword of robot gender and personality in human–robot interaction. Comput. Hum. Behav. 2014, 38, 75–84. [Google Scholar] [CrossRef]
- Tussyadiah, I.P.; Zach, F.; Wang, J. Attitudes toward autonomous on demand mobility system: The case of self-driving taxi. In Information & Communication Technologies in Tourism; Schegg, R., Stangl, B., Eds.; Springer International Publishing: Cham, Switzerland, 2017; pp. 755–766. [Google Scholar]
- KPMG. Marketplace of Change: Automobile Insurance in the Era of Autonomous Vehicles, White Paper. 2015. Available online: https://assets.kpmg.com/content/dam/kpmg/pdf/2016/06/id-market-place-of-change-automobile-insurance-in-the-era-of-autonomous-vehicles.pdf (accessed on 11 June 2022).
- Paden, B.; Čáp, M.; Yong, S.Z.; Yershov, D.; Frazzoli, E. A survey of motion planning and control techniques for self-driving urban vehicles. IEEE Trans. Intell. Veh. 2016, 1, 33–55. [Google Scholar] [CrossRef]
- Bertoncello, M.; Wee, D. Ten Ways Autonomous Driving could Redefine the Automotive World; McKinsey & Company: Atlanta, GA, USA, 2015; Volume 6. [Google Scholar]
- Liu, P.; Yang, R.; Xu, Z. Public acceptance of fully automated driving: Effects of social trust and risk/benefit perceptions. Risk Anal. 2019, 39, 326–341. [Google Scholar] [CrossRef]
- Abraham, H.; Lee, C.; Brady, S.; Fitzgerald, C.; Mehler, B.; Reimer, B.; Coughlin, J.F. Autonomous vehicles and alternatives to driving: Trust, preferences, and effects of age. In Proceedings of the Transportation Research Board 96th Annual Meeting (TRB’17), Washington, DC, USA, 8–12 January 2017. [Google Scholar]
- Cooper, C. Individual Differences; Arnold: London, UK, 2002; Volume 2. [Google Scholar]
- Clark, B.; Parkhurst, G.; Ricci, M. Understanding the Socioeconomic Adoption Scenarios for Autonomous Vehicles: A Literature Review; Centre for Transport and Society (CTS): Bristol, UK, 2016. [Google Scholar]
- Im, S.; Bayus, B.L.; Mason, C.H. An empirical study of innate consumer innovativeness, personal characteristics, and new-product adoption behavior. J. Acad. Mark. Sci. 2003, 31, 61–73. [Google Scholar] [CrossRef]
- Nordhoff, S.; De Winter, J.; Kyriakidis, M.; Van Arem, B.; Happee, R. Acceptance of driverless vehicles: Results from a large cross-national questionnaire study. J. Adv. Transp. 2018, 2018, 5382192. [Google Scholar] [CrossRef]
- Esterwood, C.; Yang, X.J.; Robert, L.P. Barriers to AV bus acceptance: A national survey and research agenda. Int. J. Hum. Comput. Interact. 2021, 37, 1391–1403. [Google Scholar] [CrossRef]
- Frison, A.-K.; Aigner, L.; Wintersberger, P.; Riener, A. Who is Generation A? Investigating the experience of automated driving for different age groups. In Proceedings of the 10th International Conference on Automotive User Interfaces and Interactive Vehicular Applications, Toronto, ON, Canada, 23–25 September 2018; pp. 94–104. [Google Scholar] [CrossRef]
- Moris, M.G.; Venkatesh, V. Age differences in technology adoption decisions: Implications for a changing work force. Pers. Psychol. 2000, 53, 375–403. [Google Scholar] [CrossRef]
- Howard, D.; Dai, D. Public perceptions of self-driving cars: The case of Berkeley, California [Paper presentation]. In Proceedings of the Transportation Research Board 93rd Annual Meeting, Washington, DC, USA, 12–16 January 2014. [Google Scholar]
- Hughes-Cromwick, M. Public Transportation Fact Book (Tech. Rep.); American Public Transportation Association (APTA): Washington, DC, USA, 2019. [Google Scholar]
- Sovacool, B.K.; Kester, J.; Noel, L.; De Rubens, G.Z. Income, political affiliation, urbanism, and geography in stated preferences for electric vehicles (EVs) and vehicle-to-grid (V2G) technologies in Northern Europe. J. Transp. Geogr. 2019, 78, 214–229. [Google Scholar] [CrossRef]
- Koul, S.; Eydgahi, A. Utilizing the technology acceptance model (TAM) for driverless car technology adoption. J. Technol. Manag. Innov. 2018, 13, 37–46. [Google Scholar] [CrossRef]
- DeYoung, C.G.; Gray, J.R.; Corr, P.J.; Matthews, G. The Cambridge Handbook of Personality Psychology; Cambridge University Press: Cambridge, UK, 2009. [Google Scholar]
- Roccas, S.; Sagiv, L.; Schwartz, S.H.; Knafo, A. The Big Five Personality Factors and Personal Values. Personal. Soc. Psychol. Bull. 2002, 28, 789–801. [Google Scholar] [CrossRef]
- Pate, R.R. Physical activity assessment in children and adolescents. Crit. Rev. Food Sci. Nutr. 1993, 33, 321–326. [Google Scholar] [CrossRef]


| Items | N 1 | Demographics (%) | Sample (%) | |
|---|---|---|---|---|
| Gender | Female | 223 | 48.95% | 49.23% |
| Male | 230 | 51.05% | 50.77% | |
| Age | 15–29 | 140 | 68.27% | 30.90% |
| 30–39 | 168 | 37.09% | ||
| 40–49 | 64 | 14.13% | ||
| 50–59 | 49 | 10.82% | ||
| 60–65 | 32 | 5.28% | 7.06% | |
| Region | Urban area | 394 | 86.90% | 86.98% |
| Township | 59 | 13.10% | 13.02% | |
| Educational background | High school and below | 293 | 64.77% | 64.68% |
| Undergraduate or junior college | 113 | 35.23% | 24.94% | |
| Graduate student and above | 47 | 10.38% | ||
| Marital status | Unmarried | 161 | 35.50% | |
| Married | 292 | 64.50% | ||
| 3Monthly income level (CNY 2) | <CNY 5000 | 91 | 20.09% | |
| CNY 5000–8000 | 111 | 24.50% | ||
| CNY 8000–10,000 | 161 | 35.54% | ||
| >CNY 10,000 | 90 | 19.87% | ||
| Daily bus usage frequency (Times) | 0–1 | 71 | 15.67% | |
| 1–3 | 262 | 57.84% | ||
| >3 | 120 | 26.49% | ||
| Score | N 1 | % | M 2 | Med 3 | SD 4 |
|---|---|---|---|---|---|
| 1 | 10 | 2.20% | 4.04 | 4 | 1.267 |
| 2 | 41 | 9.10% | |||
| 3 | 92 | 20.30% | |||
| 4 | 160 | 35.30% | |||
| 5 | 90 | 19.90% | |||
| 6 | 50 | 11% | |||
| 7 | 10 | 2.20% |
| Items | N 1 | M 2 | SD 3 | F | p-Value | Eta-Squared | |
|---|---|---|---|---|---|---|---|
| Gender | Female | 223 | 3.310 | 1.017 | 211.292 | <0.001 | 0.319 |
| Male | 230 | 4.740 | 1.074 | ||||
| Age | 15–29 | 140 | 4.070 | 1.443 | 9.803 | <0.001 | 0.08 |
| 30–39 | 168 | 4.410 | 1.200 | ||||
| 40–49 | 64 | 3.630 | 1.241 | ||||
| 50–59 | 49 | 3.390 | 0.812 | ||||
| 60–65 | 32 | 3.720 | 0.523 | ||||
| Region | Urban areas | 394 | 4.050 | 1.203 | 0.202 | 0.653 | <0.001 |
| Township | 59 | 3.970 | 1.640 | ||||
| Educational background | Senior secondary and below | 293 | 3.890 | 1.189 | 65.997 | <0.001 | 0.227 |
| Bachelor or specialist | 113 | 3.680 | 1.120 | ||||
| Postgraduate and above | 47 | 5.790 | 0.414 | ||||
| Marital status | Unmarried | 161 | 3.930 | 1.392 | 1.674 | 0.196 | 0.004 |
| Married | 292 | 4.090 | 1.191 | ||||
| Monthly income level (CNY 4) | <CNY 5000 | 91 | 3.430 | 1.431 | 23.232 | <0.001 | 0.134 |
| CNY 5000–8000 | 111 | 3.720 | 1.138 | ||||
| CNY 8000–10,000 | 161 | 4.180 | 1.078 | ||||
| >CNY 10,000 | 90 | 4.780 | 1.139 | ||||
| Daily bus usage frequency (Times) | 0–1 | 71 | 3.670 | 1.032 | 11.181 | <0.001 | 0.047 |
| 1–3 | 262 | 4.070 | 1.357 | ||||
| >3 | 120 | 4.540 | 1.093 | ||||
| Openness to experience | Low score | 211 | 3.810 | 1.140 | 13.331 | <0.001 | 0.029 |
| High score | 242 | 4.240 | 1.338 | ||||
| Conscientiousness | Low score | 252 | 4.030 | 1.189 | 0.02 | 0.887 | <0.001 |
| High score | 201 | 4.040 | 1.361 | ||||
| Extraversion | Low score | 231 | 4.040 | 1.124 | 0.004 | 0.95 | <0.001 |
| High score | 222 | 4.030 | 1.403 | ||||
| Agreeableness | Low score | 271 | 3.740 | 1.294 | 40.388 | <0.001 | 0.082 |
| High score | 182 | 4.480 | 1.086 | ||||
| Neuroticism | Low score | 232 | 4.160 | 1.247 | 4.604 | 0.032 | 0.01 |
| High score | 221 | 3.900 | 1.277 | ||||
| Items | Conclusion | Data Comparison |
|---|---|---|
| Gender | Men are more receptive to self-driving buses than are women. | Male (Mean = 4.74, SD = 1.074) > Female (Mean = 3.31, SD = 1.017) |
| Age | Different age groups have different levels of acceptance of self-driving buses. | 30–39 (Mean = 4.41, SD = 1.200) > 15–29 (Mean = 4.07, SD = 1.443) > 40–49 (Mean = 3.63, SD = 1.241) > 60–65 (Mean = 3.72, SD = 0.523) > 50–59 (Mean = 3.39, SD = 0.812) |
| Educational background | Those with higher educational backgrounds are more receptive to self-driving buses. | Postgraduate and above (Mean = 5.79, SD = 0.414)>Senior secondary and below (Mean = 3.89, SD = 1.189) > Bachelor or specialist (Mean = 3.68, SD = 1.120) |
| Monthly income level (CNY 1) | Those with higher income levels are more receptive to self-driving buses. | >CNY 10,000 (Mean = 4.78, SD = 1.139)>CNY 8000–10,000 (Mean = 4.18, SD = 1.078) > CNY 5000–8000 (Mean = 3.72, SD = 1.138) > < CNY 5000 (Mean = 3.43, SD = 1.431) |
| Daily bus usage frequency (Times) | Higher frequency of use increases acceptance of self-driving buses. | >3 (Mean = 4.54, SD = 1.093) > 1–3 (Mean = 4.07, SD = 1.357) > 0–1 (Mean = 3.67, SD = 1.032) |
| Agreeableness | High scores outperform low scores for acceptance of self-driving buses. | High score (Mean = 4.48, SD = 1.086) > Low score (Mean = 3.74, SD = 1.294) |
| Openness to experience | High scores outperform low scores for acceptance of self-driving buses. | High score (Mean = 4.24, SD = 1.338) > Low score (Mean = 3.81, SD = 1.14) |
Publisher’s Note: MDPI stays neutral with regard to jurisdictional claims in published maps and institutional affiliations. |
© 2022 by the authors. Licensee MDPI, Basel, Switzerland. This article is an open access article distributed under the terms and conditions of the Creative Commons Attribution (CC BY) license (https://creativecommons.org/licenses/by/4.0/).
Share and Cite
Li, Z.; Niu, J.; Li, Z.; Chen, Y.; Wang, Y.; Jiang, B. The Impact of Individual Differences on the Acceptance of Self-Driving Buses: A Case Study of Nanjing, China. Sustainability 2022, 14, 11425. https://doi.org/10.3390/su141811425
Li Z, Niu J, Li Z, Chen Y, Wang Y, Jiang B. The Impact of Individual Differences on the Acceptance of Self-Driving Buses: A Case Study of Nanjing, China. Sustainability. 2022; 14(18):11425. https://doi.org/10.3390/su141811425
Chicago/Turabian StyleLi, Zehua, Jiaran Niu, Zhenzhou Li, Yukun Chen, Yang Wang, and Bin Jiang. 2022. "The Impact of Individual Differences on the Acceptance of Self-Driving Buses: A Case Study of Nanjing, China" Sustainability 14, no. 18: 11425. https://doi.org/10.3390/su141811425
APA StyleLi, Z., Niu, J., Li, Z., Chen, Y., Wang, Y., & Jiang, B. (2022). The Impact of Individual Differences on the Acceptance of Self-Driving Buses: A Case Study of Nanjing, China. Sustainability, 14(18), 11425. https://doi.org/10.3390/su141811425