Article

Spatial Distribution Evolution and Optimization Path of Eco-Efficiency of Cultivated Land Use: A Case Study of Hubei Province, China

1
School of Public Administration, Central China Normal University, Wuhan 430079, China
2
School of Resource and Environmental Sciences, Wuhan University, Wuhan 430079, China
*
Author to whom correspondence should be addressed.
Sustainability 2022, 14(18), 11417; https://doi.org/10.3390/su141811417
Submission received: 10 August 2022 / Revised: 6 September 2022 / Accepted: 9 September 2022 / Published: 12 September 2022
(This article belongs to the Section Resources and Sustainable Utilization)

Abstract

:
Cultivated land is the foundation of human existence and development. Eco-efficiency of Cultivated Land Use (ECLU) is a comprehensive index to measure the economic, social, and ecological output of cultivated land. Therefore, it is of great theoretical and practical significance to describe the evolution characteristics of ECLU, and to explore the improvement path of ECLU for realizing the sustainable utilization of cultivated land resources, coping with the food crisis, and alleviating global warming. Hubei Province, as a traditional major province of grain production in China, can provide a reference for other developing countries in the world in terms of its management experience and technology in the production and utilization of cultivated land. In this study, the carbon emissions and pollution emissions of cultivated land use were incorporated into the calculation system of ECLU. Firstly, the undesired super-efficiency Slack-Based Measure (SBM) model was used to calculate ECLU in Hubei Province from 2008 to 2020. Secondly, the Exploring Space Date Analysis (ESDA) method was used to characterize its temporal and spatial evolution characteristics. Finally, the improvement direction of ECLU in the future was proposed from the perspective of cultivated land input factors. The research shows that, first of all, from 2008 to 2020, ECLU in Hubei Province showed a fluctuating growth trend, rising from 0.457 to 0.521, during which, it experienced two “U”-shaped changes, in 2011 and 2016. Secondly, the spatial agglomeration effect of ECLU in Hubei Province continued to increase, mainly showing two agglomeration patterns of high–high and low–low. Finally, ECLU in the study area was significantly negatively correlated with the redundancy rate of input factors. There was a redundancy in the input factors of cultivated land production, among which, the redundancy degree of agricultural employees (AM), chemical fertilizer usage (CFU), and total power of agricultural machinery (AMP) were more serious. Based on this, this paper proposes to adhere to the principle of adapting measures to local conditions and progress in an orderly manner, and to formulate differentiated and phased policies for improving ECLU according to natural resource endowments, and social and economic development conditions in different regions, in order to achieve the coordinated and sustainable development of people and cultivated land.

1. Introduction

As one of the important production input factors in the agricultural production process, cultivated land not only provides food security for human survival and development, but also has important ecological functions, such as water conservation, nutrient recycling, and climate regulation [1,2,3]. Therefore, many countries and regions in the world attach great importance to the protection and utilization of cultivated land, and have formulated a series of regulations and policies to strengthen the management of cultivated land, so as to achieve sustainable utilization of cultivated land resources [4,5,6]. However, with the continuous increase in the use intensity of cultivated land, the problem of carbon emissions and pollution emissions in the process of cultivated land use has become increasingly serious [7]. Studies have shown that the carbon emissions generated in the process of cultivated land use have become an important source of global greenhouse gas emissions [8]. The soil pollution caused by pesticides and fertilizers has the characteristics of a large pollution area, high control difficulty, wide coverage, and strong late damage. On the one hand, the utilization of cultivated land is faced with multiple external challenges, such as the Coronavirus Disease 2019, international political conflicts, and rapid population growth [9,10]. On the other hand, there are internal environmental constraints, such as the sharp decrease in the quantity of cultivated land, the continuous decline in quality, and the continuous deterioration of the ecology [11,12]. Therefore, exploring how to comprehensively improve the production and ecological functions of cultivated land has become one of the important propositions for the sustainable development of mankind. Among them, improving the eco-efficiency of cultivated land use (ECLU) has become an inevitable path to strengthen the use and protection of cultivated land [13].
As a developing country with a large population and a small area of cultivated land, China feeds about 20% of the world’s population with 7% of the world’s cultivated land, breaking the question of “who will feed China” raised by Brown in 1995 [14]. However, China has also paid high environmental and ecological costs while achieving 18 consecutive harvests of grain production [11]. According to the “Second National Pollution Source Census Bulletin” released by China in 2020, the content of total nitrogen and total phosphorus in China’s agricultural pollution source emissions in 2017 was 1.41 million tons and 210,000 tons, respectively, of which, 1.42 million tons of plastic film were used, and the accumulated residue over the years has reached 1.18 million tons. The cultivated land utilization, with high input, high output, and high energy consumption, produces a large amount of carbon dioxide. Moreover, the continuous high-intensity use of cultivated land further damages the soil structure, and weakens the carbon sequestration value of cultivated land, which has seriously damaged ECLU in China [15,16]. To this end, China issued the “14th Five-Year Plan for National Agricultural Green Development”, proposing to build an agricultural industry system with green, low-carbon, and cyclical development to accelerate the transition to green utilization of cultivated land by strengthening the “three-in-one” construction of the quantity, quality, and ecology of cultivated land, and help China achieve carbon peaking and carbon neutrality in 2030 and 2060, respectively. Hubei Province, as a traditional major province of grain production in China, can provide a reference for other developing countries in the world in terms of its management experience and technology in the production and utilization of cultivated land [17]. In this context, exploring how to improve ECLU, taking into account the goals of maximizing the expected output and minimizing the undesired output, has great significance for strengthening cultivated land utilization and protection, national food security, and ecological civilization construction.
Eco-efficiency is composed of the words, “ecology” and “efficiency”. In ecology, the word, “ecology”, refers to the state of interaction, mutual influence, and interdependence between organisms and organisms, and organisms and the environment in a certain environment [18]. In economics, the word, “efficiency”, mainly refers to Pareto efficiency: it is the ratio of input to output [19]. The essence behind the coupling of “ecology” and “efficiency” is to bring the environment and economy into the same analytical framework. In 1990, German scholars, Schaltegger and Sturm, first proposed the term, “eco-efficiency”, describing it as the ratio of economic-added value and the resulting environmental impact, and applied it to the business management sector [20]. In 1992, the World Business Council for Sustainable Development (WBCSD) further defined the concept of eco-efficiency, arguing that eco-efficiency is the reduction of ecological pressure to the range of environmental capacity while providing products and services to human needs [21]. Accordingly, this paper defines ECLU as the degree of maximizing social and economic output and minimizing environmental pollution that can be achieved by the input of certain resource factors in the process of cultivated land use. It takes into account the dual dimensions of ecological and economic benefits. The input–output perspective is used to quantitatively describe the coordination relationship between economic growth, resource utilization, and ecological protection [22,23]. In the vast developing countries with economic construction as the main task, cultivated land utilization efficiency mainly pursues the two-dimensional unification of resources and social economy. Previous studies have paid too much attention to the increase of cultivated land social and economic output generated by cultivated land input [24,25,26,27]. With the continuous increase of the population, the continuous depletion of resources, and the excessive use of chemical fertilizers, pesticides, agricultural films, and other agricultural chemicals, the ecological environment has deteriorated, and the ecological environmental benefits have gradually attracted widespread attention from scholars [28,29,30,31]. The coordinated development of composite systems has become the consensus of many scholars. Different from the relatively unified cognition of the connotation of ECLU, scholars have rich research on its measurement methods, mainly focusing on the stochastic frontier analysis method [32,33,34], ecological footprint method [35,36], emergy analysis method [37], and data inclusion analysis method [38,39,40,41,42]; for example, Victor Moutinho used the stochastic frontier analysis method to predict the eco-efficiency of 24 county-level cities in Germany [43]. The biggest advantage of this method is that it considers the impact of random factors on output, but its output requirements must be a single variable, and the actual situation often does not match this. Li et al. used the ecological footprint method to evaluate the ecological benefits and economic sustainability of the Yangtze River Delta region from 2000 to 2018 [44]. This method quantifies the supply capacity of various types of land and the resources consumed by human beings in production and life, and judges the difference between the two. However, this method is a static model that lacks predictive function, and the calculation data are difficult to obtain, so the accuracy of the results needs to be improved. G. Merlin uses the emergy analysis method to measure the eco-efficiency of the unit operation process [45]. This method is based on material flow, and converts different substances in the ecosystem into unified standard emergy for analysis and comparison. There is a wide range of materials, and many material energy value transformations have not yet formed a unified standard, so it is difficult to apply. Liu et al. measured ECLU in the main grain-producing areas in the middle and lower reaches of the Yangtze River in China from 2007 to 2018 based on the unexpected super-efficiency Slack-Based Measure model [15]. Yang et al. also used the unexpected super-efficiency Slack-Based Measure model to explore ECLU in Yangtze River Economic Belt [46]. The method is the most commonly used in the current eco-efficiency measurement because it does not need to set the specific form and estimated parameters of the model in advance. In addition, many scholars have paid attention to the influencing factors and regional differences of ECLU [13,22,47,48]. Most scholars believe that factors such as resource endowment, economic development level, natural conditions, and production conditions will have an impact on ECLU. There are differences in the direction and extent of the impact in different regions and years. For example, Ma et al. found that in 2019, China’s per capita GDP and disaster-affected area had the same impact on ECLU in all provinces, but the proportion of primary industry personnel, per capita sown area, and disposable income of rural residents, multiple cropping index, and irrigation index have different influence directions among provinces [49].
Undoubtedly, the above research is of great significance for improving the evaluation system of ECLU and enriching the related research work. However, most of the existing studies only take the carbon emissions from pesticides, fertilizers, films, and sowing into consideration of the undesired outputs of ECLU, and do not pay attention to the loss of fertilizers, the ineffective use of pesticides, and the residues of agricultural film. Therefore, it is impossible to comprehensively measure ECLU. A more comprehensive and systematic construction of a measurement system for ECLU will help to scientifically and accurately grasp and examine the actual state of cultivated land use, thus providing a reference for improving ECLU and sustainable agricultural development [50]. Secondly, areas with advantages in grain production or main grain-producing areas usually play an important role in ensuring national food security. Existing studies have paid less attention to ECLU and their internal differences in areas with advantages in grain production or main grain-producing areas. There is a lack of empirical and empirical research from grain-producing areas. In fact, in-depth exploration of the internal differences in ECLU in grain-producing areas and its future evolution trend have profound reference significance for countries and regions to scientifically and rationally utilize cultivated land resources and ensure food supply [51,52]. Finally, the existing research mainly focuses on the external factors affecting ECLU, and less deeply analyzes its impact on ECLU from the input factors of cultivated land itself. It is necessary to grasp the essential characteristics of ECLU, so as to make more targeted improvement measures to improve ECLU.
In view of this, this study selects 84 cities in Hubei Province, China, as the research unit, and uses the undesired super-efficiency SBM model to measure ECLU in the study area from 2008 to 2020. Secondly, the exploratory spatial data analysis method is used to describe its temporal and spatial evolution characteristics. Finally, according to the input redundancy of each evaluation unit, the direction and policy suggestions for improving ECLU in the future are put forward. This paper hopes to provide a reference for other developing countries or regions to realize the social, economic, and ecological coordinated output of cultivated land use under the common background of global ecological environment deterioration and increasing food supply instability.

2. Materials and Methods
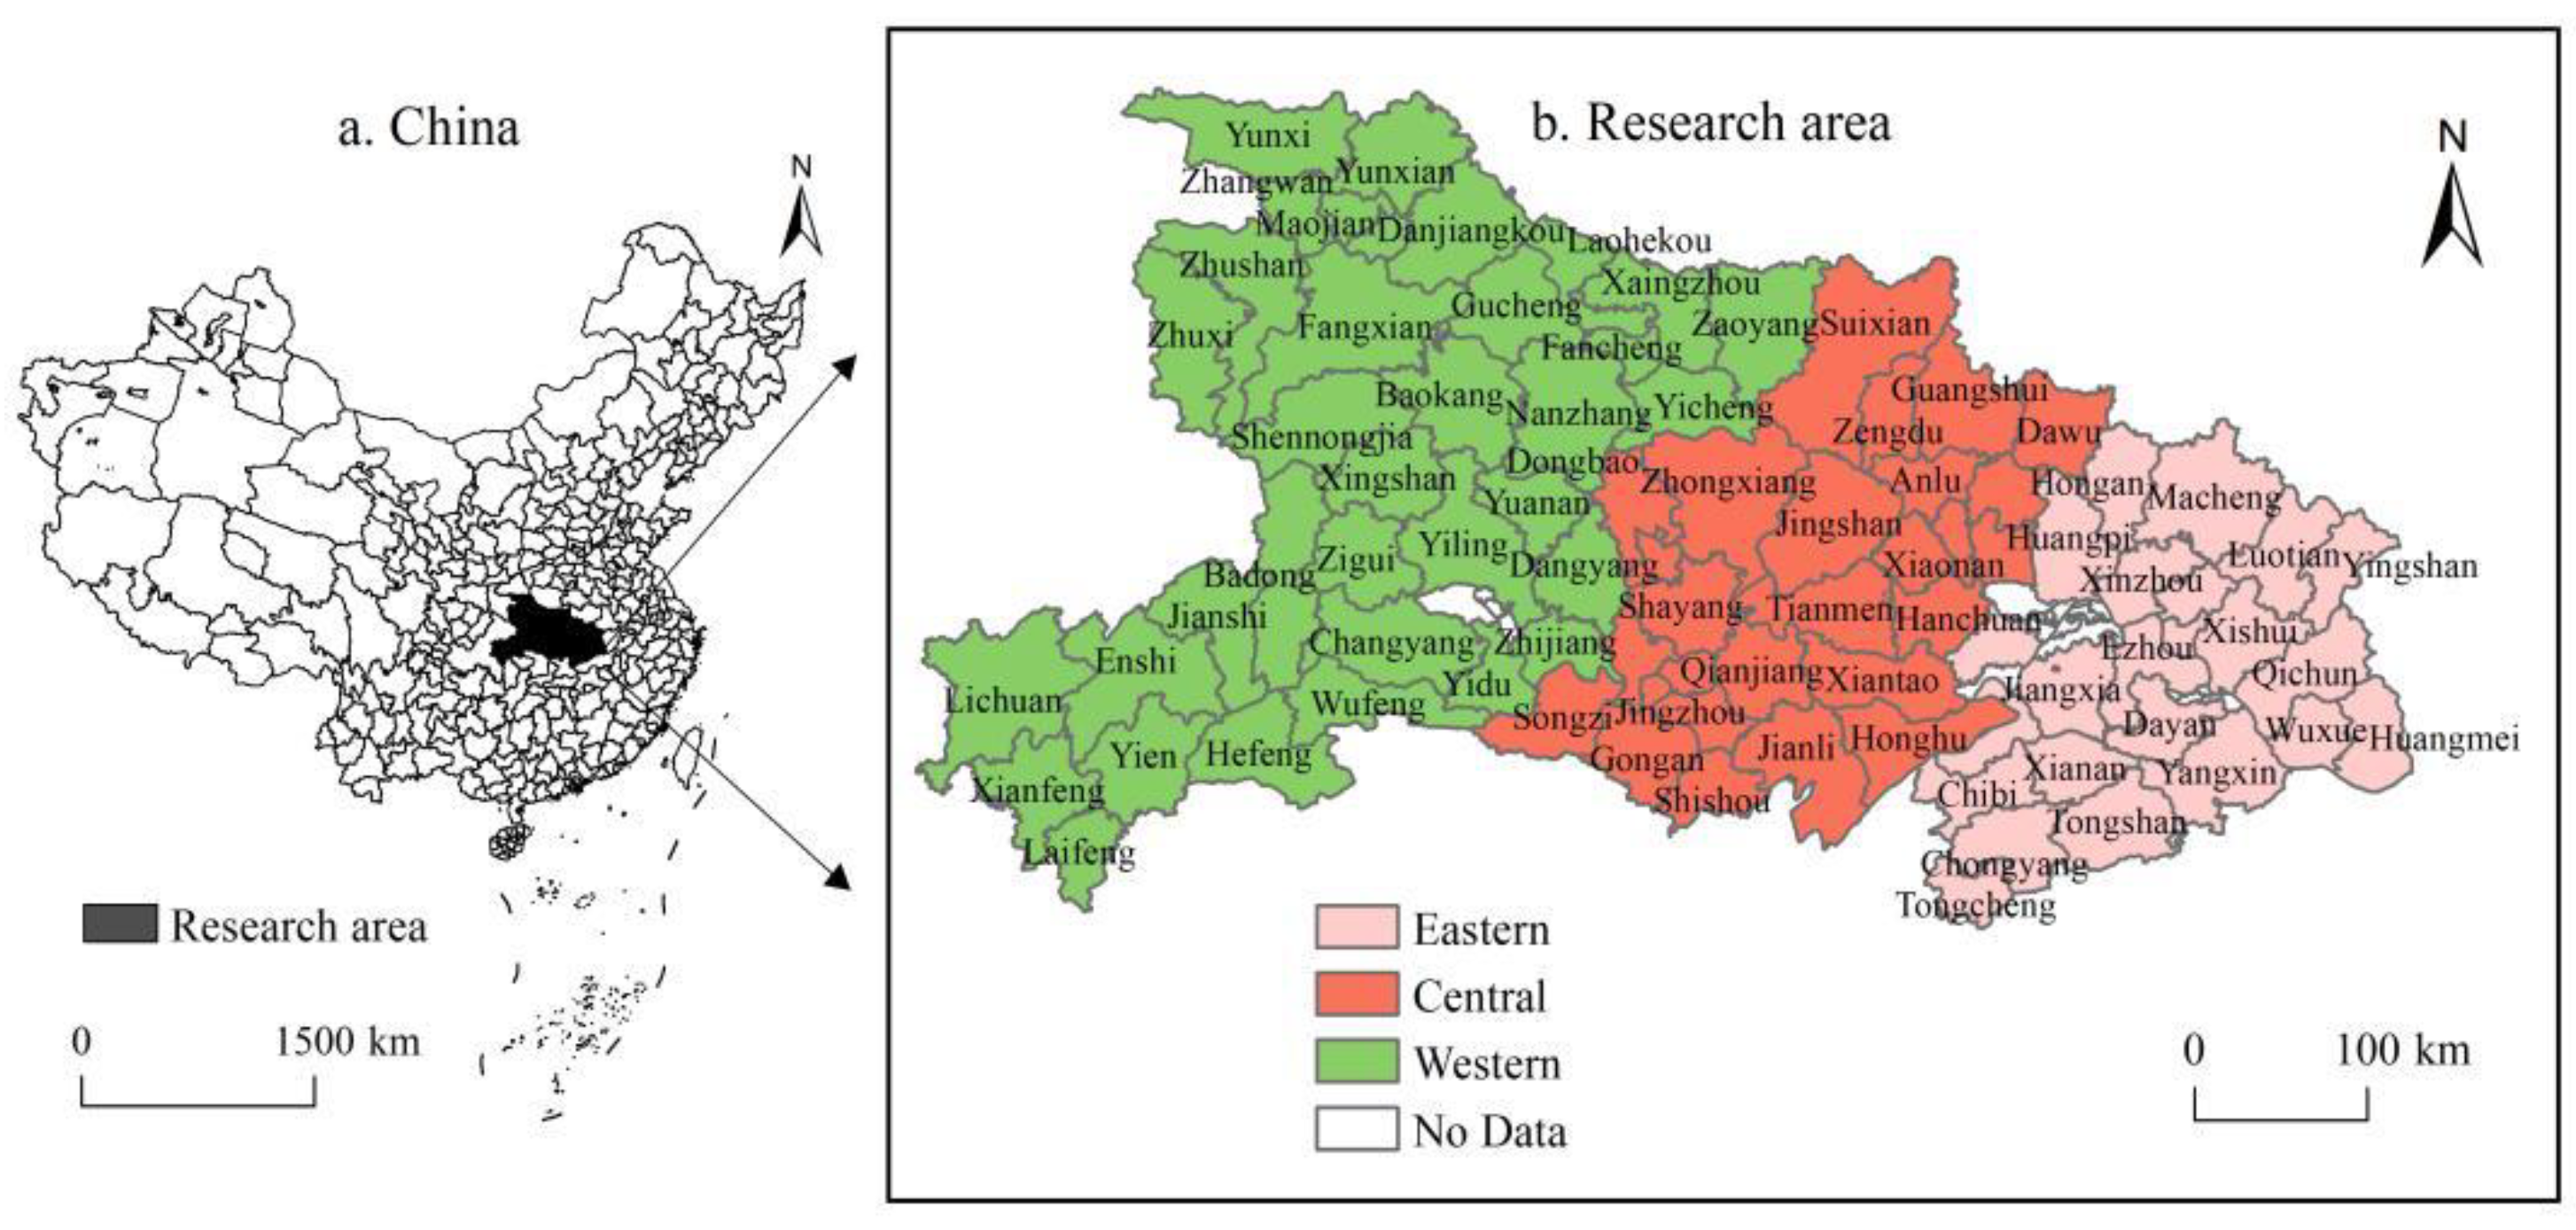
2.1. Research Area

Hubei Province is located in the central part of China, and is an important part and strategic fulcrum of China’s “Rise of Central China” and “Yangtze River Economic Belt”. At the same time, its geographical location is superior, and the landform types are diverse, with mountains, hills, and plains. The area has a subtropical humid, monsoon climate, with a warm climate and abundant rainfall. Its farming civilization has developed since ancient times, and it is China’s famous “land of fish and rice” and has always been an important grain, cotton, and oil production base in China, which plays an important role in protecting national food security [29]. In recent years, Hubei Province has steadily ranked as a strong economic province in the central region in terms of economic development. In 2020, the cultivated area of Hubei Province will reach 71.31 million mu, the total agricultural output value will be 349.25 billion yuan, and the agricultural population will be 21.43 million. However, with the acceleration of industrialization and urbanization, farmers in this area put more emphasis on cultivated land and less maintenance in the process of cultivated land utilization. As a result, the ecological environment of cultivated land utilization is seriously threatened; the pollution and barrenness of cultivated land are becoming more and more serious; and, finally, the per-capita cultivated land resources continue to decline. In addition, due to the regional differences in the resource endowment of cultivated land and policy formulation in various counties in Hubei Province, it has also brought many difficulties to the coordinated development of ECLU in Hubei Province. At present, China is building the Yangtze River Economic Belt into a demonstration belt of ecological civilization. As an important part of the Yangtze River Economic Belt, Hubei Province needs to coordinate the contradiction between economic development and cultivated land utilization, and promote the construction of ecological civilization in cultivated land utilization [53]. Therefore, this paper takes the counties in Hubei Province as the research area, in order to summarize the internal non-equilibrium characteristics of ECLU in Hubei Province, and to provide a scientific reference for the coordination and integration of cultivated land use and ecological environment. In order to facilitate the analysis of regional differences in the study, the 84 districts and counties in Hubei Province were divided into three regions: Eastern, Central, and Western. The Eastern part includes 23 cities under Wuhan, Ezhou, Huanggang, and Xianning; the Central includes 26 cities under Jingmen, Xiaogan, Jingzhou, Suizhou, Xiantao, Qianjiang, and Tianmen; and the West includes Shiyan, Yichang, Xiangyang, Enshi, and 35 cities belonging to Shennongjia Forest District (Figure 1).

2.2. Research Methods

2.2.1. The Undesired Super-Efficiency SBM Model

The efficiency evaluation Slack-Based Measure (SBM) model proposed by Tone is based on the traditional Data Envelopment Analysis (DEA) model, and directly considers the slack variable into the objective function, which eliminates the result deviation caused by radial and angle selection [54]. The economic explanation of the model is to make the actual profit maximize. However, this model cannot simultaneously solve multiple evaluation units with an efficiency value of 1 to further analyze and measure the efficiency with undesired output. To solve the above problems, Tone proposed a super-efficient SBM model with undesired outputs [55]. Considering the undesired output, such as pollution in the process of cultivated land use, this paper will use the super-efficiency SBM model, including the undesired output, to measure ECLU in Hubei Province. The basic formula of the undesired super-efficiency SBM model is as follows:
m i n ρ = 1 + 1 n i = 1 n S i x i k 1 1 s 1 + s 2 ( r = 1 s 1 s r g + y r k g + t = 1 s 2 s t b y t k b ) s . t . x i k j = 1 j k m x i j λ j s i y r b g j = 1 j k m y r i λ j + s r g + y t k b j = 1 j k m y t j b λ j s t b 1 1 s 1 + s 2 ( r = 1 s 1 s r g + y r k g + t = 1 s 2 s t b y t k b ) > 0 s , s g + , s b , λ 0 , i = 1 , 2 n , r = 1 , 2 s 1 , t = 1 , 2 s 2 , j = 1 , 2 m
where ρ is the target efficiency value; x i k is the i input of the k decision-making unit; y r k g   is the r expected output; y t k b is the t undesired output; s is the slack variable; λ   is the weight vector.

2.2.2. Exploring Space Date Analysis

Exploring Space Date Analysis (ESDA) is a visual analysis of spatial data to discover the interaction between spatial agglomeration and spatial heterogeneity to explain the spatial interaction mechanism of research objects in the study area [56]. In this paper, the global Moran’s I index and the local Moran’s I index are used to explain the global and local spatial correlation of ECLU in Hubei Province, respectively. Moran’s I > 0 indicates that there is a positive spatial correlation. The larger the value, the more significant the correlation. Moran’s I < 0 indicates that there is a negative spatial correlation, and the smaller the value, the greater the spatial difference. Among them, the global Moran’s I index calculation formula is:
I = i = 1 n j = 1 n W i j ( Y i Y ¯ ) ( Y j Y ¯ ) S 2 i = 1 n j = 1 n W i j
where I is Moran’s I index; n is the number of research objects; Y i and Y j are the observation value of i region and j region, respectively; W i j is the spatial weight matrix (space adjacent is 1, non-adjacent is 0); S 2 is the variance of observed values; and Y ¯ is the average value of observed values.
The formula for calculating the local Moran’s I index is:
I i = X i X ¯ S 2 j = 1 n W i j ( X j X ¯ )
where I i is the local spatial autocorrelation index, X is the attribute value of the i spatial unit, X ¯ is the average value of X i , n is the number of samples, W i j is the spatial weight matrix, and X j is the attribute value of the j spatial unit.

2.3. Data Sources

Considering the reality of cultivated land production and the availability of data, this paper selects 84 cities in Hubei Province from 2008 to 2020 as research units. All the data are from the 2009–2021 “Hubei Rural Statistical Yearbook” and the Statistical Yearbook of Hubei Province at various levels. Some of the index data in a few years are missing, and this paper uses the linear interpolation method and the average valuation method to fill in the gaps.

2.4. Evaluation Index System of ECLU

In the process of cultivated land utilization, how to use the least input of resources and the least adverse environmental impact to drive the continuous growth of cultivated land output and achieve the highest eco-efficiency is the key to solving the contradiction between ecological protection and economic development of cultivated land in China [49]. Based on this, this study defines ECLU as the degree of maximizing the expected output and minimizing the undesired output that can be achieved by the unit input of factors in the process of cultivated land use. According to this definition, this paper constructs the measurement system of ECLU according to the logic of input–output, and the principles of the scientificity, rationality, and availability of evaluation indicators (Table 1). There are three dimensions of input and capital investment. The sown area of crops (CSA) is selected to represent the input of land factors, the number of agricultural employees (AE) represents the input of labor factors, and the total power of agricultural machinery (AMP) and the amount of chemical fertilizer use (CFU) represent the input of capital factors. Output mainly includes two dimensions: expected output and undesired output. Expected output mainly selects the total agricultural output value and total grain output to represent the economic and social output of cultivated land, respectively. Undesired outputs mainly include carbon emissions from pesticides, chemical fertilizers, irrigation, and agricultural machinery operations, as well as pollution emissions, such as nitrogen and phosphorus loss from the use of pesticides and fertilizers. Among them, carbon emissions are calculated using the formula, E = ∑Ei = ∑(Gi × δi), where Gi represents the amount of carbon source used, and δi represents the carbon source carbon emission coefficient. Based on the reference and reference to relevant literature [57,58], the carbon emission coefficients of the selected pesticides, fertilizers, and irrigation are 4.9341 kg/kg, 0.8956 kg/kg, and 25 kg/hectares, respectively. The loss coefficient of nitrogen and phosphorus used in chemical fertilizers is mainly selected with reference to the “First National Manual of Pollution Coefficients of Fertilizer Loss from Agricultural Pollution Sources”.

3. Results and Analysis

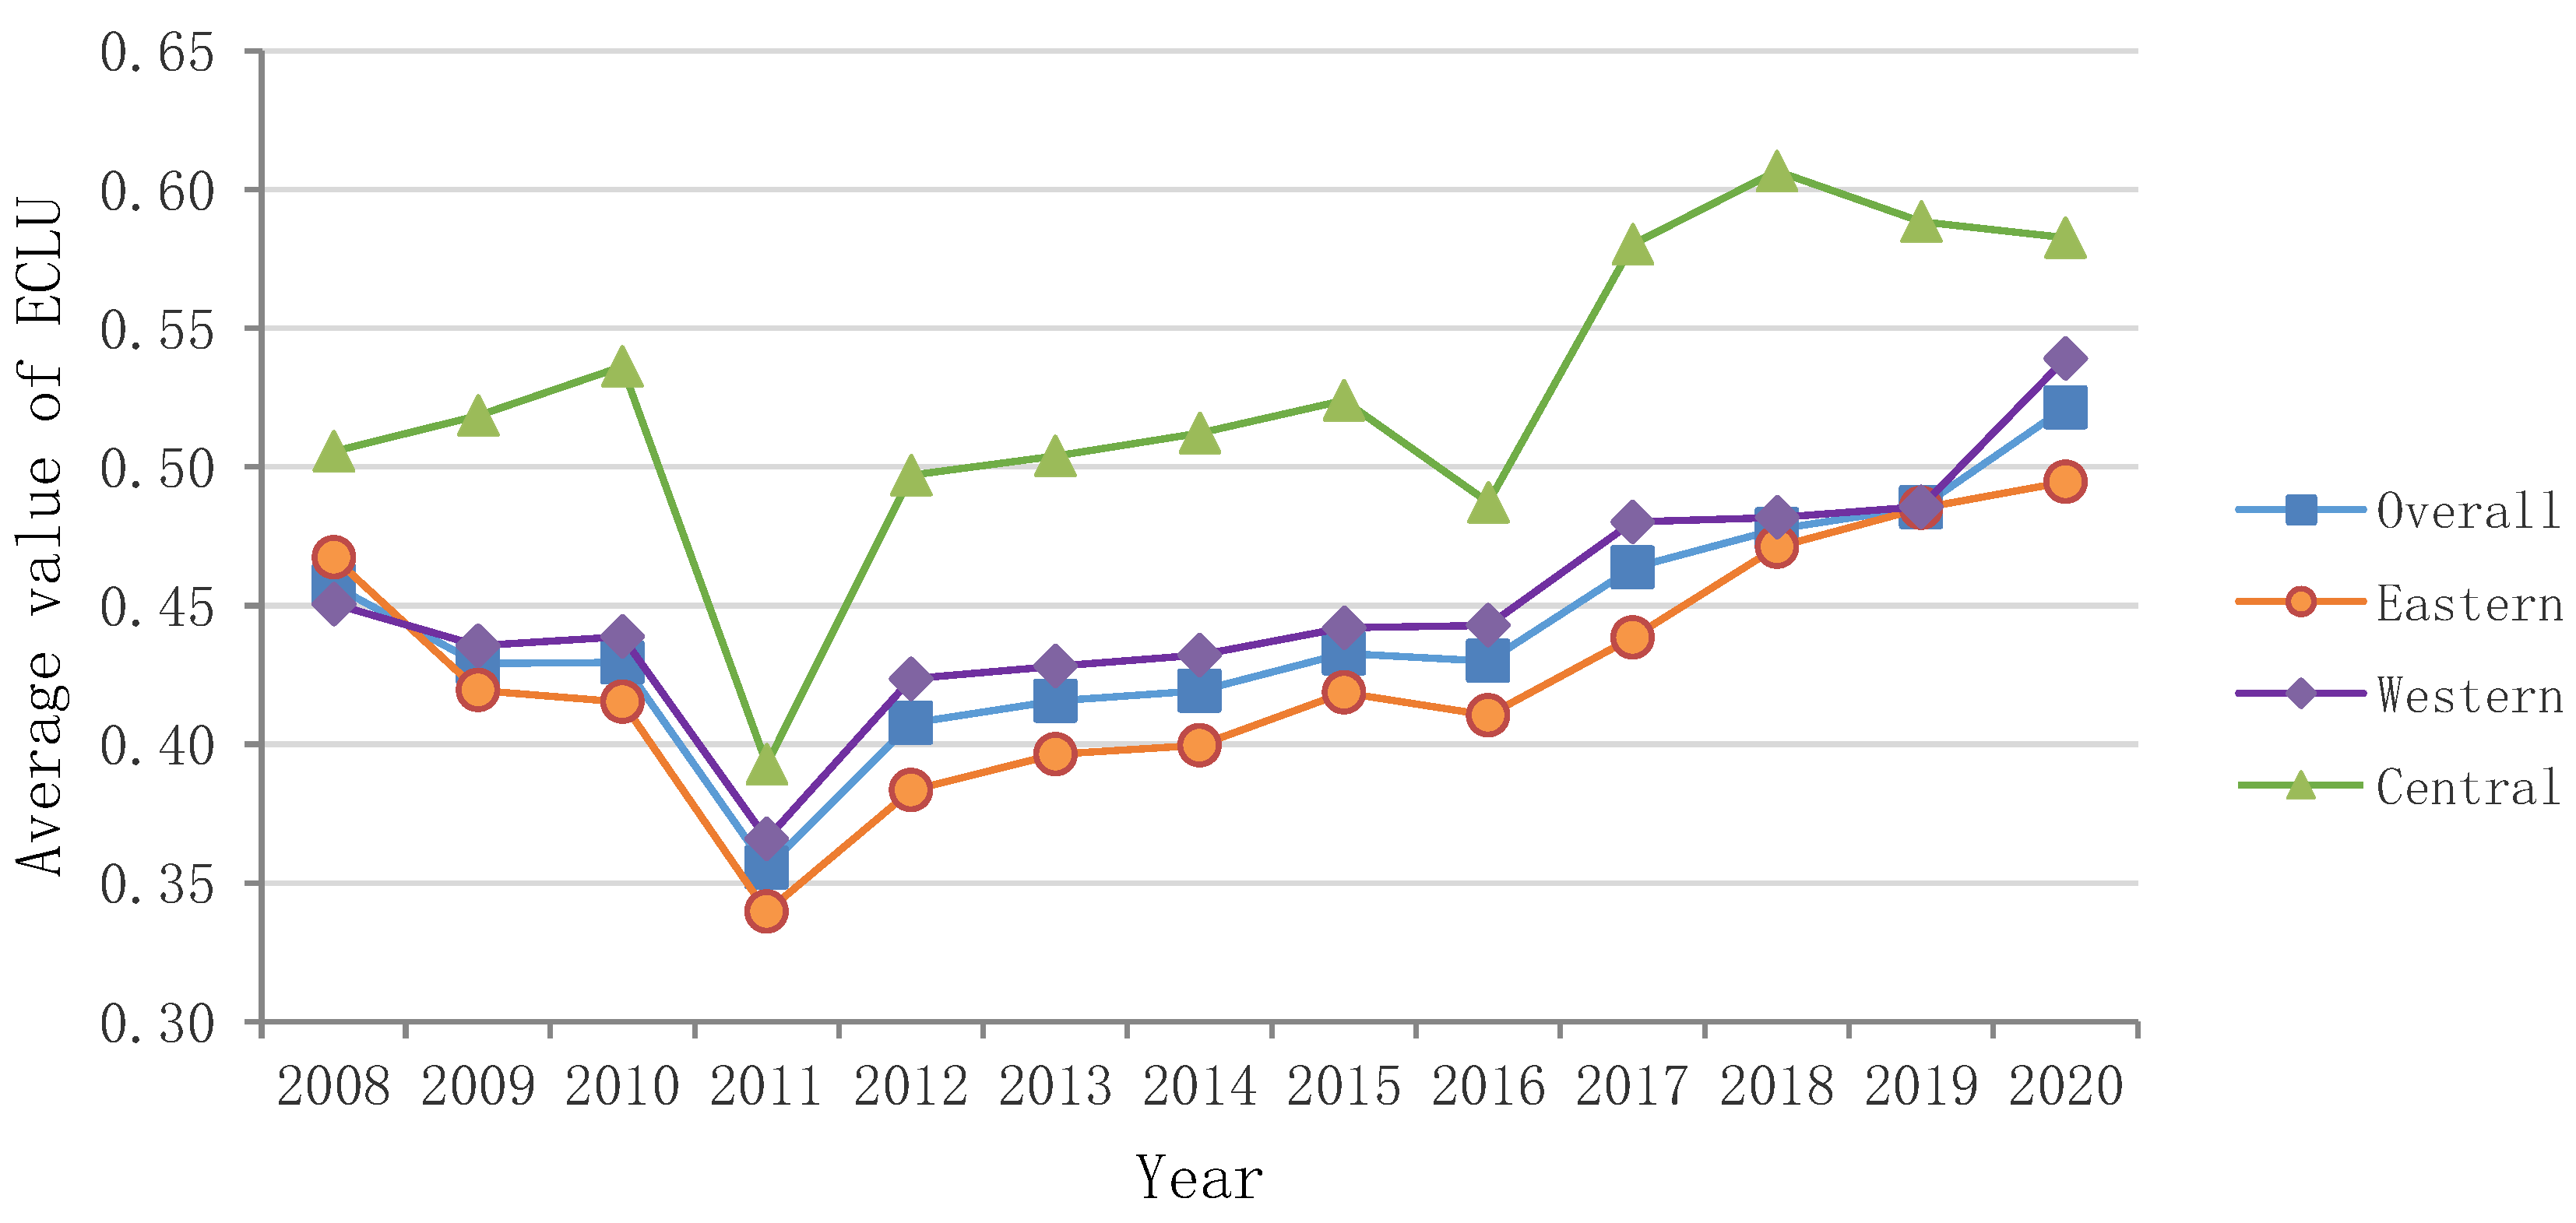
3.1. Time Series Characteristic Analysis of ECLU

With the help of Maxdea8.0 software(The manufacturer of the software is Beijing Rewomadi Software Co., LTD., from Beijing, China), the undesired super-efficiency SBM model was used to calculate ECLU in 84 cities in Hubei Province from 2008 to 2020 (Figure 2), and the following characteristics were obtained:
First, ECLU in Hubei Province generally shows a fluctuating upward trend. From 2008 to 2020, ECLU in Hubei Province increased from 0.457 to 0.521, an increase of 14%, which indicates that the high-quality development of cultivated land in Hubei Province has achieved certain results. Among them, there were two sudden drops in 2011 and 2016, which may have been influenced by the frequent occurrence of natural disasters, such as floods and droughts, in that year. Secondly, ECLU in Hubei Province is generally not high. On the whole, ECLU is 0.440, and the highest value is only 0.521, which is far less than the optimal state of efficiency, which indicates that there is still large room for improvement in ECLU in Hubei Province. Finally, there are significant regional differences in ECLU in Hubei Province. On the whole, the variation law of Central > Western > Eastern is presented, and the Central has been at a high level for a long time.

3.2. Spatial Characteristic Analysis of ECLU

3.2.1. Analysis of the Global Spatial Characteristics of ECLU

In order to more intuitively describe the overall spatial differentiation characteristics of ECLU in Hubei Province from 2008 to 2020, this study selected 2008, 2012, 2016, and 2020 with an interval of four years for in-depth analysis. According to Formula (2), the global Moran’s I value of ECLU in four years was calculated (Table 2). From the static cross-section, the Moran’s I index of ECLU in 2008, 2012, 2016, and 2020 were 0.123, 0.320, 0.317, and 0.251, and the p-values of the global Moran’s I index in the four periods were 0.054, 0.001, 0.001, and 0.001, indicating that there is a significant positive spatial correlation in ECLU in Hubei Province in recent years. In terms of the dynamic change range, Moran’s I index increased sharply from 0.123 in 2008 to 0.320 in 2012, an increase of 160%, and the overall increase during the study period was 104%. This changing trend indicates that the spatial agglomeration effect of ECLU in Hubei Province increased sharply during the study period. Among them, the sharp increase in 2012 reflects that the overall spatial pattern of ECLU in Hubei Province has undergone great changes, and the agglomeration trend is more prominent. In general, from 2008 to 2020, the spatial agglomeration of ECLU in Hubei Province showed a trend of a sudden increase first, and then gradually weakening, but the overall spatial differentiation was still on the rise.

3.2.2. Analysis of the Local Spatial Characteristics of ECLU

Since the global Moran’s I index only verifies the global spatial autocorrelation of ECLU in Hubei Province from a macro perspective, it cannot concretize the local spatial pattern. Therefore, it is necessary to use the local Moran’s I index to identify the local spatial pattern characteristics of ECLU in Hubei Province. According to Formula (3), the local Moran’s I index value of ECLU in Hubei Province in 2008, 2012, 2016, and 2020 was calculated, and the Moran’s I value was divided into four categories: high–high area, high–low area, low–high area, and low–low area. The ArcGIS software was used to draw the local agglomeration and evolution map of ECLU in Hubei Province (Figure 3). Figure 3 shows that ECLU in Hubei Province has significant spatial agglomeration characteristics during the study period, and its efficiency values mainly show two types of spatial distribution trends: high–high agglomeration and low–low agglomeration, and the spatial agglomeration pattern evolves over time.
(1)
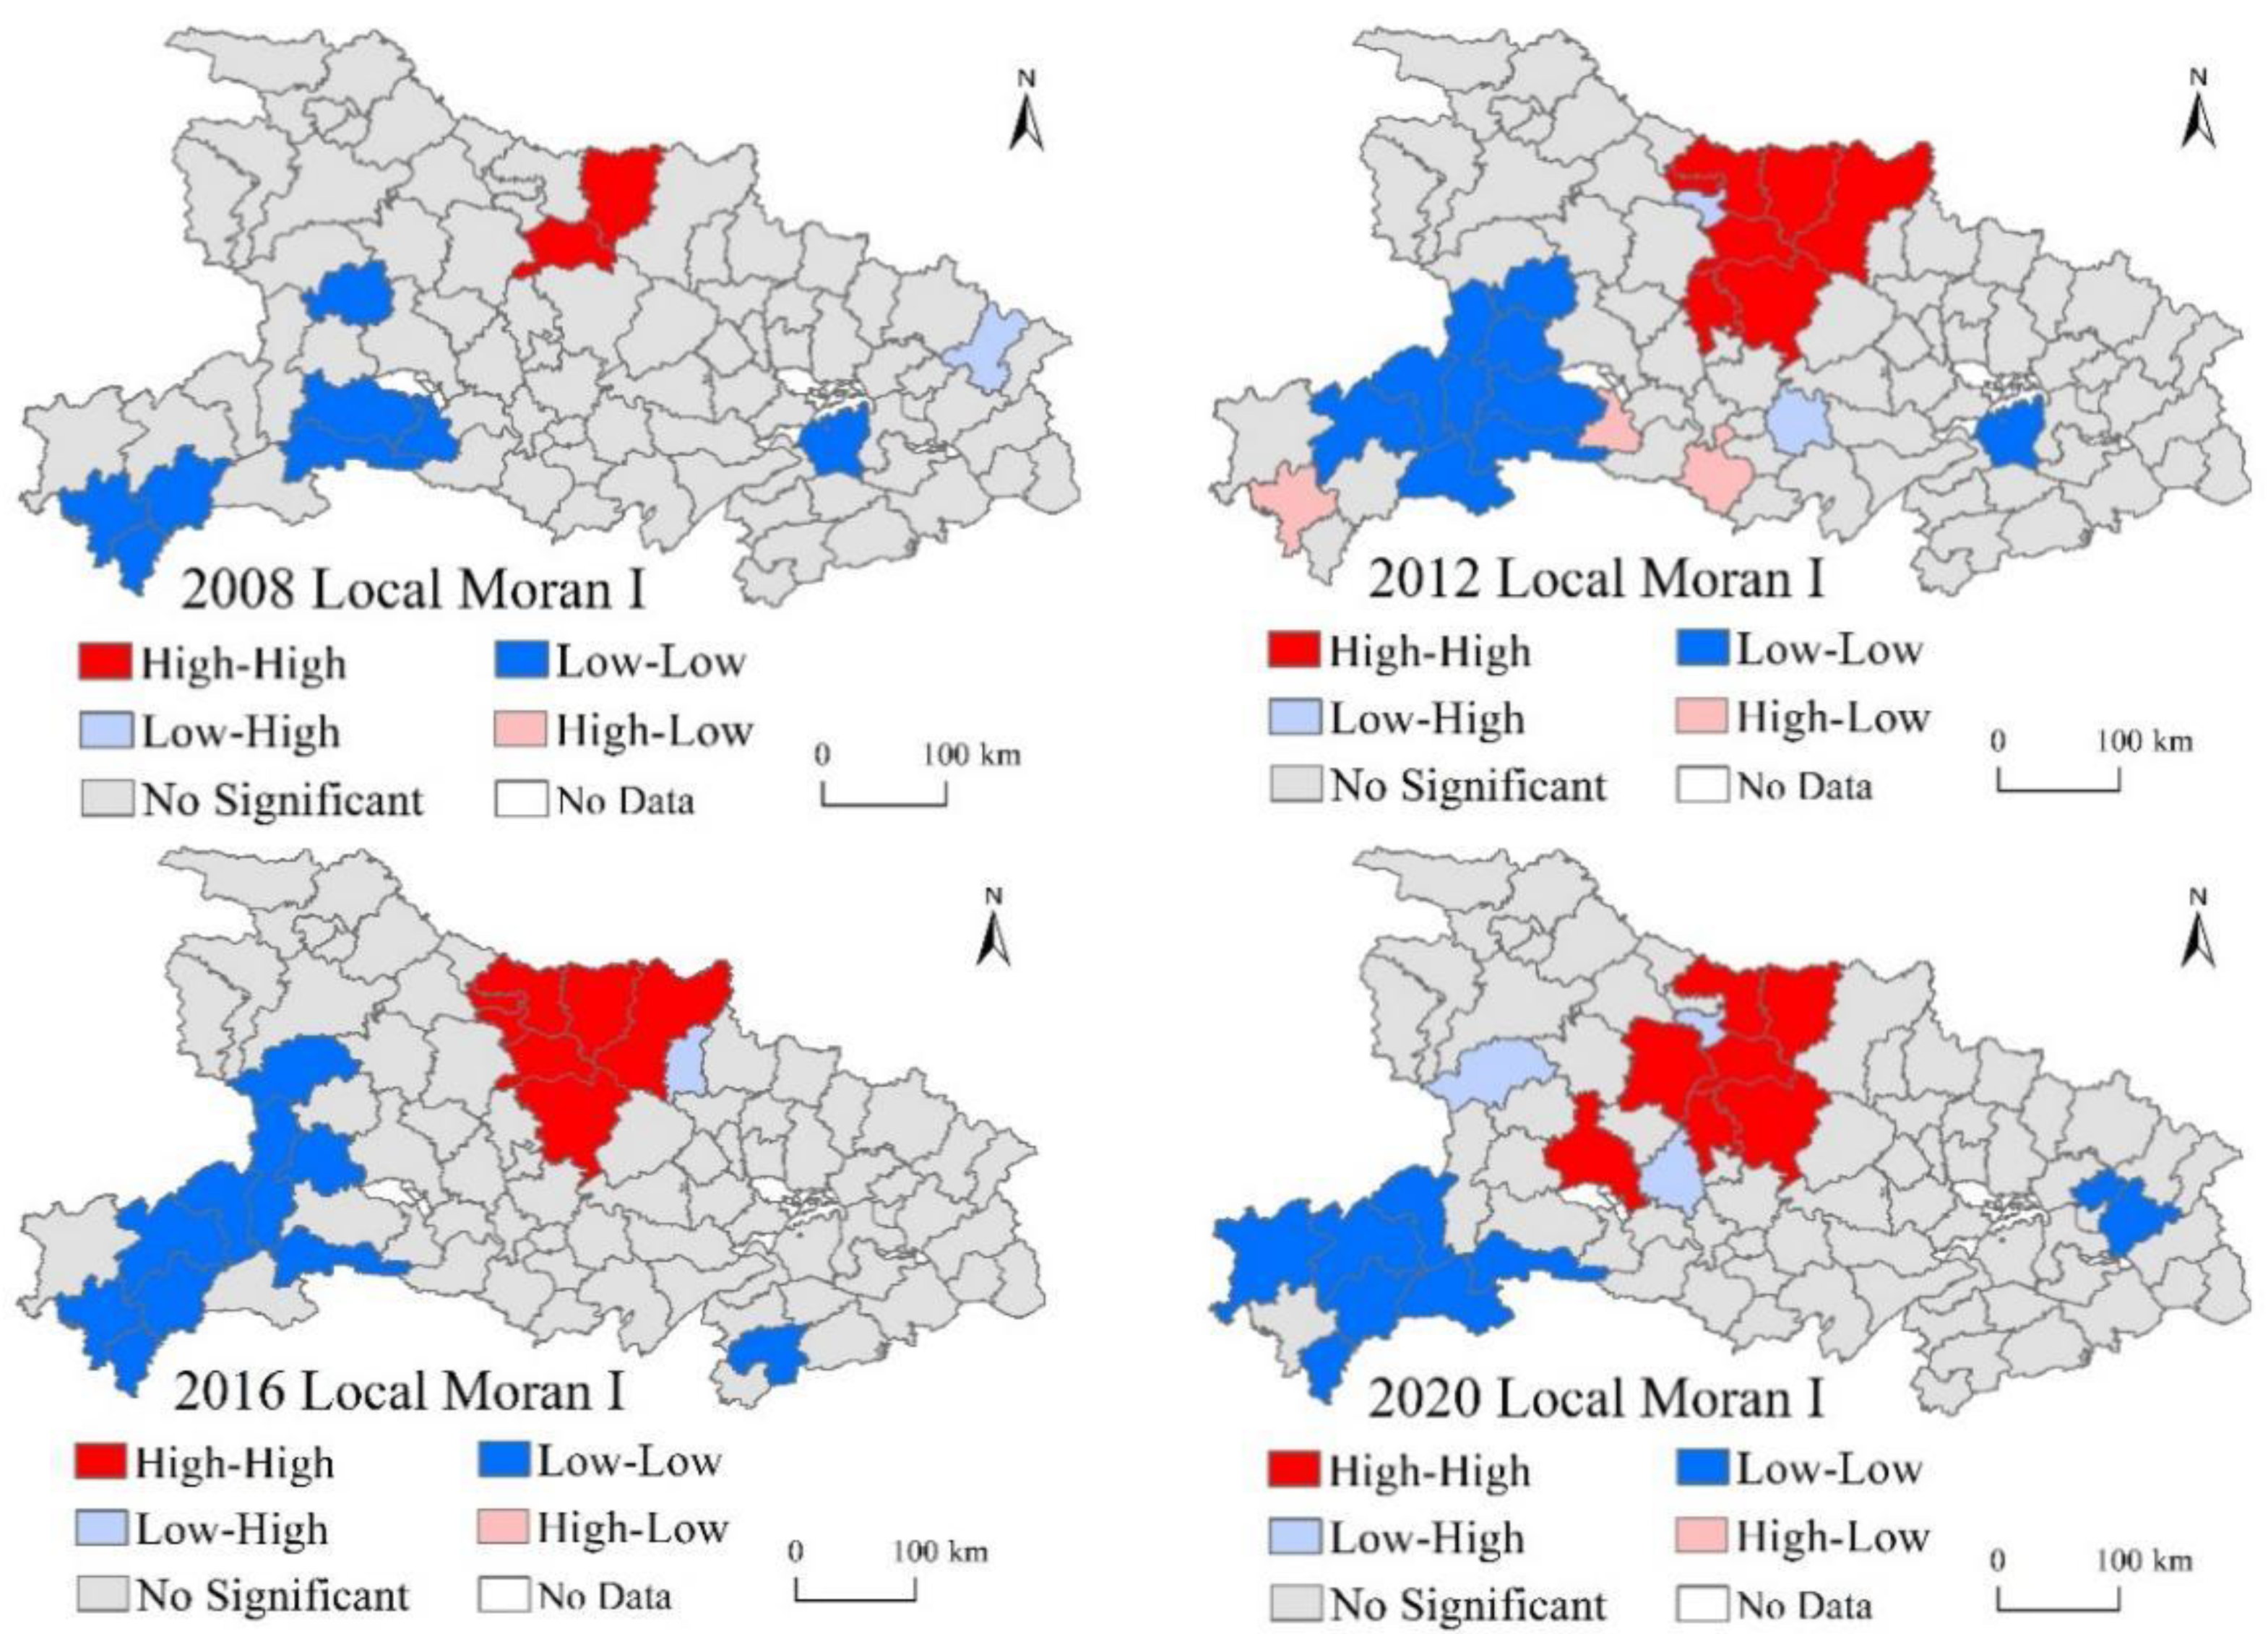
In 2008, ECLU was a high–high agglomeration area that mainly showed a spatial pattern of “single-core agglomeration”, covering two cities, Zaoyang and Yicheng, both of which are the largest grain-producing counties in China. ECLU was a low–low agglomeration area that mainly presents a spatial pattern of “multi-core agglomeration”, composed of eight cities distributed in the southern, southeastern, and central parts of the mountainous areas of Western.
(2)
In 2012, ECLU was a high–high agglomeration area that mainly showed the trend of “single core expansion”. The core continued to radiate outwards on the basis of the agglomeration pattern in 2008, mainly covering seven cities, including the central and eastern part of Xiangyang, most of Suizhou, and the central and western parts of Jingmen. ECLU was a low–low agglomeration area that mainly presents a spatial pattern of “single-core agglomeration”. The core is mainly based on the clustering pattern in 2008, which is composed of three single cores that converge into one single core, covering nine cities, including Enshi, where they are still distributed in the central and southern mountainous areas of Western.
(3)
In 2016, ECLU was a high–high agglomeration area that was still dominated by the spatial pattern of “single-core agglomeration”, which was roughly similar to the agglomeration pattern in 2012. The spatial pattern of the low ECLU agglomeration area still maintains “single core agglomeration”, but the distribution range extends from the central and southern parts of the Western mountain area to the southwest–northeast direction, and the coverage increases to 10 cities.
(4)
In 2020, ECLU was a high–high agglomeration area that mainly showed the spatial pattern of “single-core agglomeration” and point-like distribution, and the main change trend migrated to the central and western plains on the basis of the agglomeration pattern in 2016. ECLU was a low–low agglomeration area that continued to migrate to the southwest of Hubei, mainly in ethnic minority areas, such as Enshi. These areas account for a large proportion of mountainous and hilly landforms, and the fragmentation of cultivated land is more serious.

3.3. Analysis of the Redundancy Status of ECLU

In order to further explore the reasons that restrict the improvement of ECLU in Hubei Province, this paper plans to start from the input elements of cultivated land use, and by introducing the factor redundancy rate, to discuss how to optimize the allocation of cultivated land input elements, so as to achieve the optimal state of ECLU. The factor redundancy rate refers to the gap between the input and output and the optimal target value. A positive factor redundancy rate indicates that there is input redundancy, and a negative factor redundancy rate indicates that there is insufficient input [59]. In fact, the factor redundancy rate indicates that on the basis of the existing factor input, some factors have not been used efficiently, so there is relative redundancy. If the redundant part of the input can be fully utilized, more output will be obtained [60]. Therefore, the analysis of the redundancy of each input index can reflect the reasons for the loss of ECLU, and can help to provide direction for the improvement of ECLU.
In order to deeply capture the redundant change rule of input factors of ECLU in Hubei Province from 2008 to 2020, this paper used the redundant data of cultivated land input indicators in 2008, 2011, 2014, and 2017 to draw the redundant data of cultivated land input factors in Hubei Province from 2008 to 2020, which are used to analyze the global redundancy situation (Table 3). Besides the redundant data of cultivated land input indicators in 2008 and 2020, the distribution map of the redundant ratio of cultivated land input factors in Hubei Province was used to analyze the local redundancy (Figure 4). Overall, each index of cultivated land input in Hubei Province has a certain degree of redundancy, but different input indicators have great differences in different years and regions.
In terms of CSA, from a global perspective, the redundancy rate of CSA in Hubei Province showed a continuous decline from 2008 to 2020, from 21.21% in 2008 to 12.30% in 2020, a decrease of 42%. This means that the redundancy of CSA in Hubei Province is gradually improving during the study period, and the cultivated land output per unit sown area is increasing. In addition, from the horizontal comparison of various input indicators of cultivated land utilization, the redundancy rate of CSA is much lower than that of other indicators, which indicates that the redundancy of CSA in Hubei Province is relatively light as a whole. From a local perspective, compared with 2008, the number of cities in the redundancy range of (25%, 50%] and (50%, 75%] in 2020 has, respectively, decreased by 11 and 6, where they mainly concentrated in the southwestern mountainous areas, and central and southeastern plain areas of Hubei Province. However, it can be seen from the table that the overall CSA redundancy in Western is higher than that in Eastern and Central. Among them, Hefeng and Wufeng have always been in a state of high redundancy.
In terms of AE, from a global perspective, the redundancy rate of AE in Hubei Province has remained high from 2008 to 2020. Although the redundancy rate of AE has dropped from 89.17% in 2008 to 63.60% in 2020, the average redundancy rate of AE is stable. It is 71.36%, which indicates that there is a serious surplus of investment in AE in Hubei Province, resulting in low agricultural productivity per unit of labor. From a local perspective, compared with 2008, 17 new cities were added within the redundancy range of (50%, 75%] in 2020, but 26 cities were decreased within the redundancy range of (75%, 100%] in 2020. This indicates that the high redundancy state of AE in Hubei Province has gradually evolved to a higher redundancy state, and these evolution areas are mainly distributed at the junction of Western–Central and Central–Eastern.
In terms of CFU, from a global perspective, the redundancy rate of CFU in Hubei Province dropped from 86.93% to 65.45% from 2008 to 2020, indicating that the degree of redundancy in CFU is gradually improving. However, what cannot be ignored is that the average redundancy rate of CFU in Hubei Province from 2008 to 2020 was as high as 76.18%, which has always maintained a high level. Additionally, it has the deepest redundancy among the four input indicators, which indicates that the excessive redundancy of CFU seriously restricts the improvement of ECLU in Hubei Province. From a local perspective, from 2008 to 2020, the number of cities with a range of (50%, 75%] in Hubei Province increased from 20 to 26, whereas the number of cities with a range of (75%, 100%] in Hubei Province decreased from 57 to 41. Additionally, the areas with increased redundancy rates of CFU were mainly concentrated in northwestern Hubei, and central and southern Hubei.
In terms of AMP, from a global perspective, the redundancy rate of AMP in Hubei Province from 2008 to 2020 generally showed a fluctuating trend of first rising and then falling; that is, from 70.86% to 64.01%. Among them, the redundancy rate of AMP reached a peak of 75.67% in 2012, and the average redundancy rate was 63.48%, which indicated that during the study period, the redundancy of AMP in Hubei Province fluctuated slightly, whereas the overall redundancy was still in a state of high redundancy. From a local perspective, compared with 2008, 13 cities were newly added within the redundancy range of (75%, 100%] in 2020, and the situation of high redundancy continues to expand. Among them, the newly added cities with redundancy are mainly concentrated in areas such as Wu Mountain, Wudang Mountain, and Jianghan Plain. This shows that terrain factors have a heterogeneous impact on AMP, and there is a possibility that the redundancy rate of AMP is too high in both hilly and plain terrains.

4. Discussion

ECLU is an important indicator reflecting the productivity of cultivated land. In-depth exploration of the changed laws of ECLU is of great significance for realizing the sustainable utilization of cultivated land resources, stabilizing food supply, and alleviating global warming. From 2008 to 2020, ECLU in Hubei Province showed a fluctuating upward trend, which is mainly due to the implementation of ecological civilization construction policies in Hubei Province in recent years. Agricultural operators actively change the ways of cultivated land use, and increase their investment in ecological environmental protection. Especially since entering the “13th Five-Year Plan”, with the improvement of agricultural science and technology level and the gradual prominence of the marginal effect of the previous investment in ecological and environmental protection, ECLU has been gradually improved [30]. In 2011 and 2016, there were two “U”-shaped changes, which were mainly affected by natural disasters, such as major floods and frequent droughts. In addition, the overall ECLU in Hubei Province is not high, only 0.440. This may be because Hubei Province, as a major grain-producing province in China, has a relatively high total agricultural output value and total grain output based on its superior natural resource endowment, but its cultivated land use pattern is still relatively traditional. The abuse of pesticides and fertilizers, and the high carbon emissions of agricultural machinery are more prominent [48], and the green transformation of cultivated land use has not yet been fully realized, which indicates that there is still large room for improvement in ECLU in Hubei Province. At the same time, there are significant regional differences in ECLU in Hubei Province. One of the main reasons for this phenomenon may be that there are many cities with advantages in grain production in Central, rich agricultural production methods and management experience, and agricultural operators mostly adopt ecological farming production methods or agricultural production techniques [61]. However, the mountainous and hilly areas in Western are not conducive to the operation of large-scale agricultural machinery. Therefore, the traditional small-scale farming of households is the main method of cultivated land use, and the carbon emissions generated by agricultural machinery operations are relatively small, resulting in a relatively low eco-efficiency of cultivated land use. In general, although the social economy in Eastern is relatively developed, the river network is densely covered with cultivated land, which is not conducive to the development of large-scale agricultural operations, and its economic–society–ecological coordination output capacity is relatively weak.
The overall spatial evolution of ECLU in Hubei Province shows a trend of agglomeration and strengthening. The reason may be that Hubei Province has actively promoted the construction of ecological civilization in recent years, and vigorously promoted the transformation and upgrading of green and low-carbon utilization of cultivated land [30]. Factors such as the level of economic development affect the degree of agricultural mechanization and scale in some regions, and ECLU is improved faster. In addition, the local spatial evolution of ECLU in Hubei Province mainly presents two agglomeration patterns: high–high and low–low. This is mainly affected by the spatial spillover effect; that is, when ECLU in a certain area is at a high or low level, this area is more easily affected and becomes a high or low level of ECLU [62]. The spillover rate of this effect will be affected by various factors, such as farmland use behavior, planting preferences, and regional agricultural policies of farmers in neighboring regions [16]. Therefore, when improving the green development level of regional agriculture, the influence of neighboring areas should be considered, and the demonstration role of high-level ECLU areas should be actively played to drive the improvement of ECLU in surrounding areas, and to form a positive agglomeration effect.
The research on the redundancy of cultivated land use input factors shows that CSA, AE, CFU, and AMP are important factors restricting the improvement of ECLU in Hubei Province. In CSA, the areas with high redundancy are mainly distributed in Hefeng and Wufeng in Western. The reason may be that most of the mountainous areas in West are inhabited by ethnic minorities. Benefiting from the agricultural policy, local farmers actively develop agricultural products with ethnic characteristics, and the phenomenon of “swarms of bees” following the trend is more serious, which leads to the blind expansion of CSA [63]. In AE, the degree of redundancy continues to deepen, and the redundancy area continues to expand. These evolution areas are mainly distributed at the junction of Western–Central and Central–Eastern. The reason behind this may be that, on the one hand, affected by the radiation of the secondary and tertiary industries, it has absorbed a large number of AE, resulting in a continuous decrease in the number of AE [64]; on the other hand, with the promotion of the mechanized business model, the demand for AE continues to decrease. In CFU, redundant areas continue to expand, mainly in northwestern Hubei, and central and southern Hubei. On the one hand, this may be related to the low level of professional knowledge of agricultural personnel in this region, who appear to blindly apply fertilizer in pursuit of short-term economic benefits [65,66]; on the other hand, it may also be related to the preference of the fiscal policy to support the agriculture implemented in Hubei Province. For a long time, subsidies for agricultural policies have always been biased towards production factors such as chemical fertilizers, pesticides, and agricultural machinery. These two aspects have greatly increased the use of CFU by agricultural operators [30]. In AMP, the situation of high redundancy continued to expand, mainly concentrated in Wu Mountain, Wudang Mountain, and Jianghan Plain. This shows that terrain factors have a heterogeneous impact on AMP, and there is a possibility that the redundancy rate of AMP is too high in both hilly and plain terrains. The reason may be that with the progress of agricultural science and technology, small-scale agricultural machinery has been popularized and applied in mountainous and hilly areas, but there are still defects, such as high fuel consumption and low efficiency, resulting in the situation that the input of AMP is high, but the output is insufficient [12]. Moreover, in the main grain-producing areas, such as Jianghan Plain, the large-scale operation mode of large-scale agricultural machinery has been widely applied and promoted, and the input of AMP may have reached the Pareto optimum. Therefore, with the addition of the input of AMP, there may be the possibility of diminishing returns to scale [28].

5. Conclusions

This paper further enriches the connotation of ECLU, and incorporates the pollution emissions generated during the use of chemical fertilizers such as nitrogen and phosphorus into the measurement system of ECLU, which is helpful for the rational understanding and scientific measurement of ECLU. This paper uses the more scientific and accurate SBM model of undesired super-efficiency to measure ECLU in Hubei Province from 2008 to 2020. It is found that ECLU in Hubei Province has fluctuated and increased during the study period, from 0.457 to 0.521. The growth rate was 14%, during which, 2011 and 2016 experienced two “U”-shaped changes. From 2008 to 2020, the overall ECLU in Hubei Province was not high, but only 0.440, and there is still much room for improvement from the optimal ECLU. At the same time, the regional differences in ECLU in Hubei Province were significant, showing the differentiation law of Central > Western > Eastern. In addition, this paper uses the ESDA method to describe the spatial evolution characteristics of ECLU in Hubei Province. It is found that the spatial agglomeration of ECLU in Hubei Province generally shows a trend of increasing fluctuations during the study period, mainly including high–high and low–low. They are concentrated in the central and northern plains and the southwestern mountainous areas of Hubei Province. Finally, this paper deeply analyzes the redundancy of cultivated land production input factors, and identifies that the excessive redundancy rate of AE, CFU, and AMP is an important factor restricting the improvement of ECLU in Hubei Province. There are certain differences between years and different regions.

6. Policy Implication

Some policy implications can be drawn from the above conclusions: (1) actively establishing the concept of green agricultural development, and scientifically formulating the input level of each production factor for regional cultivated land utilization—for areas with excessively redundant land elements, it is necessary to reasonably standardize the scale of land circulation, and promote the intensive utilization of cultivated land. For areas with excessively redundant labor elements, it is necessary to actively develop secondary and tertiary industries to guide labor transfer on the spot. For areas with excessively redundant capital elements, it is necessary to increase the publicity of the concept of green and low-carbon development of agriculture, guide farmers to rationally use chemical fertilizers and pesticides, and encourage the use of organic fertilizers. Moreover, the direction of fiscal support for agriculture can be adjusted appropriately, an ecological value-oriented farmland subsidy policy can be established, and efforts can be made to transform the “chemical” agricultural model based on chemical fertilizers, pesticides, and diesel. (2) Establishing an inter-regional synergy and cooperation mechanism, and giving play to the demonstration and leading role of regions with high-level ECLU—under the background of the era of big data, an agricultural information service system that connects with the advantageous areas of grain production can be gradually established. For example, it can strengthen the database construction of various food crops, and gradually realize the sharing and utilization of agricultural planting-related data, so as to play a positive spatial spillover effect. (3) Adapting measures to local conditions, implementing policies in different regions, and formulating differentiated paths for improving ECLU according to their own resource endowments—for the Western, with many hills and a relatively weak social economy, three-dimensional agriculture in mountainous areas should be actively developed, and small-scale agricultural machinery with low energy consumption and easy access should be developed by learning from the excellent farming techniques and agricultural management experience in advanced areas. For the Central, with good water and heat conditions and wide plains, the scale of cultivated land circulation should be reasonably controlled; the usage of chemical fertilizers, pesticides, and agricultural machinery should be rationally formulated; fertilization methods, such as precision fertilization, soil testing, and formula fertilization, should be vigorously promoted; and the use of organic fertilizers should be encouraged. Soil microbial structure should be improved, as well as RS, GPS, GIS, and other science and technology to strengthen the monitoring of cultivated land fertility, soil moisture, and soil fertilizer efficiency, to promote the reduction and efficiency of chemical fertilizers, and to improve soil fertility. For the economically developed Eastern, though actively cultivating new agricultural business entities, it is necessary to vigorously develop rural secondary and tertiary industries and absorb surplus agricultural practitioners. In addition, efforts to cultivate high-quality grain seeds can be increased, the cultivation and irrigation technology of crops can be improved, and areas, where conditions permit, can be encouraged to change from single-cropping rice to double-cropping rice, so as to increase the multiple cropping index of cultivated land.

7. Insufficient

The ECLU is an important indicator to measure the social–economic–ecological output capacity of cultivated land, which is of great significance for accelerating the transformation of cultivated land to green and low-carbon utilization, and for promoting the high-quality development of agriculture [29,58]. There are still the following points in the research on ECLU that deserve further discussion: (1) this paper only selects 2008–2020 as the research period, and the time scale is relatively short. The long-term sequence is more conducive to grasping and analyzing the research object’s regular characteristics and changing trends. For example, Li et al. found that long-time series remote sensing images can more accurately describe the characteristics of the dynamic changes of rubber forests, and can provide more scientific policy recommendations for sustainable forest resource detection, management, and maintenance of forest ecosystem health. (2) The ECLU is a comprehensive concept influenced by multiple dimensions, such as politics, economy, society, and ecology [31]. How to comprehensively, accurately, and scientifically measure the ECLU is long-term work. In the future, more carbon emissions and pollution emissions that generate carbon dioxides, such as pesticides and films, should be included in the indicator system of undesired outputs. In addition, the use of cultivated land not only produces carbon emissions, but also has a good carbon sink function, which can absorb a certain amount of carbon dioxide. Therefore, accurate quantification of the carbon uptake of cultivated land is of great significance to the measurement of the ECLU. (3) Hubei Province is only one of the main grain-producing areas in China. Comparing and analyzing ECLU among different provinces in the main grain-producing areas is more helpful in comprehensively understanding the changed laws of cultivated land use. The changing laws of regional grain production can provide targeted improvement suggestions for the utilization of cultivated land in other countries or regions in the world.

Author Contributions

Conceptualization, Y.W. and J.L.; methodology, P.Z. and J.L.; software, J.H.; validation, J.L.; formal analysis, P.Z.; investigation, Y.W.; resources, P.Z.; data curation, P.Z. and J.L.; writing—original draft preparation, P.Z.; writing—review and editing, Y.W. and P.Z.; visualization, J.H.; supervision, J.L.; project administration, P.Z.; funding acquisition, Y.W. All authors have read and agreed to the published version of the manuscript.

Funding

This research is funded by the Program of National Natural Science Foundation of China (Grant No. 71403095; 71873054).

Institutional Review Board Statement

Not applicable.

Informed Consent Statement

Not applicable.

Data Availability Statement

Not applicable.

Conflicts of Interest

The authors declare no conflict of interest.

References

  1. Xiuhua, S.; Fei, Z.; Zhe, W. Research on optimization of ecological service function and planning control of land resources planning based on ecological protection and restoration. Environ. Technol. Innov. 2021, 24, 101904. [Google Scholar] [CrossRef]
  2. Zhang, C.; Su, Y.; Yang, G.; Chen, D.; Yang, R. Spatial-Temporal Characteristics of Cultivated Land Use Efficiency in Major Function-Oriented Zones: A Case Study of Zhejiang Province, China. Land 2020, 9, 114. [Google Scholar] [CrossRef]
  3. Liu, Z.; Gu, H.; Liang, A.; Li, L.; Yao, Q.; Xu, Y.; Liu, J.; Jin, J.; Liu, X.; Wang, G. Conservation Tillage Regulates the Assembly, Network Structure and Ecological Function of the Soil Bacterial Community in Black Soils. Plant Soil 2022, 472, 207–223. [Google Scholar] [CrossRef]
  4. Wang, X. Changes in Cultivated Land Loss and Landscape Fragmentation in China from 2000 to 2020. Land 2022, 11, 684. [Google Scholar] [CrossRef]
  5. Christian, S.; Daniela, B.; Elisabeth, A.; David, W.T.K.; Sebastian, G.; Thilo, S.; Enno, B. Integrated Assessment of Regional Approaches for Biodiversity Offsetting in Urban-Rural Areas—A Future Based Case Study from Germany Using Arable Land as An Example. Land Use Policy 2022, 117, 106085. [Google Scholar] [CrossRef]
  6. Bigelow, D.P.; Lewis, D.J.; Mihiar, C. A Major Shift in US Land Development Avoids Significant Losses in Forest and Agricultural Land. Environ. Res. Lett. 2022, 17, 024007. [Google Scholar] [CrossRef]
  7. You, H.; Wu, C. Analysis of Carbon Emission Efficiency and Optimization of Low Carbon for Agricultural Land Intensive Use. Trans. Chin. Soc. Agric. Eng. 2014, 30, 224–234. [Google Scholar]
  8. Jiang, S.; Zhou, J.; Qiu, S. Can Appropriate Scale Operation Restrain Agricultural Non-Point Source Pollution?—Empirical Study Based on Dynamic Threshold Panel Model. J. Agrotech. Economics. 2021, 7, 33–48. [Google Scholar]
  9. Deng, X.; Gibson, J. Sustainable Land Use Management for Improving Land Eco-Efficiency: A Case Study of Hebei, China. Ann. Oper. Res. 2020, 290, 265–277. [Google Scholar] [CrossRef]
  10. Fan, Z.; Deng, C.; Fan, Y.; Zhang, P.; Lu, H. Spatial-Temporal Pattern and Evolution Trend of the Cultivated Land Use Eco-Efficiency in the National Pilot Zone for Ecological Conservation in China. Int. J. Environ. Res. Public Health 2021, 19, 111. [Google Scholar] [CrossRef]
  11. Hou, X.; Liu, J.; Zhang, D.; Zhao, M.; Xia, C. Impact of Urbanization on the Eco-Efficiency of Cultivated Land Utilization: A Case Study on the Yangtze River Economic Belt, China. J. Clean. Prod. 2019, 238, 117916. [Google Scholar] [CrossRef]
  12. Ke, N.; Zhang, X.; Lu, X.; Kuang, B.; Jiang, B. Regional Disparities and Influencing Factors of Eco-Efficiency of Arable Land Utilization in China. Land 2022, 11, 257. [Google Scholar] [CrossRef]
  13. Zou, X.Q.; Xie, M.H.; Li, Z.Y.; Duan, K.F. Spatial Spillover Effect of Rural Labor Transfer on the Eco-Efficiency of Cultivated Land Use: Evidence from China. Int. J. Environ. Res. Public Health 2022, 19, 9660. [Google Scholar] [CrossRef] [PubMed]
  14. Brown, L.R. Who Will Feed China?: Wake-Up Call for a Small Planet; WW Norton & Company: New York, NY, USA, 1995. [Google Scholar]
  15. Liu, M.B.; Zhang, A.L.; Wen, G.H. Temporal and Spatial Pattern and Evolution Trend of Cultivated Land Use Ecological Efficiency in the Main Grain Producing Areas in the Lower Yangtze Region. China Land Sci. 2021, 35, 50–60. [Google Scholar]
  16. Wen, G.H.; Liu, M.B.; Hu, X.H.; Zhao, J. Spatial Correlation and Spatial Effect of Cultivated Land Use Ecological Efficiency in the Dongting Lake Plain. Sci. Geogr. Sin. 2022, 6, 1–11. [Google Scholar]
  17. Yang, B.; Chen, X.; Wang, Z.; Li, W.; Zhang, C.; Yao, X. Analyzing Land Use Structure Efficiency with Carbon Emissions: A Case Study in the Middle Reaches of the Yangtze River, China. J. Clean. Prod. 2020, 274, 123076. [Google Scholar] [CrossRef]
  18. Pearson, D.; Gorman, J.; Aspinall, R. Multiple Roles for Landscape Ecology in Future Farming Systems: An Editorial Overview. Land 2022, 11, 288. [Google Scholar] [CrossRef]
  19. Iancu, D.A.; Trichakis, N. Pareto Efficiency in Robust Optimization. Manag. Sci. 2014, 60, 130–147. [Google Scholar] [CrossRef]
  20. Schaltegger, S.; Sturm, A. Ökologische Rationalität: Ansatzpunkte Zur Ausgestaltung von Ökologieorientierten Managementinstrumenten. Die Unternehm. 1990, 44, 273–290. [Google Scholar]
  21. Yin, Y.; Hou, X.; Liu, J.; Zhou, X.; Zhang, D. Detection and Attribution of Changes in Cultivated Land Use Ecological Efficiency: A Case Study on Yangtze River Economic Belt, China. Ecol. Indic. 2022, 137, 108753. [Google Scholar] [CrossRef]
  22. Zhao, Z.; Bai, Y.; Wang, G.; Chen, J.; Yu, J.; Liu, W. Land Eco-Efficiency for New-Type Urbanization in the Beijing-Tianjin-Hebei Region. Technol. Forecast. Soc. Chang. 2018, 137, 19–26. [Google Scholar] [CrossRef]
  23. Liu, M.-B.; Zhang, A.-L.; Wen, G.-H. Regional Differences and Spatial Convergence in the Ecological Efficiency of Cultivated Land Use in the Main Grain Producing Areas in the Yangtze Region. J. Nat. Resour. 2022, 37, 477–493. [Google Scholar] [CrossRef]
  24. Lyu, X.; Peng, W.; Niu, S.; Qu, Y.; Xin, Z. Evaluation of Sustainable Intensification of Cultivated Land Use According to Farming Households’ Livelihood Types. Ecol. Indic. 2022, 138, 108848. [Google Scholar] [CrossRef]
  25. Lu, X.; Hou, J.; Tang, Y.; Wang, T.; Li, T.; Zhang, X. Evaluating the Impact of the Highway Infrastructure Construction and the Threshold Effect on Cultivated Land Use Efficiency: Evidence from Chinese Provincial Panel Data. Land 2022, 11, 1044. [Google Scholar] [CrossRef]
  26. Han, H.; Zhang, X. Static and Dynamic Cultivated Land Use Efficiency in China: A Minimum Distance to Strong Efficient Frontier Approach. J. Clean. Prod. 2020, 246, 119002. [Google Scholar] [CrossRef]
  27. Li, Y.; Li, Y.; Westlund, H.; Liu, Y. Urban–Rural Transformation in Relation to Cultivated Land Conversion in China: Implications for Optimizing Land Use and Balanced Regional Development. Land Use Policy 2015, 47, 218–224. [Google Scholar] [CrossRef]
  28. Kuang, B.; Lu, X.; Zhou, M.; Chen, D. Provincial Cultivated Land Use Efficiency in China: Empirical Analysis Based on the SBM-DEA Model with Carbon Emissions Considered. Technol. Forecast. Soc. Chang. 2019, 151, 119874. [Google Scholar] [CrossRef]
  29. Lai, Z.; Chen, M.; Liu, T. Changes in and Prospects for Cultivated Land Use Since the Reform and Opening Up in China. Land Use Policy 2020, 97, 104781. [Google Scholar] [CrossRef]
  30. Xiao, P.; Xu, J.; Yu, Z.; Qian, P.; Lu, M.; Ma, C. Spatiotemporal Pattern Differentiation and Influencing Factors of Cultivated Land Use Efficiency in Hubei Province under Carbon Emission Constraints. Sustainability 2022, 14, 7042. [Google Scholar] [CrossRef]
  31. Lu, X.; Zhang, Y.; Li, J.; Duan, K. Measuring the Urban Land Use Efficiency of Three Urban Agglomerations in China Under Carbon Emissions. Environ. Sci. Pollut. Res. 2022, 29, 36443–36474. [Google Scholar] [CrossRef]
  32. Arshad, M.; Amjath-Babu, T.; Aravindakshan, S.; Krupnik, T.J.; Toussaint, V.; Kächele, H.; Müller, K. Climatic Variability and Thermal Stress in Pakistan’s Rice and Wheat Systems: A Stochastic Frontier and Quantile Regression Analysis of Economic Efficiency. Ecol. Indic. 2018, 89, 496–506. [Google Scholar] [CrossRef]
  33. Zhang, Q.; Sun, Z.; Huang, W. Does Land Perform Well for Corn Planting? An Empirical Study on Land Use Efficiency in China. Land Use Policy 2018, 74, 273–280. [Google Scholar] [CrossRef]
  34. Mango, N.; Makate, C.; Hanyani-Mlambo, B.; Siziba, S.; Lundy, M. A Stochastic Frontier Analysis of Technical Efficiency in Smallholder Maize Production in Zimbabwe: The Post-Fast-Track Land Reform Outlook. Cogent Econ. Finance 2015, 3, 1117189. [Google Scholar] [CrossRef]
  35. Biswajit, G.; Namita, C. Application of the Ecological Footprint Method for Measuring Sustainability of Agricultural Land use at a Micro Level in Barddhaman District, West Bengal, India. Current Science 2018, 115, 1913–1920. [Google Scholar]
  36. Yan, J.; Wang, M.; Su, F.; Zhang, X.; Gao, S.; Xu, M. Changes in Land Cover and Ecological Stress in Borneo Based on Remote Sensing and an Ecological Footprint Method. Landsc. Ecol. Eng. 2020, 16, 319–333. [Google Scholar] [CrossRef]
  37. Yu, X.; Geng, Y.; Dong, H.; Fujita, T.; Liu, Z. Emergy-Based Sustainability Assessment on Natural Resource Utilization In 30 Chinese Provinces. J. Clean. Prod. 2016, 133, 18–27. [Google Scholar] [CrossRef]
  38. Rashidi, K.; Saen, R.F. Incorporating Dynamic Concept into Gradual Efficiency: Improving Suppliers in Sustainable Supplier Development. J. Clean. Prod. 2018, 202, 226–243. [Google Scholar] [CrossRef]
  39. Skevas, T.; Stefanou, S.E.; Lansink, A.O. Pesticide Use, Environmental Spillovers and Efficiency: A DEA Risk-Adjusted Efficiency Approach Applied to Dutch Arable Farming. Eur. J. Oper. Res. 2014, 237, 658–664. [Google Scholar] [CrossRef]
  40. Mwambo, F.M.; Fürst, C.; Nyarko, B.K.; Borgemeister, C.; Martius, C. Maize Production and Environmental Costs: Resource Evaluation and Strategic Land Use Planning for Food Security in Northern Ghana by Means of Coupled Emergy and Data Envelopment Analysis. Land Use Policy 2020, 95, 104490. [Google Scholar] [CrossRef]
  41. Liu, W.; Zhan, J.; Zhao, F.; Wang, P.; Li, Z.; Teng, Y. Changing Trends and Influencing Factors of Energy Productivity Growth: A Case Study in the Pearl River Delta Metropolitan Region. Technol. Forecast. Soc. Chang. 2018, 137, 1–9. [Google Scholar] [CrossRef]
  42. Liu, W.; Zhan, J.; Wang, C.; Li, S.; Zhang, F. Environmentally Sensitive Productivity Growth of Industrial Sectors in the Pearl River Delta. Resour. Conserv. Recycl. 2018, 139, 50–63. [Google Scholar] [CrossRef]
  43. Moutinho, V.; Madaleno, M.; Macedo, P. The Effect of Urban Air Pollutants in Germany: Eco-Efficiency Analysis Through Fractional Regression Models Applied After DEA and SFA Efficiency Predictions. Sustain. Cities Soc. 2020, 59, 102204. [Google Scholar] [CrossRef]
  44. Yongjun, L.; Jing, Q.; Lei, X.; Lingyan, H.; Yue, S.; Mengmeng, Z.; Ke, W.; Jing, Z.; Shan, H.; Lu, H. Assessing economic sustainability and ecological efficiency with genuine progress indicator: A case study of the Yangtze River Delta from 2000 to 2018. Environ. Sci. Pollut. Res. Int. 2022, 29, 46751–46766. [Google Scholar] [CrossRef]
  45. Merlin, G.; Boileau, H. Eco-Efficiency and Entropy Generation Evaluation Based on Emergy Analysis: Application to Two Small Biogas Plants. J. Clean. Prod. 2017, 143, 257–268. [Google Scholar] [CrossRef]
  46. Yang, B.; Wang, Z.; Zou, L.; Zou, L.; Zhang, H. Exploring the Eco-Efficiency of Cultivated Land Utilization and Its Influencing Factors in China's Yangtze River Economic Belt, 2001–2018. J. Environ. Manag. 2021, 294, 112939. [Google Scholar] [CrossRef]
  47. Liu, Y.; Zou, L.; Wang, Y. Spatial-Temporal Characteristics and Influencing Factors of Agricultural Eco-Efficiency in China in Recent 40 Years. Land Use Policy 2020, 97, 104794. [Google Scholar] [CrossRef]
  48. Wei, C.; Wen, Z.; Tao, W.; Xiaochun, W.; Jinhai, X. Spatial-Temporal Characteristics of Cultivated Land Use Eco-Efficiency Under Carbon Constraints and Its Relationship with Landscape Pattern Dynamics. Ecol. Indic. 2022, 141, 109140. [Google Scholar] [CrossRef]
  49. Ma, L.Y.; Zhang, R.H.; Pan, Z.C.; Wei, F. Analysis of the Evolution and Influencing Factors of Temporal and Spatial Pattern of Eco-Efficiency of Cultivated Land Use Among Provinces in China: Based on Panel Data from 2000 to 2019. China Land Sci. 2022, 36, 74–85. [Google Scholar]
  50. Xie, H.; Chen, Q.; Wang, W.; He, Y. Analyzing the Green Efficiency of Arable Land Use in China. Technol. Forecast. Soc. Chang. 2018, 133, 15–28. [Google Scholar] [CrossRef]
  51. Yumeng, W.; Jiaxu, L.; Xiangzhi, K. What Drives Land Abandonment in Core Grain-Producing Areas? Evidence from China. Int. J. Environ. Res. Public Health 2022, 19, 5090. [Google Scholar] [CrossRef]
  52. Zifeng, Y.; Liang, Z.; Dongqi, S.; Fengning, H. Impacts of Urban Expansion on the Loss and Fragmentation of Cropland in the Major Grain Production Areas of China. Land 2022, 11, 130. [Google Scholar] [CrossRef]
  53. Luo, X.; Ao, X.; Zhang, Z.; Wan, Q.; Liu, X. Spatiotemporal Variations of Cultivated Land Use Efficiency in the Yangtze River Economic Belt Based on Carbon Emission Constraints. J. Geogr. Sci. 2020, 30, 535–552. [Google Scholar] [CrossRef]
  54. Tone, K. A slacks-Based Measure of Efficiency in Data Envelopment Analysis. Eur. J. Oper. Res. 2001, 130, 498–509. [Google Scholar] [CrossRef]
  55. Tone, K. Data Envelopment Analysis as a Kaizen Tool: SBM Variations Revisited. Bull. Math. Sci. Appl. 2016, 16, 49. [Google Scholar] [CrossRef]
  56. Chen, M.; Chen, H. Spatiotemporal Coupling Measurement of Industrial Wastewater Discharge and Industrial Economy in China. Environ. Sci. Pollut. Res. 2021, 28, 46319–46333. [Google Scholar] [CrossRef]
  57. West, T.O.; Marland, G. A Synthesis of Carbon Sequestration, Carbon Emissions, and Net Carbon Flux in Agriculture: Comparing Tillage Practices in the United States. Agric. Ecosyst. Environ. 2002, 91, 217–232. [Google Scholar] [CrossRef]
  58. Li, B.; Zhang, J.B.; Li, H.P. Research on Spatial-Temporal Characteristics and Affecting Factors Decomposition of Agricultural Carbon Emission in China. China Popul. Resour. Environ. 2011, 21, 80–86. [Google Scholar] [CrossRef]
  59. Zhang, Z.; Xu, E.; Zhang, H. Complex Network and Redundancy Analysis of Spatial–Temporal Dynamic Changes and Driving Forces Behind Changes in Oases Within the Tarim Basin in Northwestern China. CATENA 2021, 201, 105216. [Google Scholar] [CrossRef]
  60. Fader, M.; Rulli, M.C.; Carr, J.; Dell’Angelo, J.; D’Odorico, P.; Gephart, J.A.; Kummu, M.; Magliocca, N.; Porkka, M.; Prell, C.; et al. Past and Present Biophysical Redundancy of Countries as a Buffer to Changes in Food Supply. Environ. Res. Lett. 2016, 11, 55008. [Google Scholar] [CrossRef]
  61. Yan, D.; Zheng, S.F. The Influence of Information Ability on Farmers’ Ecological Farming Adoption Behavior: Mediation Effect Based on Ecological Cognition and Adjustment Effect of Agricultural Income Share. China Land Sci. 2020, 34, 76–84. [Google Scholar]
  62. Tang, Y.; Lu, X.; Yi, J.; Wang, H.; Zhang, X.; Zheng, W. Evaluating the Spatial Spillover Effect of Farmland Use Transition on Grain Production—An Empirical Study in Hubei Province, China. Ecol. Indic. 2021, 125, 107478. [Google Scholar] [CrossRef]
  63. Xin, Y.; Yuejian, W.; Na, L.; Hailiang, X.; Zili, F. Assessment of Value Changes and Spatial Differences in Land Use Based on an Empirical Survey in the Manas River Basin. Land 2021, 10, 961. [Google Scholar] [CrossRef]
  64. Zhao, Y.; Jiang, Q.; Wang, Z. The System Evaluation of Grain Production Efficiency and Analysis of Driving Factors in Heilongjiang Province. Water 2019, 11, 1073. [Google Scholar] [CrossRef]
  65. He, G.; Zhang, Z.; Zhang, J.; Huang, X. Soil Organic Carbon Dynamics and Driving Factors in Typical Cultivated Land on the Karst Plateau. Int. J. Environ. Res. Public Health 2020, 17, 5697. [Google Scholar] [CrossRef] [PubMed]
  66. Won, K.G.; Yeon, L.J.; Saiful, I.B.M.; Suvendu, D.; Israr, K.M.; Joo, K.P. Investigating the Arable Land That Is the Main Contributor to Global Warming Between Paddy and Upland Vegetable Crops Under Excessive Nitrogen Fertilization. J. Clean. Prod. 2022, 346, 131197. [Google Scholar] [CrossRef]
Figure 1. Research area.
Sustainability 14 11417 g001
Figure 2. Changes of ECLU in Hubei Province and its regions from 2008 to 2020.
Sustainability 14 11417 g002
Figure 3. A local agglomeration evolution of ECLU in Hubei Province from 2008 to 2020.
Sustainability 14 11417 g003
Figure 4. Distribution of the redundancy rate of cultivated input factors in Hubei Province from 2008 to 2020.
Sustainability 14 11417 g004aSustainability 14 11417 g004b
Table 1. The index system of ECLU.
Variable TypeVariable NameUnitReferences
InputCrop sown area(CSA)103 hectaresKe et al. [12]
Agricultural employer(AE)104 peopleLu et al. [25]
Chemical fertilizer use(CFU)104 tFan et al. [10]
Agricultural machinery power(AMP)104 kW·hKuang et al. [28]
Desired outputTotal value of agricultural output104 YuanWen et al. [16]
Grain total output104 tMa et al. [49]
Undesired outputCarbon emission104 tLiu et al. [23]
Pollution emissions104 tWest et al. [57]
Table 2. Global Moran’s I value of ECLU in Hubei Province from 2008 to 2020.
YearMoran’s ISDZ-Valuep-Value
20080.1220.0751.7720.054
20120.3200.0754.4050.001
20160.3170.0754.4260.001
20200.2510.0773.4470.001
Table 3. Redundancy rate of cultivated input factors in Hubei Province from 2008 to 2020.
YearRegionCSA (%)AM (%)CFU (%)AMP (%)ECLU
2008Eastern19.3575.3177.8454.150.467
Central18.2185.0684.2364.220.506
Western21.1888.1786.7368.800.451
Overall21.2189.1786.9370.860.457
2012Eastern19.8873.3380.1265.410.383
Central18.7478.5083.5472.800.497
Western20.9780.1684.4573.920.424
Overall21.0482.1585.2575.670.408
2016Eastern16.3070.7177.4365.050.410
Central18.8875.3480.0169.550.490
Western19.3972.2678.8466.690.440
Overall18.3671.6477.7465.890.430
2020Eastern9.8061.6563.2162.450.495
Central12.2267.6270.0864.720.583
Western13.5565.2667.2765.210.539
Overall12.3063.6065.4564.010.521
Publisher’s Note: MDPI stays neutral with regard to jurisdictional claims in published maps and institutional affiliations.

