Article

Engaging Stakeholders for Designing a FAIR Energy Data Management Tool: The Horizon 2020 EnerMaps Project

Institute for Renewable Energy, European Academy of Bolzano (EURAC Research), Viale Druso 1, 39100 Bolzano, Italy
*
Author to whom correspondence should be addressed.
Sustainability 2022, 14(18), 11392; https://doi.org/10.3390/su141811392
Submission received: 29 August 2022 / Revised: 2 September 2022 / Accepted: 5 September 2022 / Published: 10 September 2022

Abstract

:
Energy transition deals with and starts from data and information, which are relevant for decision making and strategy implementation. Several stakeholders who deal with planning, energy management, and policy-making processes need findable, accessible, interoperable, and reusable (FAIR) data to solve professional issues. The Horizon 2020 (H2020) EnerMaps project contributes to providing FAIR data management. It aims to improve data availability, data quality, and data management for industry (especially renewable technology industry), energy planners, energy utilities, energy managers, energy consultants, public administration officers operating in the energy sector, policy decision makers, and social innovation experts. We apply a flow of methods to engage stakeholders for designing and operating a data management tool in the energy field—the EnerMaps Data Management Tool (EDMT). The methodologies applied include: stakeholder analysis, social network investigation, and semi-structured interviews to assemble user stories and needs. Far from being obvious, this type of analysis is capable of addressing the needs and challenges in the data sector, proposing an innovative tool. In this case, the main issues emerging are data quality (inclusive data normalization), the acquisition of datasets, and the deep understanding of data tools operation. In contrast, concerning the user needs inquiry, a number of topics emerge, such as the need to access datasets related to energy consumption and production, and several software-related needs, such as the possibility of normalizing and harmonizing the data.

1. Introduction

The Conference of the Parties 26 (COP26) brought together numerous countries and actors in the global context to discuss how to achieve climate neutrality or zero-emission systems by the mid-century. Strategies, actions, and funding were defined to accelerate the transition from coal to clean energy, to protect and restore nature for the benefit of the people and the climate, and to accelerate the transition to zero-emission vehicles. At the end of the conference, the scientific community and social environmental movements strongly emphasized the need for immediate and individual action, involving individuals changing their daily practices and regions defining concrete and immediate actions [1]. For individuals and regions to act immediately and concretely to ensure the achievement of climate and energy targets, there is an extensive need for access to findable, accessible, interoperable, and reusable (FAIR) data on which effective decisions on how to act can be based [2].
Individuals and regions can achieve climate neutrality through, e.g., actions that require technological, economic, and social innovations to increase energy efficiency and savings and renewable energy production [3]. FAIR data are essential to ensure effective decision making in the climate and energy sector for the interaction among technology, economy, and society [4].
When deciding how to act and make policies, stakeholders and citizens need to have access to information, data, and tools to enable the effectiveness of their decisions and actions. One of the supporting elements for making effective and efficient decisions for the climate and transition to low-carbon and sustainable future is the availability of clear, rigorous, and comparable data. However, data are currently often difficult to find, mixed in various repositories, and fragmented. Thus, further efforts are needed for improvement toward FAIR data and energy data sharing systems. There are a number of tools, datasets, and web platforms related to energy data. However, these resources are not always freely accessible, user friendly, or provide quality-controlled data. Stakeholders and citizens find it difficult to access and use existing energy data effectively, and the access itself creates new vulnerabilities and issues [5].
Data and the use of data are becoming increasingly pervasive in the contemporary society [6]. The enormous creation and availability of data are a key resource for the society and economies that can thus make relevant and effective choices and decisions [6,7]. However, the accessibility and openness of data have not been guaranteed so far, and we are often faced with the inaccessibility of datasets (e.g., because of the economic value of the data) [8,9] or the inability of the citizen or stakeholder to access understandable data. On the one hand, this can be used to promote energy transition and enhance stakeholder participation in the climate and energy transition. On the other hand, certain individual rights and collective values related to data use, such as privacy, fairness, security, inclusiveness, accountability, and democratic control, need to be ensured [6,7]. Citizens and stakeholders are both a resource for improving the use and management of energy data and an actor to whom the freedom and opportunities to make decisions are guaranteed. The accessibility, creation, and ability to use data are part of today’s society and provide a new and growing aspect of justice, namely data justice [7]. However, this is not always the case, and the ever-increasing amount of data is not available to citizens, stakeholders, or society [7]. There is a huge need to work on the interaction between data, societies, and economies [7] while decreasing profit-oriented data practices to ensure accessibility and usability for everybody [7] to achieve sustainable and just climate and energy goals [10,11]. For this reason, this paper provides an approach that aims to engage stakeholders to design, collect, and use datasets and tools to share FAIR energy data, which is missing in the literature so far. To our knowledge, the integration of content analysis from interviews that identify the main challenges and needs of lead and end users with the analysis of networks of relationships—where stakeholders have shared or contrasting interests and perspectives within the energy sector—is an innovation performed in the present work. Indeed, the European Green Deal states that all actions aimed at energy transition must “bring together a wide range of stakeholders including regions and citizens”, and data are fundamental for promoting effective and ad hoc decisions and actions. “Accessible and interoperable data are at the heart of data-driven innovation”, and data support evidenced-based decisions for energy transition [12].
Based on these considerations, the Horizon 2020 (H2020) EnerMaps project—Open Source Tools to Share, Compare, and Reuse Low-Carbon Energy Data—helps improve the accessibility of energy data and is developing a tool that collects and organizes existing datasets related to the energy sector (the EnerMaps Data Management Tool—EDMT [13]). The EDMT was designed based on the engagement of stakeholders and promotes the engagement of stakeholders and citizens in the collection, management, and use of FAIR data.
The EnerMaps project is a Horizon 2020 Coordination and Support Action (CSA) project that aims to improve data management for energy research. Currently, energy data are often hard to find, heavily fragmented, and distributed in various repositories. This reality complicates research tasks that necessitate the application of these data, which inevitably leads to financial and schedule setbacks, as well as an overall reduced efficiency in energy research. EnerMaps seeks to resolve these issues and support the energy research community by offering a quality-checked database of critical energy data that connects researchers and provides data using methods to make the data findable, accessible, interoperable, and re-usable (FAIR).
The primary output of the EnerMaps project is the EnerMaps Data Management Tool (EDMT). This tool provides a user-friendly graphical user interface (GUI) that enables users to easily navigate the included datasets and display them from their browser. The GUI itself includes a number of key features of the EDMT, including the ability for users to select data layers, zoom in on different parts of the map, and make selections for use in calculation modules, which perform various energy-related analyses. Finally, the EDMT also links with other tools of the EnerMaps project, including a dashboard of scientific publications related to the data used in the EDMT, Wiki pages describing various aspects of the EDMT, and a social network containing a community focused on the EDMT.
To develop an effective data management tool and, at the same time, promote the engagement of stakeholders in utilizing data for their professional challenges in the energy field, EnerMaps tested a method for involving stakeholders in the design and management of the tool. Coupling the relevance of FAIR energy data and the importance of making the transition a social issue, starting from engaging the stakeholders [14], this paper aims at defining a methodology, which is relevant and can be replicated in the case of creating effective community online tools for climate and energy transition. In order to avoid making the same mistake that has been made so far and that has led to a confusing world of energy data, this article proposes a methodology to engage relevant stakeholders in the design of an important tool that can support the energy transition in Europe. To the knowledge of the authors, it is the first time such a mix of methods has been applied in the energy sector. The methodology was tested in the EnerMaps project and elaborated a list of challenges and needs of the involved stakeholders to be considered in the development of the EDMT. This research collected information on the main challenges and needs of stakeholders and citizens in terms of energy data for transition that addresses the design and development of the EDMT to make it effective in supporting decisions for energy transition issues. Therefore, this work also reports the results of one case study concerning the following questions:
  • What are the existing energy-related datasets?
  • How is it possible to promote an effective interaction between these different datasets?
  • How can energy datasets be disseminated, so that all actors involved in energy transition can use them?
To answer these questions, this research aims to use stakeholder analysis for identifying the relevant stakeholders of the energy and data fields and understanding their needs and requirements to make the EnerMaps tool effective and attractive. Even if the stakeholder analysis methods are used in several fields [13,15,16,17] they are underused in the energy data field, where, usually, only the concept of stakeholders is introduced but not the stakeholder analysis approach [16,18,19]. Based on the activities carried out for the EnerMaps project [13,20] this article highlights the limitations and challenges in its implementation, provides insights into how this methodology can foster the involvement of those who use these data on a daily basis, and specifically, how this information can be collected to foster the design of the web platform for the presentation of FAIR data.
The paper is structured as follows. The first part describes the use of stakeholder analysis in the energy field. The second part explores the EnerMaps project and proposes the methodological approach used in the project for mapping the relevant stakeholders and analyzing their stories and needs concerning data in the energy field. Subsequently, the paper includes the results based on the application of the proposed methodology within the EnerMaps project and the main challenges and needs to be addressed in the development of the EDMT. The last part highlights the merits and limitations of this research. The conclusions state the relevance of this study for supporting a deeper climate and energy transition.

2. Stakeholder Analysis in Energy Field

Stakeholder analysis has become an increasingly efficient tool to manage, develop, and improve projects where different stakeholder categories are present [21,22]. In recent decades, it has been used to improve the performance of different fields, such as economic, political, and social ones [22]. Stakeholder analysis has been defined as a decision support tool [23] to improve decision making. Involving societal actors in decision-making processes can be beneficial from many points of view, e.g., facilitating the decision making or increasing the inclusion of citizens [24], e.g., in the design or implementation of a new renewable energy plant or the uptake of a new technology. This kind of action can increase the acceptance of the decisions [25] and the uptake of technological and other kinds of innovations [26]. There are a variety of studies that have used this methodology to investigate certain fields, such as business management [27,28,29,30], forest management [22,23], and even energy management [24,25]. There are different ways in which stakeholders can be included in the project. In particular, Wilcox [31] identifies five different levels: informative participation; consultative participation; deciding together; acting together; supporting local initiatives.
In the energy field, stakeholder engagement and analysis have their own peculiarities and applications. In a number of cases, stakeholders are considered in the initial phase of a project that involves the community. Stakeholder analysis in the research by Pelyukh et al. [28] allows researchers to understand the advantages and disadvantages involved in the participatory approach of different types of stakeholders. Fu et al. [27] give relevance to social relationships and networks for facilitating communication in stakeholder engagement processes and therefore improving decision making in energy management and increasing transparency. In the case study of Dutta and Das [32], which considers the adoption of rooftop solar panels, stakeholder engagement has the simple purpose of providing information on the perception of those directly or indirectly involved in the use and application of new technologies. Stakeholder analysis was also used in Martin and Rice’s [33] contribution on a renewable energy project to improve project design and implementation. The use of stakeholder analysis also allows researchers to collect information on key stakeholders, project users, and project risks. In the analysis by Elgin and Weible [34], stakeholder analysis is conducted to understand the strategies used by political actors to transform their ideas and beliefs into policy projects within the climate and energy subsystem. The involvement of stakeholders allows for the collection of information on different climate solutions of interest to politicians, such as carbon taxation or renewable energy policies. In the approach used by White et al. [30] on the relevance of food–energy–water contexts and their nexus, stakeholder analysis aims to engage a diverse set of stakeholders in a collaborative environment. Through this methodology, stakeholders are encouraged to work together to share expertise and contribute to a constructive exchange of ideas. This short review is not intended to be exhaustive of all the uses of stakeholder analysis in the energy field but only to summarize a number of studies that have used this methodology to achieve the objectives of various projects.
In the studies cited above, stakeholder engagement based on a stakeholder analysis is linked to the five levels of participation: informational participation; consultative participation; deciding together; acting together; and supporting local initiatives. In our research, we consider an additional level of participation, where stakeholders are directly involved in the creation of the data platform through stakeholder analysis. In this way, adding to the general use of stakeholder analysis, we use stakeholder engagement and analysis [23] to improve the planning and management of a decision support tool in the energy field, called the EDMT. Using the stakeholder engagement and analysis described in this paper, stakeholders play a key role in the creation of the web platform or the EDMT, thanks to the collection of user stories and needs, and the understanding of who the real users of these data are.

3. Materials and Methods
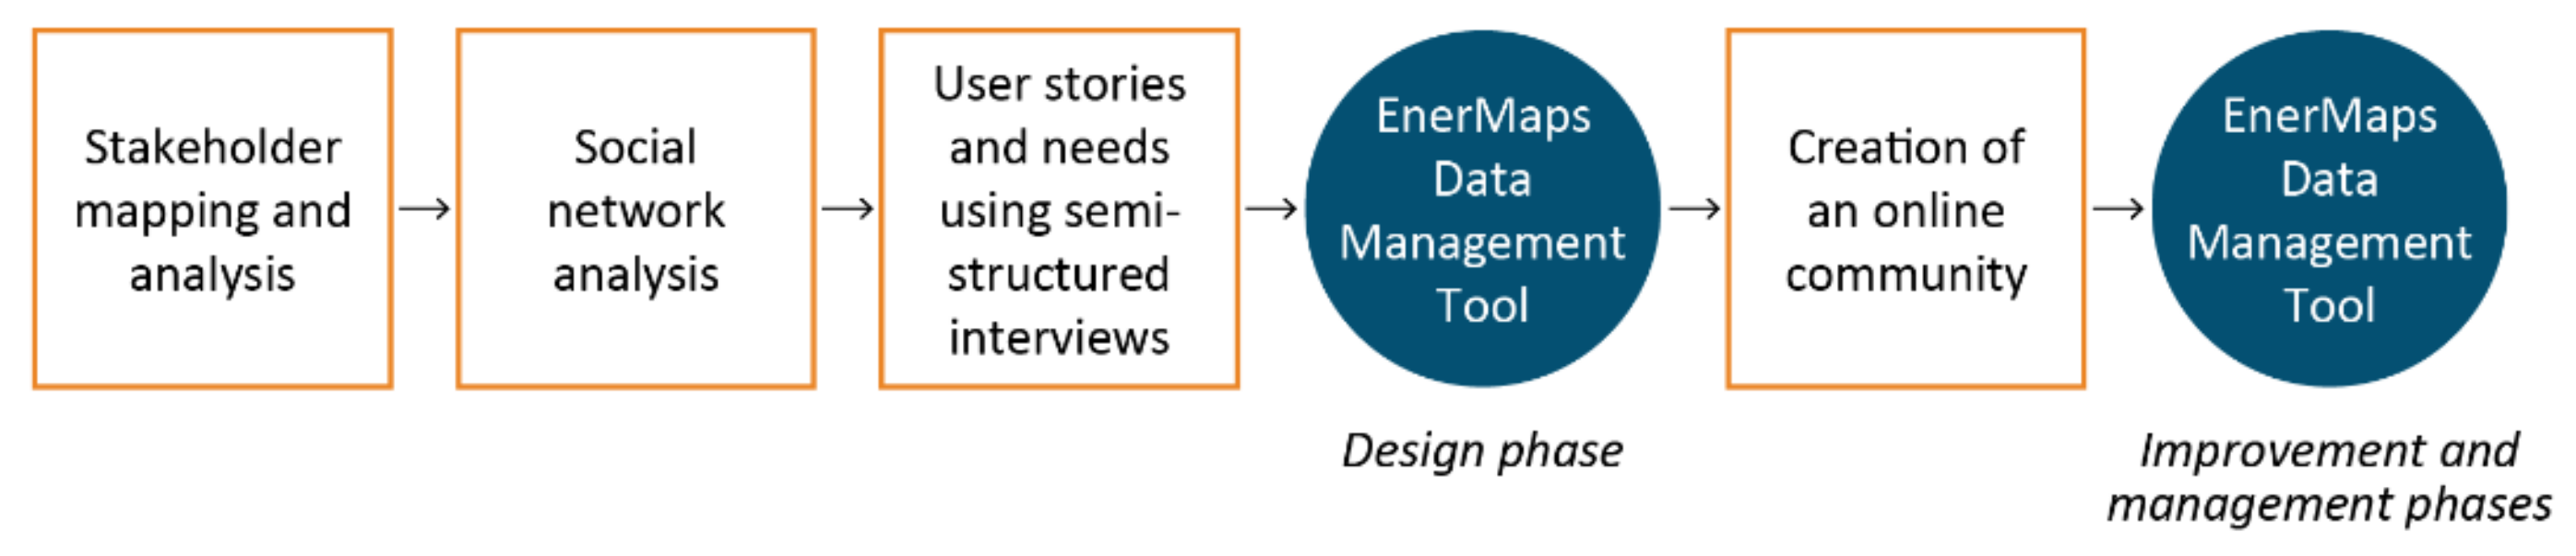
3.1. Methodology

Given that climate and energy transition is a social, economic, and technological issue, the initiatives and decisions take place through accessibility to FAIR data, which support the opportunity to make sustainable and just decisions for energy transition. The EnerMaps project is developing a platform that is able to guarantee the FAIR principles for data management [33,34,35]. However, in order to counter the main challenges that currently exist in the world of energy data, our choice is to involve stakeholders operating in the energy field to identify the main challenges and needs. To achieve this, this paper synthesizes a mixed-methods approach based on the use of quantitative data (stakeholder analysis and social network analysis), with a qualitative investigation for a deeper understanding of the user stories and needs, to better interpret the relationship between the main social and economic actors and the data sector and to better involve stakeholders in the common design and sharing of data and data tools.
Indeed, once stakeholders and citizens are involved in the design of the FAIR energy data platform, it is easier to develop an effective online community for improving and disseminating a relevant platform for strengthening the transition in Europe (Figure 1).

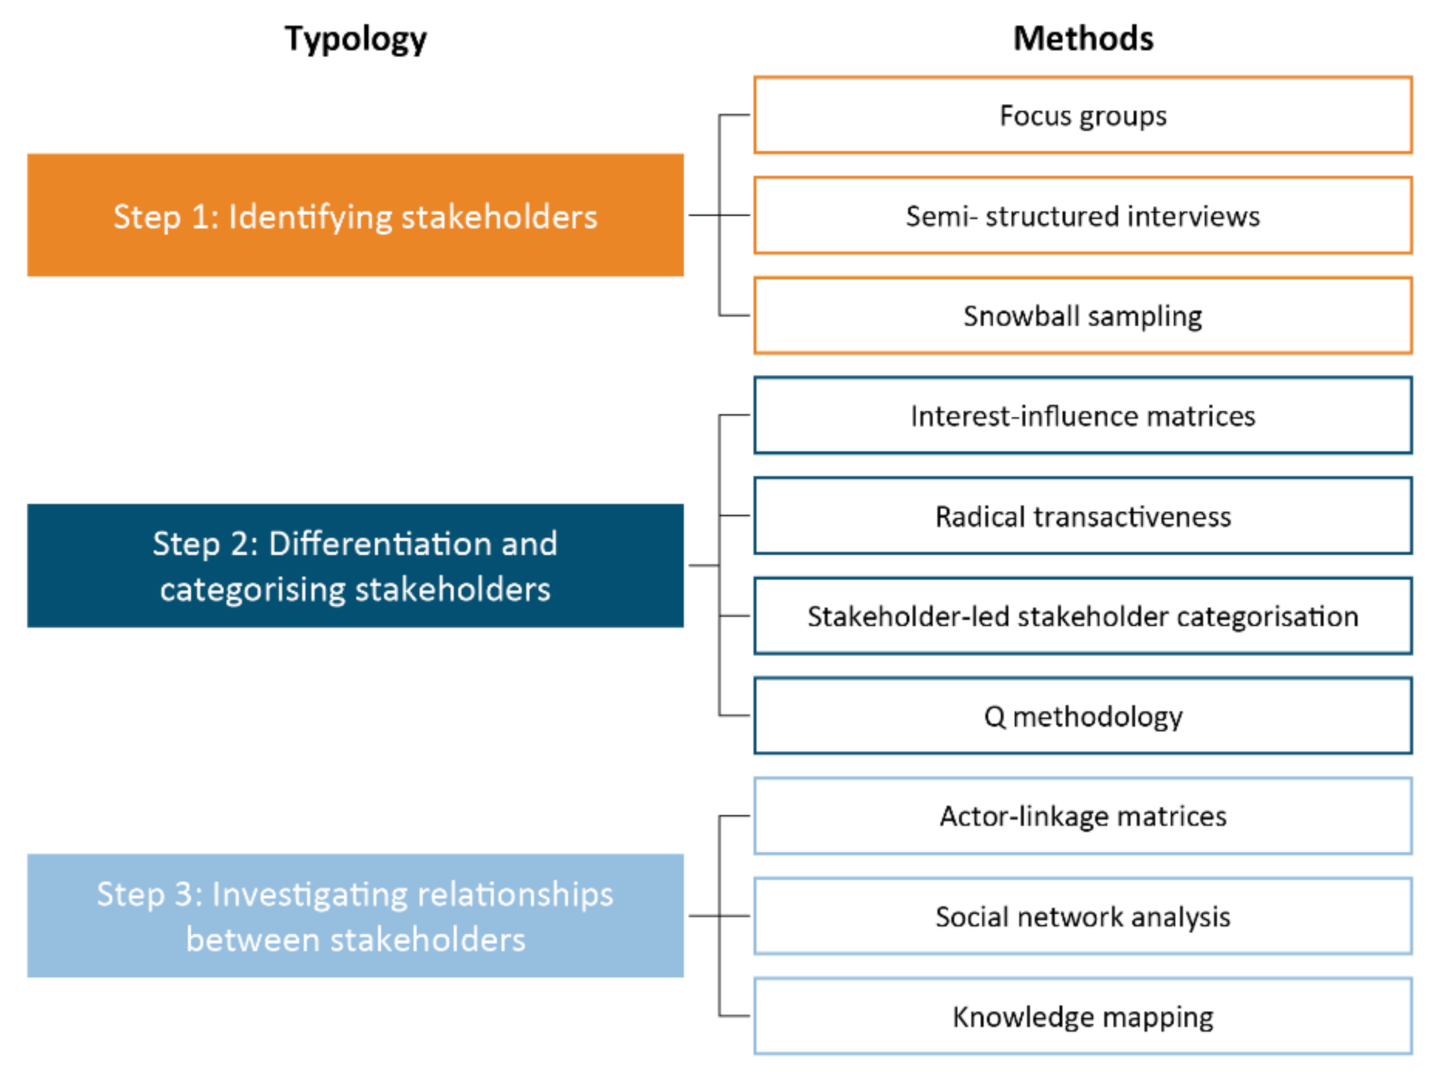
3.2. Stakeholder Analysis in Three Steps

The first activity to be carried out in this context is to identify the relevant actors to define the design aspects of the FAIR data and the related web platform. There are several methods usually used for identifying and analyzing stakeholders based on their characteristics and interest in participating in the design of the web platform for presenting FAIR data [36].
The technique used to select the relevant stakeholders is stakeholder analysis (SA). SA is used in different methodological fields, such as economics and sociology, and, since each field uses a different approach to SA, identifying a common method is challenging [37]. For this reason, several contributions try to make this technique more unambiguous through the identification of a shared and operationalized methodology [38], such as Reed et al. [36]. Reed et al. [39] define SA as a process that serves to define the social and natural aspects of a phenomenon, to identify groups or people who may be affected or influenced by this decision, and to allow these people to participate in the decision-making process [30,33]. Stakeholder analysis is a research method used to define who has a certain level of influence in each context [16]. The fact that it is a standardized, operationalized, and easy-to-use method makes the SA proposed by Reed a useful method for gathering all relevant perspectives that can be useful in designing the EDMT and the web platform.
Stakeholder analysis consists of three steps: the identification of stakeholders, the differentiation and categorization of stakeholders, and the investigation of the relationships between stakeholders. There are different techniques that can be used for each step, as reported in Figure 2.

3.2.1. The Identification of Stakeholders

Stakeholder identification consists of identifying all the actors that are interested in or affected by the object of the study, namely the planning, management, and future use of the EDMT. It is a process in which additional stakeholders are included as the analysis proceeds, using focus groups, semi-structured interviews, and snowball sampling, separately or using more than one tool at the same time. Identifying stakeholders can be especially easy when the focus of the project is clear and well defined [17,25].
Before using a technique to identify the stakeholders who would later be interviewed, a brainstorming session was carried out with ten researchers and partners of the EnerMaps project, leading to the identification of a number of categories for lead users and end users. Lead users include advanced users (e.g., programmers, dataset providers), while end users are persons or institutions who will ultimately use or intend to use the EDMT.
After identifying the categories, the first list of stakeholders was prepared, and snowball sampling was applied. A table was created and forwarded to 23 contacts belonging to the EnerMaps consortium, who were asked to identify one or more people to involve in the project, referring to each of the above categories of lead and end users. Snowball sampling was then used to identify further stakeholders to ensure the identification of a wider range of perspectives. Snowball sampling consists of asking project partners to identify the stakeholders or the actors who are interested or can affect the design, development, and use of the EDMT. The stakeholder identification method includes a clear provision for privacy issues, in the sense that the indicated stakeholders agree to be contacted for being interviewed or consulted within the project. Stakeholder identification was useful to be able to select the stakeholders to be interviewed.

3.2.2. The Differentiation and Categorization of Stakeholders

The second step of stakeholder analysis consists of differentiating and categorizing the listed stakeholders in order to investigate the stakeholders’ capacity to affect the development of the EDMT and to assess the stakeholders’ interest in using the EDMT in the future [39,40]. There are two different approaches for achieving that. The first approach, namely “analytical categorization”, consists of a top-down classification of stakeholders and uses interest–influence matrices, while the second approach, namely “reconstructive categorization”, includes a bottom-up categorization, which involves a classification guided by the stakeholders themselves [13,17].
In the EnerMaps project, the bottom-up categorization was used to understand whether and which categories of lead and end users are more important to involve in the creation of the EDMT and the platform. In the EnerMaps project, the stakeholder analysis is based on a number of characteristics of the stakeholders, such as the country of origin or stay, gender, and the disciplinary expertise.

3.2.3. The Differentiation and Categorization of Stakeholders

Social network analysis (SNA) was used to investigate the relationship among the stakeholders in this study. The SNA is defined as an approach that, referring to techniques related to the mathematical theory of graphs and using the algebra of matrices, analyzes the relationships among actors (e.g., institutions, individuals) who are linked together through socially significant relationships. The SNA uses both qualitative and quantitative methods [13,35] and defines and analyzes the relationships that organizations or individuals (stakeholders in general) have with each other [29]. The SNA is based on a set of two postulates related to the social field. First, actor behavior is analyzed with reference to the structural and social constraints on action and not on the basis of the freedom to choose among several possible alternatives [41]. This means that the actor is not strictly rational but that the actor is led to act in a certain way on the basis of relational and social constraints. Second, social phenomena, such as energy transition, are considered in a context of relationships between different social actors rather than on the basis of the characteristics of individuals [41]. Therefore, individuals act based on their relationships and not on the basis of the individual characteristics. Based on these two postulates—which, of course, simplify the reality—SNA aims at integrating the results of classical statistics into a relational framework, helping us to investigate what the relationships are between the identified stakeholders and how this can affect the planning, management, and use of the EDMT. For example, we focused on the exchange of information among the identified stakeholders using degree centrality.
Degree centrality is defined as the number of actors to which each individual is directly linked, which indicates the ability to communicate directly with others [42]. We focused on the exchange of information within the network and how each person is connected or disconnected from the existing relationships. Importantly, only individual stakeholders were considered in the analysis. The information useful to assess the degree of centrality was collected through the same table used for identifying the stakeholders. In this research, the strengths of the ties within the network were not considered because, since stakeholders are professionally connected, their relationship tends to be driven by weak ties, where communication is generally work related, and emotional intensity is low.
Stakeholder analysis and the SNA were used to select the stakeholders to be interviewed to ensure a wide range of perspectives on energy data issues.

3.3. Semi-Structured Interviews

Based on the characteristics of the stakeholders and the professional relationships among them, 10 stakeholders were selected to be interviewed in depth about the needs related to FAIR data and the EDMT. The methodology that was used was the semi-structured interview, which consists of a qualitative methodology based on open-ended questions [42,43]. The interview track—composed of a general introduction to the EnerMaps project and a list of open-ended questions—was designed based on the guidelines related to expert interviews [37,40]. This kind of interview has a flexible track divided into thematic guidelines rather than a rigid list of questions, and the interviewee and interviewer have the possibility to decide together how to address the dialog. The second relevant point relates to the wording of questions, which concerns a supra-personal level of knowledge and relates to the institution rather than to the interviewee, with a focus on the job environment. These aspects of the interview address the understanding of, for example, the official and institutionalized reality of the industry or organization, the collectively shared experiences, the incorporated knowledge, rules, routines, and informal norms. All this information is relevant to understand how the EDMT can be taken up and used in the future.
Given the objective of this exploratory research to support the design of the EDMT, the interviews were focused on two main aspects: user stories and user needs. The user stories consist of narratives about the work process that engage stakeholders in using energy data, while the user needs consist of specific requirements that can be transformed into functionalities of the EDMT.
The interviews were recorded to ensure a higher objectivity of the analysis. The recording of the interviews was carried out according to the General Data Protection Regulation [44,45] and respecting the intellectual property rights (IPRs) and transcribed in order to make them anonymous and respect all the privacy rights of the interviewed stakeholders. The transcribed texts of the interviews were analyzed according to the content analysis method in order to define a list of user stories and needs and consequently transform them into functionalities or recommendations for the design of the EDMT and creation of an online community.

4. Results and Discussion

The proposed methodology consists of defining the stakeholders to be engaged in the development of the EDMT, i.e., the collection of user stories and needs for the design of the EDMT. Thanks to the semi-structured interviews (please find the questionnaire in Annex A; the names and surnames of the interviewees were not disclosed for privacy reasons) with the stakeholders, the design of the EDMT was addressed. In this section, the application of the methodology is presented to show its contribution to the design of relevant online tools for deepening the climate and energy transition.

4.1. Stakeholders: Identification, Categorization, and Social Network Analysis

Based on the brainstorming session, the following types of lead users were identified:
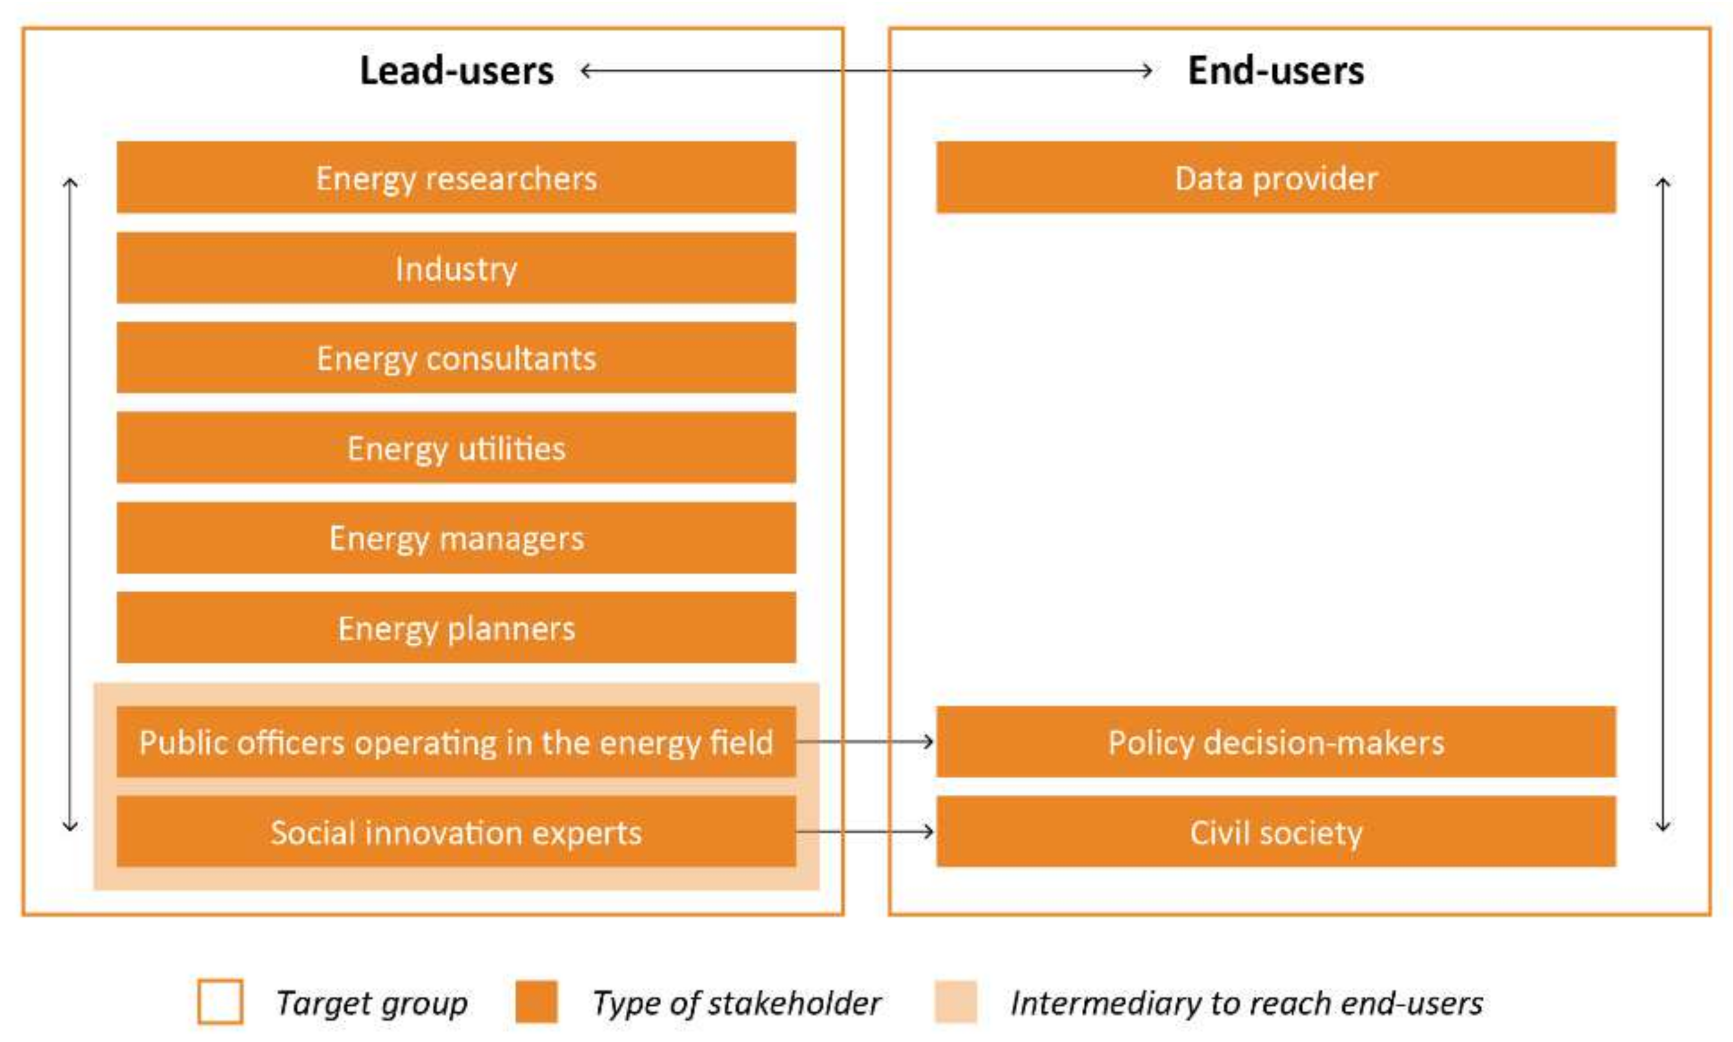
  • Energy researchers (staff in universities and non-university research organizations working in the field of energy) will be one of the main beneficiaries of the EDMT because of the elaboration of more effective tools to share energy-related data and the possibility of easy access to quality-controlled energy data.
  • Industry (especially renewable technology industry), energy utilities, energy managers, and energy planners will have free and easy access to datasets and related insights that they selected as crucial for the development of their activities.
  • Energy consultants have large data needs, which evolve very rapidly, since the subject of consulting projects varies. It is central for them to access a large range of open data, which have been checked for their quality, as it saves precious time on collecting respective data/information. For them, the EDMT will be a common gateway to find and access energy data, as well as understand related insights.
  • Public administrations (officers of public administrations operating within the energy sector). Reliable energy data are central to the development of a coherent energy policy. Indeed, public authorities have a strong need for energy data to develop and implement efficient policies and instruments, which support the energy transition. Hence, public administration officers were identified as lead users and will benefit from the availability of a European-wide curated database of energy data and related insights.
Moreover, the following end users of the project were identified during the brainstorming session:
  • Civil society: non-professionals, i.e., citizens interested in retrieving valuable data and information for energy interventions on their property (e.g., thermal insulation of owned households) or concerning communities they belong to (e.g., creation of an energy community).
  • Data providers: for data providers, the EDMT is an opportunity to promote the use of the data they share. Data usage is central to data providers, and the tools to increase it are necessary.
  • Energy research communities (data providers), which need to disseminate the data created during the implementation of their scientific projects.
  • Policymakers will profit from the EDMT indirectly. Officers of public administration working in the energy field will support policymakers in gaining a better understanding of the EDMT and its functionalities, providing ad hoc insights, as well as facilitating the translation into policies.
Figure 3 shows the interaction among the lead users and end users, as discussed in the brainstorming session.
As seen in Figure 3, there are interactions among all the listed lead and end users. Specifically, the graph shows the role of public officers operating in the energy field and social innovation experts in amplifying the impacts of the H2020 EnerMaps project by transferring the knowledge created by the EDMT to policy decision makers and civil society as well.
We contacted 23 persons among the EnerMaps project partners (Centre de Recherche—CREM, Fondation de l’institut de Recherche—IDIAP, Accademia Europea di Bolzano—EURAC, Zentrum für Energiewirtschaft und Umwelt—e-think, Technische Universität Wien—TUW, Revolve Water, and OpenAire Make) to create a list of stakeholders. Eight of the contacted persons returned a completed file, which included four men and four women from six different countries. This led to 57 social network nodes and a maximum registered relationship of 228. A summary of the general data can be found in Table 1.
The criteria used to identify and categorize the stakeholders are: (a.) the relevance of the institution in the field of energy-related data collection; (b.) the interest in being involved in the planning of the EDMT; (c.) the potential future use (in terms of timing) of the EDMT. The table for the stakeholder analysis includes the indication to compile “a list of people and/or organizations who could be users of the EDMT or who have wide knowledge and competences for addressing an effective development of the EDMT” and to indicate the importance of involving each indicated stakeholder in the EDMT design, in a range from 1 to 10, where 1 is the lowest value, and 10 is the highest value.
In addition, respondents were asked to indicate whether they were partners in the project and the geographic location of their organization. This information was useful to understand who was included in our SA at a spatial level, so as to avoid the exclusion of a number of geographically marginal locations.
The project partners identified 49 experts (Table 2) among the lead and end users. The following table represents the differentiation and categorization of stakeholders indicated by the project partners.
The categorization and differentiation of stakeholders through the bottom-up technique makes it possible to understand which target groups are considered most when designing an energy-related platform or management tool. Looking at Table 2, it is interesting to note that the categories previously identified as energy researchers and policymakers have the highest values (22.44% and 12.25%, respectively). This indicates that these two categories are considered very relevant for the EDMT partners and that they may have a higher influence in the design of the tool. Through this categorization, it was possible to know how many stakeholders were important in each category and to use this information to manage the number of interviews. However, if we had continued snowball sampling, we would now have a wider list of stakeholders. This highlights that there are stakeholders who could be further identified and further user stories and needs, which could be collected. In any case, we analyzed a core network of stakeholders who addressed the EDMT design.
The graph of the SNA consists of 57 nodes concerning the actors in the community platform. The type of relationship is a professional tie. The number of total degree is 228, and the ties are 115 (Figure 4). The confounders in this research are the expertise energy data and energy data platforms that have a professional relationship with a partner involved in the EnerMaps project. Using the data at our disposal collected through the identification of stakeholders, a descriptive analysis of the social network was carried out using the RStudio Team [46]. The findings of the SNA are relevant to identify the best communication channels that are used to design the EDMT software. Additionally, the results of the SNA could be very important at this stage of the project, as they could allow learning more about the existing relationships and improving the relationships between the different stakeholders for ensuring a wide uptake and an effective use of the EDMT and the launch of the online community—the EnerMaps community.
Interestingly, B0 and C0 only indicated people who work in the same country. As can be seen by the color, B0 and C0 work in the same location (Table 3). One explanation could be that the bonds within the work environment that start out as precise (“boss of”; “colleague of”) then tend to develop differently, creating similarities between colleagues in the work environment. Individuals who are often in close contact may have developed strong ties of friendship, which even leads them to share the same ideas about certain viewpoints—in this specific case, about whom it is important to involve in creating the platform. These characteristics of the ties can develop a kind of common vision on a number of work aspects. Similarly, the relationships we establish with people in specific cases, called the “relational event”, are related to the achievement of a specific goal. In this case, as can be seen in Figure 4, C0 and B0 indicated the same people, which indicates that the relationship with the indicated people could be related to a specific event, such as a previous job that involved exactly the same people indicated in this case. With the information we have, it is not possible to know that specific information about the relation, but it does show us that there is a foundation enabling the creation of a good network between the different parties that could facilitate the creation and implementation of the platform. Unlike B0 and C0, F0 and G0 indicated only people working on continents other than their own. It is not easy to understand why they only indicated actors from other states, but it is very useful because it allows us to understand that there is an exchange of information in the energy field between different continents, therefore, in realities that present a different legislation in the energy field, a different background, a different knowledge that could enrich our research. This relationship allows us researchers to be able to gather information and points of view that arise and develop in very different realities.
Figure 4 shows that within the stakeholder categories, there are distinct relationships. It is important to note the marginal role of a number of stakeholders, such as F0, compared to others who have a much higher number of relationships. In contrast, other stakeholders indicated many more ties, ranging from 2 to 26 ties to other stakeholders. This information allows us to understand that, in the context of our research, there are many links between our stakeholders, which could facilitate the exchange of information and thus more help in the implementation of the platform. In particular, it emerges that D0 is the stakeholder with the highest outdegree value (outdegree = 26), which indicates that this stakeholder has a good disposition toward others and a high degree of belonging to the group [47]. However, this aspect could be negative when this person is not a good leader because she/he would have to manage the relationship with the other actors, which is not always easy. Moreover, when the type of communication is not equally distributed, the satisfaction of various actors that are actively participating in the project decreases because the information and the roles are not distributed equally. One of the limitations that is important to emphasize is privacy (see F0 indicating only a relationship), which, in a number of cases, did not allow us to indicate the contact of a person considered important.
In summary, the stakeholders indicated several people who were important to involve in this project. In a number of cases, the referenced persons are the same, and there are actors who have more central roles than others. In fact, the relationships are not evenly distributed, but there are actors who have very different roles within a relationship.

4.2. User Stories and Needs

Starting from the list of experts that resulted from the SA, we highlighted ten relevant stakeholders to interview, eight of whom were interviewed (Ten stakeholders were chosen to compile each category highlighted during the stakeholder analysis; two out of ten stakeholders were not available to be interviewed. Other stakeholders from our list who matched the criteria for selection were contacted without success). The criteria used to choose these experts were:
  • Geographic distribution: six different European nationalities (Germany, Switzerland, Bulgaria, France, Italy, Belgium).
  • Gender inclusiveness: 50% women.
  • Interdisciplinary expertise: lead and end users.
These criteria were considered valid because, at the base of these features, there is a lot of transversal information to consider, such as the different cultural background that characterizes each geographical area, and therefore, the different use of the instrument by people from different locations. We chose to select experienced interviewees to avoid the risk of excluding part of the society that might be more difficult to reach. Ultimately, having different points of view can bring important information, which is why the third parameter considers interdisciplinary expertise. However, it should be noted that out of an already low interview pool of 10 individuals, only 8 of those individuals were interviewed. Despite the diversity of the interviewees, the low number of total interviews undoubtedly hinders the validity of the results.

4.2.1. User Stories

This section considers the narratives of the experts expressed during the interviews concerning the main and common problems in data management and the experiences of the experts in using software that aggregate and process data (Figure 5). These narratives are relevant to understand the usual problems and challenges to be avoided while designing the EDMT.
A number of the most relevant problems are the availability, acquisition, and access of datasets in a safe and secure manner, namely data handling. The sources of this problem are multiple and concern, e.g., legal regulation of databases, market reasons, the costs of acquisition, and the data quality/organization.
In most of the performed interviews, the first reported problem regarding data handling was linked to the acquisition of datasets. This process is particularly delicate, and problems may arise from a wide variety of sources. One of the foremost problems is the legal regulation of databases due to the attractiveness of well-organized and structured data and datasets for copyright, which partially closes the accessibility to datasets or links the data access to licenses. Furthermore, the restrictions on how to use data due to the Database Directive [48] cause “endless problems” for individuals (e.g., individual researcher, planner, designer) usually working with an open source or open science. The problems related to obtaining a license for accessing and using a dataset are not valid for institutions, such as research centers or public authorities. A second problem may arise due to market reasons.
Problems linked to legal aspects are accompanied by those due to market reasons. Data are the basis for several market enterprises, such as energy utilities, and the market growth of these companies is based on data. A number of companies may be challenged by sharing their sensitive data for reasons of competition with other companies. This makes it difficult for researchers, local authorities, and other actors to access important data for their own activities. Sometimes, data can be accessed with substantial fundings, but this creates inequalities in access depending on the funds available to an institution. However, the access to data is not the only problem.
The problems regarding data acquisition are not limited to simply obtaining the data but may also involve how the data are received. Data can be organized and sent in a variety of ways. A number of respondents believe that one of the best ways to share data is to use application programing interfaces (APIs) or other systems where one can directly ask the system for what one needs. However, this is not always the case. Certainly, an API-based system would increase interoperability, which is another shared problem. An API-based system would also make it possible to harmonize the databases collected by the EDMT in an efficient way. The EnerMaps project also focuses on the quality of the data, which was another issue encountered by the interviewees.
Another problem faced by many of the experts we interviewed was the quality of the data. Datasets often do not present a sufficient level of detail for research purposes. The problem may be related to data segregation, not providing a sufficiently precise detail of the information, e.g., creating clusters of information with similar features. The second data quality issue is related to data granularity, which refers to the size into which data fields are sub-divided. This was indicated nearly twice for each interviewee who mentioned it. The quality of the data is also based on normalization, which is usually a challenge. Interviewees who indicated data normalization mentioned it about one time each.
The normalization of data occurs when the handling data are not always based on the same format, depending on who is providing the data. When a problem of normalization goes along with problems of low data transparency, the challenge becomes more serious. For example, when the measurement units or the definitions used to create the data are unclear or absent, it become impossible to merge different datasets without mistakes, leading to mistakes in data interpretation and analysis. In order to avoid misinterpretation of the data and results of data analysis, the representation of results is very important because data that were not normalized cannot always be compared with other data when they have differing formats or units of measure.
The last reported problem in data handling was related to representation of the data. Energetic technical issues are particularly difficult to understand for people without a specific expertise. The results of analysis or raw data are difficult to be understood by public administrations or other stakeholders; therefore, it is important to ensure good resources to design the communication and representation of the data and results. Communicating the results to a wide audience (not just scientists) is not a skill that all people and all researchers have. The necessary resources and skills for communication and graphic design must be ensured, as well as the competences to transform study results into action guidelines or recommendations.
Most of the interviewed experts stated that they already have experience with software based on the elaboration and aggregation of several datasets. A number of experts process their data using internal software owned by the company/institution where they work. This software is usually centered on merging different datasets, performing calculations or energy modeling, and creating graphs or other representation of the data. The remaining experts stated that they perform these tasks using general-purpose programing languages, in particular Perl [49] or Python [50], or an open-source software. In particular, the useful software the experts indicated were EnerCoach [51], a free Swiss software created for energy planning on the local level, and SHARES [52], a software created by Eurostat for the harmonized calculation of shares of energy coming from renewable sources.
Regarding previous experience with software, one of the experts mentioned the toolbox of EnerMaps preceding the H2020 HotMaps project—the HotMaps Toolbox. This software is an open-source tool for mapping and planning on a European scale in the field of heating and cooling. This narration is particularly important in our research because the HotMaps Toolbox provides an approximation of the idea of what EnerMaps will become upon its release. The review of the HotMaps Toolbox provided an opportunity to improve the tool and the usability of the tool through the development of the EDMT, especially by simplifying the way it is used by stakeholders, working on making the stakeholders autonomous users who do not need support from the EDMT developers, and making operations smoother.

4.2.2. User Needs

We analyzed the needs expressed by the experts during the narration of their work procedures and their interaction with quantitative data. In particular, we focused on two groups of elements: the dataset-related needs and the software-related needs of the experts. During the interviews, the experts of the sample were asked to address two traits of the dataset they use in their occupation: the topic of the data and the technical features.
With regard to the data topics, several macro-areas were mentioned by more than one expert, such as energy production and consumption data (including decentralized ones), socio-economic, and meteorological data (Table 4).
Data quality is a challenge. Data quality issues can arise due to the originality of the data usually collected by smart equipment, such as energy meters. High-quality data do not include statistical estimation, for example. The validation of the data is also relevant in defining the quality of data, which guarantees the correctness of data and the absence of gaps in the dataset. Data quality is also given by their granularity, segregation, and transparency, which can also be ensured by a clear explanation of the data, their characteristics, and how they were collected. Lastly, especially regarding weather data, it is important for the expert that the datasets cover a sizeable span of time in the past in order to spot trends in the data. Indeed, researchers and other stakeholders need historical datasets, e.g., for making provisions. The necessity to harmonize the measurement units and methods of production of different datasets should be essential for this kind of software. Without it, any form of comparative research would be impossible. This topic is linked to another need expressed by the experts: the importance of data semantics.
“When one person calls something a “coal power plant”, someone else has to use the same concept when collecting their data or presenting it. […] So, we have a definition of “coal power plant” and what “coal” means. Does it include lignite? Does not include lignite? […]”.
(interview excerpt)
Any software based on complex operations of datasets should have a glossary of all the common terms employed and an easily accessible wiki, which can be used to answer the doubts of the analyst.
Finally, the last feature the experts mentioned as important for a software is the effort by the developers to create and support a community of users. A community of users becomes very important for improving, correcting, solving common problems, and pointing out mistakes of a web tool, such as the EDMT, and it is a good incentive for taking up a new tool. An active community is usually related to a high-quality software, since the users debate on the related forums regarding new ways to overcome difficulties and may develop interesting mods, which can be included in the original software, adding new functionalities.
In conclusion, the user stories and needs collected in the interviews with experts revealed recommendations for the design of the EDMT.

5. Content Analysis and Definition of Recommendations for the Design of the EDMT

The current article considers how stakeholder engagement and semi-structured interviews can be important in the creation phase of a new energy platform. It aims to increase the understanding of the different uses and needs of stakeholders, with the aim of highlighting the current problems associated with the use of tools such as the EDMT. Based on the findings, a number of recommendations are proposed:
-
The SA is an important methodology to easily and structurally identify the people and institutions who are interested in the future use of a new tool or platform and who have the knowledge to improve the design of a new tool.
-
The identification and the categorization of stakeholders support the understanding of which categories of actors are more relevant to be engaged in a tool or platform design, giving proper weight to each category that interacts with this type of tool in a professional setting.
-
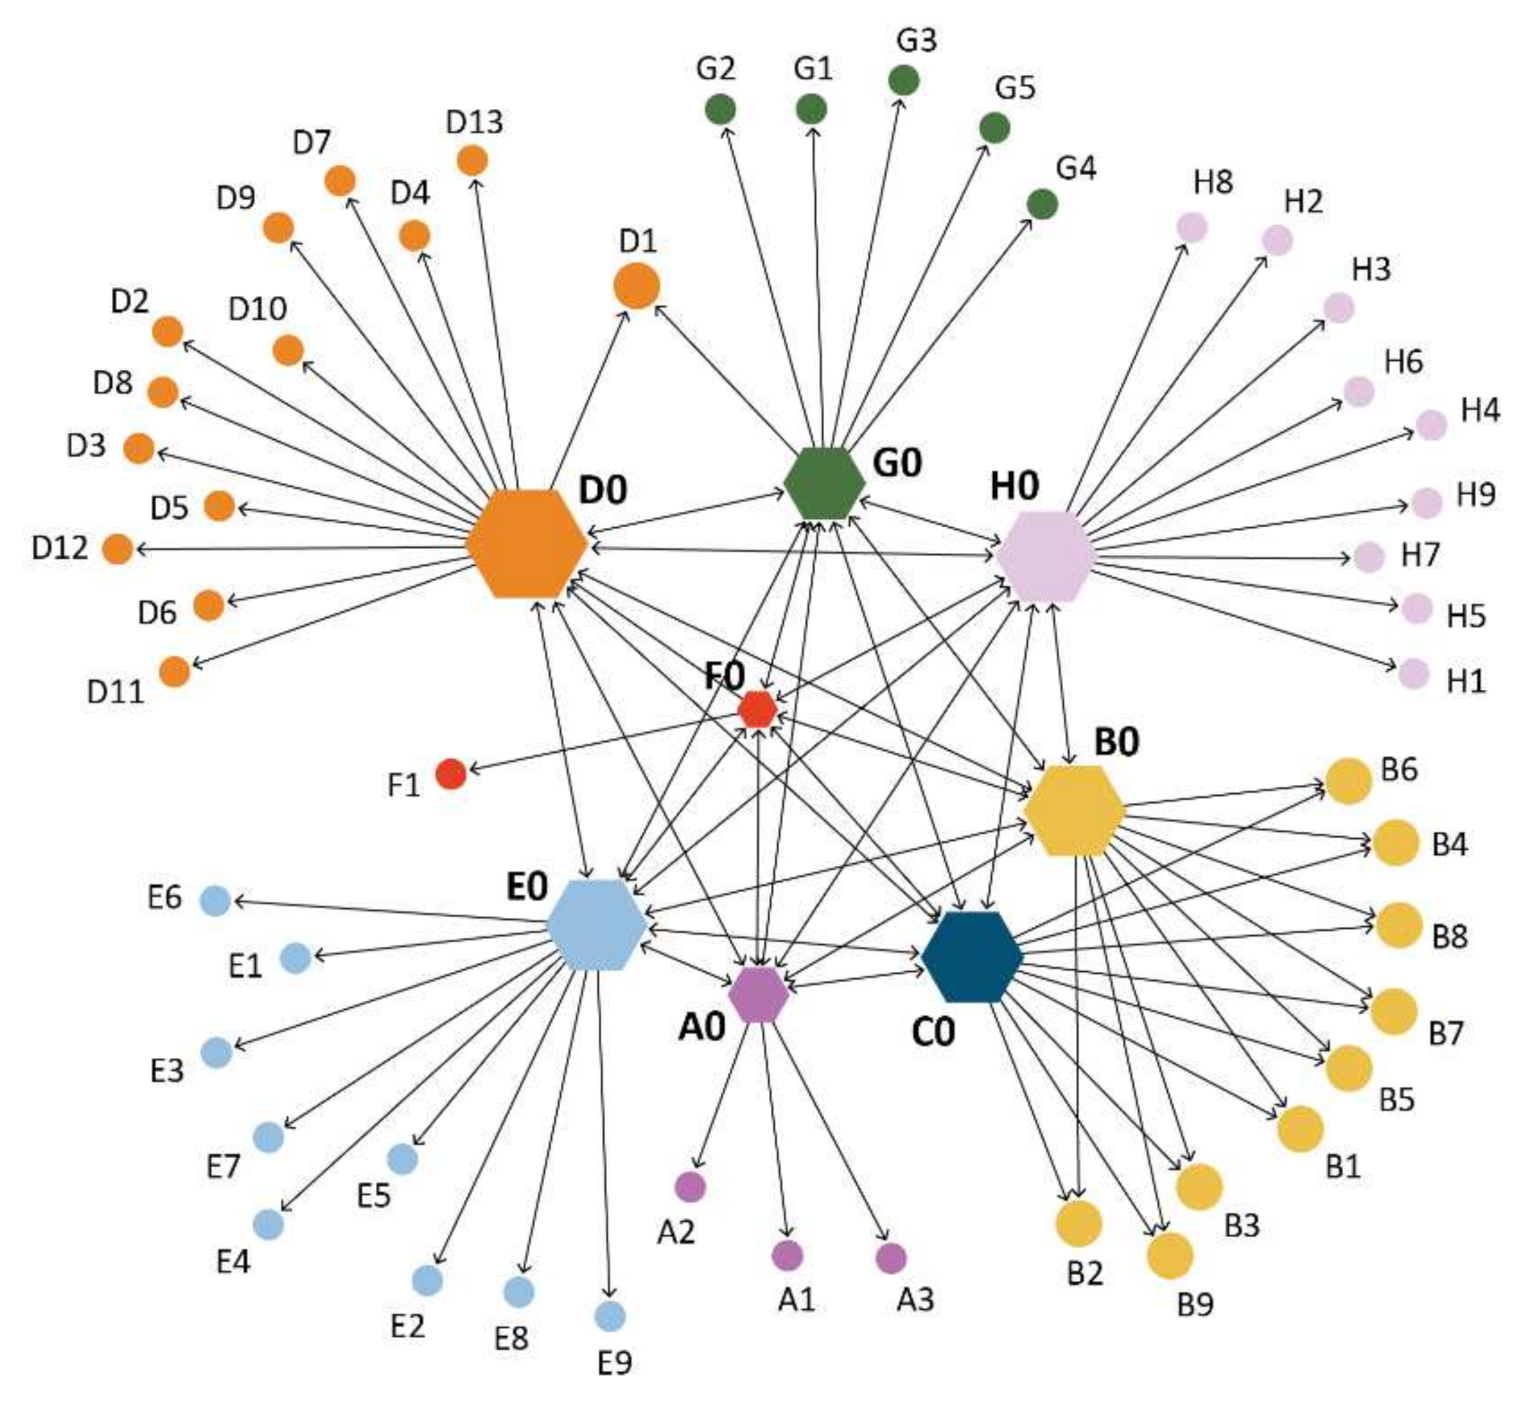
The SNA highlights which actors are most involved in relationship networks around the topic of interest. This method enables the understanding of how information can be transmitted more easily and effectively, both at the time of collecting the information for research and in future communications related to the project.
-
Knowing that there are possible links among experts suggests that there is a basis for the creation of a strong online community that would allow experts to get in touch with each other and propose new and innovative solutions enhancing the tool.
-
The interviews allow information to be added to the research through the direct testimony of people who usually use this kind of software, tools, or data. Acquiring the information directly from the experts contributes to the work on clear and accurate information, highlighting the current problems in the use of this software.
-
The information gathered during the interviews was implemented to make the platform as close to the needs of the experts as possible, turning their considerations into actions. In particular, this study proposed the following recommendations to the EDMT developers:
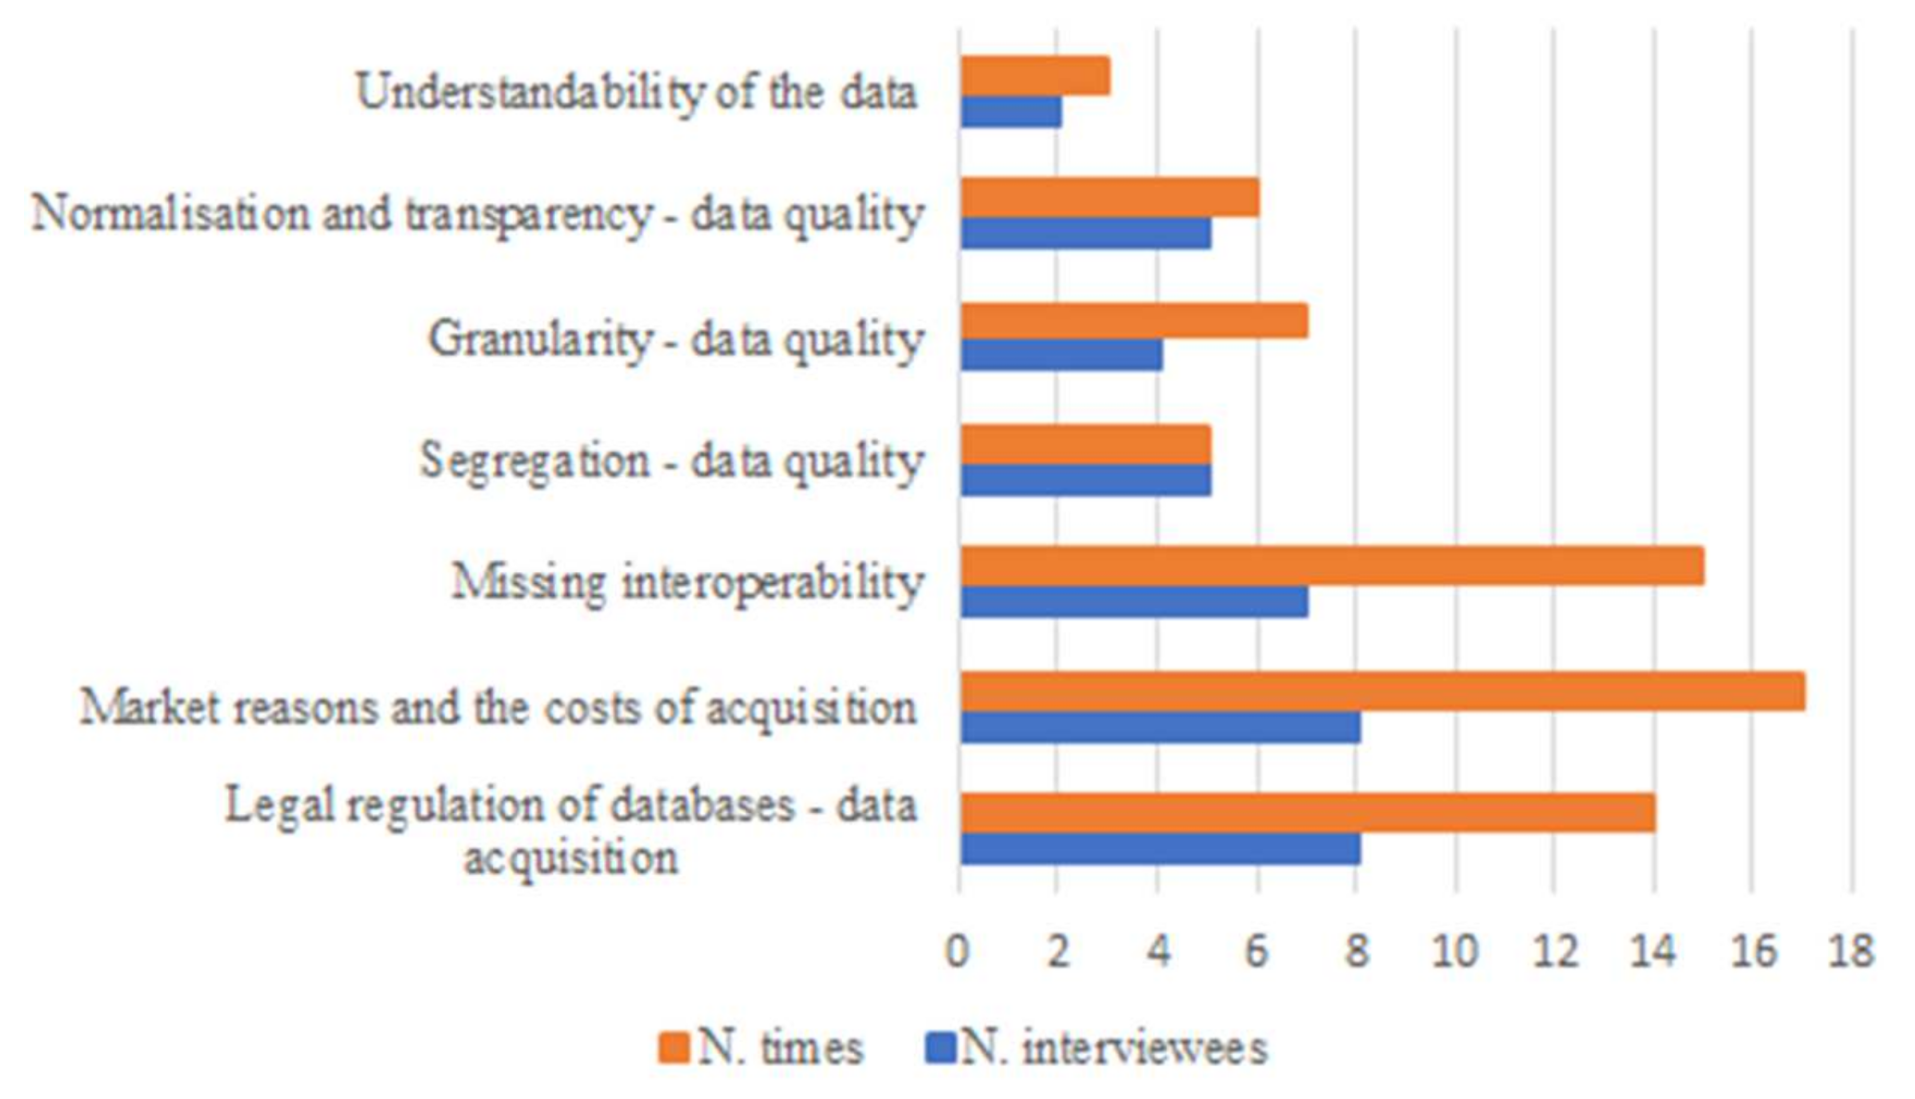
  • Ensure a good level of granularity, segregation, and transparency of the data included in the EDMT.
  • The creation of a web community of experts that interact to solve common problems and point out mistakes within the EDMT.
  • Easy accessibility of data and good representation of results of the analysis in order to communicate effectively with public authorities and other stakeholders who do not have, e.g., a scientific expertise.
  • The access to data about energy production and consumption, meteorological data, and socio-economic data has to be linked or included in the EDMT.
  • There are a number of legal and market problems, which create inequalities in data access that should be discussed and solved, also with the support of policymakers.

Limits

A number of limits of this study must be highlighted. Although we tried to involve as many people as possible, the number of stakeholders who participated in our survey is quite small, at only eight partners. In future research, we should try to involve more people in the first phase of the SA to have as many points of view as possible. It would be important to make all participants understand how important this information is for researchers and how this information can facilitate the design of a new platform and even more for its use. The most critical aspect of the low sample size of interviewees is that the number of responses is unsuitable for a statistically significant sample size. Ideally, we should have reached a quantitatively representative sample size for this study, but this could not be achieved due to the lack of timing and resources.
In addition, the fact that the stakeholders identified for the interview were all gathered from the networks of the project partners could result in selection bias, since the stakeholder selection was not random.

6. Conclusions

The climate and energy transition needs the support of FAIR data and tools to manage, organize, and share data with the relevant stakeholders to make decisions and take actions. The EnerMaps project proposes and tests a methodology to involve stakeholders in the definition of user needs and design of the EDMT, providing a potential solution to the need to ensure access, co-production, and co-design of data and data-sharing tools, so that data become not merely a product with economic value, but a service of social relevance for the energy transition.
  • The user stories and needs were an important step in assessing the data demands of stakeholders and acted as a blueprint for the establishment of the EDMT’s core data categories. The feedback from stakeholders directly influenced many decisions in EnerMaps’ development, including the platform’s GUI, calculation modules, and features that ensure the platform is a robust, dedicated knowledge base.
  • The identification and analysis of user stories and needs were based on a mixed-methods approach of social sciences and humanities. This mix of methods made it possible to not only focus on the challenges, needs, and resources of the data sector but also enabled focusing on the relationships among the stakeholders. Integrating this second set of methods allows us to get an idea of what coalitions of stakeholders may be in the future that will spur further development of the data sector and what the main user groups will be. It is important to focus on the user stories and needs, but it is also important to understand what relationships exist among the stakeholders. The knowledge about relationships between the stakeholders can incentivize a more effective deployment of the EDMT and an effective communication between the stakeholders, as well as ensure the usefulness of the ongoing feedback that stakeholders in this project gave for the design and implementation of the EDMT. To create a community of lead and end users to receive continuous feedback on the usefulness and quality of the EDMT, it was very important to integrate the knowledge of stakeholder relationships along with the perspectives of individuals.
  • The stakeholder analysis method supported a selection of stakeholders to ensure a wide presence of perspectives based on interdisciplinary and transdisciplinary expertise, gender inclusiveness, and geographical distribution. The selected stakeholders were interviewed using methods from expert and semi-structured interviews and content analysis of the interviews. Through the interviews, user stories and needs relevant to addressing the design and development of the EDMT were collected. The collected user stories addressed common problems with data handling and previous experiences with comparable software, while the needs were divided into data-related needs and software-related needs. Both can be treated in the design and development of the EDMT. The main results to which the use of this methodology within the project led is the knowledge of certain aspects that are of fundamental importance for those who use and will use these data. Through the interviews, the stakeholders provided a list of relevant groups of data that may be included in the EDMT and the need to be transparent on the features of data included in the datasets. Specifically in reference to data, the importance in the research world of access to certain specific data, such as energy consumption and production, is emphasized.
  • Concerning the software-related needs, the need to create a community for users with the aim to share and co-develop is underlined. In this sense, familiarization with the present network using the SNA allowed us to understand how communications take place, who is in contact with whom, and gave us the opportunity to observe that, very often, specific stakeholders are outside the relationships and are not very connected to other stakeholders with whom they share work and ideas unconsciously. Facilitating connections and relationships by using a tool that allows us to know the types of ties that exist would allow for a quicker identification of common problems and equally efficient solutions.
This paper and its methods can be of interest to all projects and actors, which deal with urgent needs for decisions and actions for climate and energy transitions. These methods can be reused in other projects where knowledge of the problems and limitations through the involvement of those who use platforms or datasets regularly is crucial.

Author Contributions

Conception or design of the work, J.B. and S.P.; Methodological part, J.B., G.G. and E.W.; Writing, G.G., J.B., E.W. and S.P.; Interpretation of data, J.B. and G.G.; Revision, S.P.; Validation, J.B., S.P., G.G. and E.W. All authors have read and agreed to the published version of the manuscript.

Funding

This research was partially funded by the Horizon 2020 project EnerMaps financed by the European Commission (Grant agreement No. 884161).

Acknowledgments

The authors thank the Department of Innovation and Research at the University of the Autonomous Province of Bozen/Bolzano for covering the Open Access publication costs. We are thankful to Giacomo Lauritano for carrying out the telephone interviews mentioned in the article. We would also like to thank Amy Segata for the realization of the figures in the article. Finally, we would like to convey our deepest appreciation to the Horizon 2020 EnerMaps project (Grant Agreement No. 884161), which provided the funding to carry out the present investigation.

Conflicts of Interest

The authors declare no conflict of interest.

References

  1. UNFCCC. COP 26 Glasgow Climate Pact Advance unedited version Decision. In Proceedings of the COP26, Glasgow, UK, 1–12 November 2021; pp. 1–8. Available online: https://unfccc.int/sites/default/files/resource/cop26_auv_2f_cover_decision.pdf (accessed on 28 August 2022).
  2. Lv, Y.P.; Shaheen, N.; Ramzan, M.; Mursaleen, M.; Nisar, K.S.; Malik, M.Y. Chemical reaction and thermal radiation impact on a nanofluid flow in a rotating channel with Hall current. Sci. Rep. 2021, 11, 19747. [Google Scholar] [CrossRef]
  3. Geels, F.W.; Schot, J. Typology of sociotechnical transition pathways. Res. Policy 2007, 36, 399–417. [Google Scholar] [CrossRef]
  4. Fernandes, B.; Cunha, J.; Ferreira, P. The use of real options approach in energy sector investments. Renew. Sustain. Energy Rev. 2011, 15, 4491–4497. [Google Scholar] [CrossRef]
  5. Khan, Z.; Pervez, Z.; Abbasi, A.G. Towards a secure service provisioning framework in a Smart city environment. Future Gener. Comput. Syst. 2017, 77, 112–135. [Google Scholar] [CrossRef]
  6. International Conference on Knowledge and Innovation in Engineering, Science and Technology. 2014. Available online: https://www.kiconf.org/ (accessed on 28 August 2022).
  7. Taylor, L. What is data justice? The case for connecting digital rights and freedoms globally. Big Data Soc. 2017, 4, 1–14. [Google Scholar] [CrossRef]
  8. Sadowski, J. When data is capital: Datafication, accumulation, and extraction. Big Data Soc. 2019, 6, 1–12. [Google Scholar] [CrossRef]
  9. Blasch, J.; van der Grijp, N.M.; Petrovics, D.; Palm, J.; Bocken, N.; Darby, S.J.; Barnes, J.; Hansen, P.; Kamin, T.; Golob, U.; et al. New clean energy communities in polycentric settings: Four avenues for future research. Energy Res. Soc. Sci. 2021, 82, 102276. [Google Scholar] [CrossRef]
  10. Sovacool, B.K. How long will it take? Conceptualizing the temporal dynamics of energy transitions. Energy Res. Soc. Sci. 2016, 13, 202–215. [Google Scholar] [CrossRef]
  11. Espinoza, M.I.; Aronczyk, M. Big data for climate action or climate action for big data? Big Data Soc. 2021, 8, 205395172098203. [Google Scholar] [CrossRef]
  12. Ramzan, M.; Gul, H.; Mursaleen, M.; Nisar, K.S.; Jamshed, W.; Muhammad, T. Von Karman rotating nanofluid flow with modified Fourier law and variable characteristics in liquid and gas scenarios. Sci. Rep. 2021, 11, 16442. [Google Scholar] [CrossRef] [PubMed]
  13. The Open Data Tool Empowering Your Energy Transition. Available online: https://enermaps.eu/ (accessed on 28 August 2022).
  14. Sareen, S. Energy infrastructure transitions and environmental governance. Local Environ. 2021, 26, 323–328. [Google Scholar] [CrossRef]
  15. Fleischhauer, M.; Greiving, S.; Flex, F.; Scheibel, M.; Stickler, T.; Sereinig, N.; Koboltschnig, G.; Malvati, P.; Vitale, V.; Grifoni, P.; et al. Improving the active involvement of stakeholders and the public in flood risk management & ndash; Tools of an involvement strategy and case study results from Austria, Germany and Italy. Nat. Hazards Earth Syst. Sci. 2012, 12, 2785–2798. [Google Scholar] [CrossRef]
  16. Prell, C.; Hubacek, K.; Reed, M. Stakeholder analysis and social network analysis in natural resource management. Soc. Nat. Resour. 2009, 22, 501–518. [Google Scholar] [CrossRef]
  17. Hoolohan, C.; Larkin, A.; McLachlan, C.; Falconer, R.; Soutar, I.; Suckling, J.; Varga, L.; Haltas, I.; Druckman, A.; Lumbroso, D.; et al. Engaging stakeholders in research to address water–energy–food (WEF) nexus challenges. Sustain. Sci. 2018, 13, 1415–1426. [Google Scholar] [CrossRef]
  18. Cox, S.; Lopez, A.; Watson, A.; Grue, N.; Leisch, J.E. Renewable Energy Data, Analysis, and Decisions: A Guide for Practitioners; National Renewable Energy Laboratory: Golden, CO, USA, 2018. [Google Scholar]
  19. Mathew, P.A.; Dunn, L.N.; Sohn, M.D.; Mercado, A.; Custudio, C.; Walter, T. Big-data for building energy performance: Lessons from assembling a very large national database of building energy use. Appl. Energy 2015, 140, 85–93. [Google Scholar] [CrossRef]
  20. Balest, J.; Lauritano, G.; Giacovelli, G.; Wilczynski, E. User Stories and Prioritization. 2020. Available online: https://enermaps.eu/wp-content/uploads/2020/10/EnerMaps_D1.1_User-stories-and-prioritization.pdf (accessed on 28 August 2022).
  21. Brown, R.E.; Walter, T.; Dunn, L.N.; Custodio, C.Y.; Mathew, P.A. Getting Real with Energy Data: Using the Buildings Performance Database to Support Data-Driven Analyses and Decision-Making. In Proceedings of the 2014 ACEEE Summer Study on Energy Efficiency in Buildings, Pacific Grove, CA, USA, 17–22 August 2014; pp. 49–60. [Google Scholar]
  22. Wang, J.; Ge, J.; Lu, Q. A review of stakeholder analysis. In Proceedings of the 2012 3rd International Conference on System Science, Engineering Design and Manufacturing Informatization, Chengdu, China, 22–23 October 2012; Volume 2, pp. 40–43. [Google Scholar] [CrossRef]
  23. Bendtsen, E.B.; Clausen, L.P.W.; Hansen, S.F. A review of the state-of-the-art for stakeholder analysis with regard to environmental management and regulation. J. Environ. Manag. 2021, 279, 111773. [Google Scholar] [CrossRef]
  24. Ansell, C.; Press, E.E. Theories of Public Participation in Governance. 2016. Available online:. (accessed on 28 August 2022).
  25. Balest, J.; Pisani, E.; Vettorato, D.; Secco, L. Local reflections on low-carbon energy systems: A systematic review of actors, processes, and networks of local societies. Energy Res. Soc. Sci. 2018, 42, 170–181. [Google Scholar] [CrossRef]
  26. Geels, F.W.; Sovacool, B.K.; Schwanen, T.; Sorrell, S. The Socio-Technical Dynamics of Low-Carbon Transitions. Joule 2017, 1, 463–479. [Google Scholar] [CrossRef]
  27. Fu, F.; Feng, W.; Li, Z.; Crawley, E.F.; Ni, W. A network-based modeling framework for stakeholder analysis of China′s energy conservation campaign. Energy 2011, 36, 4996–5003. [Google Scholar] [CrossRef]
  28. Pelyukh, O.; Lavnyy, V.; Paletto, A.; Troxler, D. Stakeholder analysis in sustainable forest management: An application in the Yavoriv region (Ukraine). For. Policy Econ. 2021, 131, 102561. [Google Scholar] [CrossRef]
  29. Balest, J.; Paletto, A.; De Meo, I.; Giacovelli, G.; Grilli, G. Perceived influence and Real Power of Stakeholders in Forest Management: A Case Study in Italy. In Proceedings of the International IUFRO Symposium “Adaptation in Forest Management Under Changing Framework Conditions”, Zagreb, Croatia, 26–28 November 2014. [Google Scholar]
  30. White, D.D.; Jones, J.L.; Maciejewski, R.; Aggarwal, R.; Mascaro, G. Stakeholder analysis for the food-energy-water nexus in Phoenix, Arizona: Implications for nexus governance. Sustainability 2017, 9, 2204. [Google Scholar] [CrossRef]
  31. Wilcox, D. Effective Participation; Delta Press: Brighton, UK, 1994; ISBN 1870298004. [Google Scholar]
  32. Dutta, A.; Das, S. Adoption of grid-connected solar rooftop systems in the state of Jammu and Kashmir: A stakeholder analysis. Energy Policy 2020, 140, 111382. [Google Scholar] [CrossRef]
  33. Martin, N.; Rice, J. Improving Australia′s renewable energy project policy and planning: A multiple stakeholder analysis. Energy Policy 2015, 84, 128–141. [Google Scholar] [CrossRef]
  34. Elgin, D.J.; Weible, C.M. A Stakeholder Analysis of Colorado Climate and Energy Issues Using Policy Analytical Capacity and the Advocacy Coalition Framework. Rev. Policy Res. 2013, 30, 114–133. [Google Scholar] [CrossRef]
  35. Collins, S.; Genova, F.; Harrower, N.; Hodson, S.; Jones, S.; Laaksonen, L.; Mietchen, D.; Petrauskaité, R.; Wittenburg, P. FAIR Data Action Plan: Interim Recommendations and Actions from the European Commission Expert Group on FAIR Data. Zenodo 2018. [Google Scholar] [CrossRef]
  36. Reed, M.S.; Graves, A.; Dandy, N.; Posthumus, H.; Hubacek, K.; Morris, J.; Prell, C.; Quinn, C.H.; Stringer, L.C. Who’s in and why? A typology of stakeholder analysis methods for natural resource management. J. Environ. Manag. 2009, 90, 1933–1949. [Google Scholar] [CrossRef] [PubMed]
  37. Balest, J.; Hrib, M.; Dob, Z.; Paletto, A. Analysis of the Effective Stakeholders′ Involvement in the Development of National Forest Programmes in Europe. Int. For. Rev. 2016, 18, 13–28. [Google Scholar] [CrossRef]
  38. Hubacek, K.; Van Den Bergh, J.C.J.M. Changing concepts of “land” in economic theory: From single to multi-disciplinary approaches. Ecol. Econ. 2006, 56, 5–27. [Google Scholar] [CrossRef]
  39. Reed, M.S.; Vella, S.; Challies, E.; de Vente, J.; Frewer, L.; Hohenwallner-Ries, D.; Huber, T.; Neumann, R.K.; Oughton, E.A.; Sidoli del Ceno, J.; et al. A theory of participation: What makes stakeholder and public engagement in environmental management work? Restor. Ecol. 2018, 26, S7–S17. [Google Scholar] [CrossRef] [Green Version]
  40. McCarthy, S. How to Write a Competitive Horizon 2020 Proposal. 2014. Available online: https://cordis.europa.eu/article/id/136649-how-to-write-a-competitive-proposal-for-horizon-2020-essential-tool-in-securing-horizon-2020- (accessed on 28 August 2022).
  41. Borgatti, S.P.; Everett, M.G.; Johnson, J.C. Analyzing Social Networks, 2nd ed.; SAGE: Thousand Oaks, CA, USA, 2018; ISBN 1526418460. [Google Scholar]
  42. Brandes, U. Social Network Analysis and Visualization. IEEE Signal Process. Mag. 2008, 25, 147–151. [Google Scholar] [CrossRef]
  43. Pretto, A. Analyzing life stories: Methodological and epistemological reflections. Tabula Rasa 2011, 171–194. Available online: http://www.scielo.org.co/scielo.php?pid=S1794-24892011000200010&script=sci_abstract&tlng=en (accessed on 28 August 2022). [CrossRef]
  44. Meuser, M.; Nagel, U. The Expert Interview and Changes in Knowledge Production. Interviewing Expert. 2009, 17–42. [Google Scholar] [CrossRef]
  45. Blackmer, W.S. EU general data protection regulation. In Proceedings of the 2018 Labor Relations/Human Resources Conference, New Orleans, LA, USA, 26–27 April 2018; Volume 2014, pp. 45–62. [Google Scholar] [CrossRef]
  46. RStudio. Development, RStudio: Integrated for R; RStudio, Inc.: Boston, MA, USA, 2019; Available online: http://www.rstudio.com/ (accessed on 28 August 2022).
  47. Chiesi, A.M. L′analisi dei Reticoli; Franco Angeli: Milano, Italy, 1999. [Google Scholar]
  48. The European Parliament and the Council Directive 96/9/EC of the European Parliament and of the Council of 11 March 1996 on the Legal Protection of Databases. Oj. Volume 1995, pp. 20–28. 1996. Available online: https://eur-lex.europa.eu/legal-content/EN/TXT/?uri=celex%3A31996L0009 (accessed on 28 August 2022).
  49. Wall, L. Perl. 1988. Available online: https://www.perl.org/ (accessed on 28 August 2022).
  50. Foundation Python Software, Python. 2011. Available online: https://www.python.org/ (accessed on 28 August 2022).
  51. Klima-Agence. EnerCoach-Energy Accounting Software; Klima-Agence: Luxembourg, 2022. [Google Scholar]
  52. Eurostata Share of Energy from Renewable Sources-European Environment Agency. Available online: https://ec.europa.eu/eurostat/web/energy/data/shares (accessed on 28 August 2022).
  53. The NCEP/NCAR 40-Year Reanalysis Project. Available online: https://psl.noaa.gov/data/gridded/data.ncep.reanalysis.html (accessed on 28 August 2022).
Figure 1. Flow of methods used to engage stakeholders in the design and management of the EDMT.
Sustainability 14 11392 g001
Figure 2. Typology and methods for stakeholder analysis [22].
Sustainability 14 11392 g002
Figure 3. Lead and end users of the EnerMaps project and related interactions.
Sustainability 14 11392 g003
Figure 4. Relationships in the EnerMaps project.
Sustainability 14 11392 g004
Figure 5. Number of interviewees and number of times that interviewees cited common problems in data handling.
Sustainability 14 11392 g005
Table 1. General data for synthesizing the main results.
General Data
Type of DataNumberDetails
Stakeholder Mapping23
Interviewees8Women: 4; men: 4
Germany: 2; Switzerland: 2; Bulgaria: 1; France: 1; Italy: 1; Belgium: 1
Social networks—nodes or actors 57
Social networks—number of maximum registered relationships 228
User stories—minutes of recorded interviews200
Table 2. Number and type of stakeholders differentiated and categorized by project partners.
Target Group
Lead UserAbsolute ValuesRelative Values
Research (staff in universities and non-university research organizations working in the field of energy) and scientific projects 1122.44%
Industry (in particular, renewable technology industry) 36.13%
Energy managers 24.08%
Energy planners 24.08%
Energy utilities 48.16%
Energy consultants 36.13%
Public administration officers operating in the energy field (those encompass policy decision makers—end users) 612.25%
End UsersAbsolute ValuesRelative Values
Civil society (addressed by social innovation experts—lead users): civil society associations, energy communities, and energy cooperatives 48.16%
Data providers 36.13%
Policymakers 1122.44%
Table 3. Distribution of stakeholders by work area relative to the corresponding experts. The label column indicates the partner of the project who compiled the list of stakeholders.
Label Stakeholders Working in the Same Country (%) Stakeholders Working in Another Country (%)
A030 60
B0100 0
C0100 0
D07.7 92.3
E0100 0
F00 100
G00 100
H087.5 12.5
Table 4. General description of data expected to be included in EDMT.
Data of InterestDescription
Energy productionFocus on type of energy (renewable or fossil fuel), type of power plant, type of energy distribution, etc.
Energy consumptionFocus on sectors (e.g., industrial, residential, etc.), type of facilities, etc.
Socio-economicFocus on information such as number of inhabitants and other demographics, economic status, building stock, etc.
Meteorological Focus on typical meteorological situation, including information on rainfall, sunshine, solar insulation, NCEP datasets [53], etc.
Publisher’s Note: MDPI stays neutral with regard to jurisdictional claims in published maps and institutional affiliations.

