Article

Optimizing Phosphorus Application Rate and the Mixed Inoculation of Arbuscular Mycorrhizal Fungi and Phosphate-Solubilizing Bacteria Can Improve the Phosphatase Activity and Organic Acid Content in Alfalfa Soil

College of Animal Science & Technology, Shihezi University, Shihezi 832003, China
*
Authors to whom correspondence should be addressed.
Sustainability 2022, 14(18), 11342; https://doi.org/10.3390/su141811342
Submission received: 16 June 2022 / Revised: 8 August 2022 / Accepted: 8 August 2022 / Published: 9 September 2022

Abstract

:
Alfalfa (Medicago sativa L.) is an important legume forage, and phosphorus is a significant nutrient element of alfalfa with high quality and high yield. However, the effect mechanism of different phosphorus application rates on soil bacteria, and the phosphorus efficiency of alfalfa are still unclear. Therefore, we present the results of a study in which alfalfa was inoculated with Funneliformis mosseae, Bacillus megaterium, double inoculated with Funneliformis mosseae and Bacillus megaterium, and given no inoculation bacteria. P2O5 was applied under the condition of bacterial inoculation, and the contents were 0, 50, 100, and 150 mg kg−1, respectively, to explore the effect of bacterial inoculation on alkaline phosphatase, organic acid, pH, organic matter, and the relationship between the indicators in alfalfa soil, under different phosphorus application rates. The effect of mixed inoculation was significantly higher than that of the non-inoculated control group (p < 0.05). The organic matter content of rhizosphere soil was higher than that of non-rhizosphere soil. When the phosphorus application rate was 100 mg kg−1, the content of alkaline phosphatase in the soil inoculated with Funneliformis mosseae and Bacillus megaterium was better than that in the single inoculation, and no inoculation. Principal component analysis showed that the top three treatments were: double inoculation bacteria and treatment group with phosphorus application rate of 100 mg kg−1 >; double inoculation bacteria and treatment group with phosphorus application rate of 50 mg kg−1 >; double inoculation bacteria and treatment group with phosphorus application rate of 150 mg kg−1. In addition, when P2O5 was 100 mg kg−1, the addition of Funneliformis mosseae and Bacillus megaterium to alfalfa soil could increase the content of organic matter in the soil, promote the metabolism of alfalfa root exudates, and increase the organic acid of the rhizosphere soil, compared with the control without inoculation, and without phosphorus application. At the same time, the phosphatase activity in the soil had a significant positive correlation with malic acid, oxalic acid, acetic acid, total organic acid, and soil pH, thereby improving soil fertility and promoting phosphorus absorption by plants. These findings provide new insights into alfalfa root soils and the effects of Funneliformis mosseae and Bacillus megaterium additions on soil nutrients.

1. Introduction

Alfalfa (Medicago sativa L.) is a perennial herb of leguminous forage, with a high yield, rich nutrition, huge production potential, and wide use [1]. Phosphorus (P), one of the most important nutrients for normal plant development, is involved in the synthesis and metabolism of many important compounds in plants [2]. In plants, P is the main limiting factor for crop yield. The application of phosphorus fertilizer plays an important role in promoting the further increase of alfalfa hay yield. In the case of plant P deficiency, plants improve phosphorus absorption capacity by promoting root development, which then affects the nutritional quality of plants [3]. Therefore, phosphorus has a vital effect on the formation of alfalfa production performance [3]. Arbuscular mycorrhizal fungi (AMF) and phosphate solubilizing bacteria (PSB) are symbiotic microorganisms in nature [4,5]. AMF can promote the uptake and utilization of phosphorus in soil by plants. The rate of P uptake by mycorrhizal plants is an important and essential factor affecting the amount of P uptake by plants under a certain P concentration [6]. The soil contains a micro habitat suitable for the growth and development of microorganisms and alfalfa. Rhizosphere is a soil area directly affected by alfalfa root exudates. The physical and chemical properties of the surrounding soil are changed through the interaction between microorganisms and plants. The utilization efficiency of P fertilizer in rhizosphere is different than in the other spheres of studied soil [7], which has different effects on plants. Study has shown that AMF hyphae can secrete organic acids, improve the pH value of the rhizosphere, and promote the transformation of organic phosphorus in soil into inorganic phosphorus that can be absorbed and utilized by plants [8]. At the same time, AMF can stimulate the secretion of plant phosphatase and enhance the activity of phosphatase, thus improving plant P nutrients [9]. PSB is one of the important microorganisms for plants to absorb P in soil. PSB can secrete organic acids and corresponding enzymes. It converts organic phosphorus and insoluble phosphorus into phosphorus that can be absorbed and utilized by plants, so as to improve the utilization efficiency of phosphorus in soil and further promote the growth of crops [10]. PSB plays an important role in the turnover and bioavailability of soil P [11]. It can increase the dissolution and mineralization of insoluble inorganic phosphorus and organic phosphorus in soil by secreting protons, organic acids, and phosphatase [11]. The results showed that, compared with single inoculation of AMF or PSB, mixed inoculation of PSB and AMF could effectively improve alfalfa P nutrition and promote crop yield [4]. For example, by inoculating phosphorus dissolving bacteria and AMF, the fixed P in the soil can be hydrolyzed and converted into soluble phosphate for the absorption and utilization of phosphorus by soybean, so as to promote the growth and development of soybean (Glycine max L.) and potato (Solanum tuberosum L.) [8]. It can be seen that the study of phosphatase activity and organic acid is an important means to study phosphate solubilizing microorganisms.
Phosphatases in soil can decompose lipid P and accelerate the hydrolysis process, thus increasing the content of available phosphorus in soil [12]. According to the optimal pH value of phosphatases for the dissociation of insoluble phosphate, it can be divided into hydrolytic acid phosphatases and specific alkaline phosphatases (AKP) [13]. Among them, AKP is a kind of specific enzyme of AMF and plant symbiosis system [13]. The results showed that acid phosphatase activity was significantly affected by PSB inoculation and P application [14]. With the increase of organic acid content, insoluble phosphate in soil moved to the direction of effective dissociation [15]. Simultaneously, due to the change of pH value in the soil, the phosphatase activity was indirectly affected. Organic acids can also chelate with Ca, Al, and Fe plasma to release PO3−, which can effectively increase the solubility of insoluble phosphate [16]. Therefore, through the study of the two, it can reveal the partial mechanism of phosphorus solubilization in the symbiotic system of phosphorus solubilizing microorganisms and plants, which is also one of the current research hotspots.
Interaction of AMF and PSB can enhance the ability of plants to obtain P. At present, a lot of studies mainly focus on inoculating AMF or PSB on alfalfa plants alone [5]. However, there are relatively few studies on the effects of the interaction between AMF and PSB on the absorption of phosphorus, and the secretion of phosphatase by alfalfa, as well as the relationship between various indicators, especially the effects of AMF and PSB on phosphatases activity in soil [5]. Therefore, this study investigated the effects of AMF and PSB on alfalfa phosphatase activity, organic acid, pH value, and SOM content under different P application levels, in order to clarify the relationship between indicators and the effect of bacterial phosphorus interaction on alfalfa growth. Through the combination of organic biological fertilizer AMF and PSB, it can help to increase the accessibility of plants to P and reduce the use of chemical fertilizer. Thus, the best bacterial phosphorus coupling model suitable for high-quality and high-yield alfalfa was selected, which provided a theoretical basis for the effective utilization of P fertilizer, and the development of microbial fertilizer.
At present, many studies mainly focus on inoculating AMF or PSB on plants alone, while there are relatively few studies on the effect of bacteria phosphorus interaction on the absorption of phosphorus and the secretion of phosphatase in alfalfa, as well as the relationship between various indicators, especially the effect of bacteria and phosphorus on soil phosphatase activity. Therefore, this study carried out the effects of inoculation of AMF and PSB on phosphatase activity, organic acids, pH value, and organic matter content of alfalfa under different phosphorus application levels, in order to provide a theoretical basis for the efficient utilization of phosphorus fertilizer, and the development of microbial bacterial fertilizer.

2. Materials and Methods

2.1. Experimental Materials

In this experiment, AMF Funneliformis mosseae (Fm) was selected, which was provided by the Qingdao Agricultural Mycorrhizae Research Institute of China. The inoculant was rhizosphere soil, comprising host plant root, mycorrhizal fungal spore, and ectomycorrhizal mycelium. Spore density: 25–35 g. The host plant alfalfa variety tested was WL354HQ [7].
For the PSB, Bacillus megaterium (Bm) was taken from the Agricultural Culture Collection of China (ACCC, WDCM 572, 10011) [7].

2.2. Experimental Design

This experiment is based on a two-factor completely randomized design, including bacterial application and phosphorus application. Four treatments were as follows: Funneliformis mosseae (Fm), Bacillus megaterium (Bm), double inoculation (Fm × Bm) and no inoculation bacteria (CK), respectively labeled as T1, T2, T3, and T0. There are four levels of phosphorus treatment, namely: phosphorus (P2O5) application 0 (P0), 50 (P1), 100 (P2), 150 mg kg−1 (P3), repeat 6 times for each treatment (Table 1). The specific treatments scheme is shown in Table 1.
The experiment was conducted in the experimental base of Shihezi University (44°18′ N, 86°03′ E) from May 2019 to November 2020. The soil was sterilized in the autoclave for 2 h and then air-dried for standby (at 121 °C). A pot experiment was carried out in a nutrient bowl with an upper diameter of 23 cm, bottom diameter of 15 cm, and height of 16 cm. Each pot contained 3 kg sterilized air-dried soil. The basic physical and chemical properties of soil is shown in Table 2.
In the treatment group T1, Fm was inoculated 5 cm below the surface of the soil in the pot, and 10 g of bacteria was applied in each pot to promote the colonization of alfalfa roots. In the treatment group T1, 10 g of the mixture containing spores and dry inoculated roots was weighed by the analytical balance of Funneliformis mosseae (Fm) and placed in the basin at a depth of 5 cm below the soil surface to promote the colonization of alfalfa roots. In the T2 treatment group, the Bm bacteria was taken from the refrigerator at −80 °C for activation, the Bm bacteria was inoculated into LB liquid medium, the culture was kept in a constant temperature incubator at 37 °C for 24 h, the colony number was diluted to 108 (CFU mL−1) by the plate dilution method as the inoculation solution, and 10 mL of Bm bacterial solution was inoculated into each flowerpot with a pipette. In the T3 treatment group, alfalfa seeds with a uniform particle size were soaked for 12 h, then the seeds were inoculated with 5 mL Bm solution (108 CFU mL−1) and a 5 g of mixture containing spores and dry inoculated roots Fm (about 8500 inoculation potential units) were successively put into the flower pot. In the non-inoculated T0 treatment group, the same number of inactivated Fm and Bm strains as the T3 treatment group were added. Full and uniform alfalfa seeds were selected and disinfected with 10% H2O2 for 10 min, then they were washed repeatedly with distilled water, and sown on 1 May 2019, with 10 seeds in each pot. The same amount of water was supplied every day, and the seedlings were thinned after sowing (the growth period was three-leaf stage). Five alfalfa seedlings with uniform growth were kept in each pot, and each treatment was repeated six times. To keep the same daylight, the flower pots were randomly placed. The phosphate fertilizer used was mono ammonium phosphate (containing 52% P and 11% N). The fertilizer was dissolved in water and then applied to the alfalfa basin. To keep the same content of N in each treatment, urea (containing 46% N) was added. Fertilizer was applied with a water drop twice each year: on 18 June and 19 September 2019; and on 25 June and 27 September 2020 (Table 2). The alfalfa was mowed twice a year, all at the initial flowering stage (5–10%), on 2 August and 12 October 2019. It was cut on 12 August and 16 October 2020, and the stubble height was 2 cm. The specific fertilization scheme is presented in Table 3.

2.3. Soil Sample Collection

The shaking method [7] was used to collect the rhizosphere and non-rhizosphere soil. The soil directly shaken off was regarded as non-rhizosphere soil, and the soil brushed from the root with a brush was regarded as rhizosphere soil. The soil was packed in self-sealed bags and brought back to the laboratory. The collected rhizosphere soil and non-rhizosphere soil was separately packed in sealed bags. Because the soil samples were collected from the pot containing moisture, the soil samples were transferred to an aluminum box, which was dried in a 65 °C oven until the weight did not change. The dried soil sample was ground and fine soil screened out with a 0.150 mm sieve, for subsequent determination of soil indicators.

2.4. Measurement Index and Method

2.4.1. Determination of Alkaline Phosphatase Activity (AKP) in the Soil

An AKP test kit was used to test the AKP in the soil, which was provided by Beijing Solarbio Technology Co., Ltd. (Beijing, China). The determination principle was as follows: AKP decomposes disodium phenyl phosphate to produce free phenol and phosphoric acid. Phenol reacts with 4-amino antipyrine in an alkaline solution and oxidizes with potassium ferricyanide to produce red quinone derivatives. The activity of the enzyme can be determined according to the red quinone derivatives [17].

2.4.2. Determination of Organic Acid Content

The contents of organic acids (citric acid, malic acid, oxalic acid, and acetic acid) in rhizosphere soil were determined by High Performance Liquid Chromatography [18]. Shimadzu LC-10A high performance liquid chromatography (HPLC), Shiseido CAPCELL PAK C18 analytical column (4.6 mm × 250 mm, 5 μm), TLE204 1/10,000 electronic balance (Swiss METTLER TOLEDO company. (Zurich, Switzerland)), KDC-140 high-speed freezing centrifuge and constant temperature culture oscillator. Oxalic acid, malic acid, acetic acid, and citric acid (chromatographically pure), methanol (chromatographically pure, Tianjin comeO Chemical Reagent Co., Ltd. (Tianjin, China)), phosphoric acid (analytically pure, Chengdu Jinshan Chemical Reagent Co., Ltd. (Chengdu, China)), and the test water was ultra-pure water, 0.22 μm water phase needle filter. Liquid chromatography conditions: the detection chromatographic column was CAPCELL PAK C18 analytical column, and the mobile phase was methanol (A) and 0.1% phosphoric acid solution (B) (volume ratio is 4:96), both of which had been tested by 0.45 μm microporous membrane filtration. The detection wavelength was 210 nm, the temperature of the column temperature box was 40 °C, the flow rate was 1 mL min−1, and the injection volume was 20 μL. The detection time was 15 min. The chromatographic retention time of the standard was used for qualitative analysis, and the peak area was used for quantitative analysis.

2.4.3. pH Value

The ratio of distilled water to soil was 5:1, and the pH meter was used for detection (Beijing yanghaiweiye Technology Co., Ltd. (Beijing, China)).

2.4.4. Soil Organic Matter (SOM)

The potassium dichromate hydration heat method was used [19]. Using the dilution heat generated when sulfuric acid and potassium dichromate aqueous solution were mixed, the carbon in organic matter was oxidized to carbon dioxide, while the hexavalent chromium in potassium dichromate was reduced to trivalent chromium. The remaining potassium dichromate was titrated with ammonium ferrous sulfate standard solution, and then the content of organic matter could be calculated according to the change of dichromate ion before and after organic carbon was oxidized [19].

2.4.5. Data Processing and Analysis

Excel 2010 was used for data processing. SPSS 18.0 (SPSS Inc., Chicago, IL, USA) was used for statistical analysis. Duncan’s method was used for multiple comparisons after two-way ANOVA. Origin 8.5 software (OriginLab OriginPro, Hampton, MA, USA) was used for mapping. Canoco 5.0 was used for principal component analysis (PCA) of the soil microbial community. The average value of the measured data was used ± Standard deviation.
Pearson correlation coefficient is a method to measure the degree of correlation between two variables [20]. Based on the relevant analysis, we analyzed the main components of the total amount of alkaline phosphatase, organic matter, pH value in soil, malic acid, oxalic acid, acetic acid, and organic acid in the rhizosphere soil. Our purpose was to analyze these soil related indicators and obtain the PCA comprehensive evaluation model according to the contribution rate of each treatment, so as to select the treatment that had a better impact on soil fertility.

3. Results

3.1. The Changes of AKP Content in Soil under Different Treatments

According to the test results, under the same bacterial treatment, the content of AKP increased at the lower dose of P (P0–P2), while it decreased at the higher dose of P (P2–P3) (Table 4). From 2019 to 2020, the content of AKP in rhizosphere soil treated with phosphorus was significantly better than that without phosphorus (p < 0.05), and the AKP content reached the maximum when the phosphorus application amount was 50 mg kg−1 or 100 mg kg−1 (i.e., P1 or P2), but the AKP content was the highest when most of the phosphorus application amount was 100 mg kg−1. When the phosphorus application rate was 100 mg kg−1, the AKP content of AMF and PSB was significantly higher than that of no bacteria treatment (p < 0.05). The change trend of AKP content in non-rhizosphere soil, from 2019 to 2020, is similar to that in rhizosphere soil. With the extension of time, the content of AKP in the soil increased.

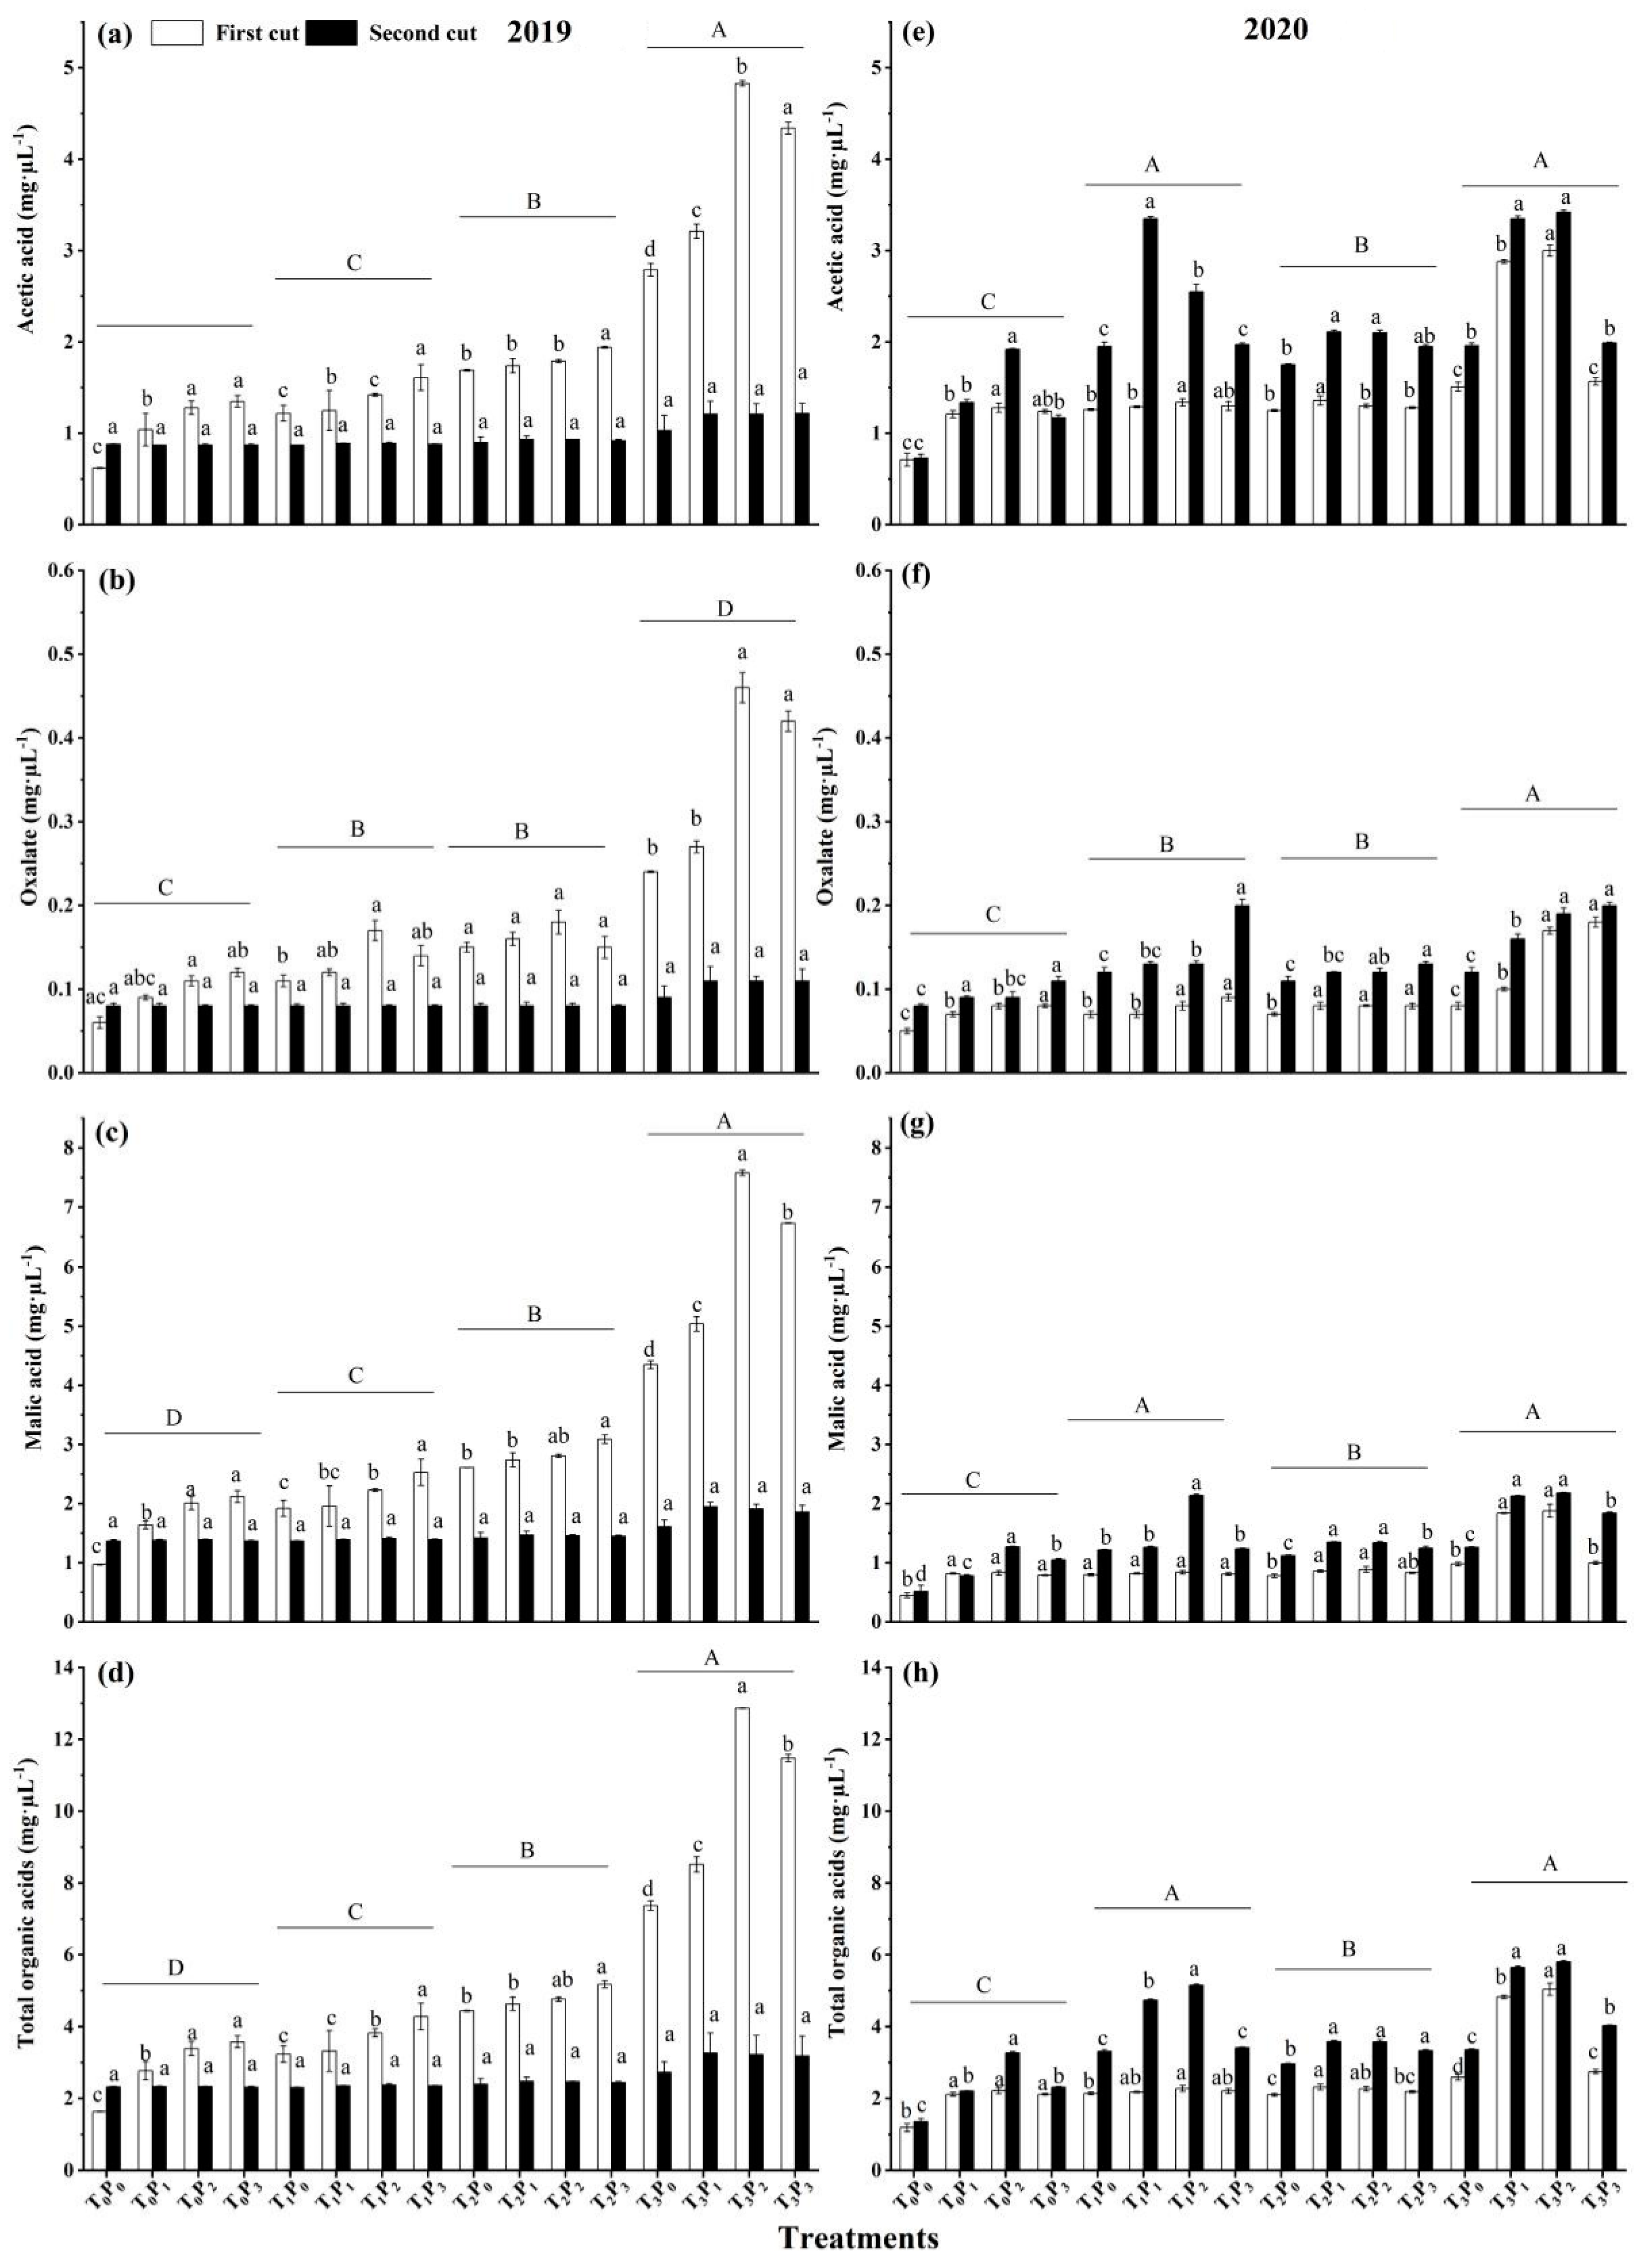
3.2. The Changes of Organic Acid Content under Different Treatments

Under the same bacteria application conditions, the oxalic acid content (Figure 1f) gradually increased in 2020. The contents of malic acid and acetic acid in 2019–2020, and oxalic acid in 2019, showed an increasing trend in P0–P2 and a decreasing trend in P2–P3 (Figure 1a–c,e–g). Without bacteria (T0), oxalic acid content in 2019–2020 was significantly better than that in the treatment without phosphorus (p < 0.05), when the phosphorus application amount was 100 mg kg−1 (P2) (Figure 1b,f). In 2019, the content of acetic acid, oxalic acid, malic acid, and total organic acid treated with AMF (T1) was significantly better than that without phosphorus application (p < 0.05), when the phosphorus application amount was 150 mg kg−1 (P3) (Figure 1a–d). While in 2020, the content of acetic acid, oxalic acid, malic acid, and total organic acid treated with AMF (T1) was significantly better than that without phosphorus application (p < 0.05) (Figure 1e–h). Under the condition of double inoculation of AMF and PSB, the contents of acetic acid, oxalic acid, malic acid, and total organic acid, in 2019, were significantly higher than those without phosphorus application (p < 0.05), when the phosphorus application amount was 150 mg kg−1 (P3) (Figure 1a–d). From 2019 to 2020, when the phosphorus application rate was 100 mg kg−1, the treatment with AMF and PSB was significantly greater than that without bacteria (p < 0.05) (Figure 1). Citric acid was not detected under phosphorus treatment. The order of organic acid content in rhizosphere soil is: acetic acid > malic acid > oxalic acid > citric acid.

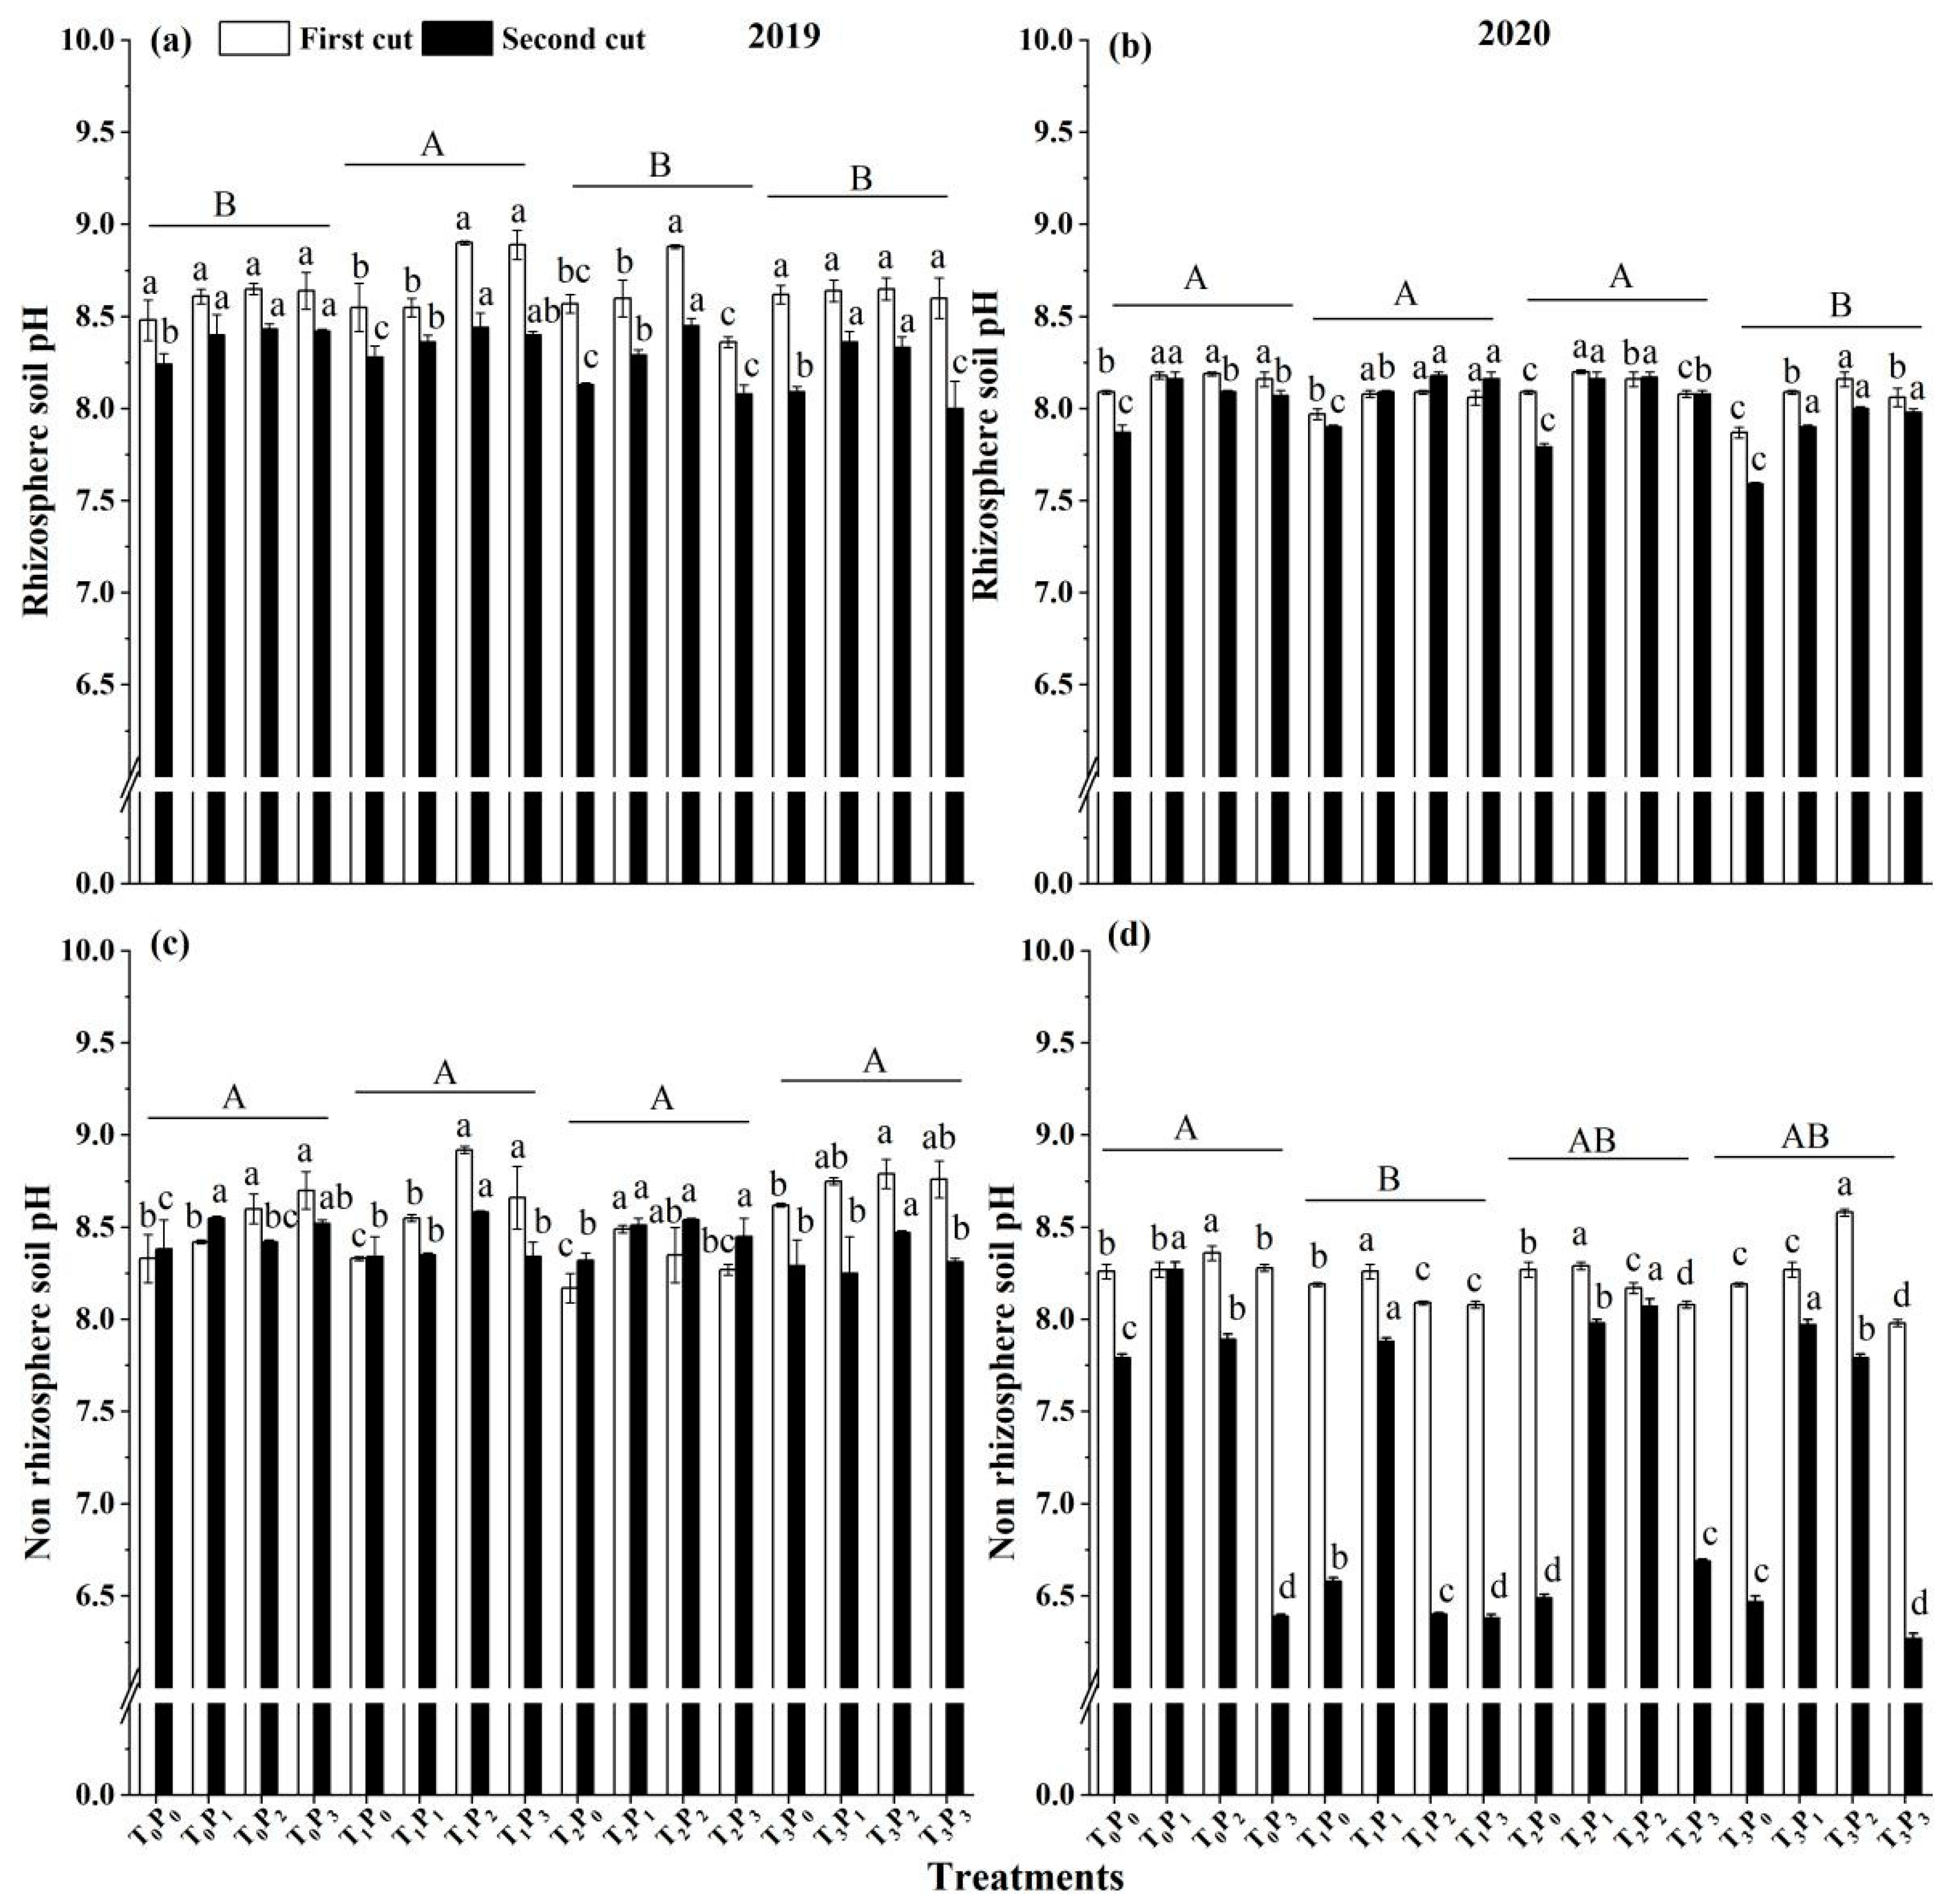
3.3. The pH Change Caused by Different Treatments in Soil

Under the same bacterial treatment, the soil pH value increased at the lower dose of P (P0–P2), while it decreased at the higher dose of P (P2–P3), from 2019 to 2020 (Figure 2). Under the condition of double inoculation of AMF and PSB bacteria (T2) in rhizosphere soil, the pH value (P2) at the phosphorus application rate of 100 mg kg−1, in 2019 and 2020, was significantly higher than that without phosphorus application (p < 0.05) (Figure 2a,b). From 2019 to 2020, the pH value of non-rhizosphere soil is similar to that of rhizosphere soil (Figure 2c,d). From 2019 to 2020, the soil pH value of the first cut is higher than the second cut.

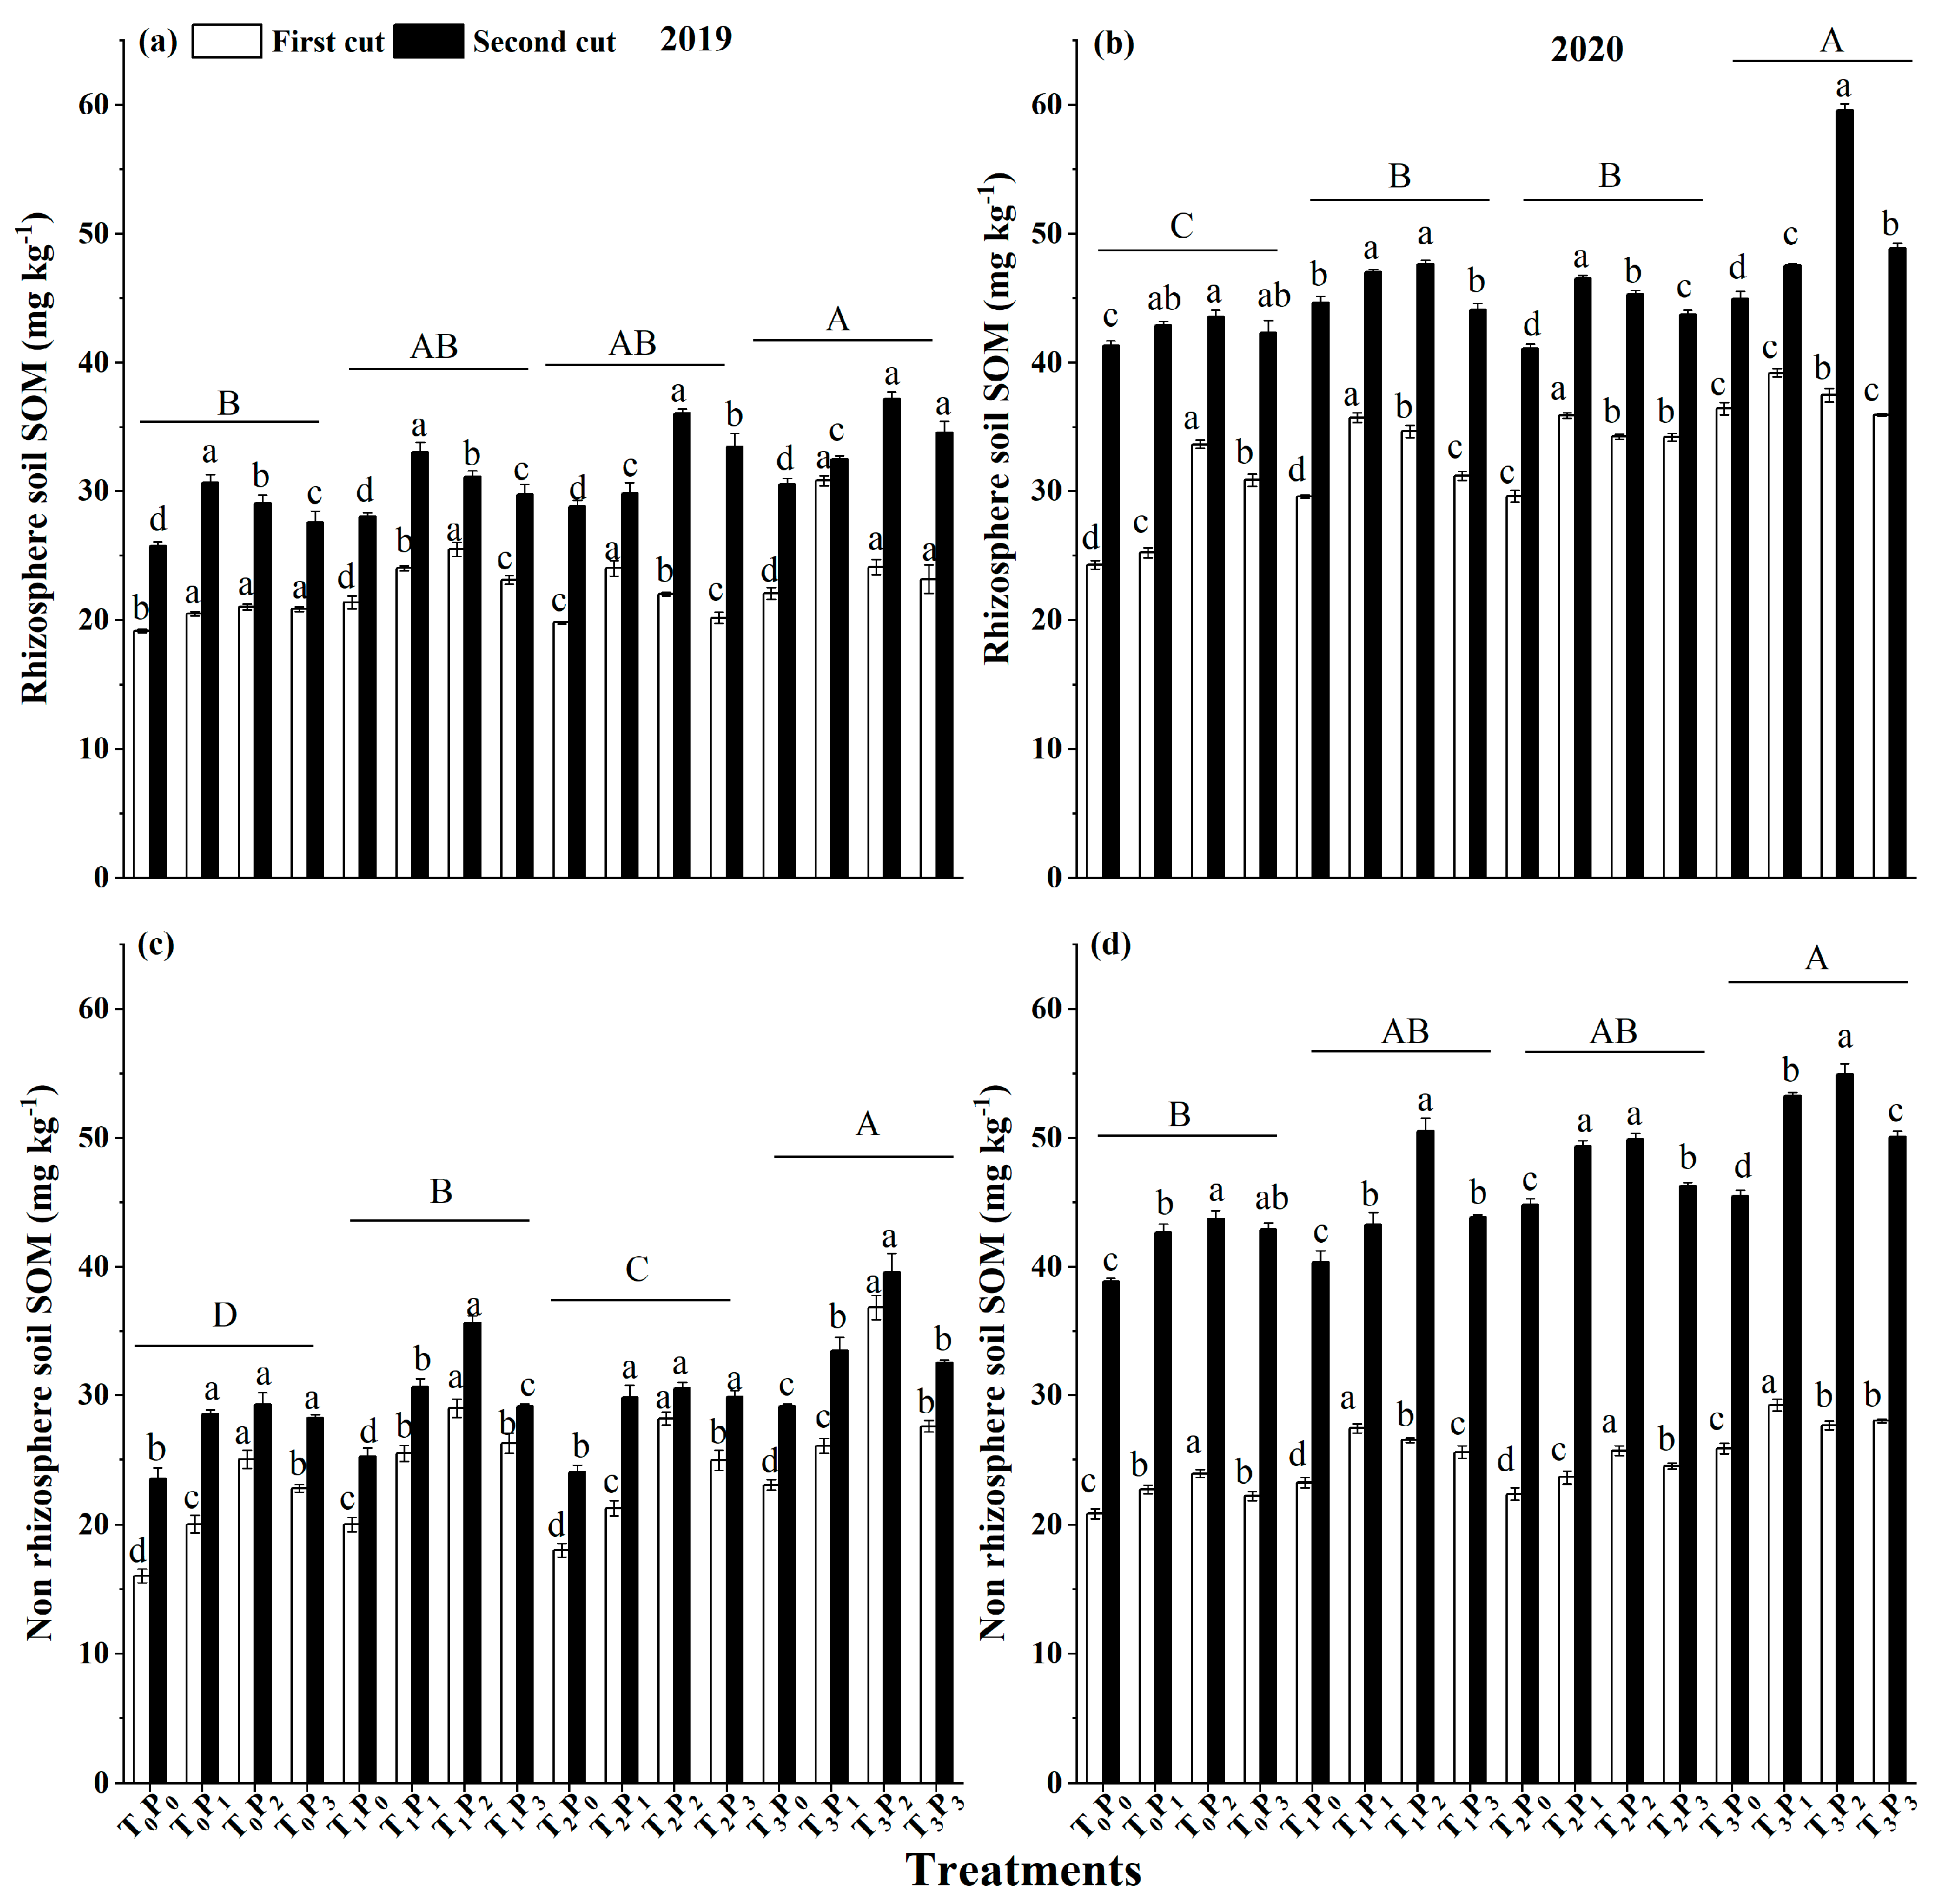
3.4. Change of Bacteria and Phosphorus Treatments on Soil Organic Matter

Under the same bacteria application conditions, the soil SOM content increased at the lower dose of P (P0–P2), while it decreased at the higher dose of P (P2–P3) (Figure 3). In the rhizosphere soil, under the condition of double inoculation of AMF and PSB bacteria, the SOM content of 100 mg kg1 (P2) phosphorus application, in 2019 and 2020, was significantly higher than that of without phosphorus application (P0) (p < 0.05) (Figure 3a,b). In non-rhizosphere soil, under the condition of double inoculation of AMF and PSB bacteria, the SOM content of phosphorus application treatment was significantly higher than that of no phosphorus application treatment (p < 0.05). When the phosphorus application amount was 100 mg kg1, the SOM content of the treatment with AMF and PSB was significantly higher than that of the treatment without bacteria application (p < 0.05).

3.5. Correlation Analysis of Each Index

Pearson correlation analysis showed that AKP in the soil was significantly positively correlated with malic acid, oxalic acid, total organic acid, and pH value (p < 0.01), and significantly positively correlated with acetic acid, and SOM content (p < 0.05) (Table 5). Malic acid was positively correlated with oxalic acid, total organic acid, and SOM (p < 0.01). Oxalic acid was positively correlated with acetic acid, total organic acid, and SOM (p < 0.01). There was a significant positive correlation between total organic acids and SOM (p < 0.01). There was a significant positive correlation between pH value and SOM (p < 0.01). This may be due to the positive regulation between AKP, acetic acid, malic acid, total organic acid, SOM, and pH value in soil, and the promotion between them. pH value was negatively correlated with oxalic acid.

3.6. Principal Component Analysis (PCA)

Based on the relevant analysis, we analyzed the main components of the total amount of alkaline phosphatase, organic matter, pH value in soil, malic acid, oxalic acid, acetic acid, and organic acid in the rhizosphere soil (Figure 4). The results showed that the variance contribution rate of axis 1 (Principal component 1, PC1) was 79.55%, that of axis 2 (Principal component 2, PC2) was 15.30%, and the cumulative contribution rate of PC1 and PC2 was 94.85%. Therefore, it can represent the original 7 indexes, the related indexes of PC1 were pH value in soil, organic matter, and AKP, and the indexes related to PC2 include malic acid, oxalic acid, acetic acid, and organic acid. The PC1 eigenvalues were sorted as T3P2 > T3P3 > T3P1 > T3P0. According to the characteristic value of each treatment on two factors and the contribution rate of the factor, the comprehensive evaluation model is Y = 0.796Y1 (PC1) + 0.153Y2 (PC2). The greater “Y” value indicates that the treatment has the best effect on soil fertility. The top three were T3P2 > T3P1 > T3P3 for processing.

4. Discussion

4.1. Effects of Inoculating AMF and PSB on Phosphatase Activity in Soil under Different Phosphorus Applications

The AKP is the key enzyme in the soil phosphorus cycle and directly affects the effectiveness of soil phosphorus [21]. The results showed that in the Fm treatment group, with the increase of phosphorus application, the activity of AKP in soil increased at the lower dose of P (P0–P2), while it decreased at the higher dose of P (P2–P3); the results of the Bm group and the Fm × Bm group were similar to those above, and the application of phosphorus fertilizer in alfalfa was better than that without phosphorus fertilizer. Under the condition of phosphorus application of 100 mg kg−1, Fm × Bm treatment was significantly higher than that of the control group (Table 4). The results showed that the addition of AMF and PSB could increase the content of organic matter and nutrients in the soil, promote the metabolism of alfalfa root exudates, and make the microbial life activities more vigorous, thus improving the activities of various soil enzymes [22].
In different soil, AMF has different effects on phosphatase activity in the soil and AKP. Inoculation with AMF can significantly enhance phosphatase activity in the soil and can then significantly improve its phosphorus utilization rate. For instance, inoculation with Glomus intraradices can enhance the activities of acid phosphatase and AKP of Ipomoea carnnea [23]. Inoculating Glomus on soybean (Glycine max L.) could enhance phosphatase activity in rhizosphere soil [24]. Mycorrhizal maize plants also enhanced phosphatase activity in soil [25]. In Citrus rhizosphere soil, the activity of phosphatases in soil increased significantly after inoculation with AMF [26]. In rhizosphere soil, the carbon source provided by plant root exudates promotes the reproduction of phosphatase-producing microorganisms [27], thus improving the phosphatase activity of rhizosphere soil. Therefore, inoculation plays a key role in improving phosphatase activity in the soil.

4.2. Effects of Inoculating AMF and PSB on Organic Acid Content under Different Phosphorus Applications

Phosphorus solubilizing microorganisms mainly produce organic acids, phosphatase, and hydrogen protons, and the main way is to produce organic acids. These organic acids can chelate with calcium, aluminum, and iron plasma, while reducing the pH value of the reaction solution, so that insoluble phosphorus can be transformed into effective phosphorus for plant use [28]. The results showed that the contents of malic acid, oxalic acid, and acetic acid in the Fm × Bm treatment group increased at low dose of P (P0–P2), while it decreased at the higher dose of P (P2–P3). Under the condition of phosphorus application of 100 mg kg−1, the contents of malic acid, oxalic acid, and acetic acid in the Fm × Bm treatment group were better than those in no bacteria treatment (Figure 1). Among them, the order of organic acid content in rhizosphere soil was: acetic acid > malic acid > oxalic acid > citric acid. Citric acid was not detected in the soil, which may be due to the low use efficiency of phosphorus in root exudates, and the different types of organic acids secreted by different plants to the medium are different [29]. Meanwhile, the phosphatase activity in the soil was significantly positively correlated with malic acid, oxalic acid, acetic acid, total organic acid, and pH value in the soil, indicating that many physiological metabolic processes in plants were closely related to malic acid, citric acid, oxalic acid, and acetic acid [30].
With the increase of organic acid content, the microbial population, structure, and enzyme activity in the rhizosphere soil also changed significantly, which improved the phosphorus absorption conditions, thus it increased the phosphorus availability in the rhizosphere soil and enhanced the phosphorus absorption capacity of plants [31,32]. Studies have shown that soybean root exudates can significantly promote the growth of rhizosphere bacteria, and the presence of bacteria can also promote the secretion of root organic acids [33]. Meanwhile, fungi can also change the composition and content of organic acids in soil [34]. It can be seen that organic acids secreted by roots and microbial activity are mutually utilized and promoted.

4.3. Effects of Inoculating AMF and PSB on pH Value and SOM Content in Soil under Different Phosphorus Applications

The pH value is not only an index reflecting pH intensity in the soil, but also one of the important factors affecting phosphorus absorption in soil and utilization. The results showed that in the Fm × Bm treatment group, the soil pH value increased at the lower dose of P (P0–P2), while it decreased at the higher dose of P (P2–P3); Fm and Bm had similar results with the above treatment groups (Figure 2). This was because the AM mycelium activity directly affected the secretion of roots, resulting in the change of pH value in rhizosphere soil, and indirectly stimulated the reproduction of phosphorus bacteria and fungi in the rhizosphere. Thus, the absorption, utilization, and transformation of insoluble phosphorus in soil can be greatly accelerated [27]. At the same time, physical or chemical changes in the surrounding environment will directly affect the mycorrhiza, resulting in changes in the pH value of the rhizosphere, and even the microbial flora in the rhizosphere [28]. Therefore, AMF and dephosphorizing bacteria affect the organic acids secreted by roots, and then affect the pH value in the soil.
The SOM is an important indicator of soil fertility. As the largest carbon pool of the terrestrial ecosystem, it not only provides nutrients for crop growth and development but also provides energy for soil microbial decomposition activities. It can be seen that SOM content is crucial for soil respiration [35]. The results showed that in the Fm × Bm treatment group, the content of SOM in the soil increased at the lower dose of P (P0–P2), while it decreased at the higher dose of P (P2–P3). The SOM content in 2020 was higher than that in 2019, and the content of SOM in rhizosphere soil was higher than that in non-rhizosphere soil (Figure 3). This may be because the organic acids and enzymes secreted by microorganisms after inoculation promote the release of soil nutrients, promote the physiological metabolism of plants and the growth and development of plants, enhance the transpiration, and promote the activation and migration of nutrients in the soil and the enrichment in the rhizosphere [11].
After applying phosphate fertilizer, the interaction between AMF and PSB directly or indirectly affected the content of SOM, pH value in the soil, AKP, and organic acid. The specific performance was as follows: mixed inoculation was better than single inoculation, and single inoculation was better than non-inoculation. The main reason is that the inoculated plants can absorb more NH4+ than the non-inoculated plants, the cells can assimilate ammonia, and the H+ exudates, which reduces the pH value, thus affecting the bioavailability of insoluble phosphorus in minerals [36]. As am mycelium releases secretion, it secretes extracellular enzymes (such as ALP and ACP) by stimulating soil microbial activities, thereby increasing the content of organic acids and alkaline phosphatase activity [37]. Alkaline phosphatase can effectively convert immobilized phosphorus into bioavailable phosphorus by enhancing the hydrolysis and cleavage of Po, SO, and PC bonds of organic phosphorus, while PSB can effectively convert immobilized phosphorus into bioavailable phosphorus through appropriate alkaline phosphatase activity [38].
In conclusion, the present study showed that the phosphorus application of 100 mg kg1 and inoculation with AMF and PSB could significantly promote fertility in the soil field of alfalfa. Under the Fm × Bm treatment group, the activity of AKP in the soil, organic acid, pH value, and content of SOM increased at the lower dose of phosphorus, while it decreased at the higher dose of phosphorus. The order of organic acid content in rhizosphere soil was: acetic acid > malic acid > oxalic acid > citric acid. The results showed that the phosphorus application of 100 mg kg1 and the mixed inoculation of AMF (Fm) and PSB (Bm) could increase the phosphatase activity in alfalfa soil, promote the secretion of organic acids in rhizosphere soil, and then increase the content of SOM in alfalfa soil and improve soil fertility.

Author Contributions

Q.Z. and J.L. designed the study. J.L. interpreted the results. X.A., J.L. and X.L. performed the experiments. X.A. and J.L. participated in writing the manuscript: C.M. supervised the study. All authors have read and agreed to the published version of the manuscript.

Funding

National Natural Science Foundation of China, Grant/Award Number: 32001400; Fok Ying Tung Education Foundation of China, Grant/Award Number: 171099; Science and Technology Innovation Key Talent Project of Xinjiang Production and Construction Corps, Grant/Award Number: 2021CB034; China Agriculture Research System of MOF and MARA.

Institutional Review Board Statement

Not applicable.

Informed Consent Statement

Not applicable.

Data Availability Statement

Please contact the authors for all requests.

Acknowledgments

The authors would like to acknowledge the College of Animal Science & Technology, Shihezi University, for supporting our study.

Conflicts of Interest

The authors declare that they have no competing interest.

Abbreviations

AMFArbuscular mycorrhizal fungi
AKPAlkaline phosphatase activity
BmBacillus megaterium
FmFunneliformis mosseae
PSBPhosphate solubilizing bacteria
PPhosphorus
SOMSoil organic matter

References

  1. Zhang, Q.; Liu, J.; Liu, X.; Li, S.; Sun, Y.; Lu, W.; Ma, C. Optimizing water and phosphorus management to improve hay yield and water- and phosphorus-use efficiency in alfalfa under drip irrigation. Food Sci. Nutr. 2020, 8, 2406–2418. [Google Scholar] [CrossRef]
  2. Wang, S.; Xiao, J.; Wan, L.; Zhou, Z.; Wang, Z.; Song, C.; Zhou, Y.; Cao, X. Mutual Dependence of Nitrogen and Phosphorus as Key Nutrient Elements: One Facilitates Dolichospermum flos-aquae to Overcome the Limitations of the Other. Environ. Sci. Technol. 2018, 52, 5653–5661. [Google Scholar] [CrossRef]
  3. Berg, W.K.; Lissbrant, S.; Cunningham, S.M.; Brouder, S.M.; Volenec, J.J. Phosphorus and potassium efects on taproot C and N reserve pools and long-term persistence of alfalfa (Medicago sativa L.). Plant Sci. 2018, 272, 301–308. [Google Scholar] [CrossRef] [PubMed]
  4. Kucey, R.M.N. Phosphate-Solubilizing Bacteria and Fungi in Various Cultivated and Virgin Alberta Soils. Can. J. Soil Sci. 1983, 63, 671–678. [Google Scholar] [CrossRef]
  5. Pandit, A.; Adholeya, A.; Cahill, D.; Brau, L.; Kochar, M. Microbial biofilms in nature: Unlocking their potential for agricultural applications. J. Appl. Microbiol. 2020, 129, 199–211. [Google Scholar] [CrossRef] [PubMed]
  6. Liu, M.; Che, Y.; Wang, L.; Zhao, Z.; Zhang, Y.; Wei, L.; Xiao, Y. Rice straw biochar and phosphorus inputs have more positive effects on the yield and nutrient uptake of Lolium multiflorum than arbuscular mycorrhizal fungi in acidic Cd-contaminated soils. Chemosphere 2019, 235, 32–39. [Google Scholar] [CrossRef] [PubMed]
  7. Liu, J.Y.; Hui, J.F.; Sun, M.Y.; Liu, X.S.; Lu, W.H.; Ma, C.H.; Zhang, Q.B. Effects of phosphorus application level, inoculation of AMF and Phosphorus Solubilizing Bacteria on Alfalfa Yield and phosphorus utilization efficiency. J. Agric. Eng. 2020, 36, 142–149. [Google Scholar] [CrossRef]
  8. Bolan, N. A critical review on the role of mycorrhizal fungi in the uptake of phosphorus by plants. Plant Soil 1991, 134, 189–207. [Google Scholar] [CrossRef]
  9. Javot, H.; Pumplin, N.; Harrison, M.J. Phosphate in the arbuscular mycorrhizal symbiosis: Transport properties and regulatory roles. Plant Cell Environ. 2006, 30, 310–322. [Google Scholar] [CrossRef] [PubMed]
  10. Louche, J.; Ali, M.A.; Hurteau, B.C. Efciency of acid phosphatases secreted from the ectomycorrhizal fungus Hebeloma cylindrosporum to hydrolyse organic phosphorus in podzols. FEMS Microbiol. Ecol. 2010, 73, 323–335. [Google Scholar] [PubMed] [Green Version]
  11. Rodríguez, H.; Fraga, R.; Gonzalez, T.; Bashan, Y. Genetics of phosphate solubilization and its potential applications for improving plant growth-promoting bacteria. Plant Soil 2006, 287, 15–21. [Google Scholar] [CrossRef]
  12. Xie, X.; Weng, B.; Cai, B.; Dong, Y.; Yan, C. Effects of arbuscular mycorrhizal inoculation and phosphorus supply on the growth and nutrient uptake of Kandelia obovata (Sheue, Liu & Yong) seedlings in autoclaved soil. Appl. Soil Ecol. 2014, 75, 162–171. [Google Scholar] [CrossRef]
  13. Wang, Q.; Bao, Y.; Liu, X.; Du, G. Spatio-temporal dynamics of arbuscular mycorrhizal fungi associated with glomalin-related soil protein and soil enzymes in different managed semiarid steppes. Mycorrhiza 2014, 24, 525–538. [Google Scholar] [CrossRef]
  14. Gomezjurado, M.E.G.; de Abreu, L.M.; Marra, L.M.; Pfenning, L.H.; Moreira, F.M.D.S. Phosphate Solubilization by Several Genera of Saprophytic fungi and Its Influence on Corn and Cowpea Growth. J. Plant Nutr. 2014, 38, 675–686. [Google Scholar] [CrossRef]
  15. Liang, J.-L.; Liu, J.; Jia, P.; Yang, T.-T.; Zeng, Q.-W.; Zhang, S.-C.; Liao, B.; Shu, W.-S.; Li, J.-T. Novel phosphate-solubilizing bacteria enhance soil phosphorus cycling following ecological restoration of land degraded by mining. ISME J. 2020, 14, 1600–1613. [Google Scholar] [CrossRef]
  16. Saxena, J.; Rawat, J.; Sanwal, P. Enhancement of Growth and Yield of Glycine max Plants with Inoculation of Phosphate Solubilizing Fungus Aspergillus niger K7 and Biochar Amendment in Soil. Commun. Soil Sci. Plant Anal. 2016, 47, 2334–2347. [Google Scholar] [CrossRef]
  17. Wang, Z.Q.; Li, Y.B.; Tan, X.P.; He, W.; Xie, W.; Megharaj, M.; Wei, G.H. Effect of arsenate contamination on free, immobilized and soil alkaline phosphatases: Activity, kinetics and thermodynamics. Eur. J. Soil Sci. 2016, 68, 126–135. [Google Scholar] [CrossRef]
  18. Ma, H.; Li, X.; Wei, M.; Zeng, G.; Hou, S.; Li, D.; Xu, H. Elucidation of the mechanisms into effects of organic acids on soil fertility, cadmium speciation and ecotoxicity in contaminated soil. Chemosphere 2020, 239, 124706. [Google Scholar] [CrossRef]
  19. Liu, B.; Schieber, J.; Mastalerz, M.; Teng, J. Organic matter content and type variation in the sequence stratigraphic context of the Upper Devonian New Albany Shale, Illinois Basin. Sediment. Geol. 2019, 383, 101–120. [Google Scholar] [CrossRef]
  20. Chatterjee, S. A New Coefficient of Correlation. J. Am. Stat. Assoc. 2020, 116, 2009–2022. [Google Scholar] [CrossRef]
  21. Shaw, A.N.; Cleveland, C.C. The effects of temperature on soil phosphorus availability and phosphatase enzyme activities: A cross-ecosystem study from the tropics to the Arctic. Biogeochemistry 2020, 151, 113–125. [Google Scholar] [CrossRef]
  22. Ghorchiani, M.; Etesami, H.; Alikhani, H.A. Improvement of growth and yield of maize under water stress by co-inoculating an arbuscular mycorrhizal fungus and a plant growth promoting rhizobacterium together with phosphate fertilizers. Agric. Ecosyst. Environ. 2018, 258, 59–70. [Google Scholar] [CrossRef]
  23. Amaya-Carpio, L.; Davies, F.; Fox, T.; He, C. Arbuscular mycorrhizal fungi and organic fertilizer influence photosynthesis, root phosphatase activity, nutrition, and growth of Ipomoea carnea ssp. fistulosa. Photosynthetica 2009, 47, 1–10. [Google Scholar] [CrossRef]
  24. Abdelfattah, G.M.; Asrar, A.; Al-Amri, S.M.; Abdel-Salam, E. Influence of arbuscular mycorrhiza and phosphorus fertilization on the gas exchange, growth and phosphatase activity of soybean (Glycine max L.) plants. Photosynthetica 2014, 52, 581–588. [Google Scholar] [CrossRef]
  25. Wang, F.; Jiang, R.; Kertesz, M.A.; Zhang, F.; Feng, G. Arbuscular mycorrhizal fungal hyphae mediating acidification can promote phytate mineralization in the hyphosphere of maize (Zea mays L.). Soil Biol. Biochem. 2013, 65, 69–74. [Google Scholar] [CrossRef]
  26. Wu, Q.-S.; Zou, Y.-N.; He, X.-H. Differences of hyphal and soil phosphatase activities in drought-stressed mycorrhizal trifoliate orange (Poncirus trifoliata) seedlings. Sci. Hortic. 2011, 129, 294–298. [Google Scholar] [CrossRef]
  27. Zhang, L.; Xu, M.; Liu, Y.; Zhang, F.; Hodge, A.; Feng, G. Carbon and phosphorus exchange may enable cooperation between an arbuscular mycorrhizal fungus and a phosphate-solubilizing bacterium. New Phytol. 2016, 210, 1022–1032. [Google Scholar] [CrossRef]
  28. Wen, Z.; Li, H.; Shen, Q.; Tang, X.; Xiong, C.; Li, H.; Pang, J.; Ryan, M.H.; Lambers, H.; Shen, J. Tradeoffs among root morphology, exudation and mycorrhizal symbioses for phosphorus-acquisition strategies of 16 crop species. New Phytol. 2019, 223, 882–895. [Google Scholar] [CrossRef]
  29. De Oliveira, I.F.; Simeone, M.L.F.; de Guimarães, C.C.; Garcia, N.S.; Schaffert, R.E.; de Sousa, S.M. Sorgoleone concentration influences mycorrhizal colonization in sorghum. Mycorrhiza 2020, 31, 259–264. [Google Scholar] [CrossRef]
  30. Aoki, M.; Fujii, K.; Kitayama, K. Environmental Control of Root Exudation of Low-Molecular Weight Organic Acids in Tropical Rainforests. Ecosystems 2012, 15, 1194–1203. [Google Scholar] [CrossRef]
  31. Tewari, R.K.; Kumar, P.; Sharma, P.N. Oxidative Stress and Antioxidant Responses in Young Leaves of Mulberry Plants Grown Under Nitrogen, Phosphorus or Potassium Deficiency. J. Integr. Plant Biol. 2007, 49, 313–322. [Google Scholar] [CrossRef]
  32. Chen, L.-S.; Tang, N.; Jiang, H.-X.; Yang, L.-T.; Li, Q.; Smith, B.R. Changes in organic acid metabolism differ between roots and leaves of Citrus grandis in response to phosphorus and aluminum interactions. J. Plant Physiol. 2009, 166, 2023–2034. [Google Scholar] [CrossRef] [PubMed]
  33. Saeki, Y.; Yamakawa, T.; Ikeda, M.; Ikeda, M.; Ishizuka, J.J. Effects of root exudates of Rj2Rj3- and Rj4- genotype soybeans on growth and chemotaxis of Bradyrhizobium japonicum. Soil Sci Plant Nutr. 1996, 42, 413–417. [Google Scholar] [CrossRef]
  34. Bavaresco, L.; Colla, R.; Fogher, C. Different responses to root infection with endophytic microorganisms of Vitis vinifera L. cv. pinot blanc grown on calcareous soil. J. Plant Nutr. 2000, 23, 1107–1116. [Google Scholar] [CrossRef]
  35. Kumar, A.; Dwivedi, G.K.; Tewari, S.; Paul, J.; Anand, R.; Kumar, N.; Kumar, P.; Singh, H.; Kaushal, R. Carbon Mineralization and Inorganic Nitrogen Pools under Terminalia chebula Retz.-Based Agroforestry System in Himalayan Foothills, India. For. Sci. 2020, 66, 634–643. [Google Scholar] [CrossRef]
  36. Matse, D.T.; Huang, C.-H.; Huang, Y.-M.; Yen, M.-Y. Nitrogen uptake and growth of white clover inoculated with indigenous and exotic Rhizobium strains. J. Plant Nutr. 2020, 43, 2013–2027. [Google Scholar] [CrossRef]
  37. Cao, J.; Huang, Y.; Wang, C. Rhizosphere interactions between earthworms (Eisenia fetida) and arbuscular mycorrhizal fungus (Funneliformis mosseae) promote utilization efficiency of phytate phosphorus in maize. Appl. Soil Ecol. 2015, 94, 30–39. [Google Scholar] [CrossRef]
  38. Yu, X.-J.; Chen, Q.; Shi, W.-C.; Gao, Z.; Sun, X.; Dong, J.-J.; Li, J.; Wang, H.-T.; Gao, J.-G.; Liu, Z.-G.; et al. Interactions between phosphorus availability and microbes in a wheat–maize double cropping system: A reduced fertilization scheme. J. Integr. Agric. 2022, 21, 840–854. [Google Scholar] [CrossRef]
Figure 1. Organic acid content in rhizosphere soil under different treatments in 2019–2020. Note: P0, P1, P2, and P3 represent 0 mg kg–1, 50 mg kg–1, 100 mg kg–1, and 150 mg kg–1, respectively. T0, T1, T2, and T3 represent CK, Fm, Bm, and Fm × Bm, respectively. In the figure: (a)—acetic acid, (b)—oxalate, (c)—malic acid, and (d)—total organic acids, in 2019, (e)—acetic acid, (f)—oxalate, (g)—malic acid, and (h)—total organic acids, in 2020. In the acetic acid diagram, different capital letters indicate that there are significant differences between different bacterial treatments under the same phosphorus application conditions (p < 0.05), and different lowercase letters indicate that there are significant differences between different phosphorus application treatments under the same bacterial conditions (p < 0.05). The value of n is 48. The same below.
Sustainability 14 11342 g001
Figure 2. The pH in rhizosphere soil and non-rhizosphere soil under different treatments in 2019–2020. Note: P0, P1, P2, and P3 represent 0 mg kg–1, 50 mg kg–1, 100 mg kg–1, and 150 mg kg–1, respectively. T0, T1, T2, and T3 represent CK, Fm, Bm, and Fm × Bm, respectively. In the figure: (a)—pH value of rhizosphere soil, (c)—pH value of non-rhizosphere soil, in 2019, (b)—pH value of rhizosphere soil, (d)—pH value of non-rhizosphere soil, in 2020. In the figure, different capital letters indicate that there are significant differences between different bacterial treatments under the same phosphorus application conditions (p < 0.05), and different lowercase letters indicate that there are significant differences between different phosphorus application treatments under the same bacterial conditions (p < 0.05). The same below.
Sustainability 14 11342 g002
Figure 3. Soil organic matter in rhizosphere soil and non-rhizosphere soil under different treatments in 2019–2020. Note: P0, P1, P2, and P3 represent 0 mg kg–1, 50 mg kg–1, 100 mg kg–1, and 150 mg kg–1, respectively. T0, T1, T2, and T3 represent CK, Fm, Bm, and Fm × Bm, respectively. In the figure: (a)—soil organic matter of rhizosphere soil, (c)—soil organic matter of non-rhizosphere soil, in 2019, (b)—soil organic matter of rhizosphere soil, (d)—soil organic matter of non-rhizosphere soil, in 2020. In the figure, different capital letters indicate that there are significant differences between different bacterial treatments under the same phosphorus application conditions (p < 0.05), and different lowercase letters indicate that there are significant differences between different phosphorus application treatments under the same bacterial conditions (p < 0.05). The same below.
Sustainability 14 11342 g003
Figure 4. Principal component analysis of each index in 2019–2020. Note: P0, P1, P2, and P3 represent 0 mg kg–1, 50 mg kg–1, 100 mg kg–1, and 150 mg kg–1, respectively. T0, T1, T2, and T3 represent CK, Fm, Bm, and Fm × Bm, respectively. Black, red, green, and yellow represent T0, T1, T2, and T3, respectively. ●, ▲, Sustainability 14 11342 i001 and ■ represent P0, P1, P2, and P3, respectively.
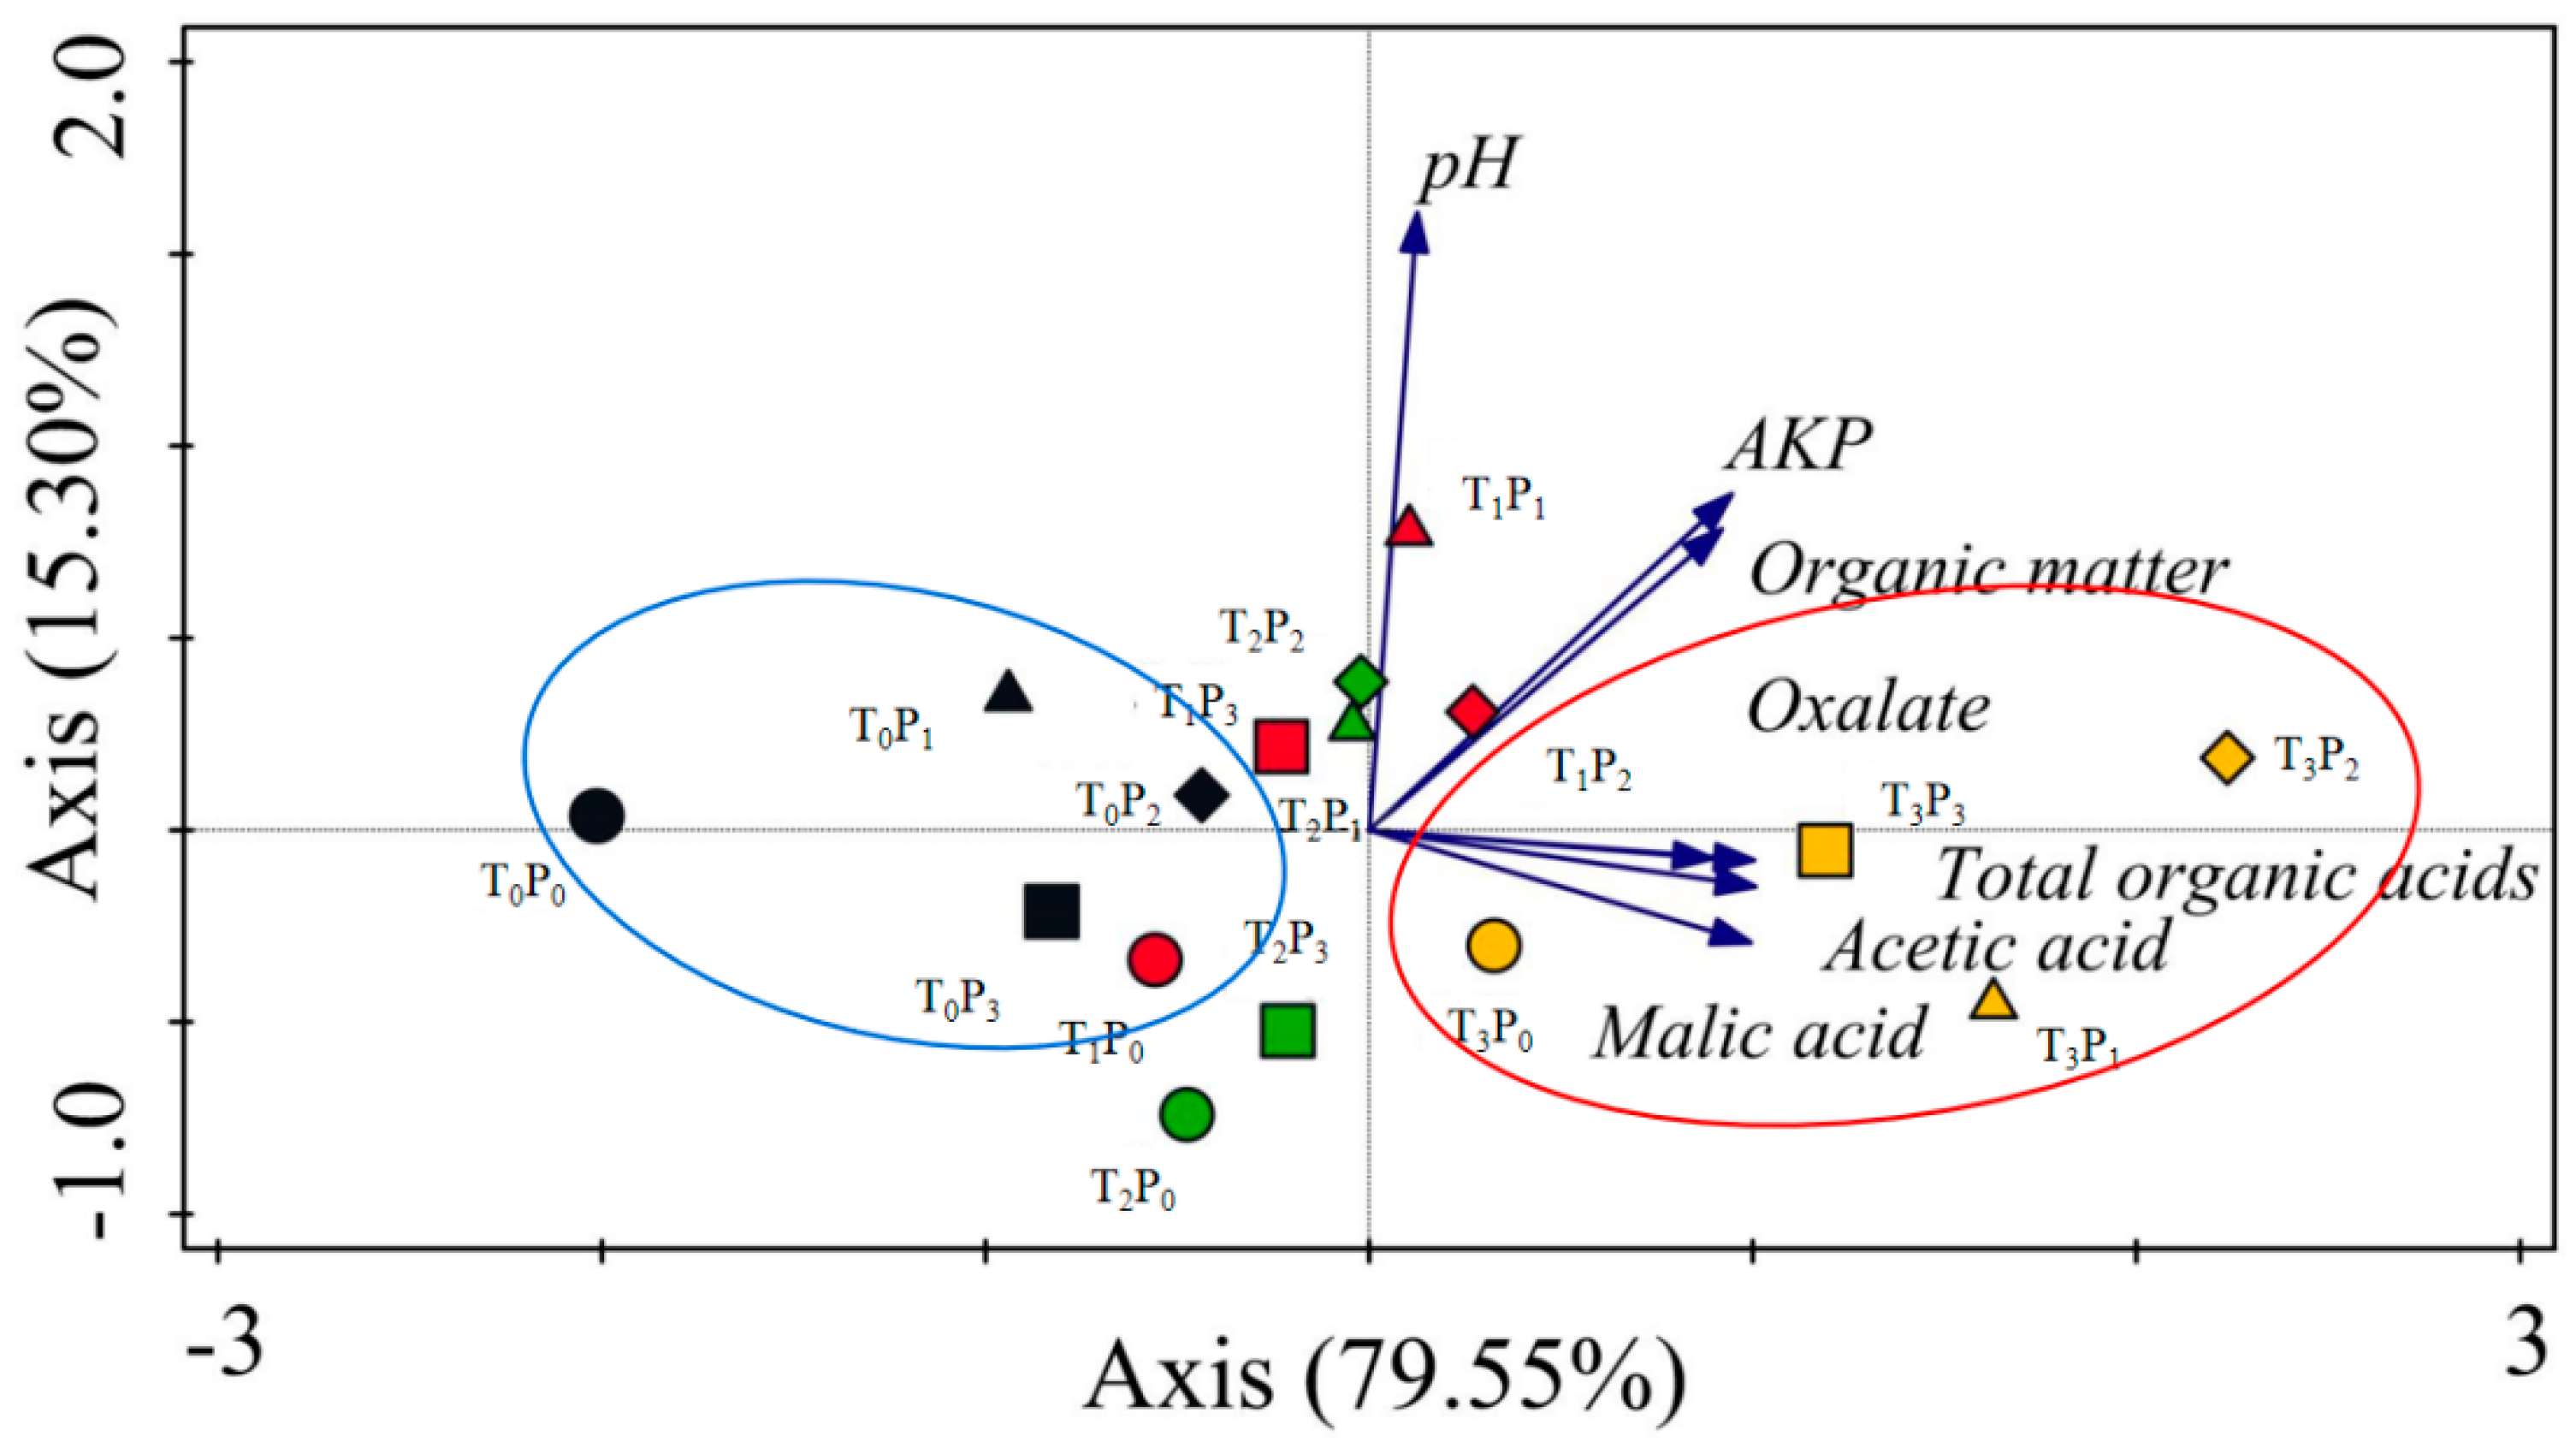
Sustainability 14 11342 g004
Table 1. Treatment application scheme.
TreatmentsFunneliformis mosseae
(Fm, T1)
Bacillus megaterium
(Bm, T2)
Double Inoculation
(Fm × Bm, T3)
No Inoculation Bacteria
(CK, T0)
0 mg kg−1
(P0)
T1P0T2P0T3P0T0P0
50 mg kg−1
(P1)
T1P1T2P1T3P1T0P1
100 mg kg−1
(P2)
T1P2T2P2T3P2T0P2
150 mg kg−1
(P3)
T1P3T2P3T3P3T0P3
Note: P0, P1, P2, and P3 represent 0 mg kg–1, 50 mg kg–1, 100 mg kg–1, and 150 mg kg–1, respectively. T0, T1, T2, and T3 represent CK, Fm, Bm, and Fm × Bm, respectively.
Table 2. Basic physical and chemical properties of test soil.
Bulk Density/
(g cm−3)
Alkaline-N/
(mg kg−1)
Organic
Matter/
(g kg−1)
Available
Phosphorus/
(mg kg−1)
Total
Phosphorus/
(g kg−1)
Available K/
(mg kg−1)
1.4872.624.2818.170.21135.6
Table 3. Fertilizer application scheme.
NumberTreatmentsNH4H2PO4
(mg pot−1)
(Containing N 12.2%)
CN2H4O
(mg pot−1)
(Containing N 46%)
Funneliformis mosseae
(g pot−1)
Bacillus megaterium
(mL pot−1)
1T0P00105.300
2T0P135.172.900
3T0P272.935.100
4T0P3105.3000
5T1P00105.3100
6T1P135.172.9100
7T1P272.935.1100
8T1P3105.30100
9T2P00105.3010
10T2P135.172.9010
11T2P272.935.1010
12T2P3105.30010
13T3P00105.355
14T3P135.172.955
15T3P272.935.155
16T3P3105.3055
Note: P0, P1, P2, and P3 represent 0 mg kg–1, 50 mg kg–1, 100 mg kg–1, and 150 mg kg–1, respectively. T0, T1, T2, and T3 represent CK, Fm, Bm, and Fm × Bm, respectively.
Table 4. Alkaline phosphatase activity in rhizosphere soil and non-rhizosphere soil under different treatments.
Treat-mentsRhizosphere Soil AKP in 2019Non-Rhizosphere Soil AKP in 2019Rhizosphere Soil AKP in 2020Non-Rhizosphere Soil AKP in 2020
First CutSecond CutFirst CutSecond CutFirst CutSecond CutFirst CutSecond Cut
T0P02.76 ± 0.04 Cc6.03 ± 0.09 Cd3.32 ± 0.06 Cc6.70 ± 0.09 Bb1.84 ± 0.01 Cd1.08 ± 0.03 Dd1.09 ± 0.02 Dc1.11 ± 0.04 Dd
T0P13.18 ± 0.08 Ba6.62 ± 0.08 Bc3.63 ± 0.05 Bb7.11 ± 0.03 Aa2.16 ± 0.02 Dc2.11 ± 0.05 Da1.86 ± 0.06 Da1.88 ± 0.08 Db
T0P22.93 ± 0.04 Bbc6.81 ± 0.03 Ca3.77 ± 0.05 Aa7.13 ± 0.16 Aa2.34 ± 0.01 Da1.84 ± 0.03 Db1.80 ± 0.03 Dab2.59 ± 0.07 Da
T0P32.84 ± 0.06 Cb6.53 ± 0.06 Bb3.27 ± 0.09 Bc6.88 ± 0.3 Bab2.23 ± 0.02 Cb1.49 ± 0.06 Dc1.72 ± 0.03 Bb1.65 ± 0.01 Dc
T1P03.18 ± 0.02 Ab6.29 ± 0.04 Bb3.72 ± 0.04 Ab7.19 ± 0.16 Aa2.17 ± 0.07 Bd1.87 ± 0.05 Bc1.51 ± 0.05 Bc2.15 ± 0.07 Bd
T1P13.20 ± 0.04 Bb6.32 ± 0.12 Cb3.84 ± 0.06 Aa7.21 ± 0.18 Aa2.84 ± 0.03 Ba2.97 ± 0.03 Bb2.37 ± 0.08 Ca5.21 ± 0.05 Aa
T1P23.33 ± 0.08 Aa7.19 ± 0.01 Ba3.35 ± 0.08 Bc7.13 ± 0.09 Aa2.46 ± 0.01 Cb3.72 ± 0.06 Ba2.31 ± 0.09 Ca3.31 ± 0.06 Bb
T1P33.23 ± 0.01 Ab7.17 ± 0.01 Aa3.34 ± 0.05 Bc6.89 ± 0.17 Bb2.26 ± 0.08 Cc3.01 ± 0.06 Bb1.79 ± 0.04 Bb2.87 ± 0.04 Bc
T2P03.06 ± 0.04 Bbc6.44 ± 0.13 ABb3.19 ± 0.02 Db6.91 ± 0.15 Ba2.10 ± 0.06 Bd1.72 ± 0.04 Cc1.36 ± 0.01 Cd1.54 ± 0.03 Cd
T2P13.30 ± 0.06 Aa6.63 ± 0.08 Ba3.29 ± 0.04 Ca7.07 ± 0.08 Aa2.62 ± 0.02 Cb2.32 ± 0.03 Ca2.65 ± 0.02 Bb3.10 ± 0.04 Ca
T2P23.09 ± 0.05 Bb6.36 ± 0.11 Db3.38 ± 0.03 Ba6.85 ± 0.25 Ba2.69 ± 0.02 Ba2.29 ± 0.02 Ca3.25 ± 0.06 Ba2.90 ± 0.02 Cb
T2P32.97 ± 0.06 Bc5.22 ± 0.10 Cc3.31 ± 0.06 Ba6.83 ± 0.17 Ba2.34 ± 0.03 Bc1.83 ± 0.02 Cb1.77 ± 0.01 Bc2.21 ± 0.08 Cc
T3P03.10 ± 0.03 ABb6.60 ± 0.02 Ab3.52 ± 0.06 Bd6.77 ± 0.02 Bb2.26 ± 0.01 Ad2.27 ± 0.06 Ad3.47 ± 0.05 Ac3.04 ± 0.06 Ad
T3P13.36 ± 0.06 Aa6.83 ± 0.17 Ac3.71 ± 0.08 Bc7.09 ± 0.08 Aa2.93 ± 0.06 Ab3.47 ± 0.07 Ab3.51 ± 0.11 Ac4.56 ± 0.07 Bb
T3P23.33 ± 0.07 Aa7.89 ± 0.20 Aa3.83 ± 0.02 Ab7.25 ± 0.04 Aa5.00 ± 0.01 Aa3.99 ± 0.05 Aa5.29 ± 0.13 Aa5.43 ± 0.05 Aa
T3P33.14 ± 0.09 Ab7.09 ± 0.10 Ab4.22 ± 0.02 Aa7.22 ± 0.06 Aa2.76 ± 0.05 Ac3.08 ± 0.04 Ac4.92 ± 0.06 Ab3.27 ± 0.12 Ac
T****************
P****************
T × P****************
Note: P0, P1, P2, and P3 represent 0 mg kg–1, 50 mg kg–1, 100 mg kg–1, and 150 mg kg–1, respectively. T0, T1, T2, and T3 represent CK, Fm, Bm, and Fm × Bm, respectively. In the table, different capital letters indicate that there are significant differences between different bacterial treatments under the same phosphorus application conditions (p < 0.05), and different lowercase letters indicate that there are significant differences between different phosphorus application treatments under the same bacterial conditions (p < 0.05). ** indicates significant difference extremely (p < 0.01). The same below.
Table 5. Correlation analysis of indexes of rhizosphere soil under different treatments in 2019–2020.
IndexAKPMalic AcidOxalateAcetic AcidTotal Organic AcidspH Value
Malic acid0.562 **
Oxalate0.769 **0.579 **
Acetic acid0.394 *0.1800.670 **
Total organic acids0.577 **0.984 **0.670 **0.200
pH value0.627 **0.094−0.6200.576 **0.147
Organic matter0.936 *0.613 **0.832 **0.647 **0.612 **0.618 **
Note: * Significant correlation was found at the 0.05 level (bilateral), ** significant correlation was found at the 0.01 level (bilateral).
Publisher’s Note: MDPI stays neutral with regard to jurisdictional claims in published maps and institutional affiliations.

