Learning the Indicative Patterns of Simulated Force Changes in Soil Moisture by BP Neural Networks and Finding Differences with SMAP Observations

Abstract
:1. Introduction
2. Data Set Description
2.1. CMIP5 Simulation Data
2.2. SMAP Observation Data
3. Methods
3.1. Back Propagation Neural Network (BPNN)
3.2. Deep Taylor Decomposition (DTD)
3.3. Multiple Linear Regression (MLR)
4. All Neural Network Training
4.1. Back Propagation Neural Network Training
4.2. Multiple Linear Regression Training
5. Results
5.1. Prediction Based on MLR
5.2. Prediction Based on BPNN
6. Discussions
6.1. CMIP5
6.2. Observations
6.3. Deviation of CMIP5 Simulated and Observed Data
7. Conclusions
Author Contributions
Funding
Institutional Review Board Statement
Informed Consent Statement
Data Availability Statement
Acknowledgments
Conflicts of Interest
References
- Ma, Z.; Fu, C.; Xie, L.; Chen, W.; Tao, S. Some problems in the study on the relationship between soil moisture and climatic change. Adv. Earth Sci. 2001, 16, 563–566. [Google Scholar] [CrossRef]
- Dospinescu, N.; Dospinescu, O.; Tatarusanu, M. Analysis of the Influence Factors on the Reputation of Food-Delivery Companies: Evidence from Romania. Sustainability 2020, 12, 4142. [Google Scholar] [CrossRef]
- Council, N. GOALS (Global Ocean-Atmosphere-Land System) for Predicting Seasonal-to-Interannual Climate: A Program of Observation, Modeling, and Analysis; National Academy Press: Cambridge, MA, USA, 1994. [Google Scholar]
- Shukla, J.; Mintz, Y. Influence of land-surface evapotranspiration on the earth’s climate. Science 1982, 215, 1498–1501. [Google Scholar] [CrossRef]
- Dirmeyer, P.A. Using a global soil wetness data set to improve seasonal climate simulation. J. Clim. 2000, 13, 2900–2922. [Google Scholar] [CrossRef]
- Koster, R.D.; Dirmeyer, P.A.; Guo, Z.; Bonan, G.; Chan, E.; Cox, P.; Gordon, C.T.; Kanae, S.; Kowalczyk, E.; Lawrence, D.; et al. Regions of strong coupling between soil moisture and precipitation. Science 2004, 305, 1138–1140. [Google Scholar] [CrossRef]
- Lehner, F.; Deser, C.; Maher, N.; Marotzke, J.; Fischer, E.M.; Brunner, L.; Knutti, R.; Hawkins, E. Partitioning climate projection uncertainty with multiple large ensembles and CMIP5/6. Earth Syst. Dyn. 2020, 11, 491–508. [Google Scholar] [CrossRef]
- Hawkins, E.; Sutton, R. The potential to narrow uncertainty in regional climate predictions. Bull. Am. Meteorol. Soc. 2009, 90, 1095–1108. [Google Scholar] [CrossRef]
- Cassou, C.; Kushnir, Y.; Hawkins, E.; Pirani, A.; Kucharski, F.; Kang, I.-S.; Caltabiano, N. Decadal Climate Variability and Predictability: Challenges and Opportunities. Bull. Am. Meteorol. Soc. 2018, 99, 479–490. [Google Scholar] [CrossRef]
- Mudelsee, M. Trend analysis of climate time series: A review of methods. Earth-Sci. Rev. 2019, 190, 310–322. [Google Scholar] [CrossRef]
- Thompson, D.W.; Wallace, J.M. The Arctic Oscillation signature in the wintertime geopotential height and temperature fields. Geophys. Res. Lett. 1998, 25, 1297–1300. [Google Scholar] [CrossRef] [Green Version]
- Wheeler, M.C.; Hendon, H.H. An all-season real-time multivariate MJO index: Development of an index for monitoring and prediction. Mon. Weather Rev. 2004, 132, 1917–1932. [Google Scholar] [CrossRef]
- Barnes, E.A.; Toms, B.; Hurrell, J.W.; Ebert-Uphoff, I.; Anderson, C.; Anderson, D. Indicator patterns of forced change learned by an artificial neural network. JAMES 2020, 12, e2020MS002195. [Google Scholar] [CrossRef]
- Han, X.; Wei, Z.; Zhang, B.; Li, I.; Du, T.; Chen, H. Crop evapotranspiration prediction by onsidering dynamic change of crop oefficient and the precipitation effect in back-propagation neural network model. J. Hydrol. 2021, 596, 126104. [Google Scholar] [CrossRef]
- Taylor, K.E.; Stouffer, R.J.; Meehl, G.A. An overview of CMIP5 and the experiment design. Bull. Am. Meteorol. Soc. 2012, 93, 485–498. [Google Scholar] [CrossRef]
- Meinshausen, M.; Smith, S.J.; Calvin, K.; Daniel, J.S.; Kainuma, M.; Lamarque, J.-F.; Matsumoto, K.; Montzka, S.A.; Raper, S.C.B.; Riahi, K.; et al. The RCP greenhouse gas concentrations and their extensions from 1765 to 2300. Clim. Chang. 2011, 109, 213. [Google Scholar] [CrossRef]
- Aissaoui, O.E.; Madani, Y.; Oughdir, L.; El Allioui, Y. A fuzzy classification approach for learning style prediction based on web mining technique in e-learning environments. Educ. Inf. Technol. 2019, 24, 1943–1959. [Google Scholar] [CrossRef]
- Zadeh, L.A. Fuzzy Sets, Fuzzy Logic, and Fuzzy Systems: Selected Papers by Lotfi. A. Zadeh; World Scientific: Singapore, 1996; pp. 394–432. [Google Scholar]
- Bach, S.; Binder, A.; Montavon, G.; Klauschen, F.; Müller, K.-R.; Samek, W. On pixel-wise explanations for non-linear classifier decisions by layer-wise relevance propagation. PLoS ONE 2015, 10, e0130140. [Google Scholar] [CrossRef]
- Montavon, G.; Lapuschkin, S.; Binder, A.; Samek, W.; Müller, K.-R. Explaining nonlinear classification decisions with deep taylor decomposition. Pattern Recognit. 2017, 65, 211–222. [Google Scholar] [CrossRef]
- Salmerón, R.; García, C.B.; García, J. Variance Inflation Factor and Condition Number in multiple linear regression. J. Stat. Comput. Simul. 2018, 88, 2365–2384. [Google Scholar] [CrossRef]
- Sippel, S.; Meinshausen, N.; Merrifield, A.; Lehner, F.; Pendergrass, A.G.; Fischer, E.; Knutti, R. Uncovering the forced climate response from a single ensemble member using statistical learning. J. Clim. 2019, 32, 5677–5699. [Google Scholar] [CrossRef]
- Lamarque, J.-F.; Kyle, G.P.; Meinshausen, M.; Riahi, K.; Smith, S.J.; van Vuuren, D.P.; Conley, A.J.; Vitt, F. Global and regional evolution of short-lived radiatively-active gases and aerosols in the Representative Concentration Pathways. Clim. Chang. 2011, 109, 191. [Google Scholar] [CrossRef]
- Myhre, G.; Shindell, D.; Bréon, F.; Collins, W.; Fuglestvedt, J.; Huang, J.; Koch, D.; Granier, C.; Haigh, J.; Hodnebrog, Ø.; et al. Anthropogenic and Natural Radiative Forcing; Cambridge University Press: Cambridge, UK, 2014. [Google Scholar]
- Bindoff, N.L.; Stott, P.A.; AchutaRao, K.M.; Allen, M.R.; Gillett, N.; Gutzler, D.; Hansingo, K.; Hegerl, G.; Hu, Y.; Jain, S.; et al. Detection and Attribution of Climate Change: From Global to Regional; Cambridge University Press: Cambridge, UK, 2013. [Google Scholar]
- Gregory, J.M.; Andrews, T. Variation in climate sensitivity and feedback parameters during the historical period. Geophys. Res. Lett. 2016, 43, 3911–3920. [Google Scholar] [CrossRef]
- Knutson, T.; Kossin, J.; Mears, C.; Perlwitz, J.; Wehner, M. Detection and Attribution of Climate Change; U.S. Department of Commerce: Washington, DC, USA, 2017.
- Andrews, T.; Gregory, J.M.; Paynter, D.; Silvers, L.G.; Zhou, C.; Mauritsen, T.; Webb, M.J.; Armour, K.C.; Forster, P.M.; Titchner, H. Accounting for changing temperature patterns increases historical estimates of climate sensitivity. Geophys. Res. Lett. 2018, 45, 8490–8499. [Google Scholar] [CrossRef]
 Input layer: an image that is composed of pixel values in the length and width directions;
  Hidden layers: Artificial Neuron;
  Output layer: predict the year of a map of soil moisture.
Input layer: an image that is composed of pixel values in the length and width directions; Hidden layers: Artificial Neuron; Output layer: predict the year of a map of soil moisture.
Output layer: predict the year of a map of soil moisture.
Input layer: an image that is composed of pixel values in the length and width directions; Hidden layers: Artificial Neuron; Output layer: predict the year of a map of soil moisture.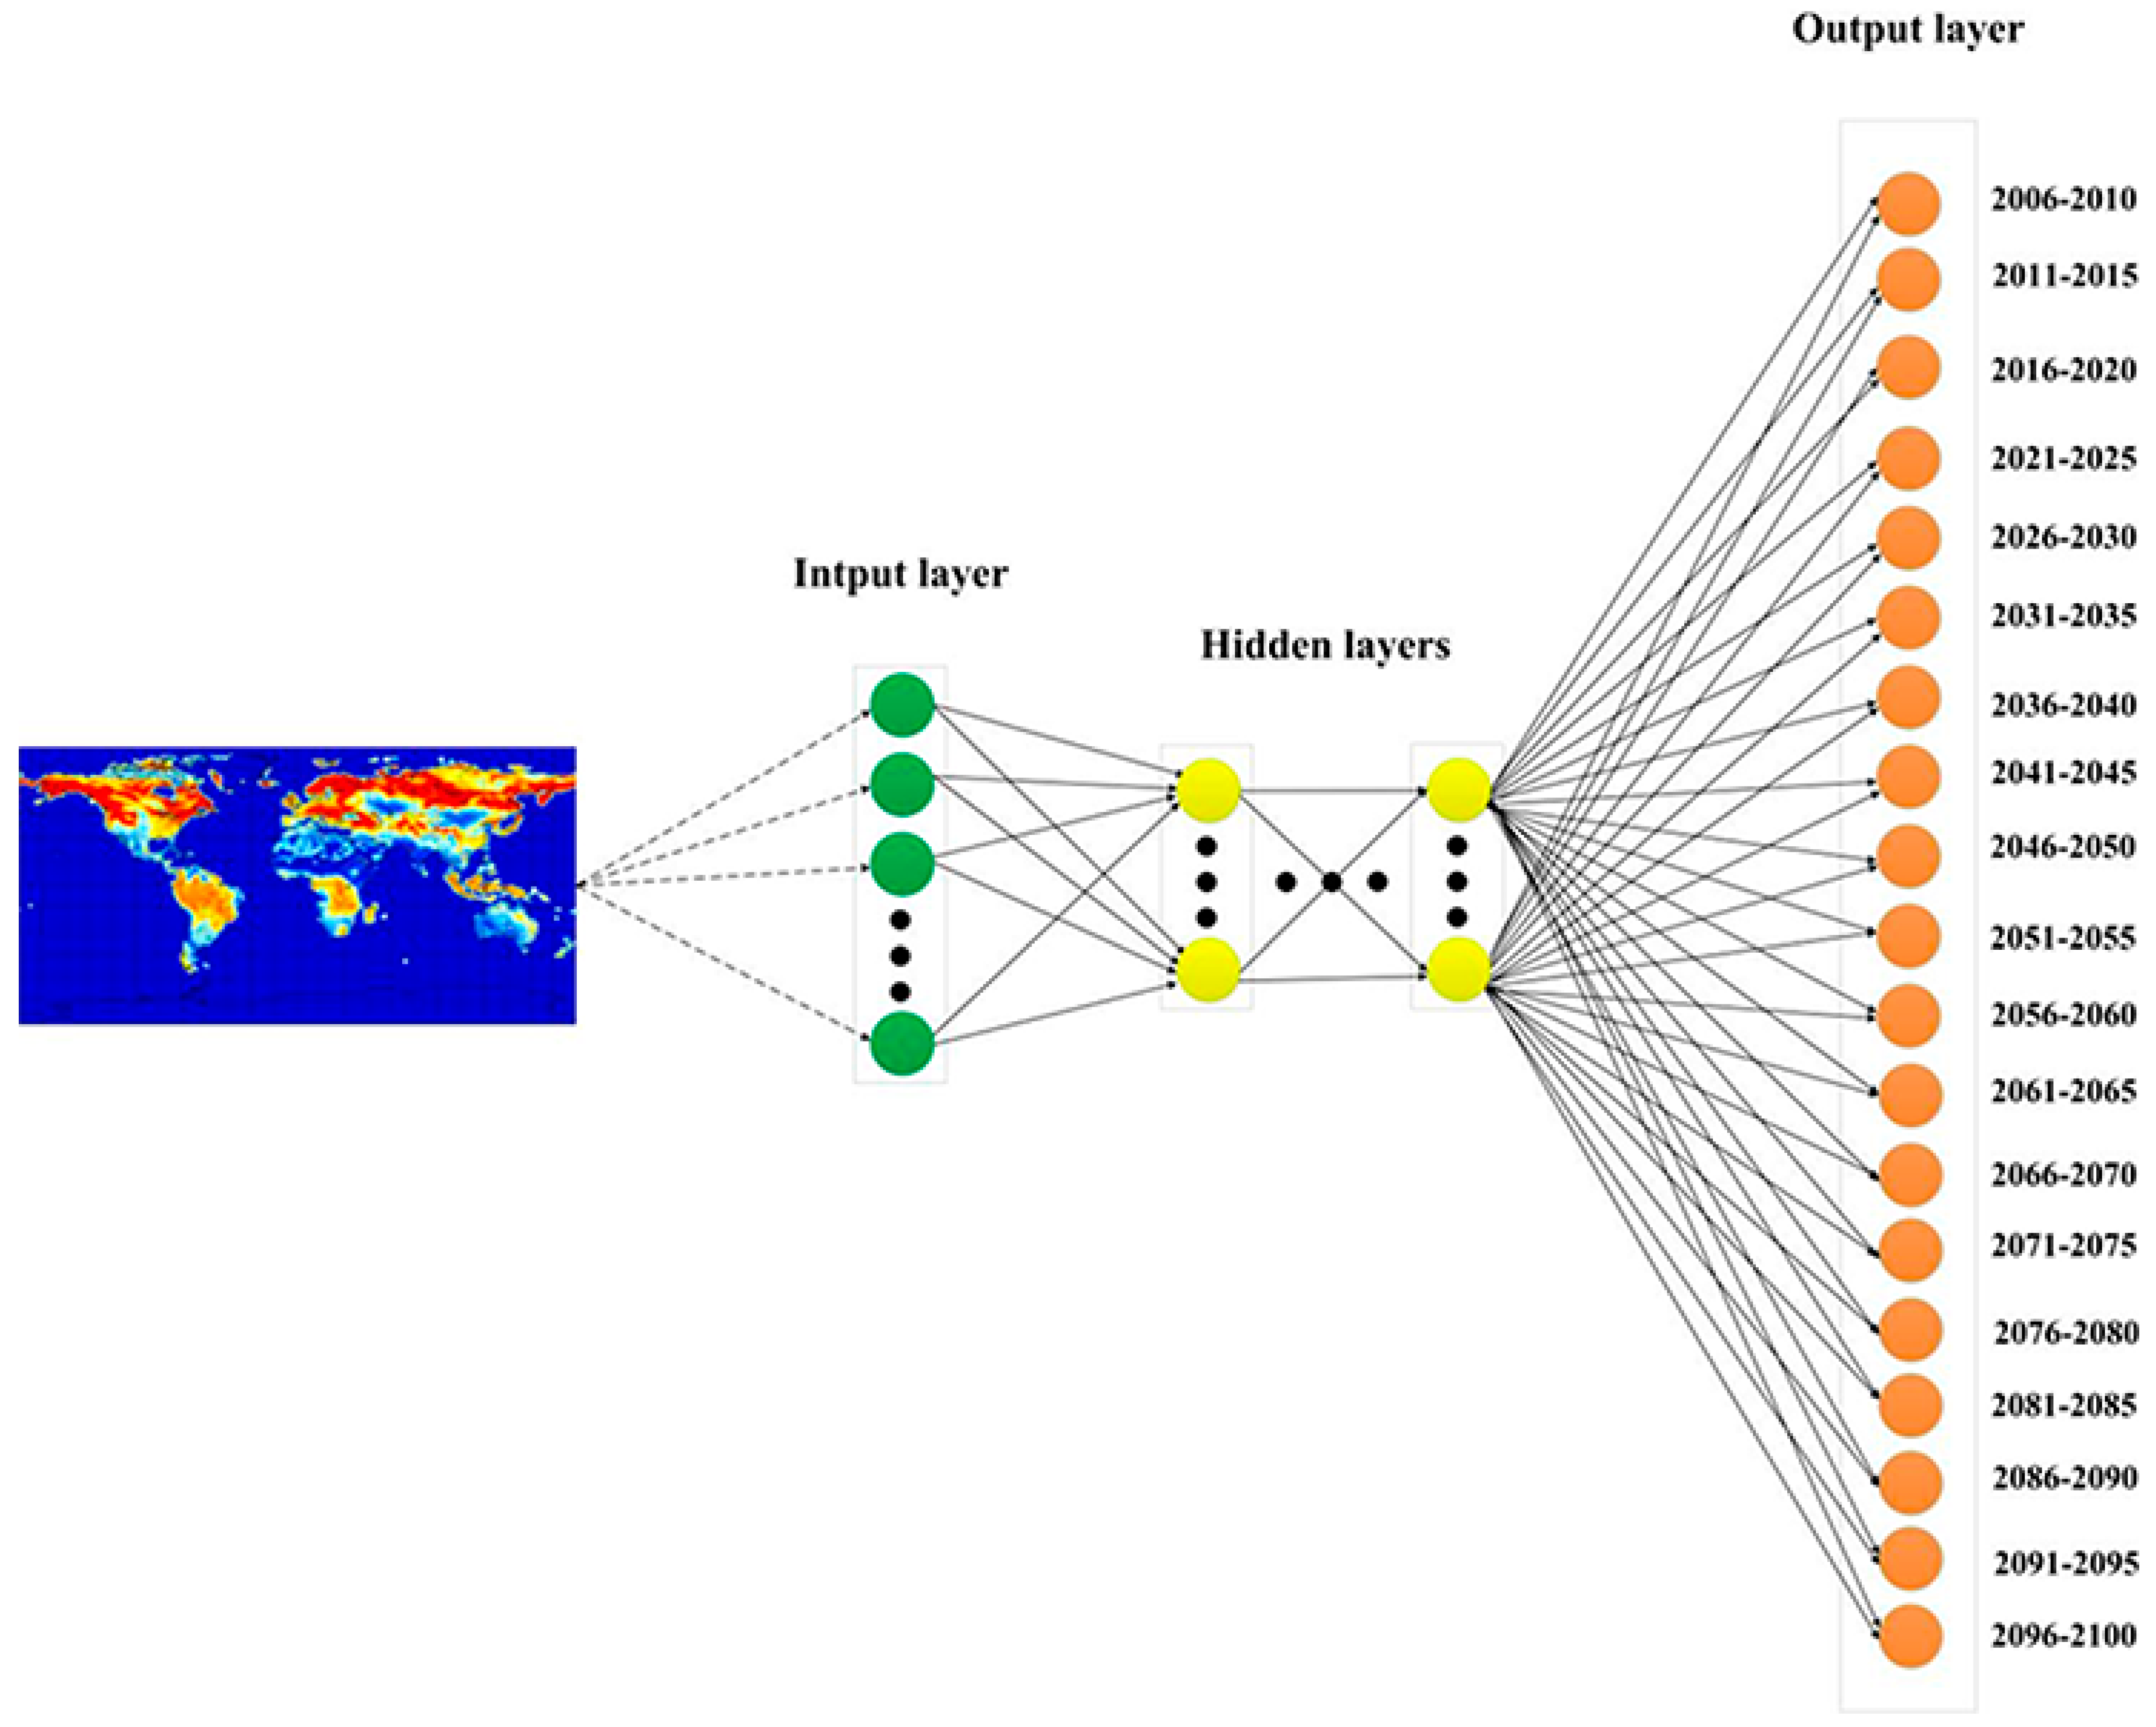
 Probability belongs entirely to the 2011–2015 class;
  Probability belongs entirely to the 2063–2068 class;
  Probability belongs entirely to the 2093–2098 class.
Probability belongs entirely to the 2011–2015 class; Probability belongs entirely to the 2063–2068 class; Probability belongs entirely to the 2093–2098 class.
Probability belongs entirely to the 2093–2098 class.
Probability belongs entirely to the 2011–2015 class; Probability belongs entirely to the 2063–2068 class; Probability belongs entirely to the 2093–2098 class.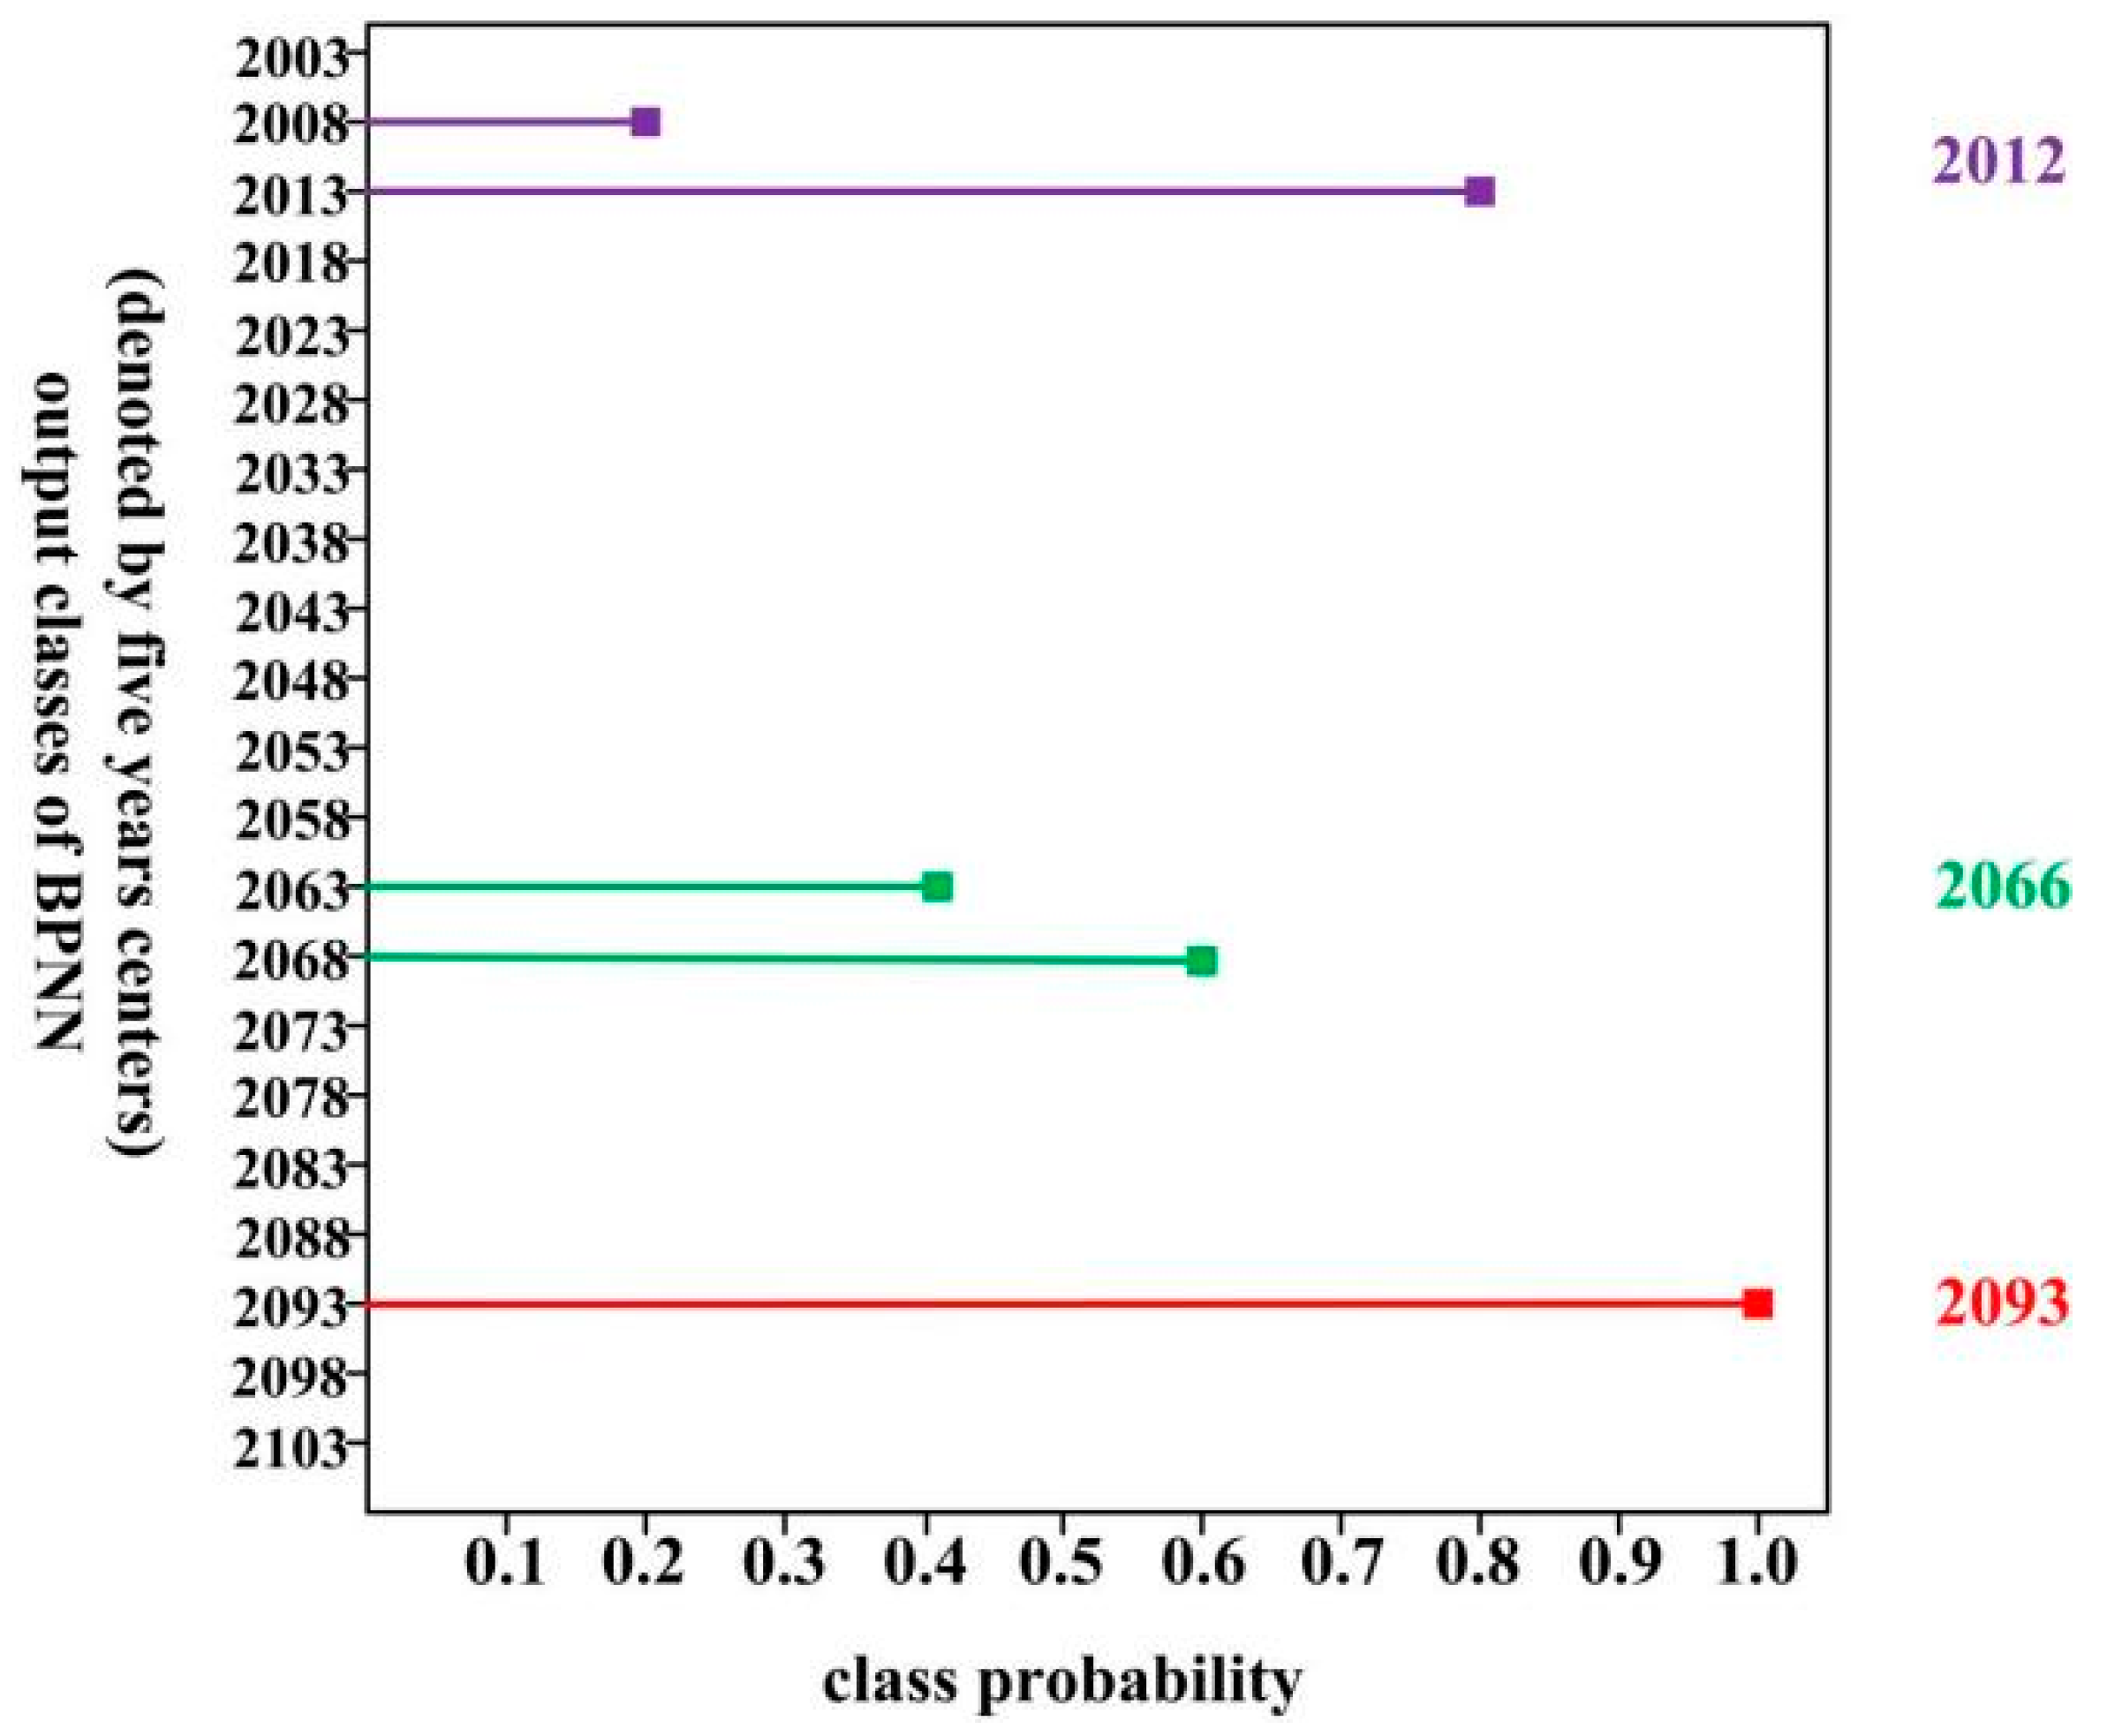


| Modeling Center/Version | Organization and Country | Resolution | Years | Forcing |
|---|---|---|---|---|
| ACCESS1-0 | CSIRO_BOM, Australia | 1.25° × 1.875° | 2006–099 | RCP 8.5 |
| ACCESS1-3 | CSIRO_BOM, Australia | 1.25° × 1.875° | 2006–2099 | RCP 8.5 |
| bcc-csm1-1 | BCC, China | 2.8125°× 2.8125° | 2006–2099 | RCP 8.5 |
| bcc-csm1-1-m | BCC, China | 1.125° × 1.125° | 2006–2099 | RCP 8.5 |
| BNU-ESM | GCESS, China | 2.8125°× 2.8125° | 2006–2099 | RCP 8.5 |
| CanESM2 | CCCMA, Canada | 2.8125°× 2.8125° | 2006–2099 | RCP 8.5 |
| CCSM4 | NCAR, America | 0.9375° × 1.25° | 2006–2099 | RCP 8.5 |
| CESM1-BGC | NSF_DOE_NCAR, America | 1.875° × 1.25° | 2006–2099 | RCP 8.5 |
| CESM1-CAM5 | NSF_DOE_NCAR, America | 1.875° × 1.25° | 2006–2099 | RCP 8.5 |
| CM5A-MR | IPSL, France | nominal 1.2587° × 2.5° | 2006–2099 | RCP 8.5 |
| CM5B-LR | IPSL, France | 1.875° × 3.75° | 2006–2099 | RCP 8.5 |
| CSIRO-Mk3-6-0 | CSIRO_QCCCE, Australia | 1.875° × 1.875° | 2006–2099 | RCP 8.5 |
| MIROC5 | MIROC, Japan | 0.9375° × 1.25° | 2006–2099 | RCP 8.5 |
| NorESM1-M | NCC, Norway | 1.875° × 1.25° | 2006–2099 | RCP 8.5 |
Publisher’s Note: MDPI stays neutral with regard to jurisdictional claims in published maps and institutional affiliations. |
© 2022 by the authors. Licensee MDPI, Basel, Switzerland. This article is an open access article distributed under the terms and conditions of the Creative Commons Attribution (CC BY) license (https://creativecommons.org/licenses/by/4.0/).
Share and Cite
Li, X.; Zhao, H.; Sun, C.; Li, X.; Li, X.; Zhao, Y.; Wang, X. Learning the Indicative Patterns of Simulated Force Changes in Soil Moisture by BP Neural Networks and Finding Differences with SMAP Observations. Sustainability 2022, 14, 11310. https://doi.org/10.3390/su141811310
Li X, Zhao H, Sun C, Li X, Li X, Zhao Y, Wang X. Learning the Indicative Patterns of Simulated Force Changes in Soil Moisture by BP Neural Networks and Finding Differences with SMAP Observations. Sustainability. 2022; 14(18):11310. https://doi.org/10.3390/su141811310
Chicago/Turabian StyleLi, Xiaoning, Hongwei Zhao, Chong Sun, Xiaofeng Li, Xiaolin Li, Yang Zhao, and Xuezhi Wang. 2022. "Learning the Indicative Patterns of Simulated Force Changes in Soil Moisture by BP Neural Networks and Finding Differences with SMAP Observations" Sustainability 14, no. 18: 11310. https://doi.org/10.3390/su141811310
APA StyleLi, X., Zhao, H., Sun, C., Li, X., Li, X., Zhao, Y., & Wang, X. (2022). Learning the Indicative Patterns of Simulated Force Changes in Soil Moisture by BP Neural Networks and Finding Differences with SMAP Observations. Sustainability, 14(18), 11310. https://doi.org/10.3390/su141811310