
Evaluation of Livability of Wuhan under Ecological Construction and Analysis of Its Spatial Pattern

Abstract
:1. Introduction
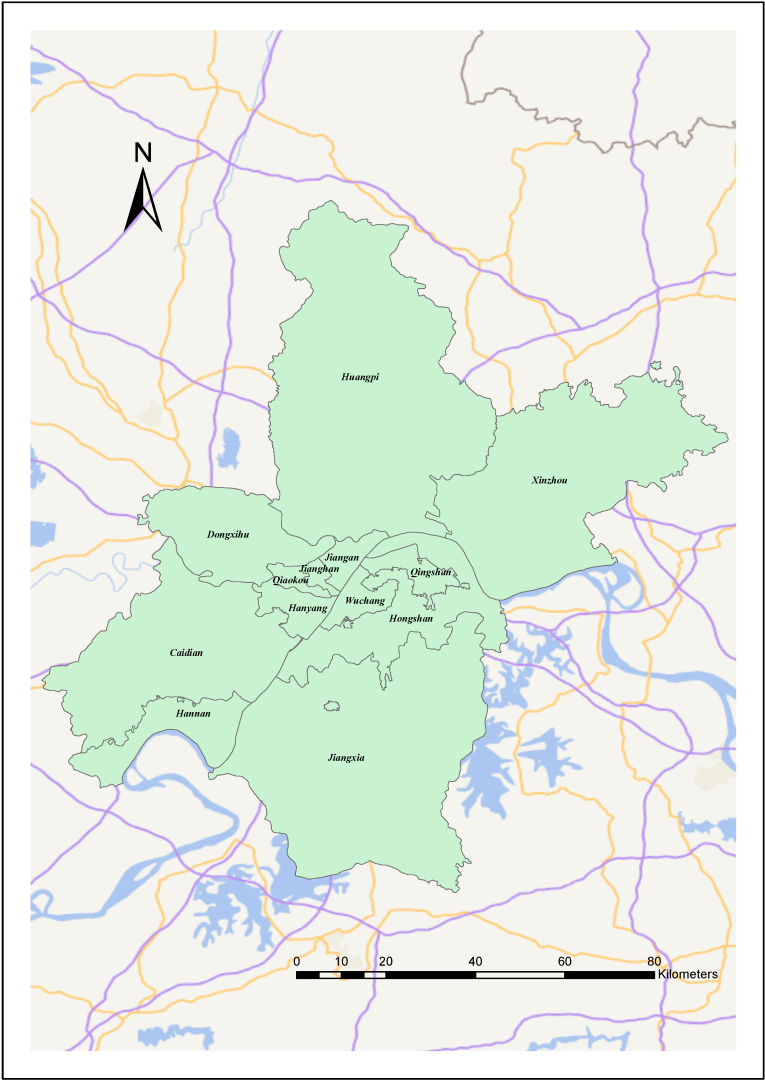
2. Overview of the Study Area
3. Data and Methods
3.1. Data Description
3.2. Method Description and Application
3.2.1. Index Method to Evaluate the Livability of Wuhan City
- a.
- Remote Sensing Ecology Index
- b.
- Landscape Index
- c.
- Air Quality Index
3.2.2. Preliminary Evaluation of Urban Livability in Wuhan City by TOPSIS Analysis
- a.
- With n evaluation objects and m evaluation indexes, the original data can be written as a matrix .
- b.
- Normalization of the matrix. The normalized transformations are carried out for the high-optimality (the larger the better) and low-optimality (the smaller the better) indicators, namely or .
- c.
- The evaluation set of optimal and inferior solutions in the normalized matrix is obtained. The normalized matrix is obtained, and the optimal and inferior vectors composed of the maximum and minimum values of each column are denoted as:
- d.
- The Euclidean distance between the actual value of the indicator and the optimal and worst-case scenario is calculated for each region. The calculation equations are respectively:where: D+ and D− denote the distance between the ith evaluation object and the optimal and inferior solutions, respectively.
- e.
- The relative closeness or similarity is calculated and ranked. The closeness of the ith evaluation object to the optimal solution (relative closeness) (0 ≤ ≤ 1; i = 1, 2, ⋯, n).
3.2.3. Accurate Evaluation of Urban Livability in Wuhan City Using Principal Component Analysis
3.2.4. Analysis of Wuhan City’s Urban Spatial Pattern Using Local Indicators of Spatial Association
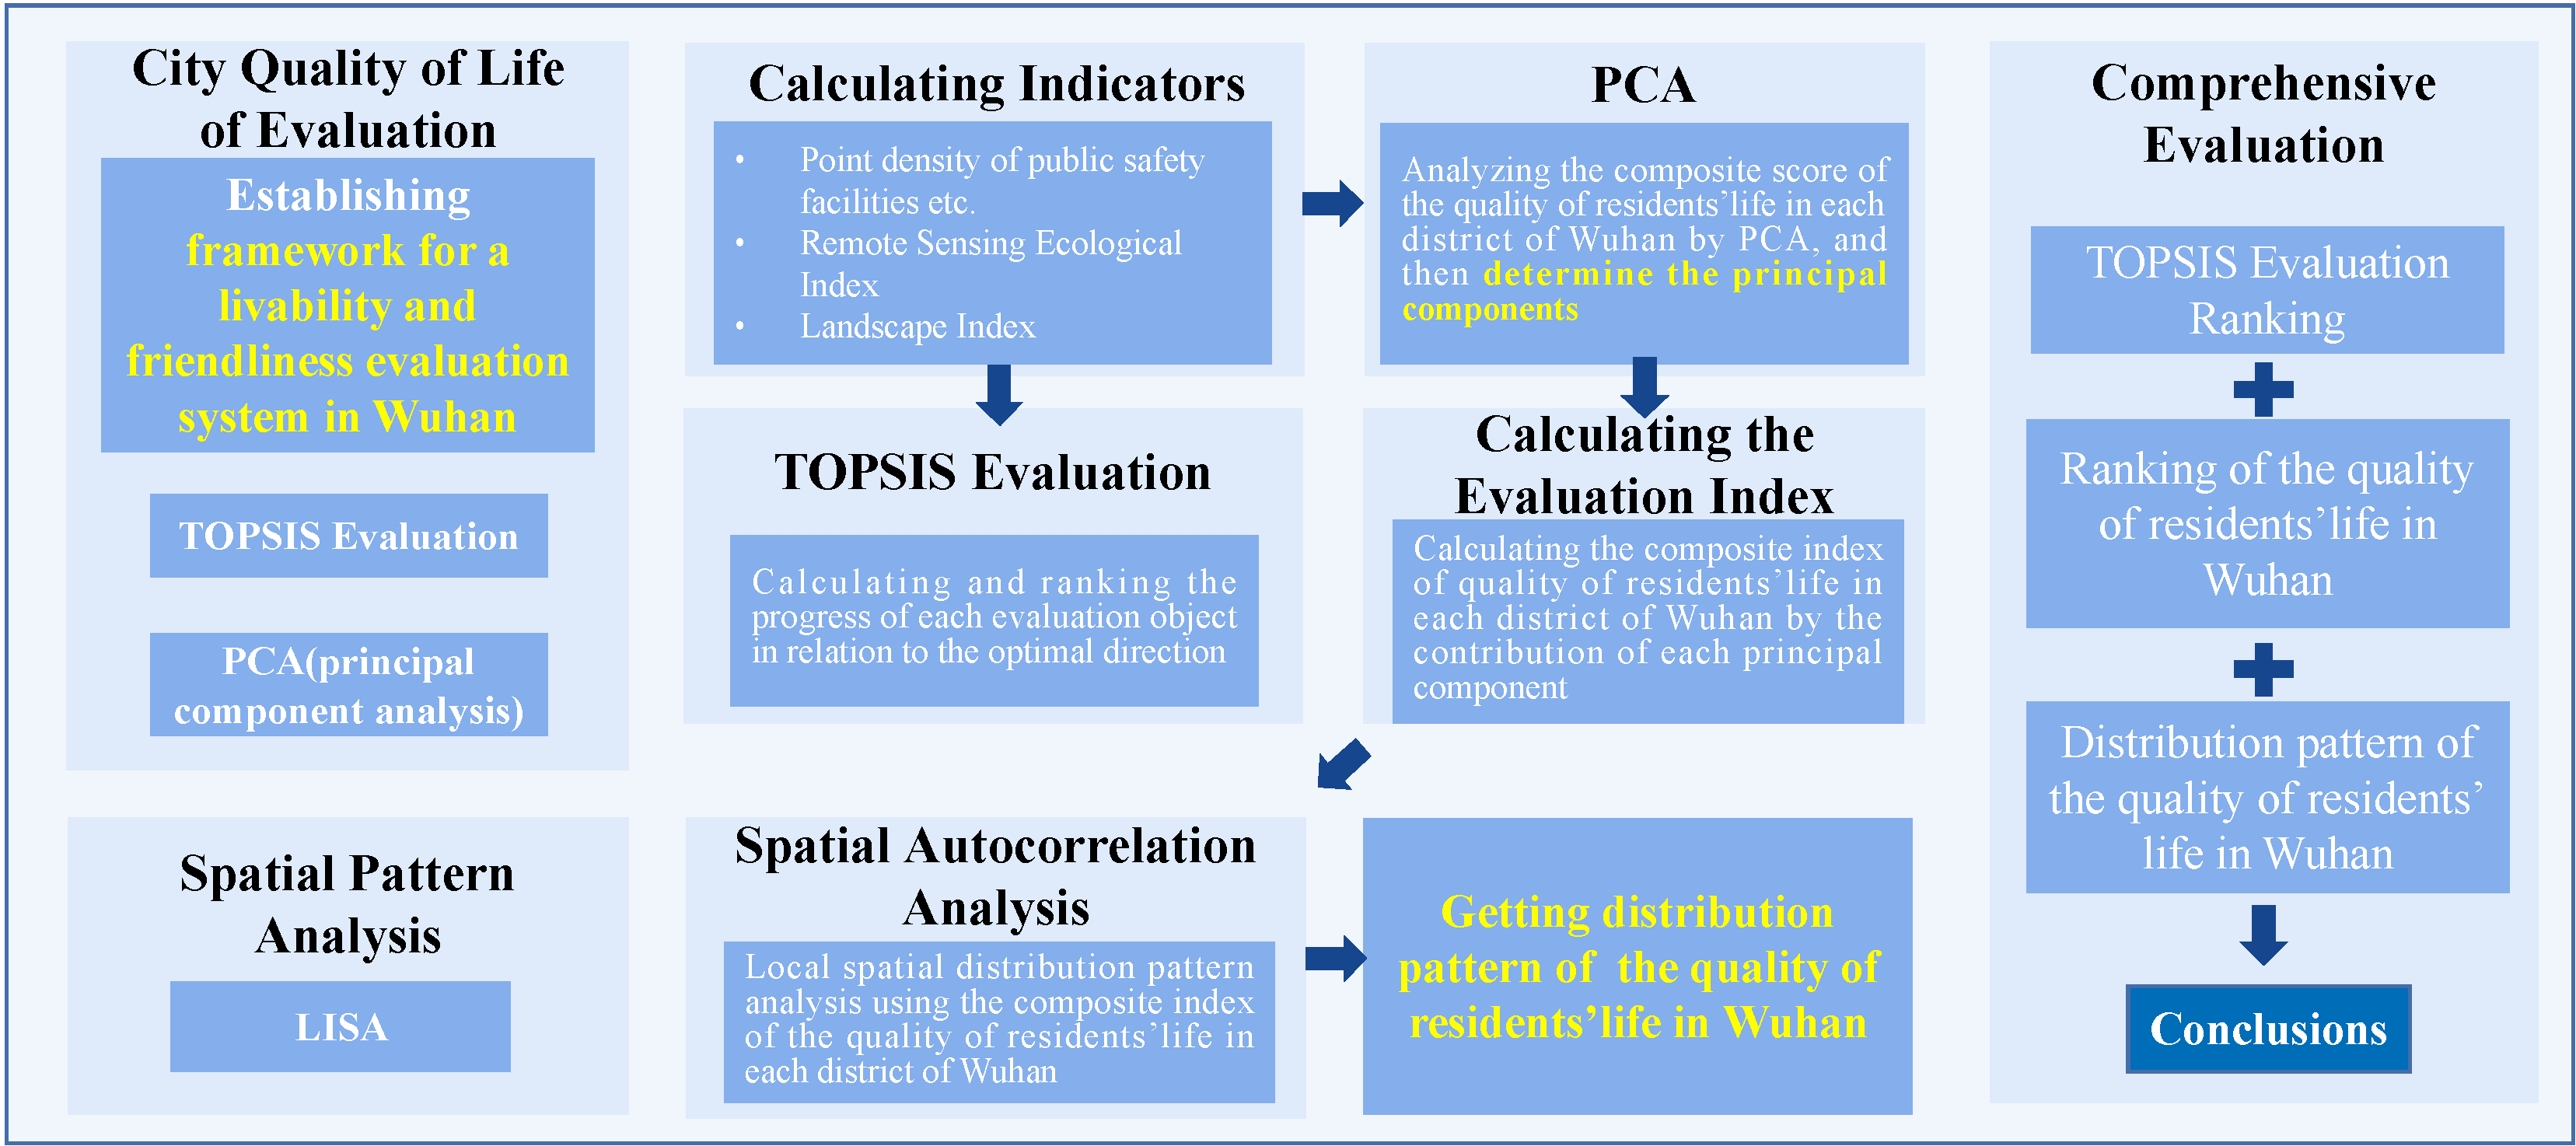
3.3. Technology Line
4. Results and Analysis
4.1. Building a System for Evaluating Livability and Friendliness
4.2. Indicator Calculation Results
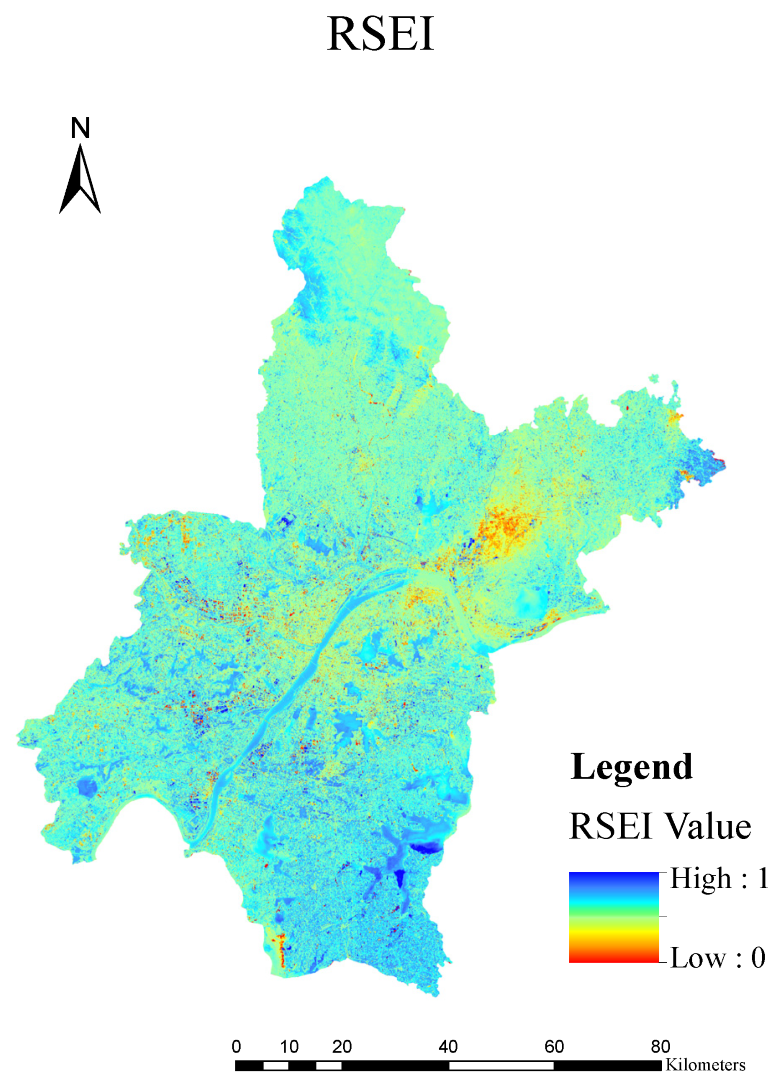
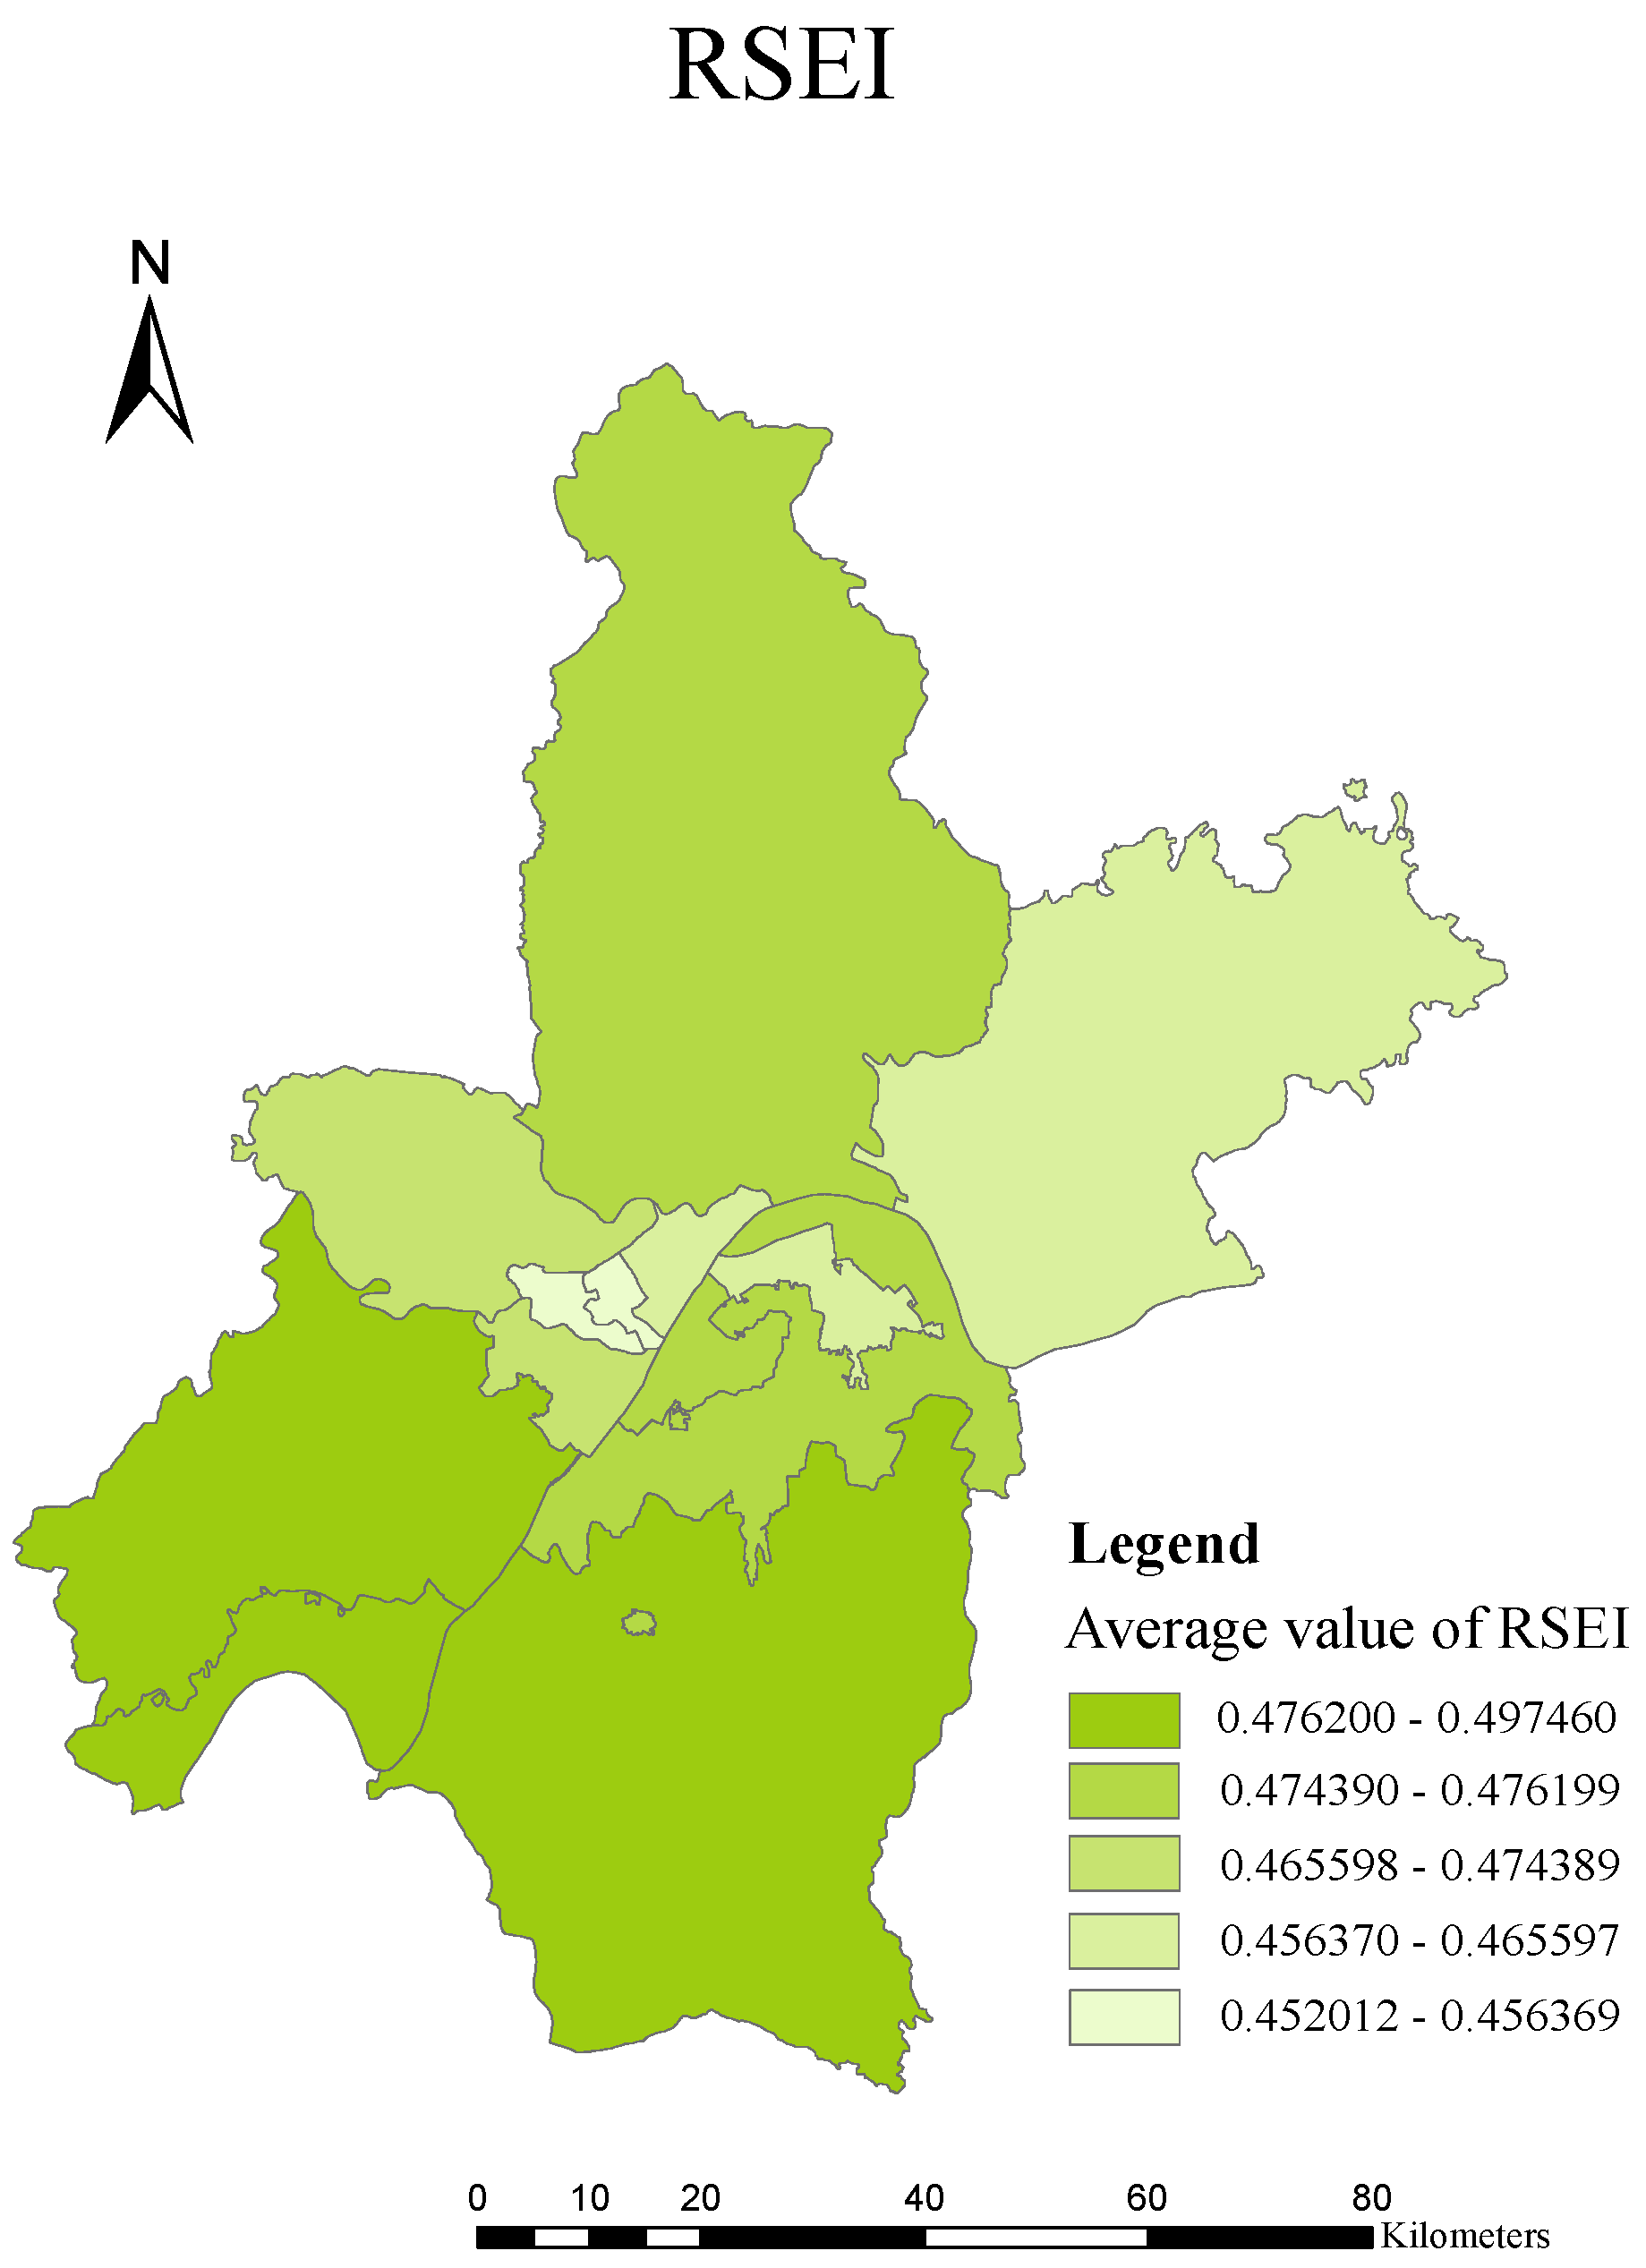
4.2.1. Remote Sensing Ecology Index Calculation
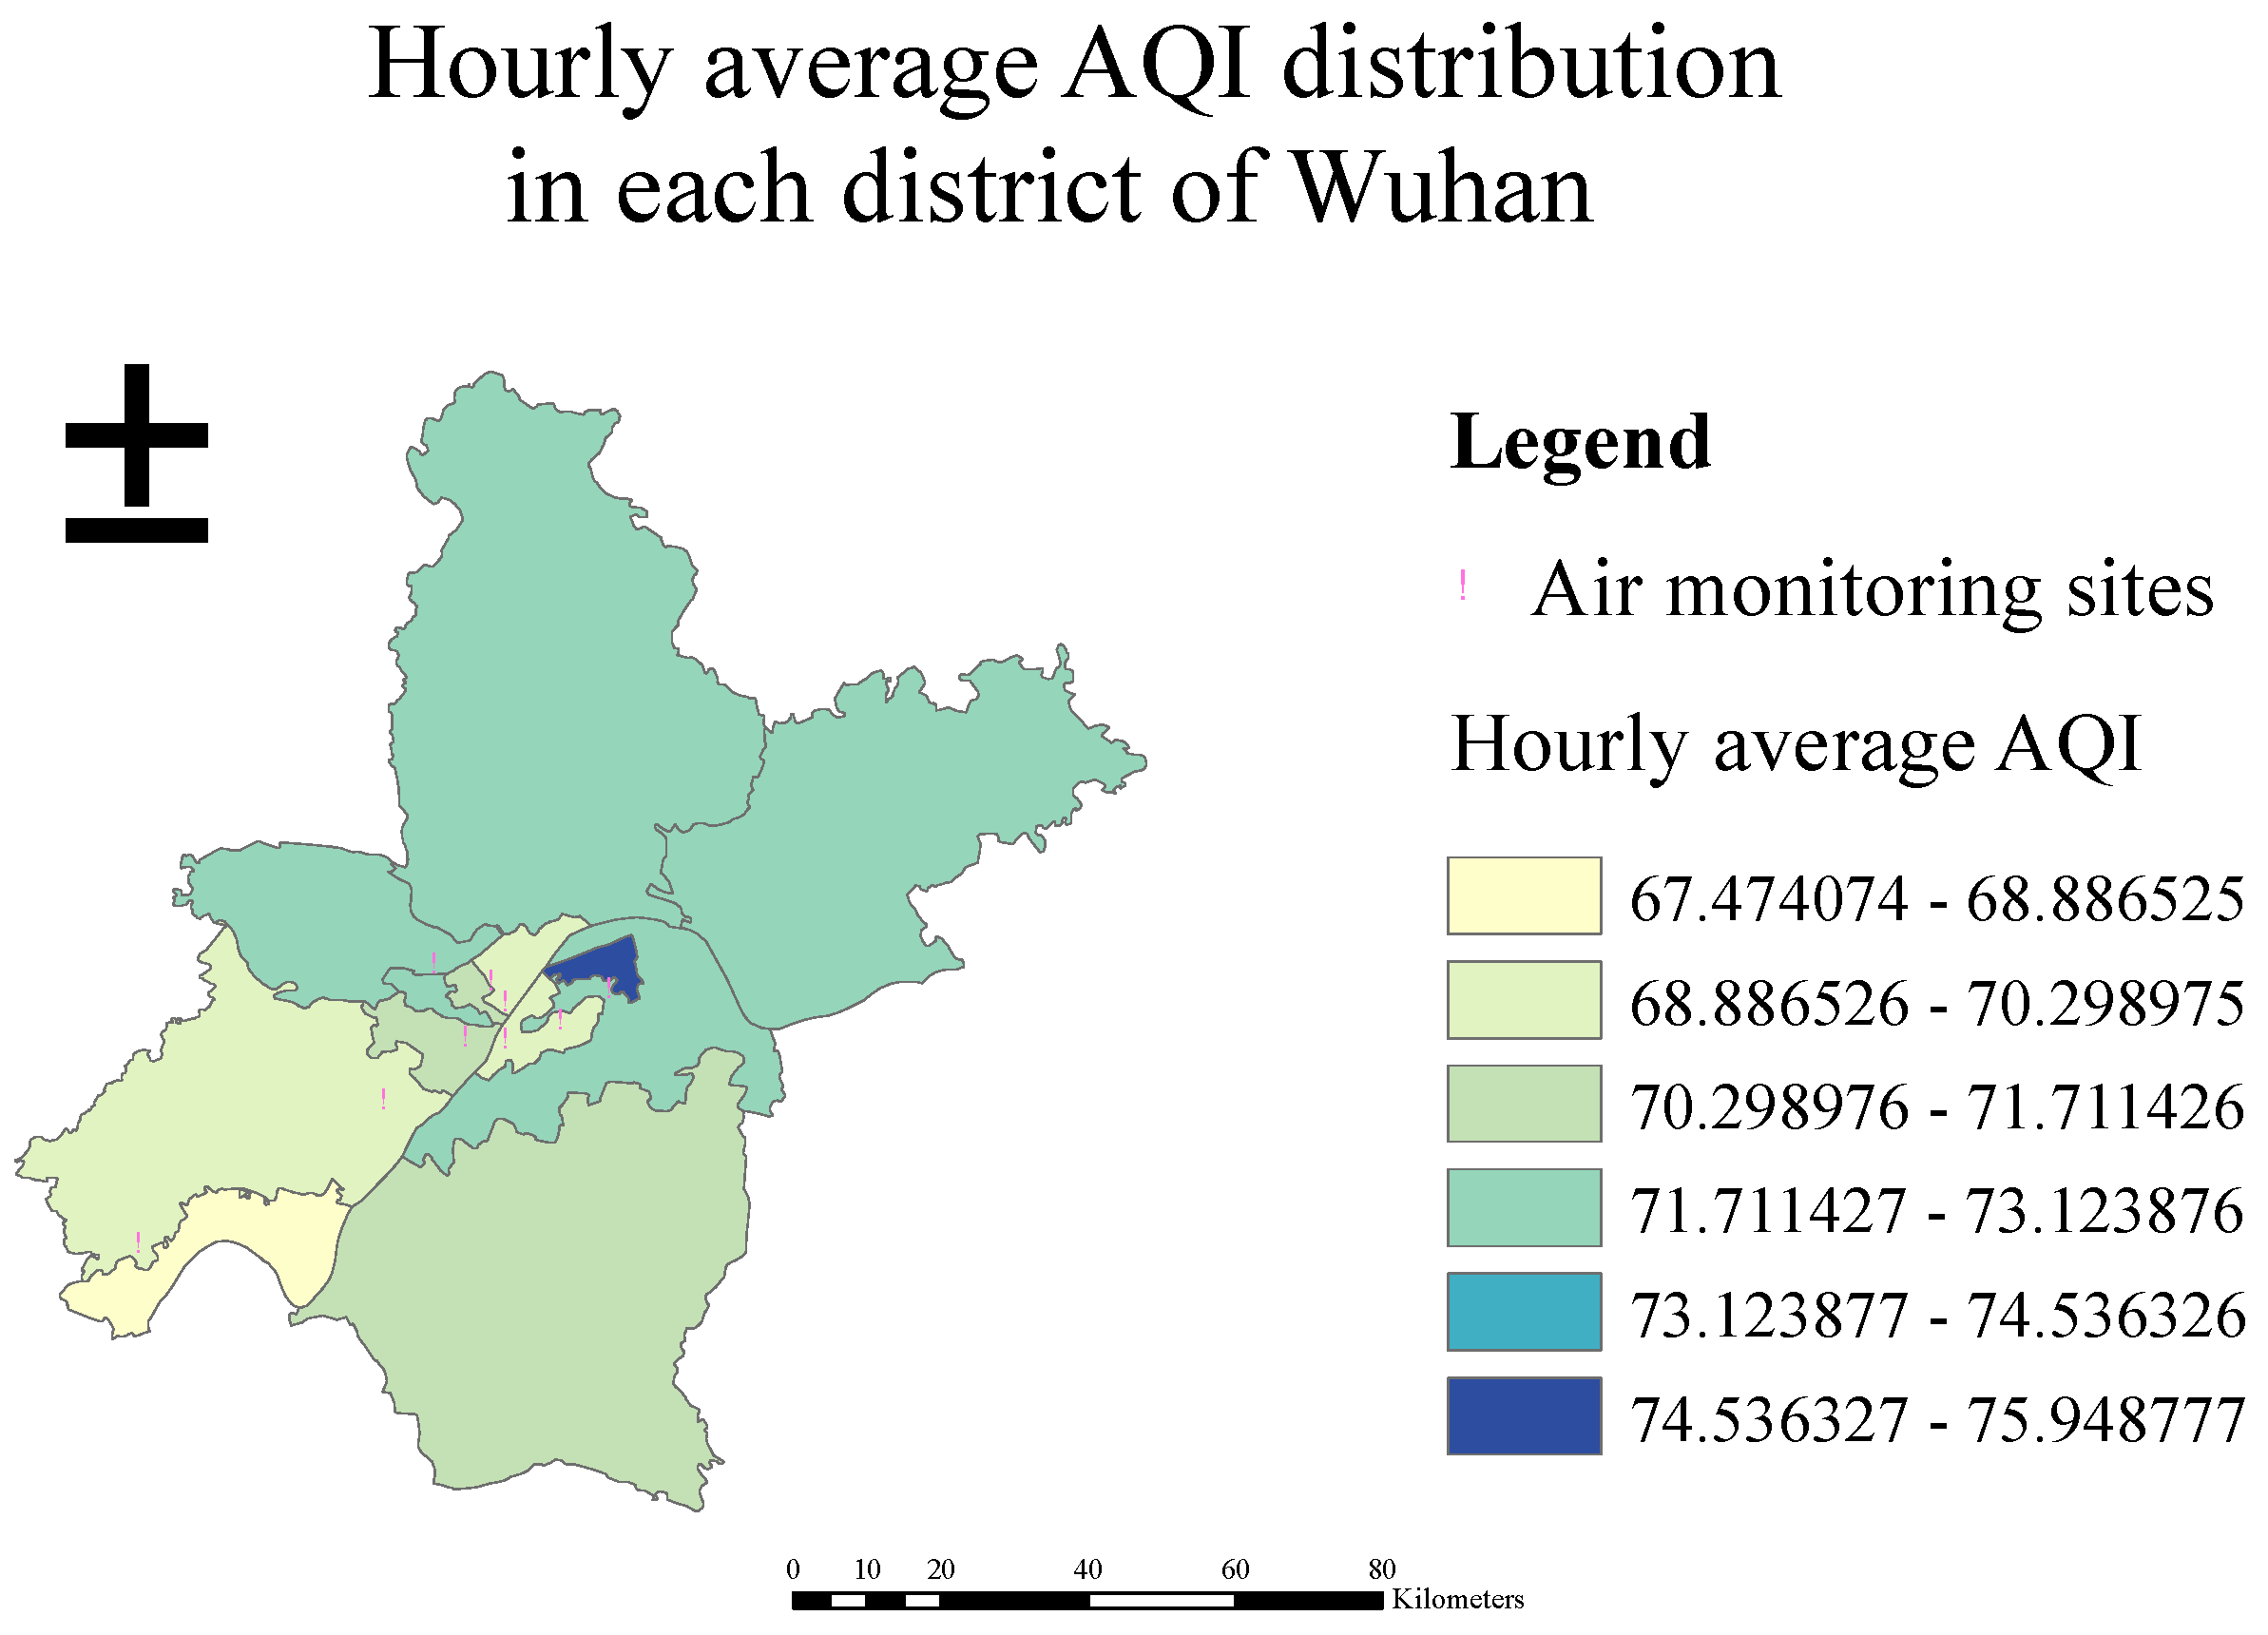
4.2.2. Air Quality Index Calculation Index
4.2.3. Calculation of Landscape Indices
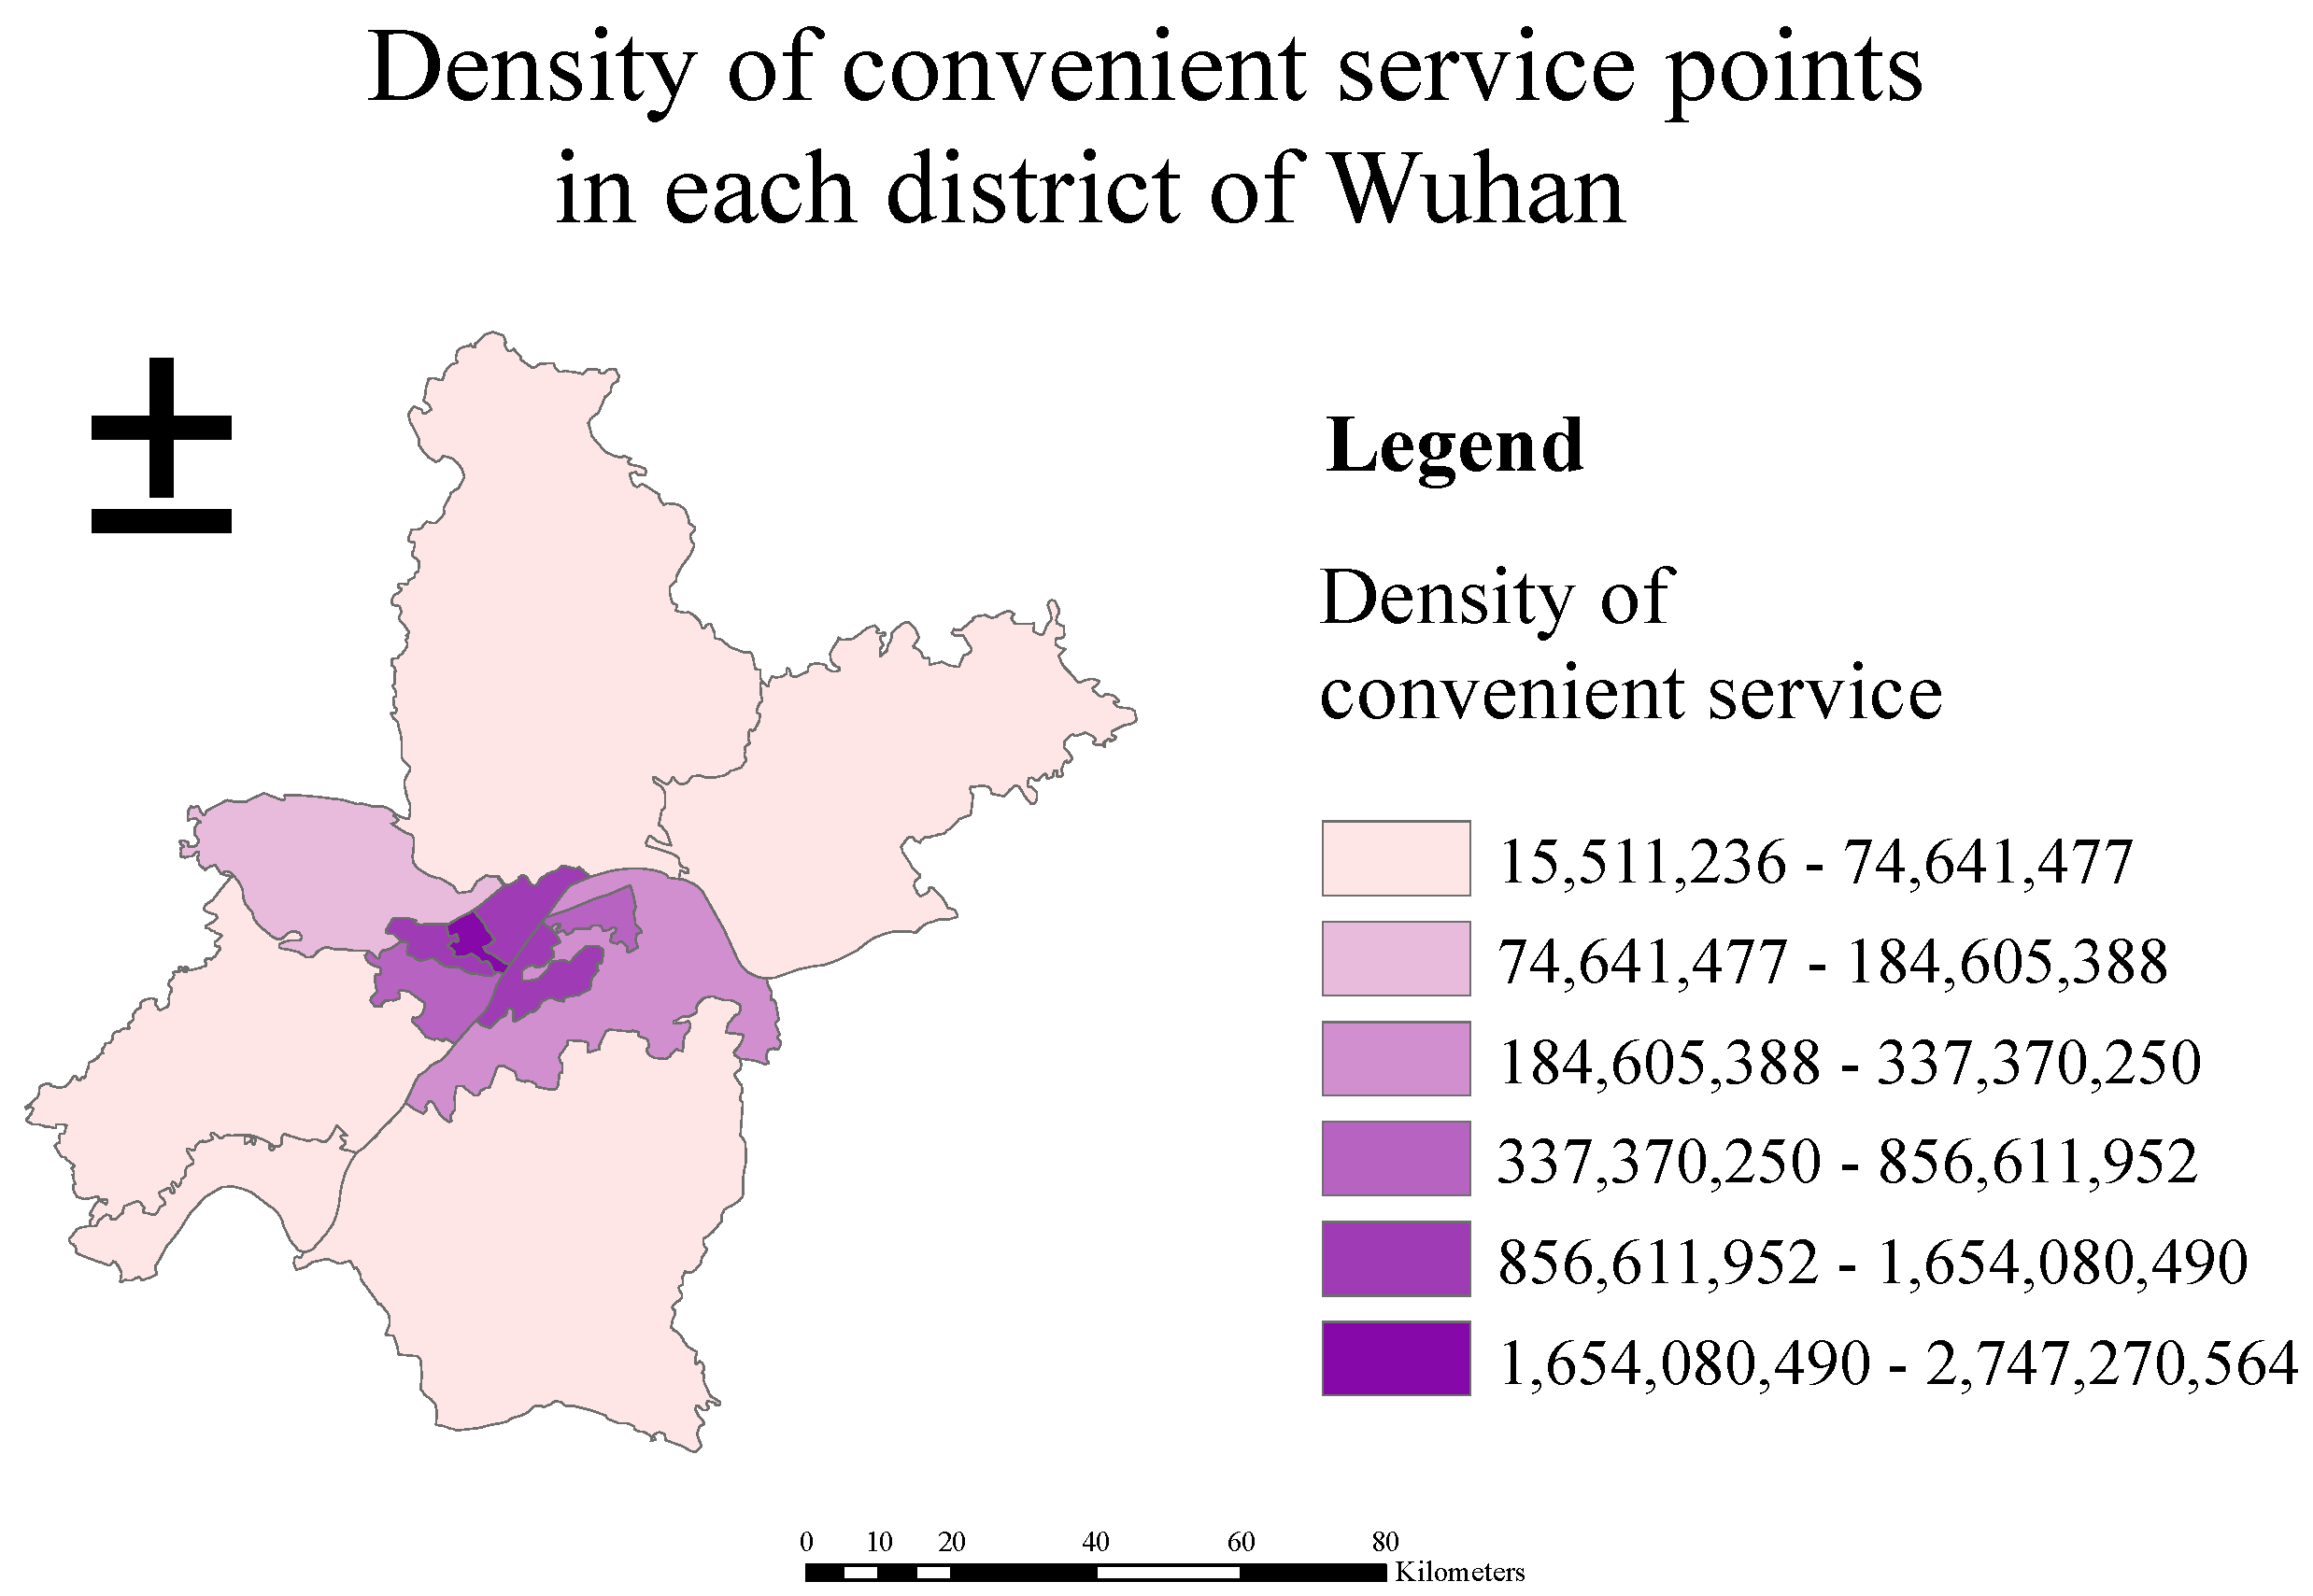
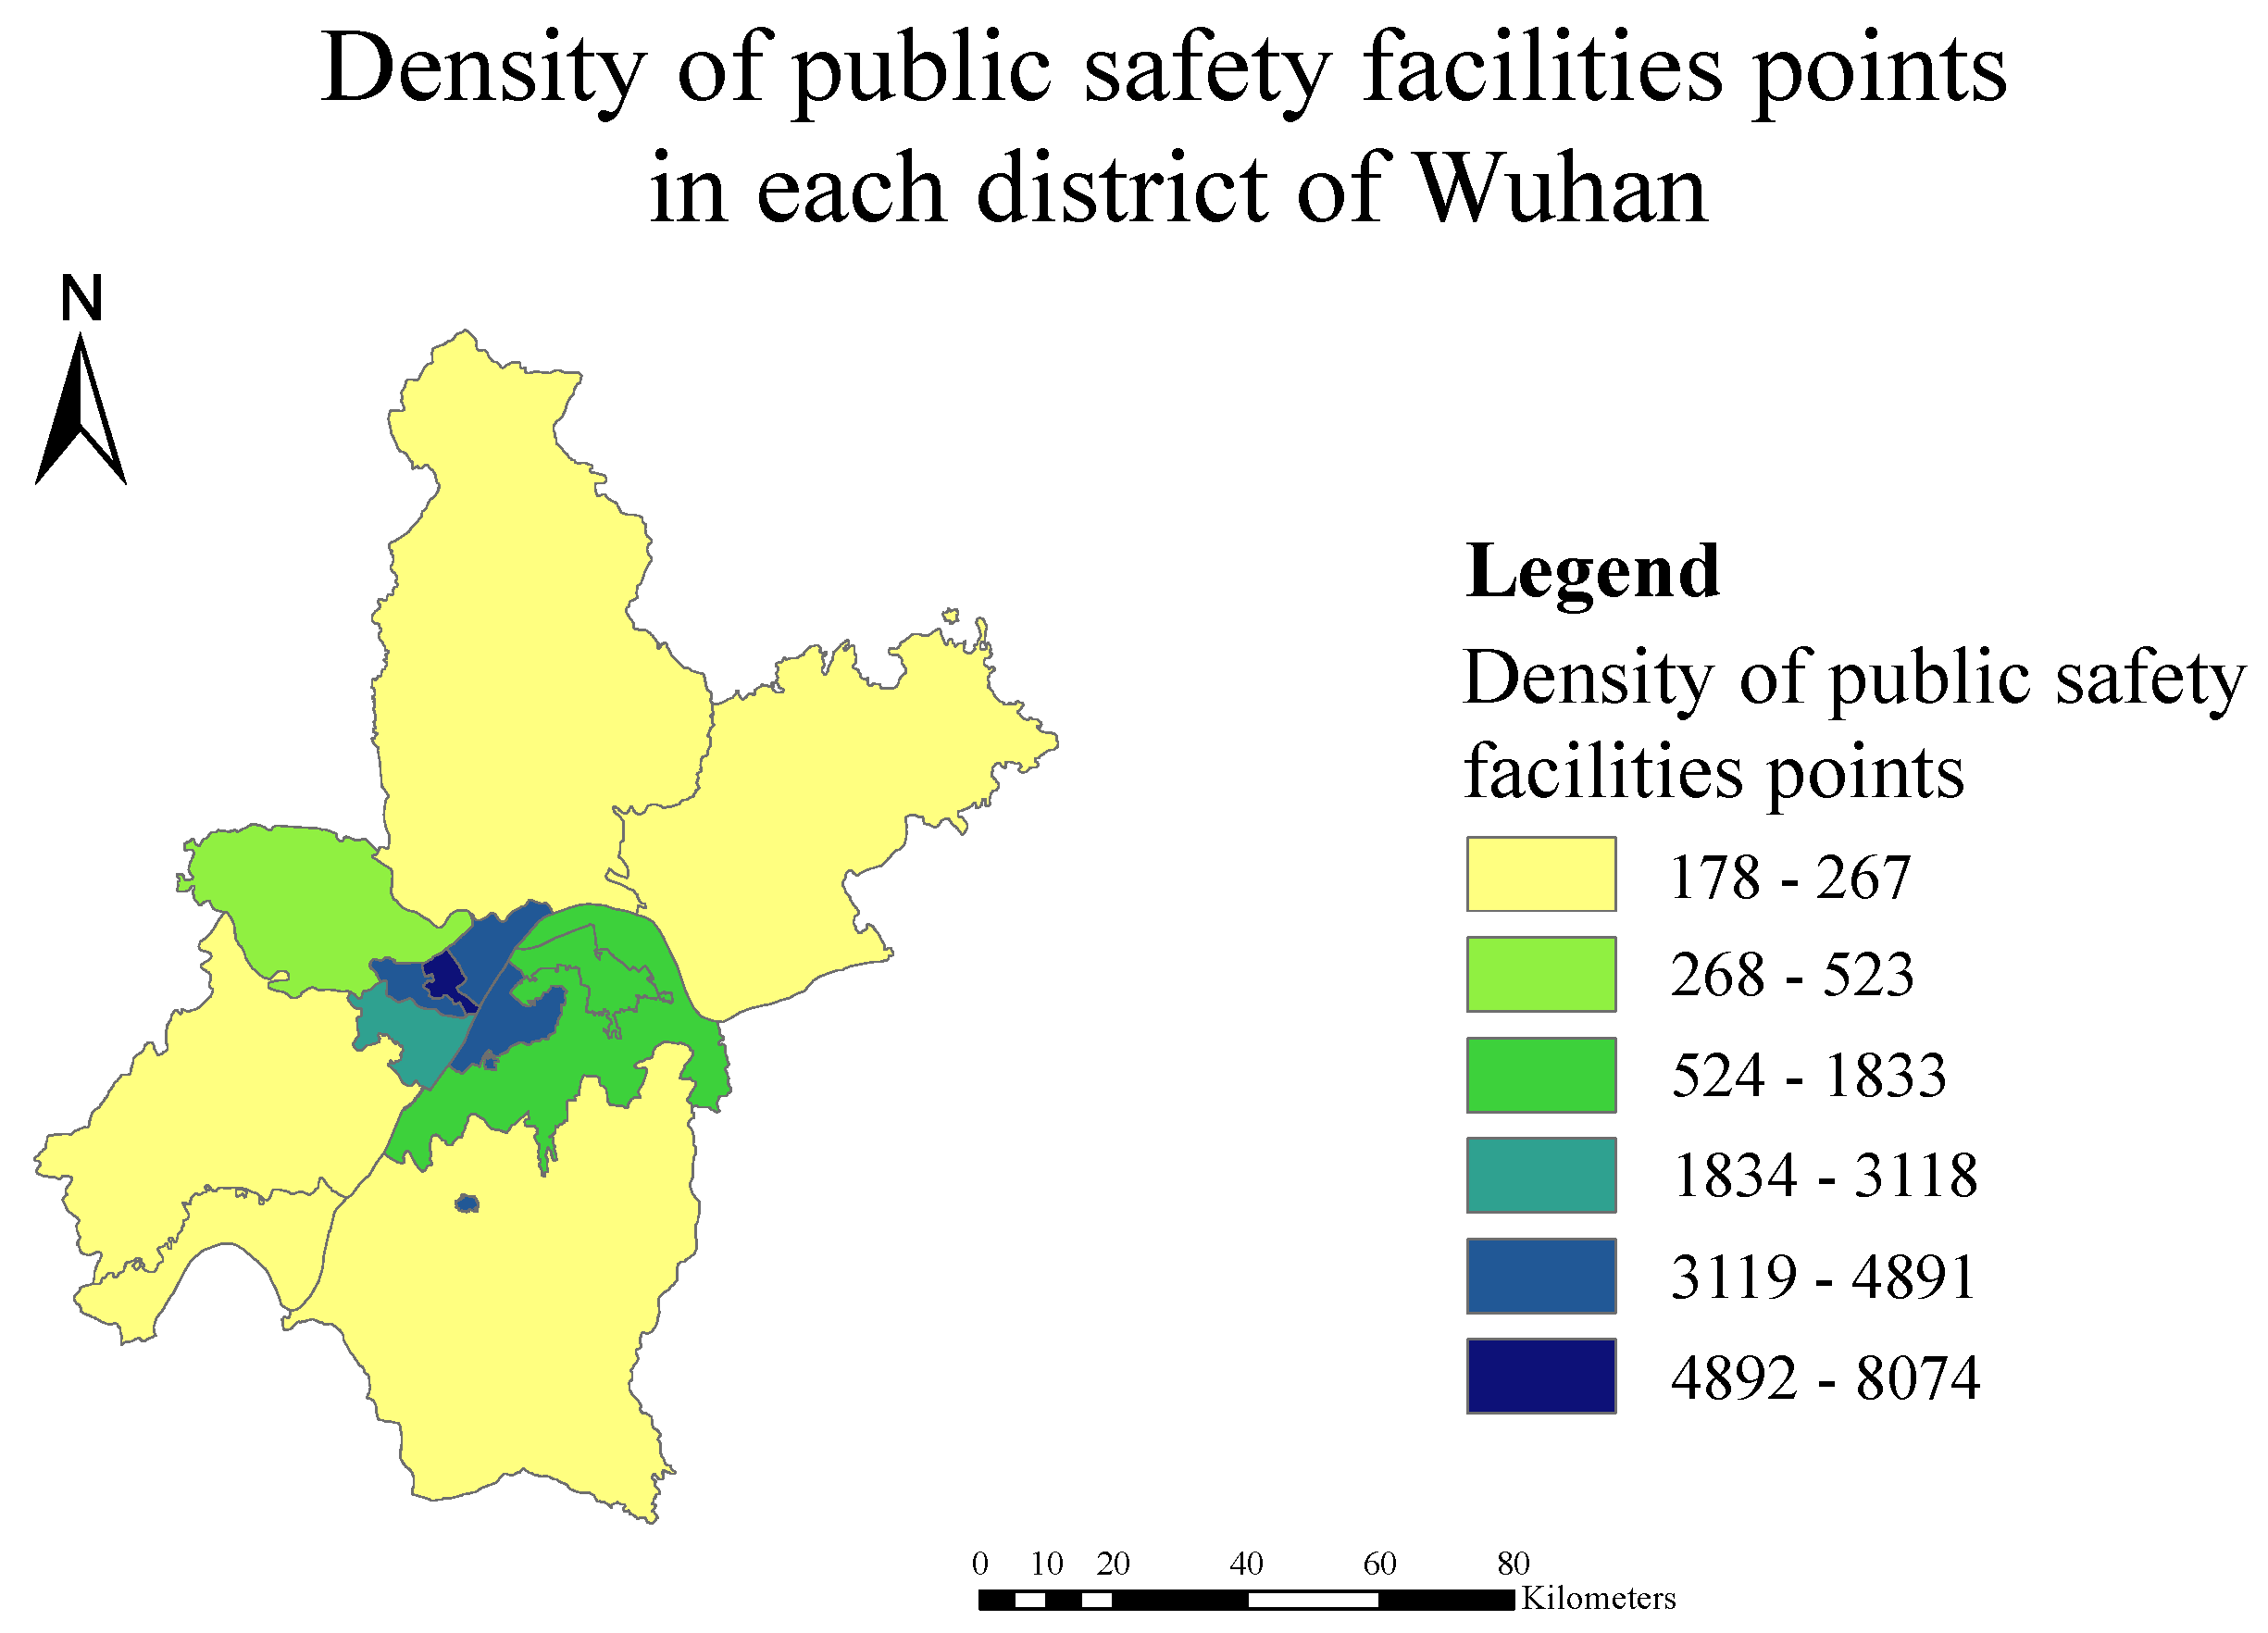
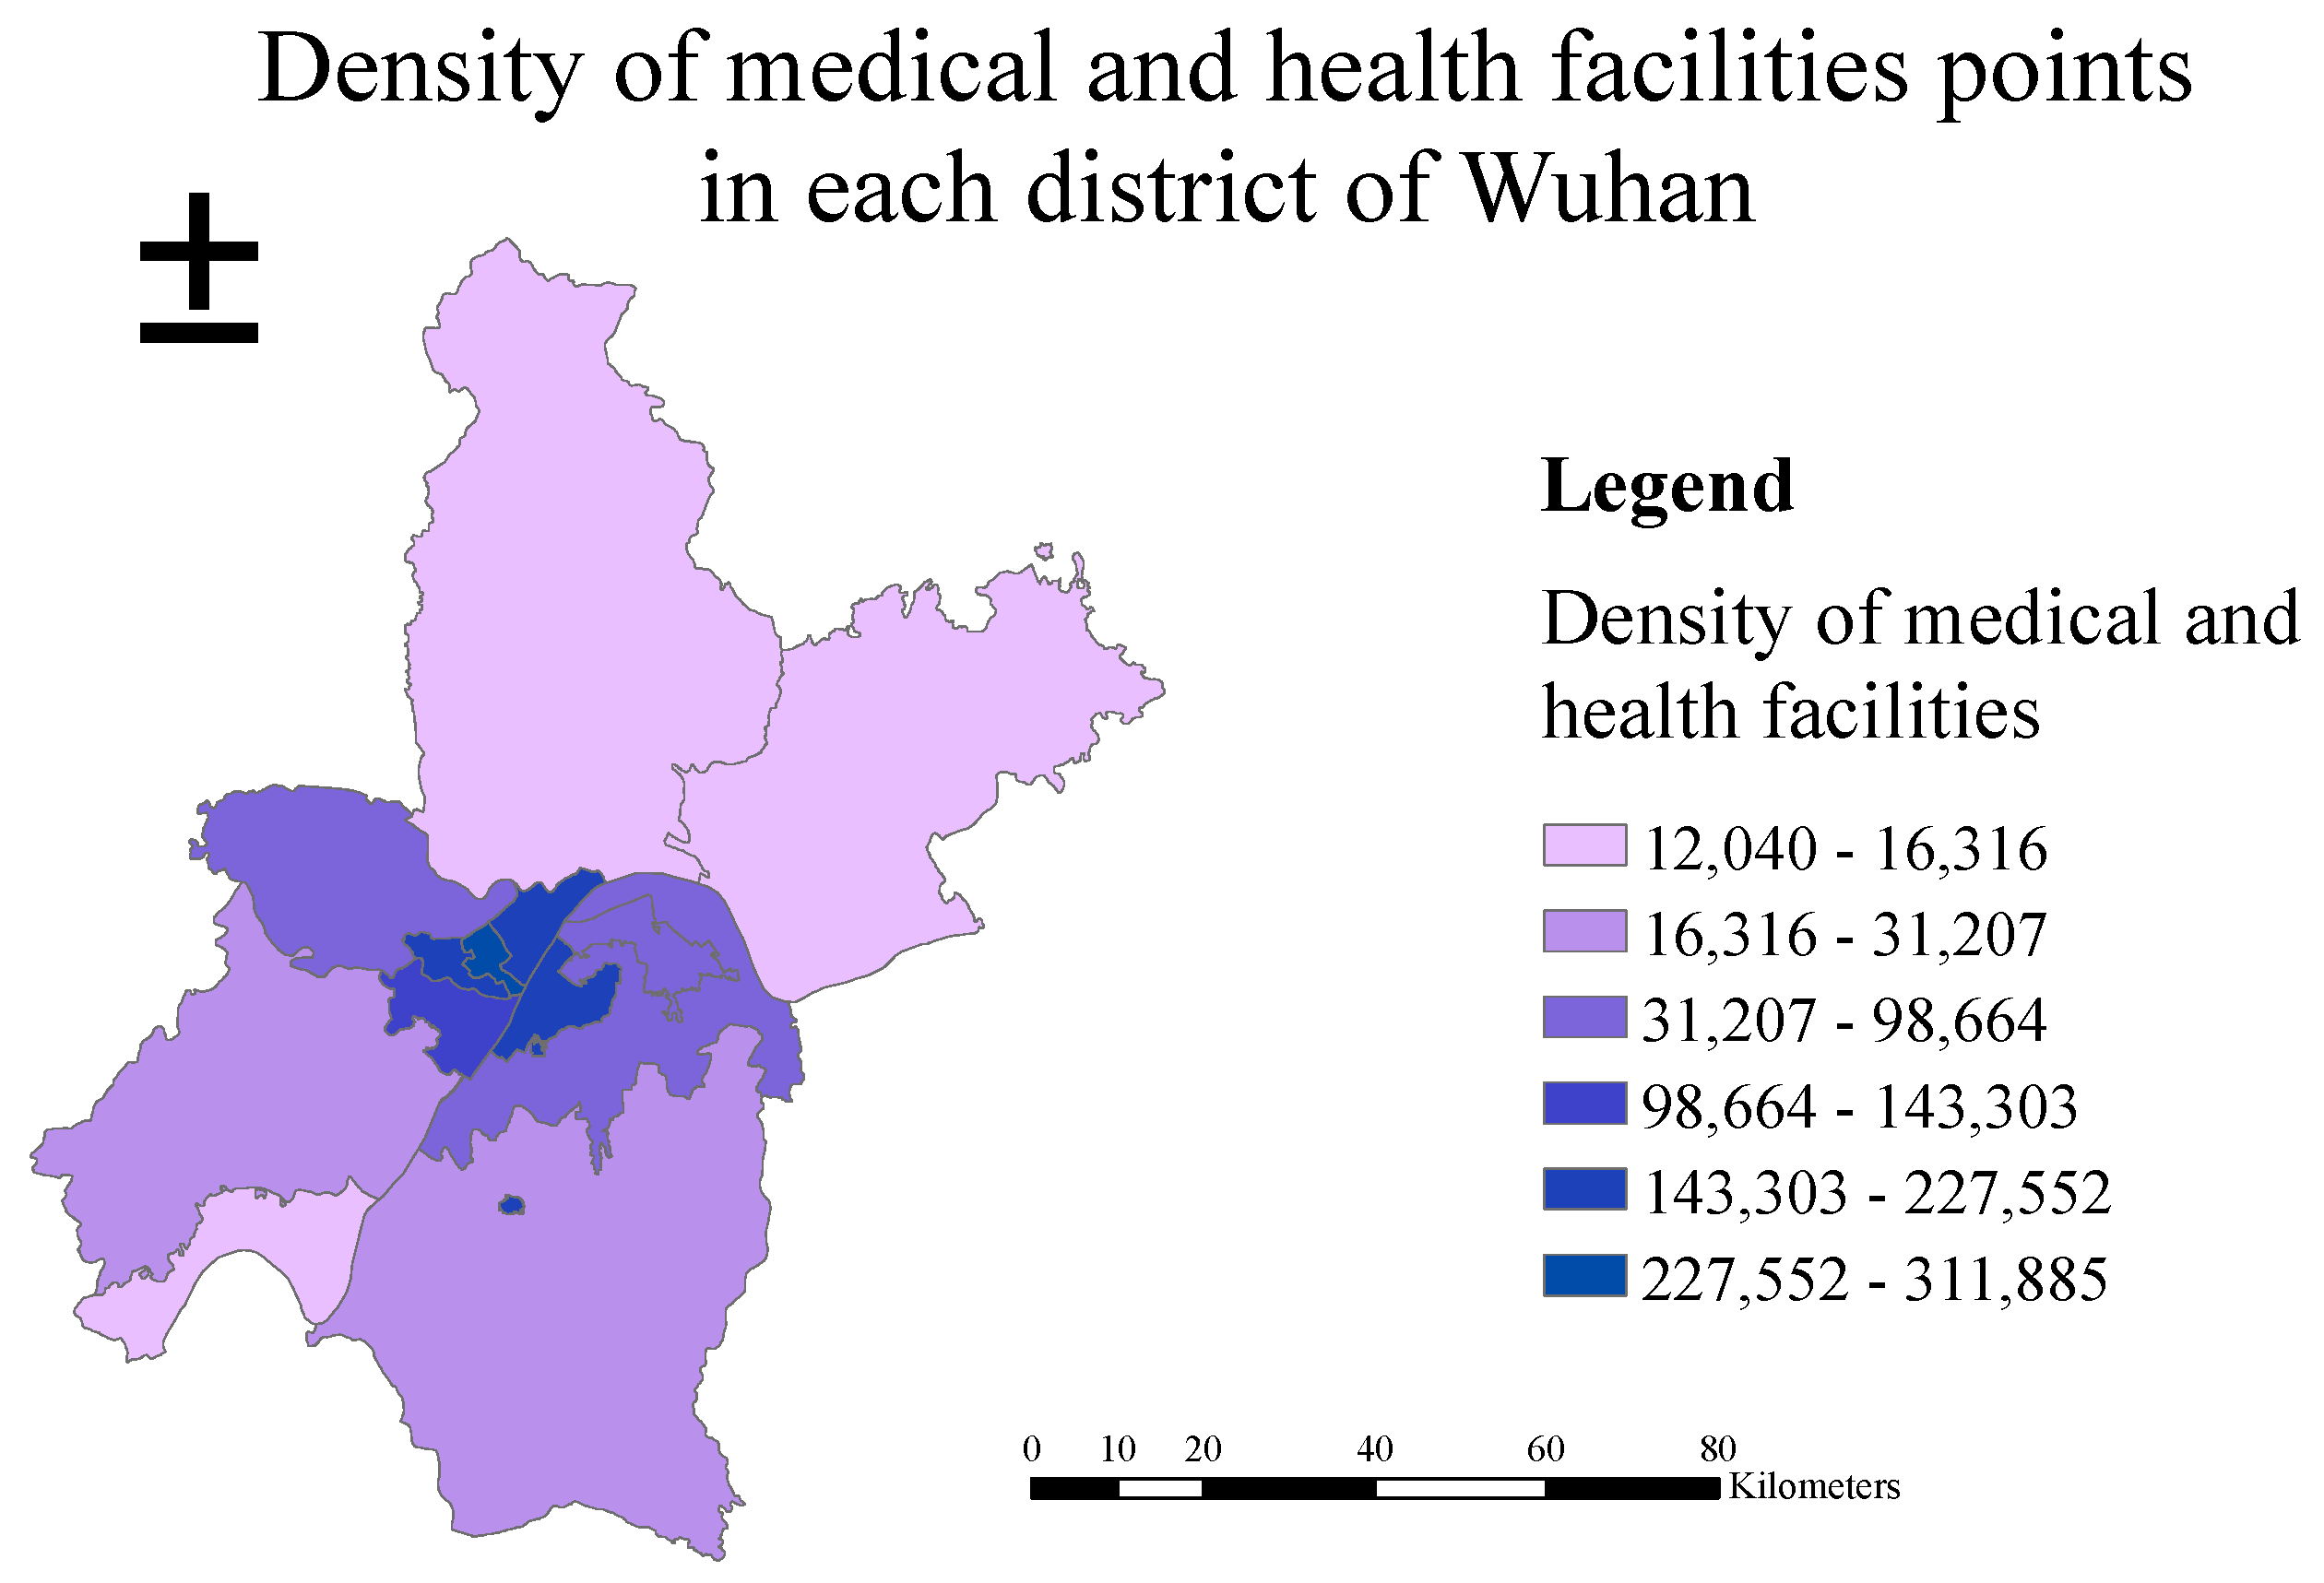
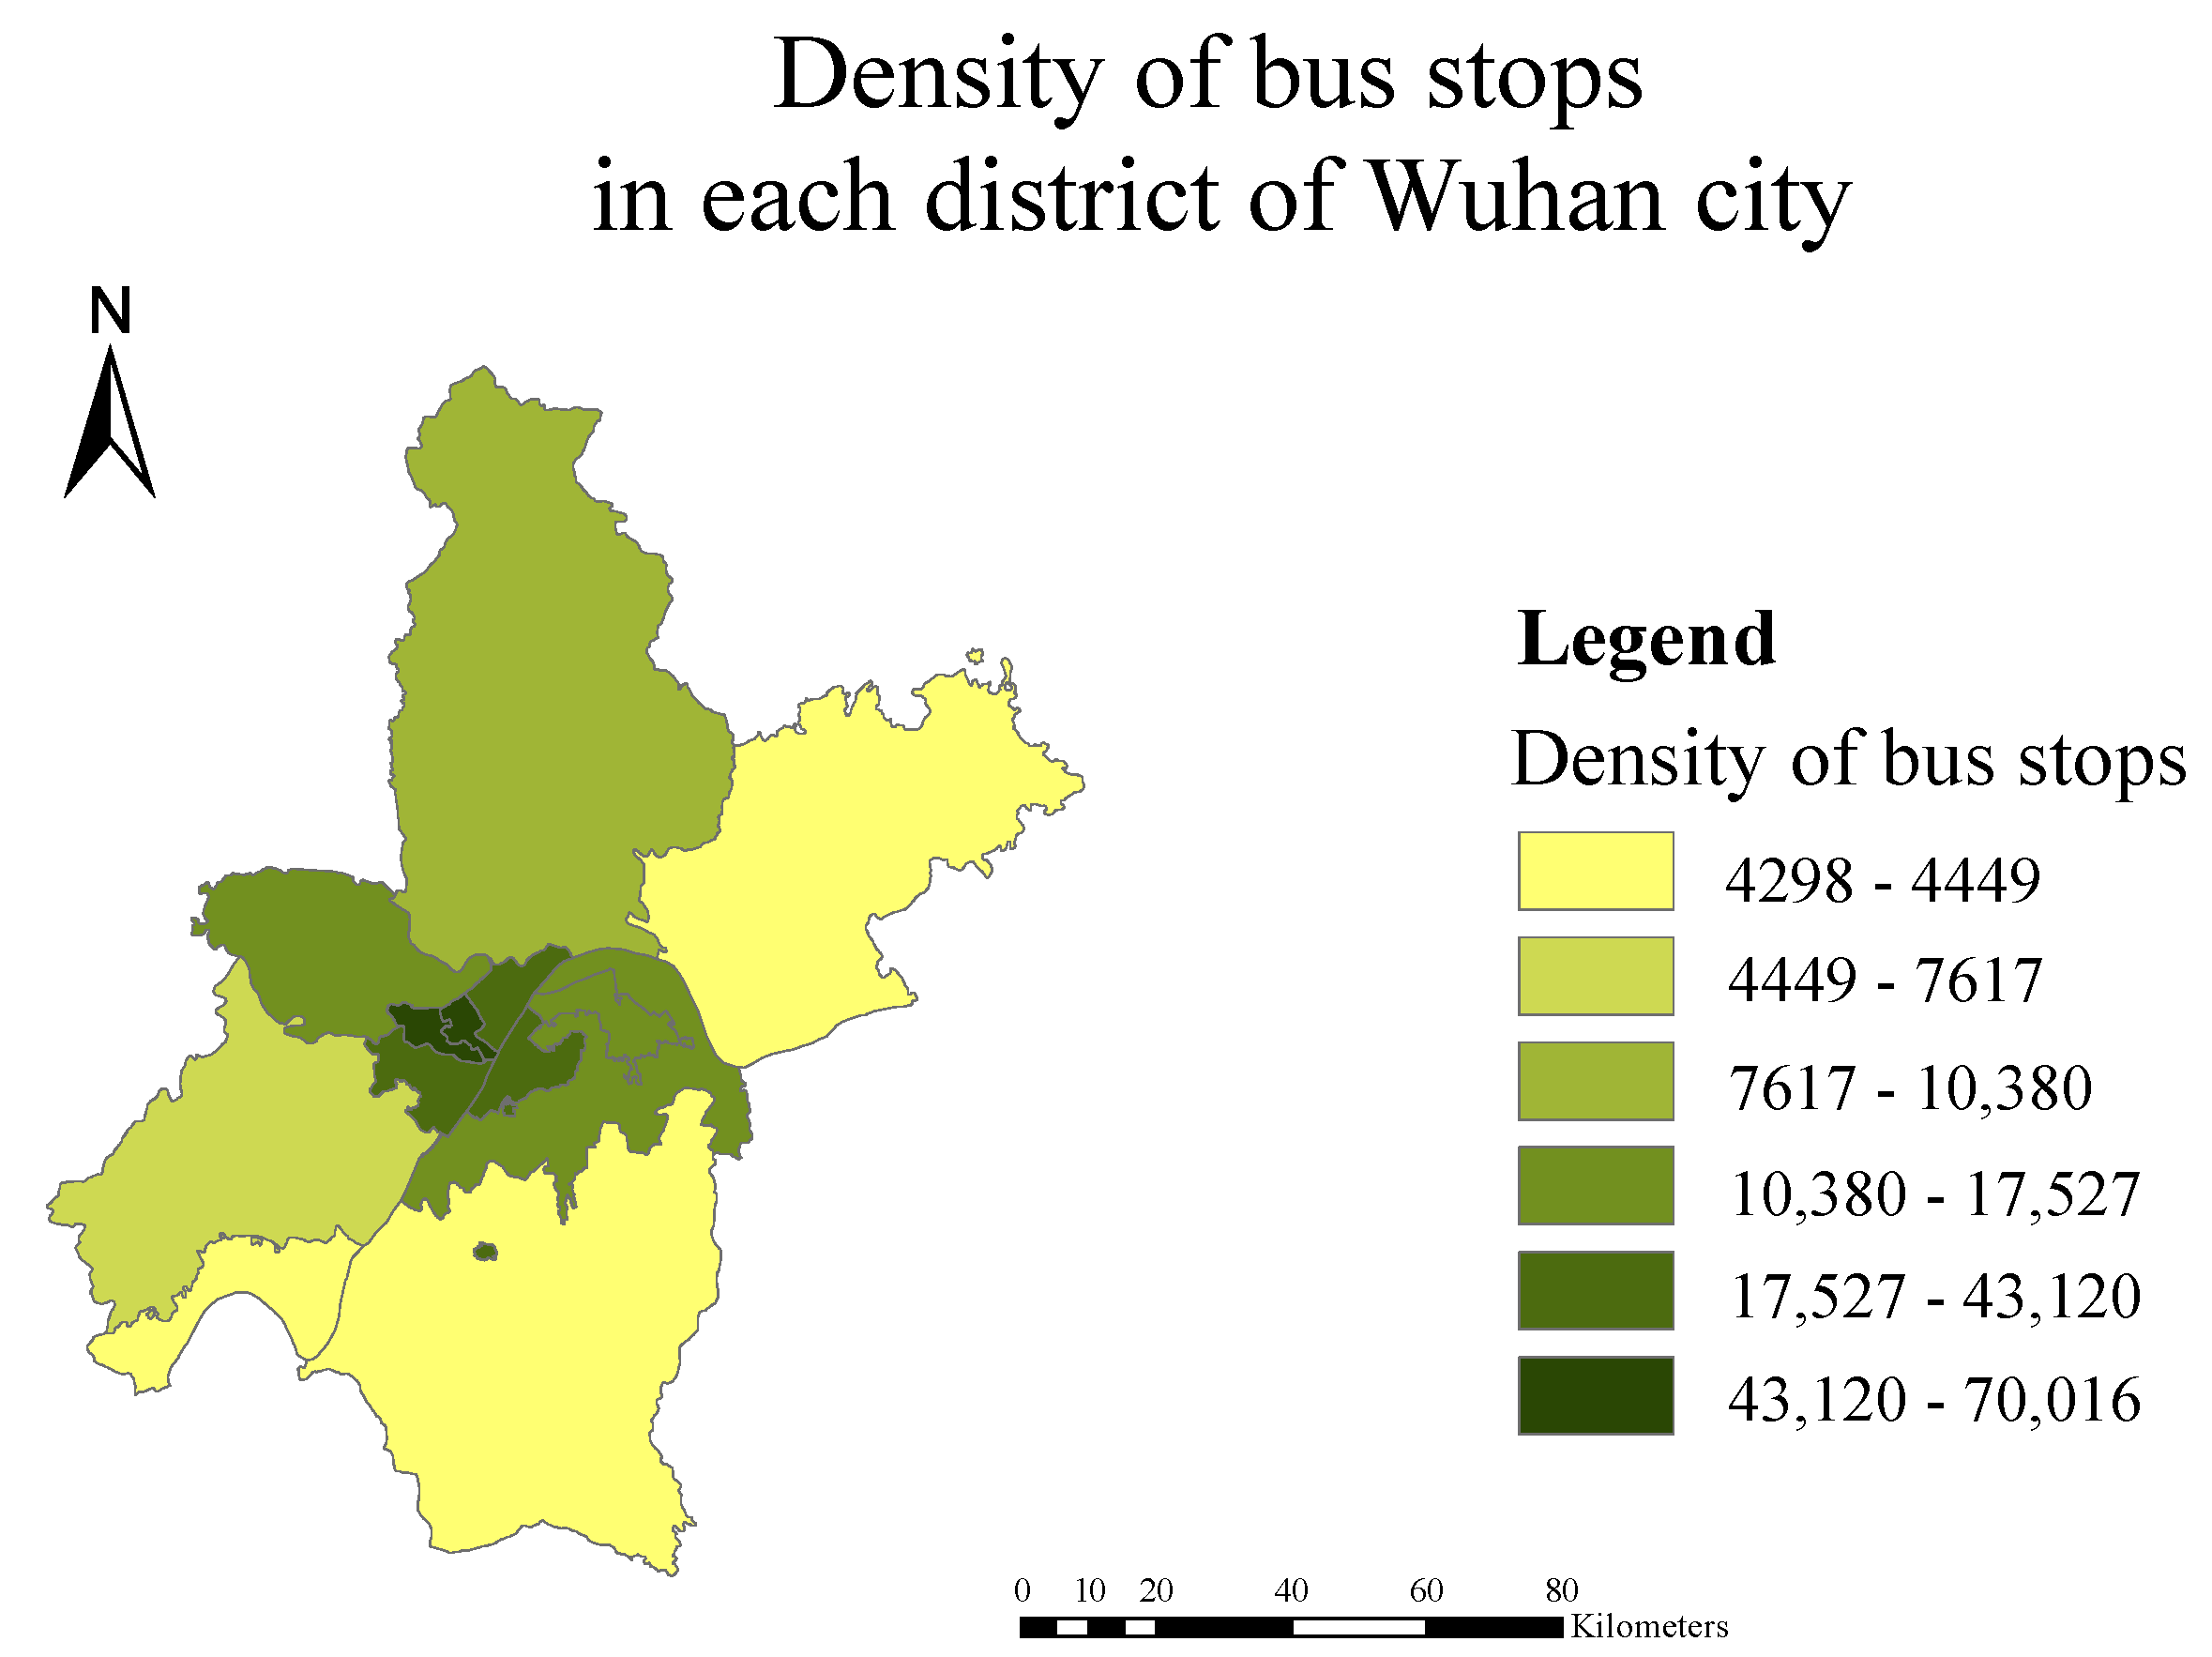
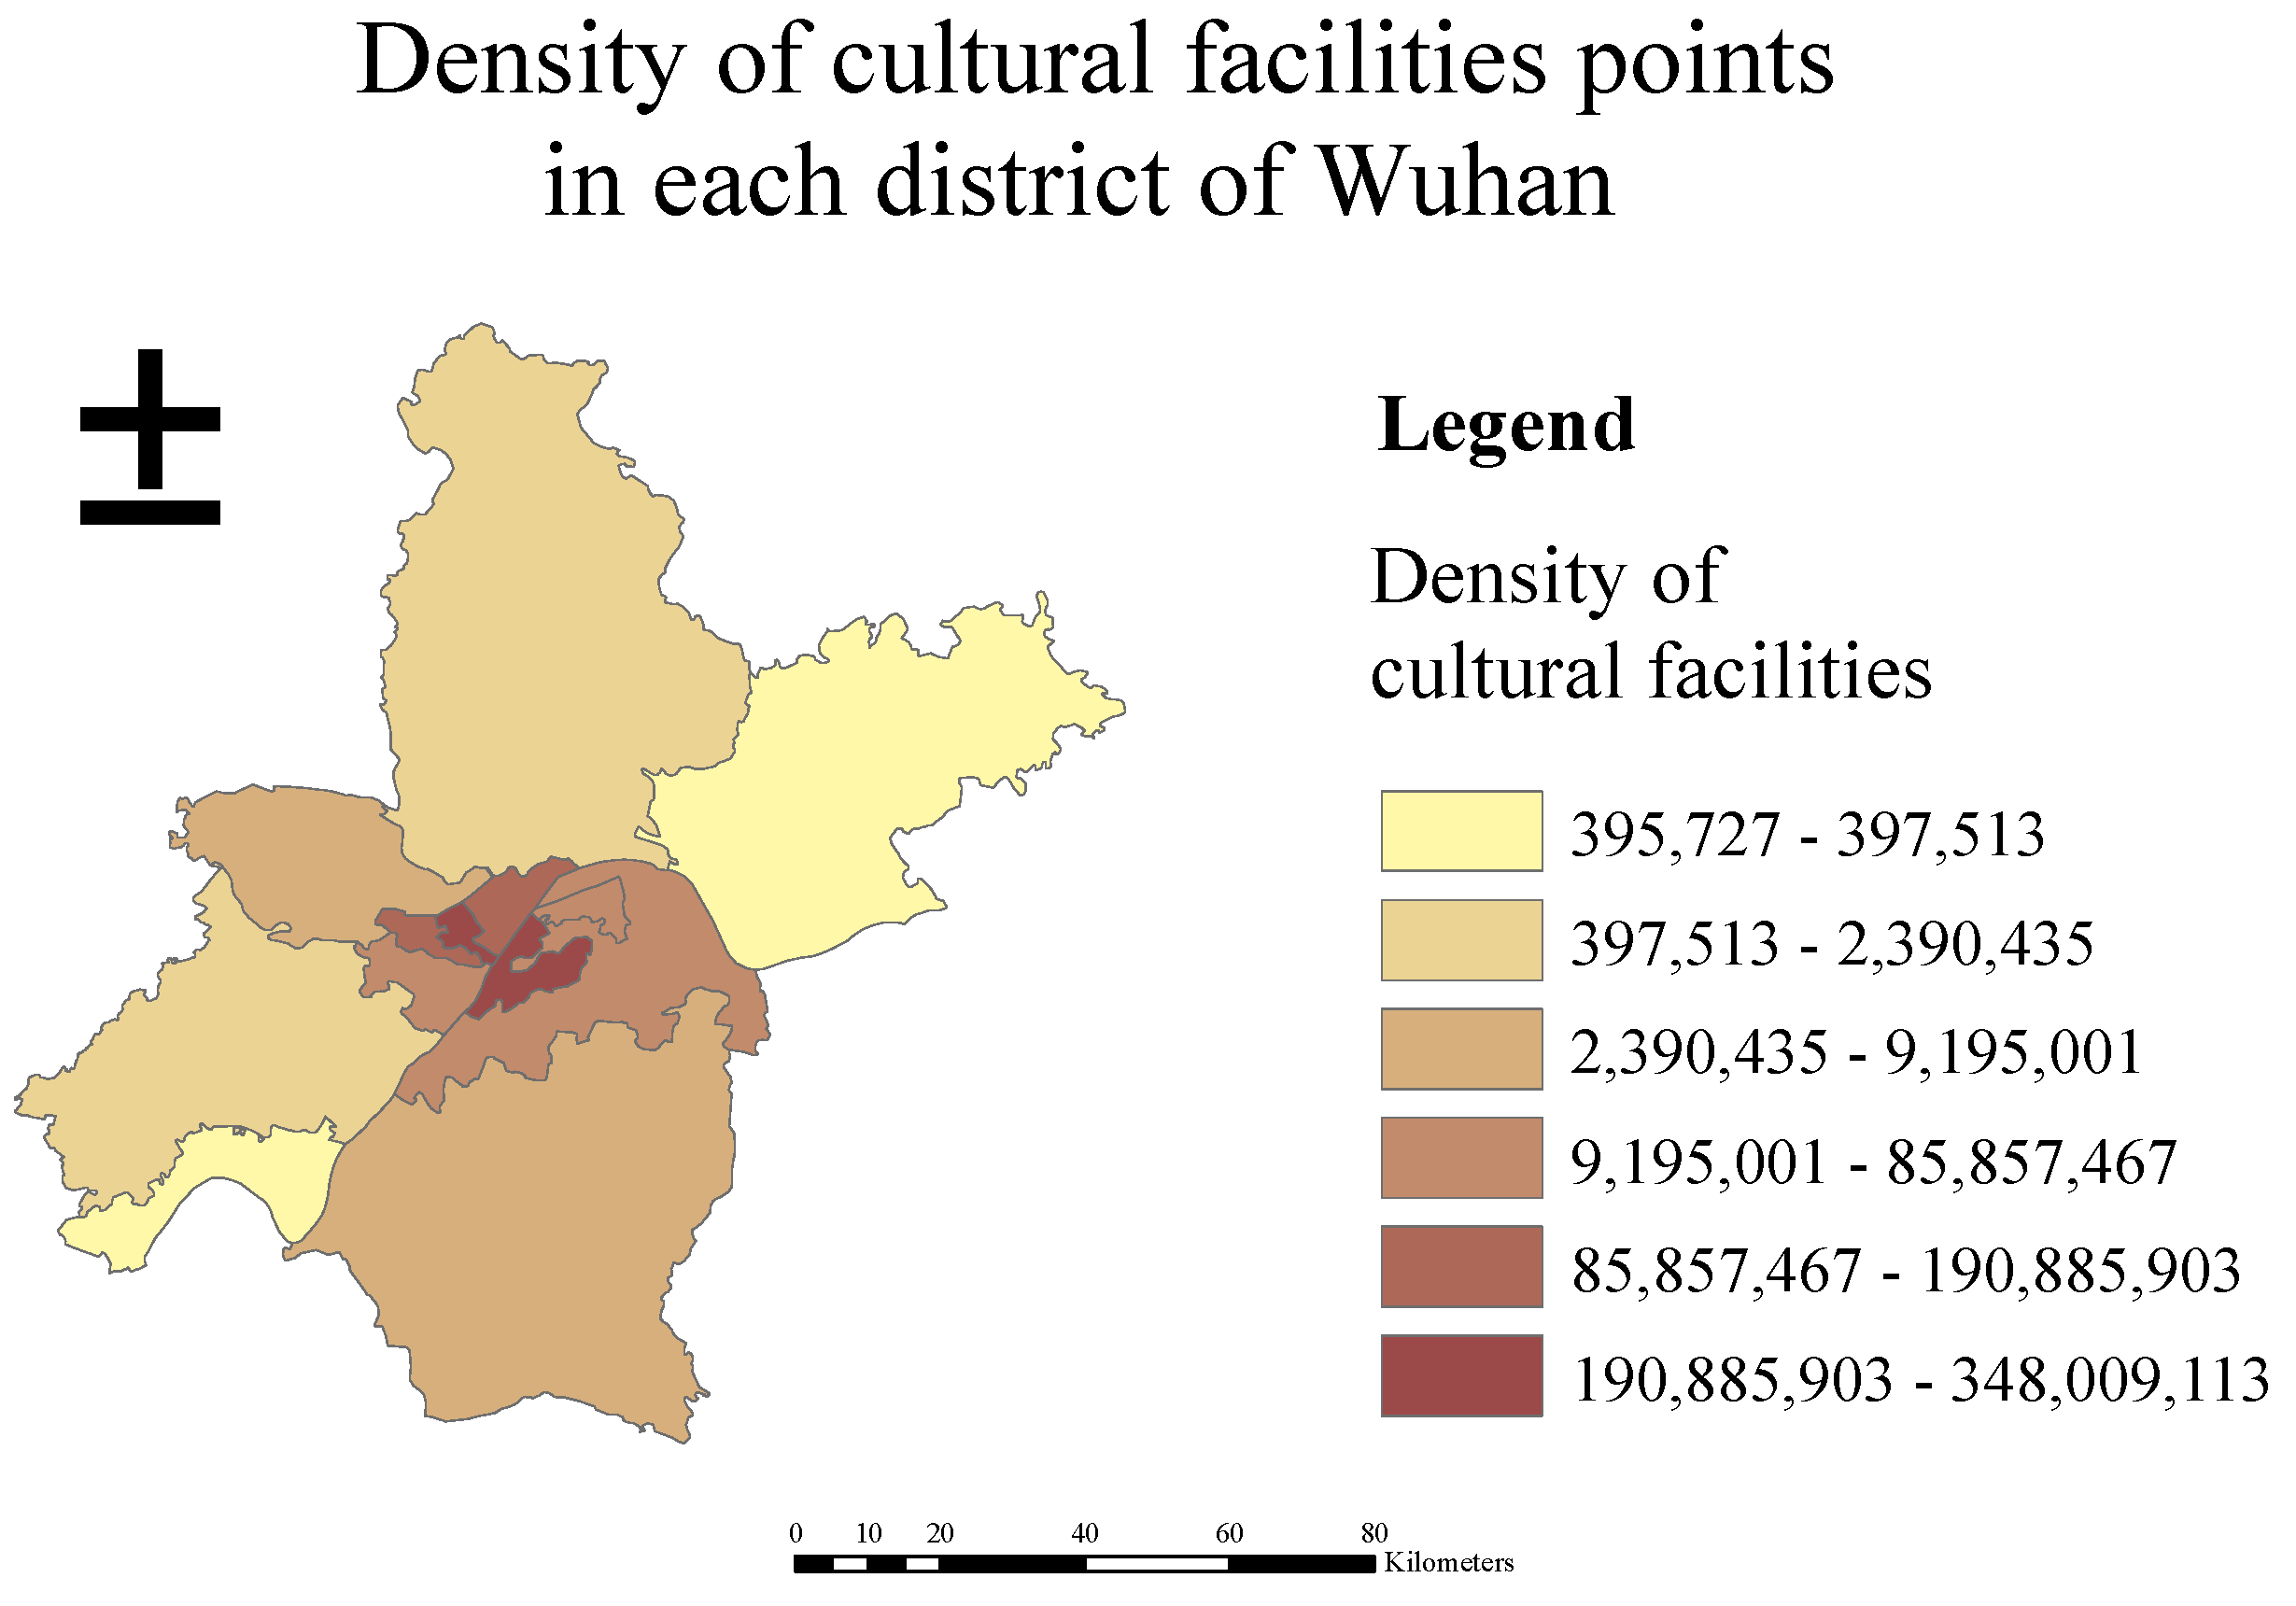
4.2.4. POI Data Point Density Analysis
4.3. TOPSIS Evaluation
4.3.1. Isotropy and Standardization
4.3.2. Performing TOPSIS Evaluation Analysis
4.4. Principal Component Analysis
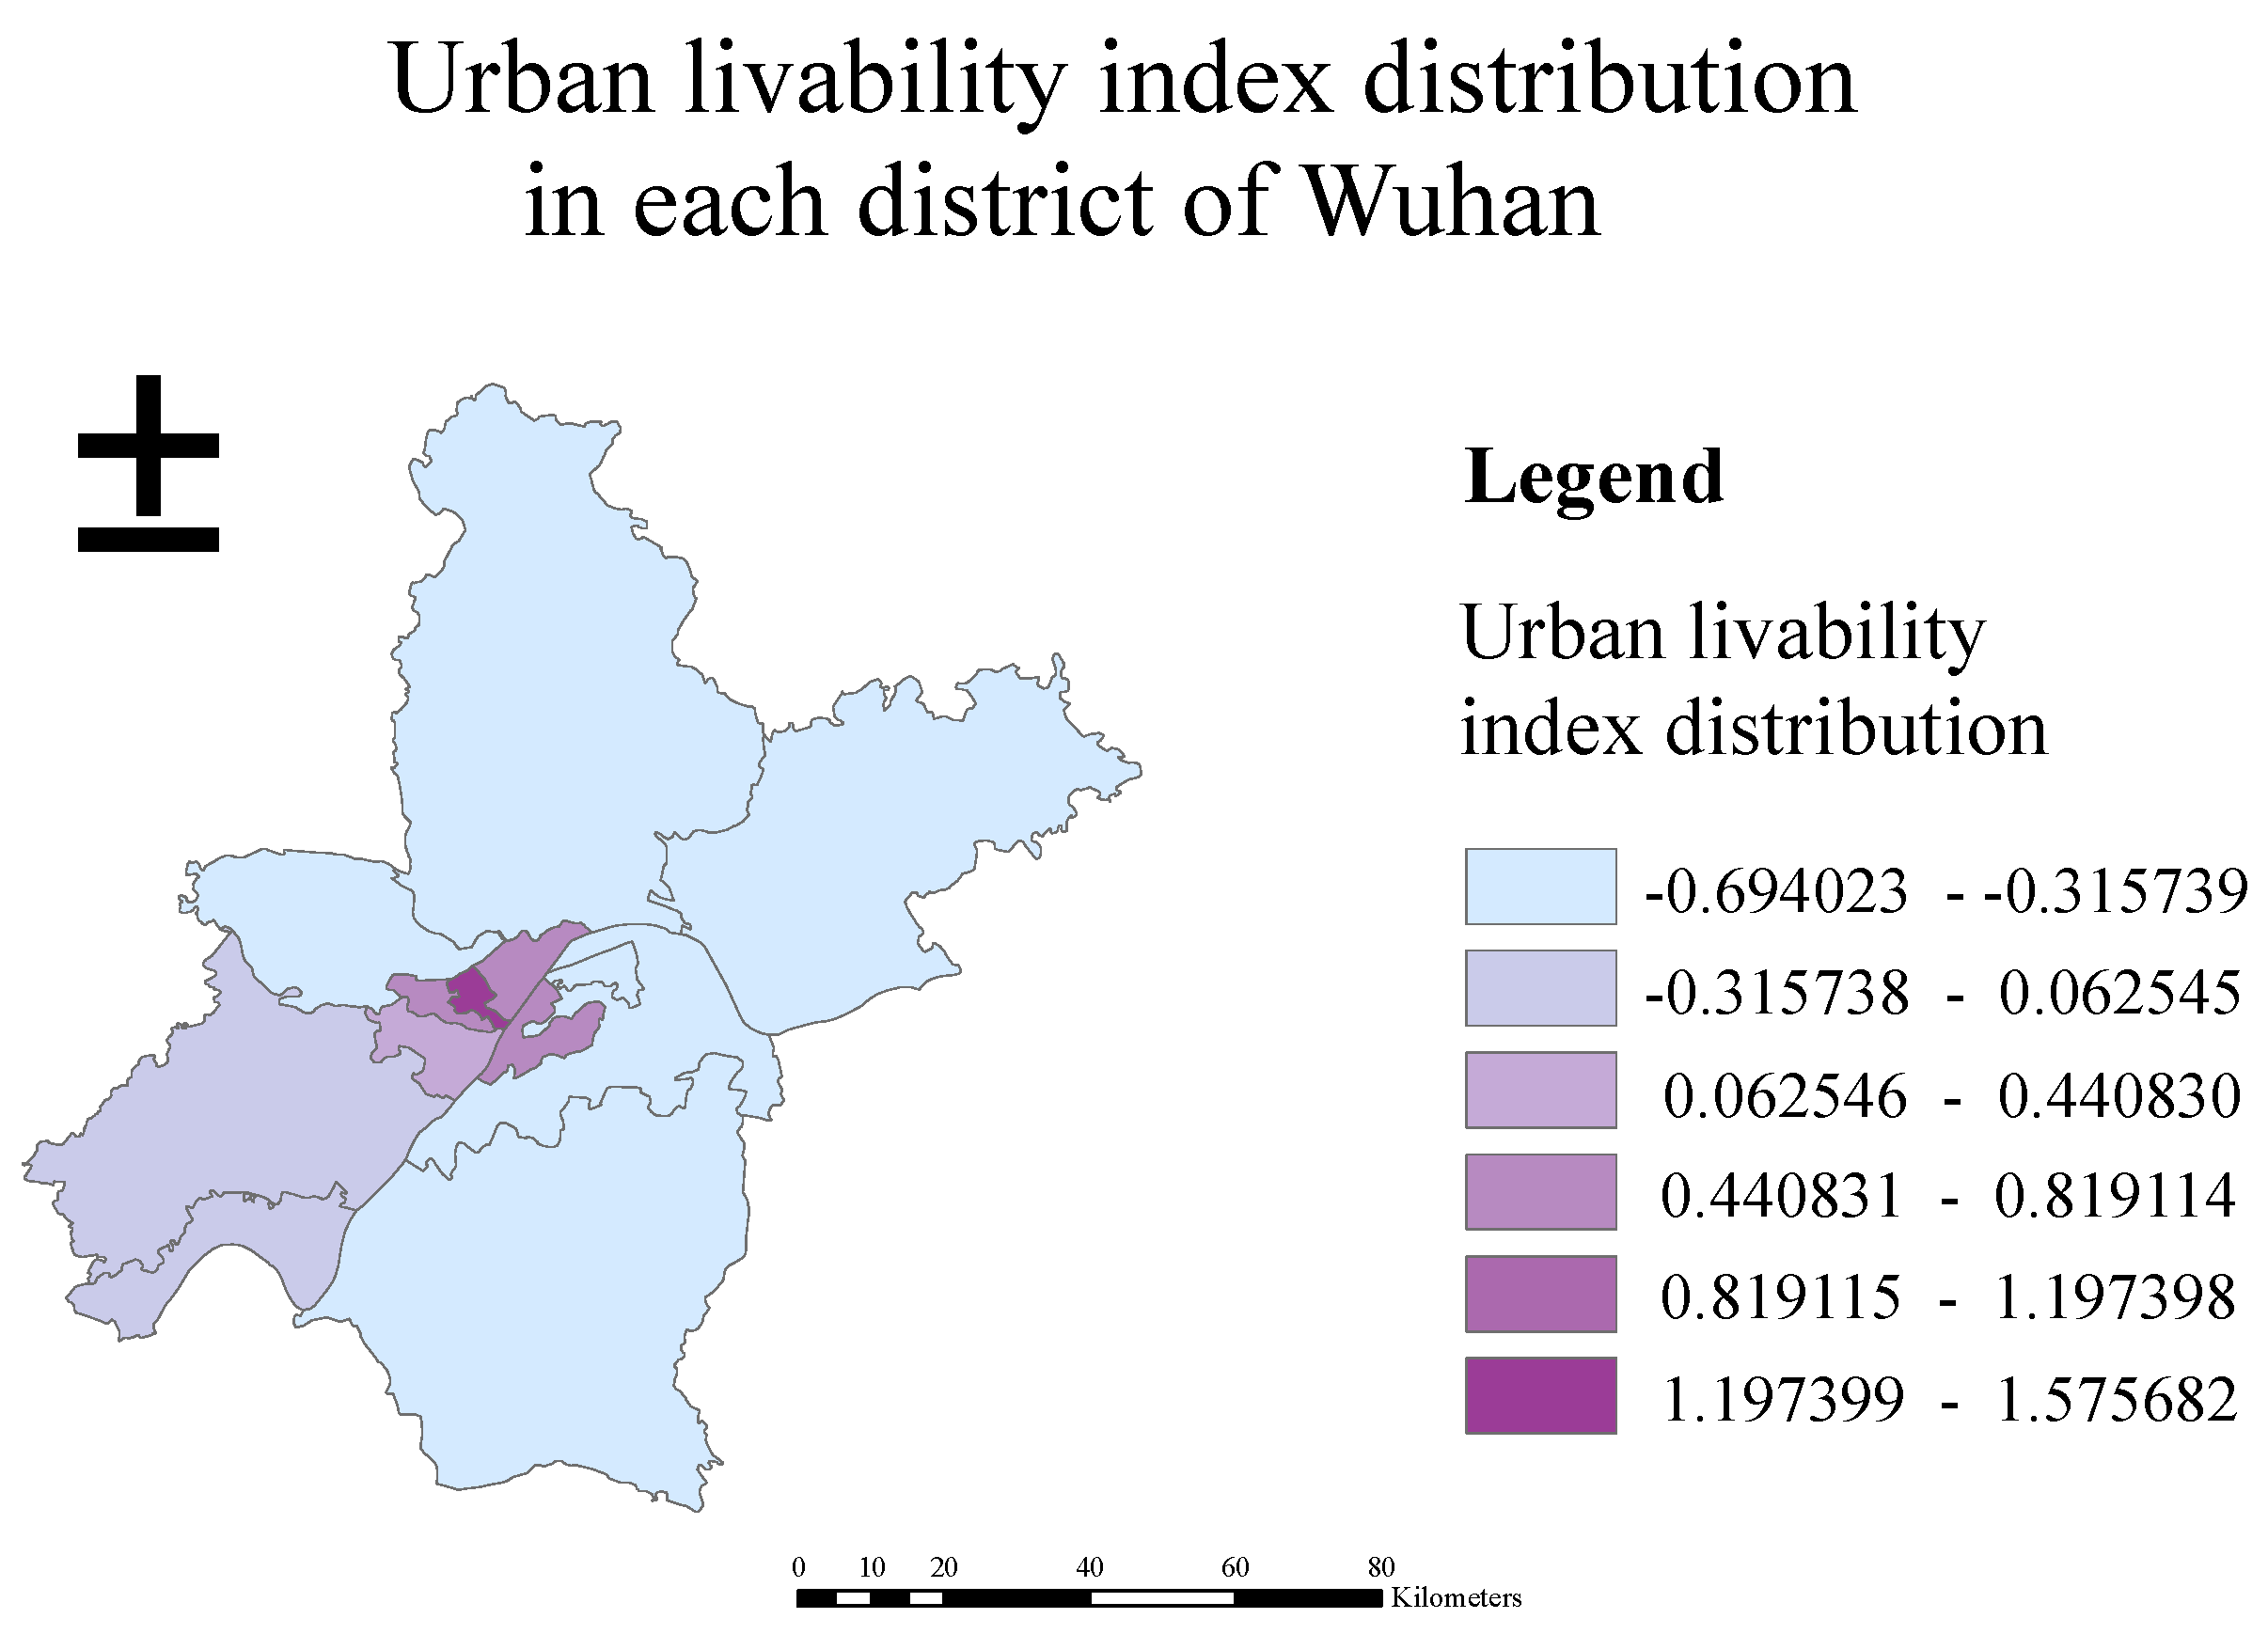
4.5. Spatial Pattern Analysis
4.5.1. Preliminary Analysis
4.5.2. LISA Analysis
5. Conclusions
6. Recommendation
6.1. Economic Perspective
6.2. Society Perspective
6.3. Ecologic Perspective
Author Contributions
Funding
Data Availability Statement
Conflicts of Interest
References
- Kashef, M. Urban livability across disciplinary and professional boundaries. Front. Arch. Res. 2016, 5, 239–253. [Google Scholar] [CrossRef]
- Schalock, R.L. The concept of quality of life: What we know and do not know. Intellect. Disabil. Res. 2004, 48, 203–216. [Google Scholar] [CrossRef] [PubMed]
- Felce, D.; Perry, J. Quality of life: Its definition and measurement. Res. Dev. Disabil. 1995, 16, 51–74. [Google Scholar] [PubMed]
- Fewsmith, J. Promoting the scientific development concept. J. China Leadersh. Monit. 2004, 11, 1–10. [Google Scholar]
- MacPherson, S. Social Development as an Organizing Concept for Social Progress; Routledge: London, UK, 2019; pp. 26–42. [Google Scholar]
- Chen, M.; Ye, C.; Lu, D.; Sui, Y.; Guo, S. Cognition and construction of the theoretical connotations of new urbanization with Chinese characteristics. J. Geogr. Sci. 2019, 29, 1681–1698. [Google Scholar] [CrossRef]
- Zalnejad, K.; Hossein, S.F.; Alipour, Y. The Impact of Livable City’s Principles on Improving Satisfaction Level of Citizens; Case Study: District 4 of Region 4 of Tehran Municipality. J. Arman. Archit. Urban Dev. 2019, 12, 171–183. [Google Scholar]
- Huang, K.X.; Ning, L.; Tian, G. Conquering China’s Unbalanced and Inadequate Development: Macroeconomic Outlook, Policy Simulations, and Reform Implementation-A Summary of Annual SUFE Macroeconomic Report (2017–2018). J. Front. Econ. China 2018, 13, 147–170. [Google Scholar]
- Mikhaylov, A.S. Socio-spatial dynamics, networks and modelling of regional milieu. Entrep. Sustain. Issues 2018, 5, 1020–1030. [Google Scholar] [CrossRef]
- Dong, M.; Zou, B.; Pu, Q.; Wan, N.; Yang, L.; Luo, Y. Spatial pattern evolution and casual analysis of county level economy in Changsha-Zhuzhou-Xiangtan urban agglomeration, China. Chin. Geogr. Sci. 2014, 24, 620–630. [Google Scholar] [CrossRef]
- Qiu, B.W.; Wang, Q.M.; Chen, C.C.; Chi, T.H. Spatial Autocorrelation Analysis of Multi-scale Land Use in Fujian Province. J. Nat. Resour. 2007, 22, 311–320. [Google Scholar]
- Kozina, J.; Bole, D. The impact of territorial policies on the distribution of the creative economy: Tracking spatial patterns of innovation in Slovenia. Hung. Geogr. Bull. 2018, 67, 259–273. [Google Scholar] [CrossRef]
- Xuan, G.F.; Jian-Gang, X.U.; Zhao, J. An Analysis of Urban Social Space Based on ESDA-A Case Study of the Central Urban District in Shanghai. Sci. Geogr. Sin. 2010, 30, 22–29. [Google Scholar]
- Wang, P.A.; Luo, W.H.; Bai, Y.P. Comparative Analysis of Aggregation Detection Based on Spatial Autocorrelation and Spatioal-Temporal Scan Statitstics. J. Hum. Geogr. 2012, 27, 119–127. [Google Scholar]
- Zhu, W.; Chen, J. The spatial analysis of digital economy and urban development: A case study in Hangzhou, China. Cities 2022, 123, 103563. [Google Scholar] [CrossRef]
- Song, M.; Xie, Q. Evaluation of urban competitiveness of the Huaihe River eco-economic belt based on dynamic factor analysis. Comput. Econ. 2021, 58, 615–639. [Google Scholar] [CrossRef]
- Li, Z.I.; Chen, M.M.; Pan, L.M. The Measurement and Evaluation of the Residents’ Life Quality Based on the Factor Analysis. Northwest Popul. J. 2012, 33, 22–26. [Google Scholar]
- Sarfraz, M.S.; Tripathi, N.K.; Tipdecho, T.; Thongbu, T.; Kerdthong, P.; Souris, M. Analyzing the spatio-temporal relationship between dengue vector larval density and land-use using factor analysis and spatial ring mapping. BMC Public Health 2012, 12, 853. [Google Scholar] [CrossRef] [Green Version]
- Wang, J.; Li, M.; Liu, Y.; Zhang, H.; Zou, W.; Cheng, L. Safety assessment of shipping routes in the South China Sea based on the fuzzy analytic hierarchy process. Saf. Sci. 2014, 62, 46–57. [Google Scholar] [CrossRef]
- Kumar, S.; Gautam, S.K.; Kumar, A.; Maithan, R.; Kumar, A. Sustainability assessment of different nanoparticle for heat exchanger applications: An intuitionistic fuzzy combinative distance-based assessment method. Acta Innov. 2021, 40, 44–63. [Google Scholar] [CrossRef]
- Sun, Y.; Liang, X.; Xiao, C. Assessing the influence of land use on groundwater pollution based on coefficient of variation weight method: A case study of Shuangliao City. Environ. Sci. Pollut. Res. 2019, 26, 34964–34976. [Google Scholar] [CrossRef]
- Liu, J.X.; Han, B.; Wang, M. Using multi-source data to assess livability in Hong Kong at the community-based level: A combined subjective-objective approach. Geogr. Sustain. 2020, 1, 284–294. [Google Scholar] [CrossRef]
- Turkoglu, H. Sustainable development and quality of urban life. Procedia Soc. Behav. Sci. 2015, 202, 10–14. [Google Scholar] [CrossRef]
- Royuela, V.; Moreno, R.; Vaya, E. Influence of quality of life on urban growth: A case study of Barcelona, Spain. Reg. Stud. 2010, 44, 551–567. [Google Scholar] [CrossRef]
- Linares, S.; Mikkelsen, C.A.; Velázquez, G.A.; Celemín, J.P. Spatial segregation and quality of life: Empirical analysis of medium-sized cities of buenos aires province. Indic. Qual. Life Lat. Am. 2016, 62, 201–218. [Google Scholar]
- Delmelle, E.; Thill, J.C.; Wang, C.H. Spatial dynamics of urban neighborhood quality of life. Ann. Reg. Sci. 2016, 56, 687–705. [Google Scholar] [CrossRef]
- Dadashpoor, H.; Khalighi, N. Investigating spatial distribution of regional quality of life (RQoL) in Iran between 1996 and 2011. Soc. Indic. Res. 2016, 127, 1217–1248. [Google Scholar] [CrossRef]
- Geng, S.B.; Zhu, W.R.; Shi, P.L. A functional land use classification for ecological, production and living spaces in the Taihang Mountains. J. Resour. Ecol. 2019, 10, 246–255. [Google Scholar]
- Liu, J.; Ye, J.; Yang, W.; Yu, S.X. Environmental impact assessment of land use planning in Wuhan city based on ecological suitability analysis. Procedia Environ. Sci. 2010, 2, 185–191. [Google Scholar]
- Xu, H.Q. A remote sensing index for assessment of regional ecological changes. China Environ. Sci. 2013, 33, 889–897. [Google Scholar]


| Data Number | Data Name | Data Source | Scale | Content |
|---|---|---|---|---|
| 1 | POI data of convenience facilities, bus stops, etc. in Wuhan | Baidu Map | Street | Includes site information on police stations, hospitals, primary and secondary schools in Wuhan |
| 2 | Landsat8 OLI-TIRS images | Geospatial Data Cloud | / | Includes Landsat 8 land imager and thermal infrared sensor remote sensing images of Wuhan and its surrounding areas |
| 3 | LUCC Land Use Data | Resource and Environment Science and Data Center | / | Includes land use data for Wuhan and its surrounding areas |
| 4 | Air monitoring station data | Cn Open Data | National | Includes daily hourly concentration values of each indicator at all national air monitoring stations for 2014–2020 |
| 5 | The Statistical Yearbook of Wuhan | Wuhan Municipal Bureau of Statistics (http://tjj.wuhan.gov.cn/, accessed on 20 December 2021) | County (District) | Including statistics on per capita disposable income and per capita housing area in each district of Wuhan |
| 6 | The administrative division map of Wuhan | National Geomatics Center of China | County (District) | Including the administrative boundaries of Wuhan City |
| Indicators | Calculation Formula | Explanation | Indicator Meaning |
|---|---|---|---|
| NDVI | are the near-infrared band and red band of Landsat 8 OLI, respectively | NDVI is closely related to vegetation growth and vegetation cover, and can indirectly reflect ecological vulnerability | |
| WET | are the bands of Landsat 8 OLI/TIRS; is the parameter corresponding to the bands of Landsat 8 OLI/TIRS | It is an important indicator of vegetation health and soil moisture status | |
| LST | Calculate the vegetation cover from NDVI, and then calculate the surface specific emissivity; query the parameters to calculate the radiant brightness values of black bodies at the same temperature, are constants; invert the surface temperature by the equation in the table | It is an important parameter for studying the exchange of materials and energy between the surface and the atmosphere | |
| NDBSI | SI and IBI stand for Soil Index and Building Index respectively | It reflects the degree of land degradation | |
| Indicators | Calculation Formula | Explanation |
|---|---|---|
| Plaque density | PD | Reflects landscape fragmentation and landscape spatial heterogeneity; generally large PD and high fragmentation |
| Maximum number of plaques | LPI | It indicates the largest patches in the whole landscape, which can directly reflect the dominance of a certain type in the landscape, and the size of the value directly affects the richness characteristics of the landscape |
| Number of plaques | NP | Indicates the heterogeneity of the whole landscape; the general rule is large NP and high fragmentation |
| Proportion of landscape area occupied by patches | PLAND | PLAND measures the components of the landscape. It is calculated as a comparison of the area of a patch type to the whole landscape; it is one of the bases to help determine the dominant landscape elements in the landscape. When its value tends to 0, it means that this patch type becomes very rare in the landscape, and when its value is equal to 100, it means that the whole landscape is composed of only one type of patch |
| Landscape area | CA | Used to indicate the size of the landscape area |
| AQI | Air Quality Index Level (Status) | Health Effects |
|---|---|---|
| 0–50 | Level 1 (Excellent) | Air quality is satisfactory, basically no air pollution |
| 51–100 | Level 2 (Good) | Very few unusually sensitive people should reduce outdoor activities |
| 101–150 | Level 3 (Light pollution) | Children, the elderly and people with heart and respiratory diseases should reduce prolonged and high-intensity outdoor exercise |
| 151–200 | Level 4 (Moderate pollution) | Children, the elderly and patients with heart and respiratory diseases should avoid prolonged, high-intensity outdoor exercise, and reduce outdoor exercise in moderation for the general population. |
| 201–300 | Level 5 (Severe pollution) | Children, the elderly and people with heart and lung disease should stay indoors and stop outdoor exercise, and reduce outdoor exercise for the general population |
| 300+ | Level 6 (Severe pollution) | Children, the elderly and the sick should stay indoors to avoid physical exertion, and the general population should avoid outdoor activities |
| Target Layer | Guideline Layer | Element Layer | Indicator Layer | Nature of Indicator | Indicator Calculation Method |
|---|---|---|---|---|---|
| Livability Friendliness | Economic level | Resident income | Disposable income per capita | + | Disposable income per capita |
| Consumption structure | Retail sales of social consumer goods | + | Retail sales of social consumer goods | ||
| Residence level | Housing use area per capita | + | Housing use area per capita | ||
| Social Environment | Commuting efficiency | Resident travel speed | − | Resident travel speed | |
| Public Transportation | Density of bus stop points | + | Mean value of point density of bus stops | ||
| Health Care | Hospital pharmacy point density | + | Mean value of point density of hospital pharmacies | ||
| Public Safety | Dispatch Point Density | + | Mean value of point density at dispatch | ||
| Culture and Leisure | Cultural facilities point density | + | Mean value of point density of cultural facilities | ||
| Convenience Services | Density of convenient facility points | + | Mean value of point density of convenience facilities | ||
| Ecology | Habitat | Remote Sensing Ecological Index | + | Remote sensing ecological index mean value | |
| Environmental Health | Hourly Average AQI Value | + | Hourly average AQI value mean value | ||
| Landscape Patterns | Comprehensive Landscape Index | + | Comprehensive Landscape Index |
| Indicator | NDVI | WET |
|---|---|---|
| Normalization results | 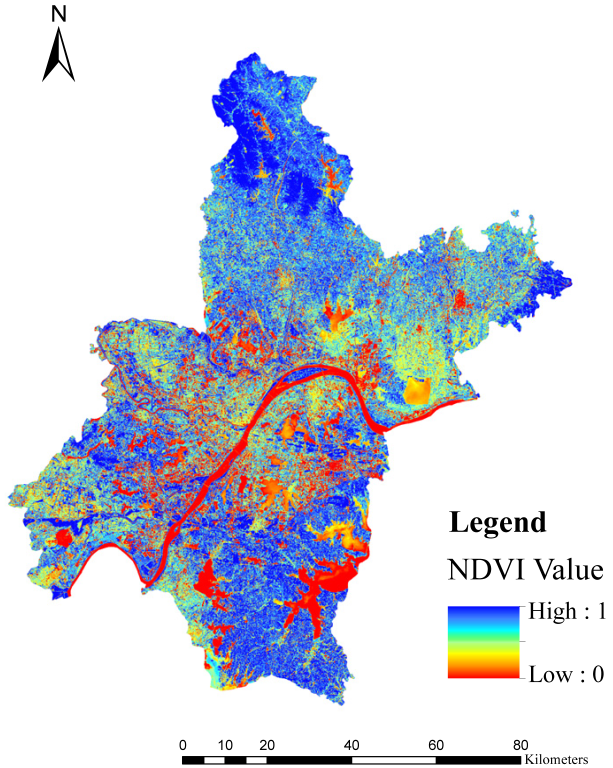 a | 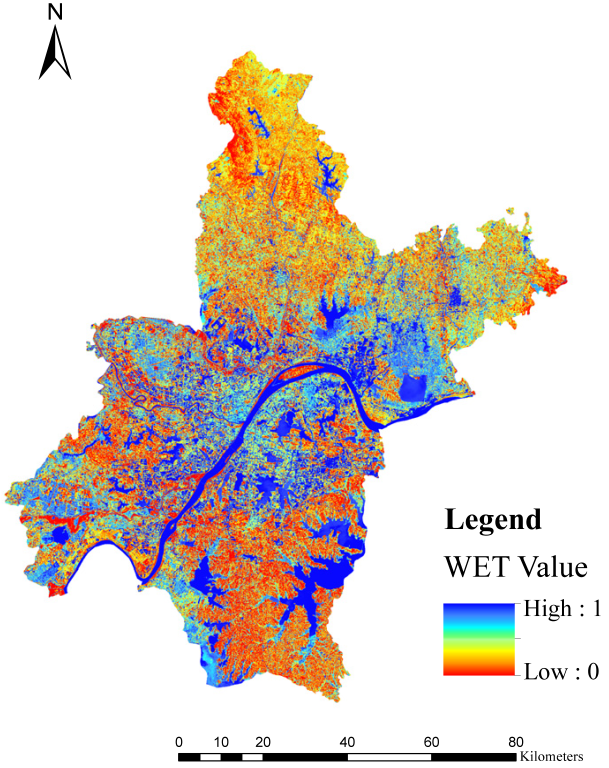 b |
| Indicator | LST | NDBSI |
| Normalization results | 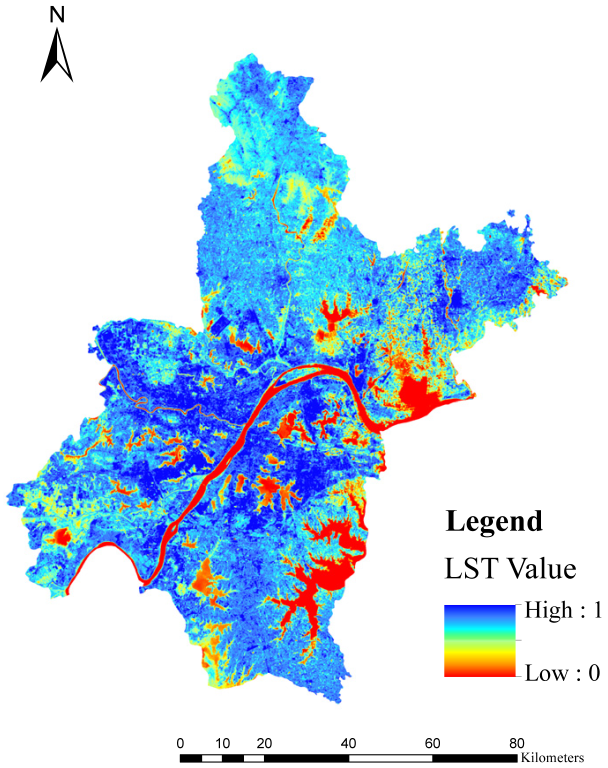 c | 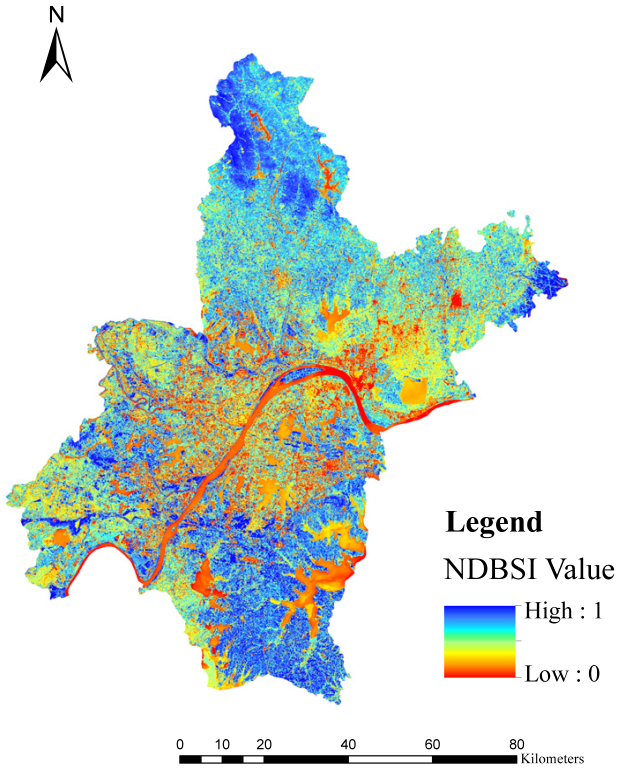 d |
| District | CA | PLAND | NP | PD | LPI |
|---|---|---|---|---|---|
| Jiangan District | 1950.0 | 25.0 | 4.0 | 0.051 | 19.231 |
| Jianghan District | 675.0 | 25.0 | 1.5 | 0.056 | 23.148 |
| Qiaokou District | 800.0 | 20.0 | 3.0 | 0.075 | 14.000 |
| Hanyang District | 2850.0 | 25.0 | 6.8 | 0.059 | 11.623 |
| Wuchang District | 1683.3 | 16.7 | 2.3 | 0.023 | 12.706 |
| Qingshan District | 1666.7 | 16.7 | 3.5 | 0.035 | 12.333 |
| Hongshan District | 7814.3 | 14.3 | 15.1 | 0.028 | 4.649 |
| Caidian District | 15,514.3 | 14.3 | 22.7 | 0.021 | 8.235 |
| Jiangxia District | 28,028.6 | 14.3 | 31.7 | 0.016 | 9.902 |
| Huangpi District | 36,766.7 | 16.7 | 28.5 | 0.013 | 12.451 |
| Xinzhou District | 24,166.7 | 16.7 | 30.8 | 0.021 | 12.345 |
| Hannan District | 5780.0 | 20.0 | 8.4 | 0.029 | 13.564 |
| Dongxihu District | 8300.0 | 16.7 | 13.1 | 0.027 | 10.455 |
| Item | Positive Ideal Solution A+ | Negative Ideal Solution A− |
|---|---|---|
| Z_Disposable income per capita | 1.165 | −1.462 |
| Z_Retail sales of social consumer goods (million) | 2.205 | −1.415 |
| Z_Housing use area per capita (m2/people) | 1.500 | −1.449 |
| Z_Resident travel speed (km/h) | 1.505 | −1.826 |
| Z_Average density of bus stop points | 2.086 | −0.966 |
| Z_Hospital pharmacy point density mean value | 2.050 | −0.982 |
| Z_Mean value of dispatch point density | 2.294 | −0.824 |
| Z_Average density of cultural facility points | 2.221 | −0.819 |
| Z_Average density of convenient service points | 2.240 | −0.845 |
| Z_RSEI Mean Value | 1.994 | −1.692 |
| Z_Comprehensive Landscape Index | 2.254 | −1.684 |
| Z_Countdown_Hourly average AQI value | 2.081 | −2.115 |
| District | Positive Ideal Solution Distance D+ | Negative Ideal Solution Distance D− | Relative Proximity C | Sort Results |
|---|---|---|---|---|
| Jianhan District | 6.008 | 9.206 | 0.605 | 1 |
| Wuchang District | 5.421 | 7.112 | 0.567 | 2 |
| Jiangan District | 5.507 | 6.657 | 0.547 | 3 |
| Caidian District | 7.616 | 6.412 | 0.457 | 4 |
| Hanyang District | 6.583 | 5.531 | 0.457 | 5 |
| Jiangxia District | 8.024 | 6.128 | 0.433 | 6 |
| Qiaokou District | 7.193 | 5.420 | 0.430 | 7 |
| Hannan District | 8.377 | 5.729 | 0.406 | 8 |
| Hongshan District | 8.020 | 4.912 | 0.380 | 9 |
| Huangpi District | 8.730 | 5.188 | 0.373 | 10 |
| Xinzhou District | 9.049 | 4.870 | 0.350 | 11 |
| Qingshan District | 8.916 | 3.785 | 0.298 | 12 |
| Dongxihu District | 9.014 | 3.464 | 0.278 | 13 |
| Principal Components | Eigenvalue | Contribution Rate (%) | Cumulative Contribution Rate (%) |
|---|---|---|---|
| 1 | 7.851 | 65.421 | 65.421 |
| 2 | 1.794 | 14.951 | 80.372 |
| Factor | Principal Components 1 | Principal Components 2 |
|---|---|---|
| Disposable income per capita | −0.789 | −0.209 |
| Retail sales of social consumer goods | −0.781 | −0.325 |
| Resident travel speed | −0.804 | −0.346 |
| Housing use area per capita | −0.750 | −0.206 |
| Density of bus stop points | −0.971 | −0.069 |
| Hospital pharmacy point density | −0.984 | −0.010 |
| Dispatch Point Density | −0.992 | −0.012 |
| Cultural facilities point density | −0.968 | −0.095 |
| Density of convenient service facility points | −0.992 | −0.003 |
| RSEI | −0.688 | −0.504 |
| Comprehensive Landscape Index | −0.028 | −0.884 |
| Hourly average AQI value | −0.490 | −0.668 |
| District | Score of Main Factor 1 | Score of Main Factor 2 | Overall Score | Rank |
|---|---|---|---|---|
| Jianghan District | −2.23692 | −0.75090 | 1.57568 | 1 |
| WuchangDistrict | −1.03239 | −0.59316 | 0.76408 | 2 |
| Jiangan District | −0.88382 | −0.38315 | 0.63549 | 3 |
| Qiaokou District | −0.93832 | −1.04493 | 0.45763 | 4 |
| Hanyang District | −0.19130 | −0.40695 | 0.06431 | 5 |
| Hannan District | −0.65143 | −1.11737 | 0.25911 | 6 |
| Caidian District | −0.79472 | −1.46494 | 0.30089 | 7 |
| Hongshan District | −0.28200 | −0.88991 | 0.31754 | 8 |
| Qingshan District | −0.11151 | −1.92268 | 0.36041 | 9 |
| Dongxi Lake District | −0.56215 | −0.53034 | 0.44706 | 10 |
| Jiangxia District | −0.93929 | −1.11934 | 0.44714 | 11 |
| Huangpi District | −0.99335 | −0.14149 | 0.67101 | 12 |
| Xinzhou District | −0.94829 | −0.49256 | 0.69402 | 13 |
| District | Comprehensive Index | Rank |
|---|---|---|
| Jiangan District | −0.63549 | 3 |
| Jianghan District | −1.57568 | 1 |
| Qiaokou District | −0.45763 | 4 |
| Hanyang District | −0.06431 | 5 |
| Wuchang District | −0.76408 | 2 |
| Qingshan District | −0.36041 | 9 |
| Hongshan District | −0.31754 | 8 |
| Dongxihu District | −0.44706 | 10 |
| Hannan District | −0.25911 | 6 |
| Caidian District | −0.30089 | 7 |
| Jiangxia District | −0.44714 | 11 |
| Huangpi District | −0.67101 | 12 |
| Xinzhou District | −0.69402 | 13 |
Publisher’s Note: MDPI stays neutral with regard to jurisdictional claims in published maps and institutional affiliations. |
© 2022 by the authors. Licensee MDPI, Basel, Switzerland. This article is an open access article distributed under the terms and conditions of the Creative Commons Attribution (CC BY) license (https://creativecommons.org/licenses/by/4.0/).
Share and Cite
Cui, H.; Fang, H.; Tian, Y.; Zheng, W.; Li, W.; Tian, W. Evaluation of Livability of Wuhan under Ecological Construction and Analysis of Its Spatial Pattern. Sustainability 2022, 14, 11283. https://doi.org/10.3390/su141811283
Cui H, Fang H, Tian Y, Zheng W, Li W, Tian W. Evaluation of Livability of Wuhan under Ecological Construction and Analysis of Its Spatial Pattern. Sustainability. 2022; 14(18):11283. https://doi.org/10.3390/su141811283
Chicago/Turabian StyleCui, Heng, Hanzhen Fang, Yiyuan Tian, Wenlong Zheng, Wenzhuo Li, and Wengao Tian. 2022. "Evaluation of Livability of Wuhan under Ecological Construction and Analysis of Its Spatial Pattern" Sustainability 14, no. 18: 11283. https://doi.org/10.3390/su141811283
APA StyleCui, H., Fang, H., Tian, Y., Zheng, W., Li, W., & Tian, W. (2022). Evaluation of Livability of Wuhan under Ecological Construction and Analysis of Its Spatial Pattern. Sustainability, 14(18), 11283. https://doi.org/10.3390/su141811283