Article

The Influence of Plastic Barriers on Aerosol Infection Risk during Airport Security Checks

1
Department of Mechanical Engineering, University of Maryland, College Park, MD 20742, USA
2
Department of Environment Health, Harvard T.H. Chan School of Public Health, Boston, MA 02115, USA
3
Division of Environmental and Population Health Biosciences, Environmental and Occupational Health Sciences Institute, Rutgers School of Public Health, Piscataway, NJ 08854, USA
*
Author to whom correspondence should be addressed.
Sustainability 2022, 14(18), 11281; https://doi.org/10.3390/su141811281
Submission received: 16 July 2022 / Revised: 27 August 2022 / Accepted: 2 September 2022 / Published: 8 September 2022
(This article belongs to the Special Issue Ventilation and Indoor Air Quality in Sustainable Buildings)

Abstract

:
Plastic barriers physically separate queuing passengers in airport security check areas as a measure against aerosol transmission. However, this may create “canyons” that interfere with the existing ventilation design: potentially inhibiting airflow, concentrating exhaled viruses, and exacerbating aerosol transmission risk. Accordingly, this study investigated the transmission implications of installing plastic barriers in a security check area with computational fluid dynamics (CFD). Two air distribution schemes were modeled: one with linear air supply diffusers aligned vertically to (Case 1) and another with diffusers parallel with (Case 2) the orientation of partitions. The drift-flux model was used to calculate the spread of viral bioaerosols with 5 µm in diameter; then the Wells–Riley equation was applied to assess aerosol transmission risk for SARS-CoV-2. According to simulation results, in Case 1, installing plastic barriers resulted in relatively small changes in volume with a high infection risk of 1% or greater in the breathing zone within the first 25 min. However, in Case 2, using plastic barriers resulted in the continuous increase in this volume within the first 25 min while this volume was near zero if without plastic barriers. In conclusion, installing plastic barriers needs careful consideration because they do not reduce the risk of airborne SARS-CoV-2 transmission and might even exacerbate it without localized ventilation and air cleaning.

1. Introduction

The coronavirus disease 2019 (COVID-19) pandemic has caused over 545.2 million confirmed infections and over 6.3 million deaths globally, as of 1 July 2022 [1]. Its basic reproductive rate (R0) was estimated to be in the range of 1.8–3.6. This is similar to the R0 range for SARS-CoV-1 and the 1918 influenza pandemic, which is 2.0–3.0, and much higher than that for MERS-CoV (0.9) and the 2009 influenza pandemic (1.5) [2]. The new variant, i.e., Omicron, has numerous mutations with potential to increase transmissibility [3]. Only 20 days following the first detected Omicron case in the US, it became the most dominant strain, accounting for approximately 59% of all COVID-19 cases in the US [4]. Particularly, COVID-19 can be transmitted quite effectively by mildly ill or presymptomatic patients [5]. Asymptomatic transmission accounts for around 59% of all transmission, with 35% for presymptomatic patients and 24% for virus carriers that never developed symptoms [6].
SARS-CoV-2 can stay viable in aerosols smaller than 5 µm for up to 2.64 h [7]. The viral bioaerosols can cause infection if exhaled. Aerosol transmission has been confirmed by ferret experiments [8]. Based on the visualization by highly sensitive laser light in a stagnant indoor environment, at an average viral load of 7 × 10⁶ per milliliter [9], speaking loudly for one minute can generate 1000 or more virus-carrying droplet nuclei of 4 µm, which remain airborne for over eight minutes [10]. This shows that normal speaking in confined environment creates a substantial probability for aerosol transmission. Furthermore, a study by the US National Academic of Science, Engineering, and Medicine reported that talking and even breathing could release bioaerosols carrying SARS-CoV-2 [11]. Likewise, with laser beams and a high-sensitivity camera, a Japanese study corroborated that loud conversation and breathing could release many respirable particles (10 µm). A number of epidemiological investigations provided evidence for these patterns of aerosol transmission [12,13,14,15,16]. Based on these studies, both the World Health Organization (WHO) [17] and the US Center for Disease Control (CDC) [18] have acknowledged the potential for human-to-human transmission via aerosol route.
Most COVID-19 infection transmission occurs in enclosed places such as homes [19,20], public transportation [13,14], restaurants [12,16], shopping malls [21], supermarkets [22], etc. Additionally, a super spreader can incite an outbreak of tens or hundreds of secondary COVID-19 infections in indoor settings [23]. Hence, an airport terminal building deserves focused attention as a unique space with a large number of people present for an extended duration and limited capacity for adequate physical distancing. The Aviation Public Health Initiative (APHI) project by Harvard School of Public Health conducted a survey investigation of over 24 US airports and two non-US airports, interviewing the managers of airports, leaders in airport associations, organizations associated with airport operations, representatives of the Transportation Security Administration (TSA), and the US Customs and Border Protection (CBP) [24]. According to the survey results, ventilation system design for airport terminal buildings is not specified for mitigating airborne transmission. Therefore, supplemental measures are required to reinforce the existing systems’ capacities when appropriate physical distancing is not possible. Accordingly, to reduce the risk of viral spread via inhalation, physical separation by clear acrylic sheets or plastic barriers and screens are not only implemented where people interact face-to-face. They are also used in queuing locations (e.g., TSA security screening area), which may develop “choke” points due to the congregation of passengers. However, physical barriers are not appropriate for all indoor settings. According to a review of the use of physical barriers in non-clinical settings, they might be valuable for indoor settings where people have high frequency but short duration interactions, but less valuable in places with long-duration interactions, especially with poor ventilation [25]. In another review specified for the application of physical barriers within healthcare, it concludes that ventilation plays a critical role in determining the effectiveness of physical barriers to prevent airborne transmission risk [26]. Both reviews agree that the impact of physical barriers on viral spread is secondary to indoor ventilation layout; and they must be paired with good ventilation. Regarding application in airport TSA areas, we consider that the canyons created by the barriers may block airflow and increase aerosol transmission risk by impeding the mixing, dilution, and removal of viral aerosols released by breathing. Passengers behind an infectious person might be exposed to higher viral aerosol concentrations when progressing in line.
Considering the aforementioned concerns, we undertook a numerical study based on computational fluid dynamics (CFD) simulations at a steady state to assess the implications of restricted airflow mirroring the conditions of TSA security checkpoint queues. This investigation will compare the flow field, local ventilation efficiency, viral spread, and aerosol infection risk obtained when using and not using tall plastic barriers (8 ft/2.44 m) under two ventilation conditions to show the importance of properly designing canyons with the consideration of existing room ventilation.

2. Methods

The TSA area and plastic barriers, as well as the indoor thermal and ventilation conditions, are modeled based on information provided by an airport operator. The details are given below.

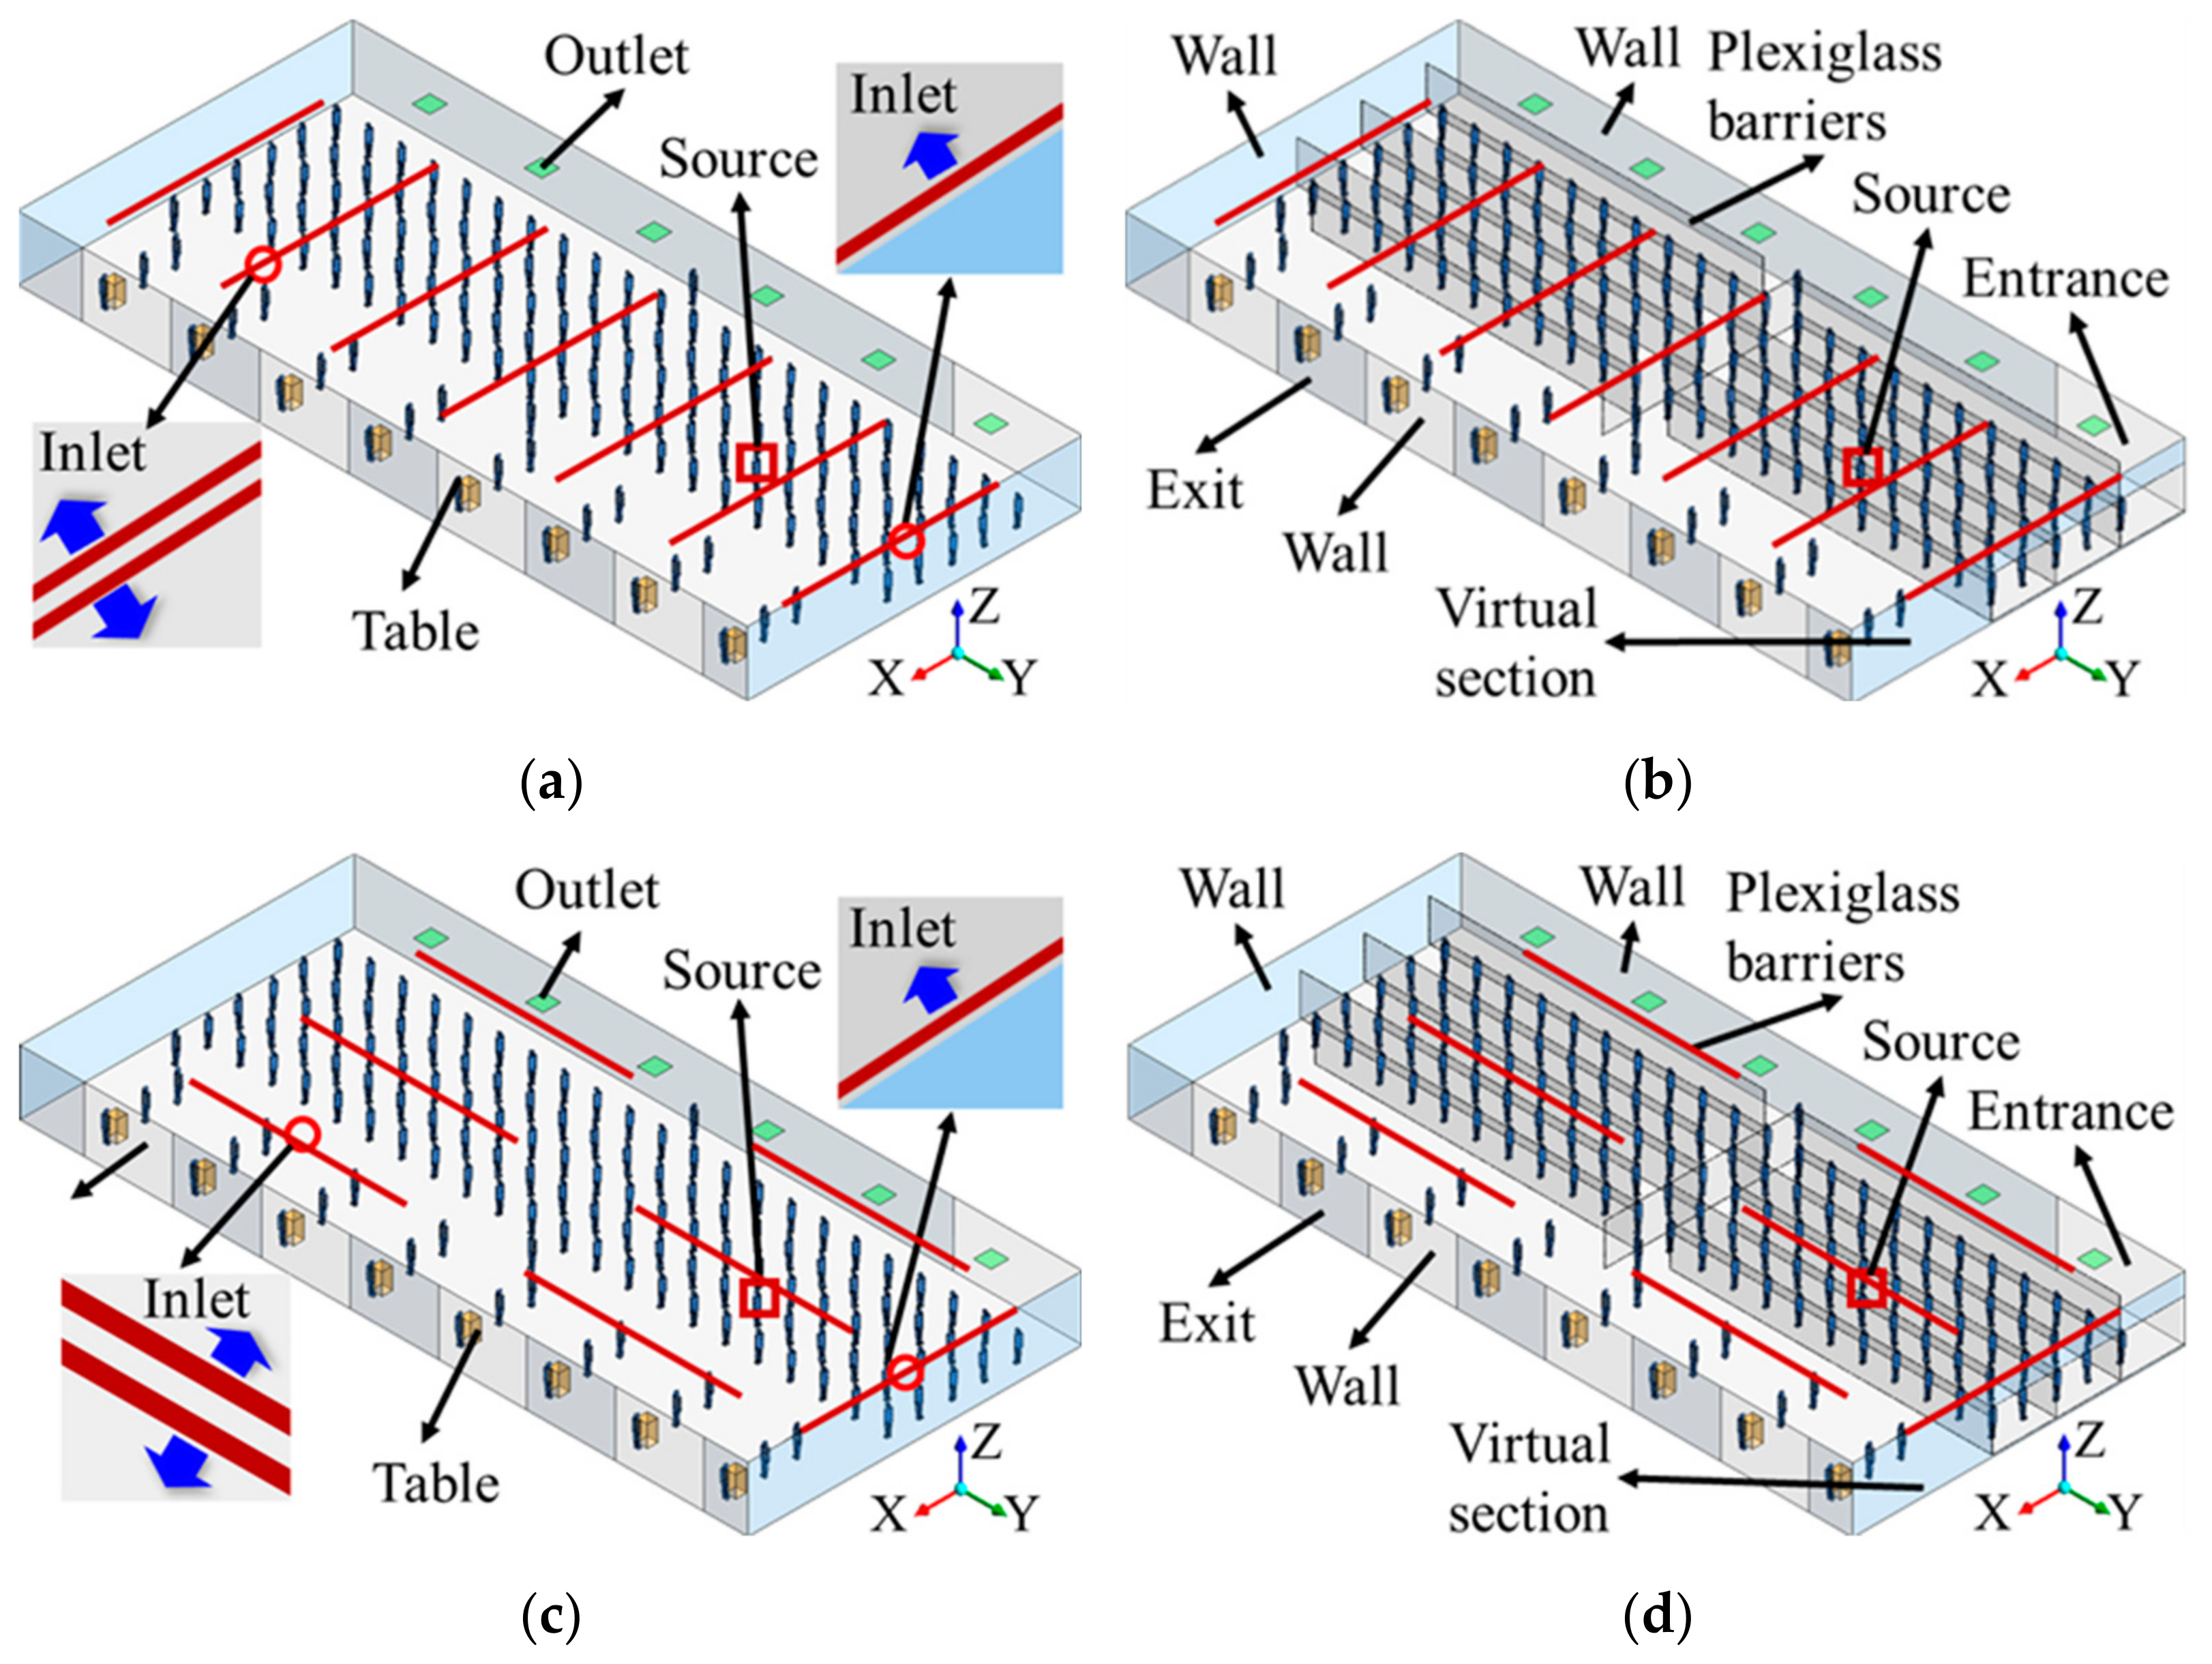
2.1. Modeling of TSA Area

Figure 1 presents the simulated CFD models for the two cases with different air diffuser distributions, each with plastic barriers used and unused. The simulation domain was created as a cube, but with the same floor area (1555 m2/16,740 ft2) as a TSA area in an international airport located in the northeastern United States. The CFD models only included half of the space regarding spatial symmetry. Each model included 134 human bodies to represent eight security officers and 126 passengers. Following social distancing rules, human bodies were separated from each other at a distance of at least 1.8 m (6 ft). Note that in each line the passengers lined up in the Y-direction. The passengers in line were assumed to be separated by belt barriers that were ignored in the model in Case 1-1 and Case 2-1 and were instead separated by the continuously abutted vertical plastic panels of 2.34 m (7.7 ft) in height and 3 cm (1.2 in) in depth. The bottom edge of plastic barriers was 0.1 m (0.3 ft) above the floor. According to the airport operator, heat release from people, lighting, and equipment was set to be 130 W/person, 7.53 W/m2, and 3.55 W/m2, respectively. In the CFD simulations, it was assumed that 29% (37.7 W) of the total heat release from a human body was by convection and 38% (49.53 W) by radiation [6,7]. Convective heat release was used as thermal boundary condition for the body surface, while radiant heat release was used for the floor surface’s thermal boundary condition as convective heat release. Moreover, heat release by lighting and equipment was assigned to the ceiling and the floor, respectively. Finally, heat flux was 23.84 W/m2 at the human body surface, 12.35 W/m2 at floor surface, and 7.53 W/m2 at ceiling surface.
The simulation domain contains approximately 10.64 million tetrahedral cells in Case 1-1 and 2-1, 16.48 million tetrahedral cells in Case 1-2, and 14.89 million tetrahedral cells in Case 2-2. Moreover, we created small blocks to include the proximity of human bodies and inlet and outlet and generated fine mesh in these blocks to accurately catch the local flow dynamics. As a result, the mesh quality was controlled with the aspect ratio to be 3.4, 5.2, 4.0, and 5.1, and equiangle skewness to be 0.75, 0.80, 0.75, and 0.79 in Case 1-1, 1-2, 2-1, and 2-2.

2.2. CFD Modeling

The standard k-ε model, which had been validated and applied in our previous CFD practice for indoor environment simulation [27,28], was adopted with the SIMPLE algorithm. Boussinesq function was activated to account for the buoyancy force of convective flows around the surfaces. Spatial discretization used PRESTO! for pressure, first-order upwind for scalars, and second-order upwind for other terms [29]. The convergence criterion was 1 × 10⁻⁶ for energy and 3 × 10⁻⁴ for other terms. Table 1 includes all boundary conditions. Except for the middle section, all of the exits to the neighboring rooms were set to be “Symmetric” as well, to simplify the model. The source person marked with a red circle in Figure 1 was assumed to do constant exhalation at a rate of 0.4 L/s, which was calculated according to an activity level of 1.3 Met and a breathing rate of 10 L/min [30].

2.3. Aerosol Infection Risk Estimation

Wells proposed the concept of quantum to represent the infectious aerosols attached with viruses [31]. Intake of one quantum infectious aerosols will lead to 63% infection risk on average. In this study, the drift-flux particle model [32] with an active scalar was applied to simulate the spread of quanta as follows [33]:
· V + V s C = · λ + λ t C + S
where C is the quanta concentration (quanta/m3), V is the velocity vector of air (m/s), V s is the setting velocity vector of quanta (m/s), λ and λt are laminar and turbulent diffusivity, respectively (m2/s), and S is the source term (quanta/(m3·s)). V s is determined by Stokes’ law based on the aerosols’ size and density; therefore, it represents the gravitational force on the aerosols. In the simulations, we set the aerosols’ aerodynamic diameter to be 5 µm, and ignored the change of aerosol size due to evaporation and the deposition of aerosols on surfaces. According to the viral load measured in the sputum, quanta generation rate could be over 100 quanta/h even when an asymptomatic patient was doing light activities [34]. Therefore, we set the quanta generation rate to be 100 quanta/h with respect to an activity level of 1.3 Met. Moreover, the convergence criterion was 1 × 10⁻¹⁴ for the scalar in the calculation.
Both the airflow and quanta distribution were simulated at a steady state. Based on the quanta distribution resulted from CFD, the Wells–Riley equation [35] was used to estimate aerosol infection risk along the staying time in the queueing line as follows [28]:
P = 1 e p C p t
where P is the probability of infection, Cp is the quanta concentration in the inhalation (quanta/m3), p is the breathing rate (m3/s), and t is the total exposure time.

2.4. Local Ventilation Efficiencies

Two numerical indices were used to evaluate local ventilation efficiency with regard to a virus source person, as well as the impact of plastic partitions, including mean residual lifetime of air (MRLA) at the source person’s mouth opening and mean staying time within the breathing zone in the canyon, where the source person is located, for exhaled viral bioaerosols (Ts) [36]. Here, the region between the heights of 1.1 m and 1.8 m above the floor is taken as the breathing zone. These two indices can be calculated with a passive scalar at a steady state with the following transport equation:
· ρ V φ = · Γ φ + S φ
Γ = 2.88 × 10 5 ρ + μ e f f 0.7
where φ is a passive scalar (-), Γ is the diffusion coefficient (m2/s), ρ is the air density (kg/m3), µeff is the effective viscosity (Pa·s), and Sφ is the source for the scalar (kg/(m3·s)). At an air temperature around 20 °C, 2.88 × 10⁻⁵ Pa·s is recommended for a constant laminar viscosity [37,38].
MRLA is simulated based on the reversed flow field with Sφ to be generated uniformly throughout the simulation domain [39]. In the reversed flow field, air mass is assumed to enter the room from exhaust openings, then gradually become contaminated. Hence, the increase of concentration will be proportional to the time elapsed after the air mass enters the room from the exhaust. With the nominal time constant, i.e., the reciprocal of air exchange rate, the indoor passive scalar distribution can be converted to MRLA distribution [39].
When simulating Ts, Sφ is assumed to be only generated uniformly throughout the target zone, i.e., the breathing zone within the canyon, where the source person is located. The calculation is based on the concept of local purging flow rate (L-PFR), which is originally defined as the effective airflow to remove or purge a contaminant from a domain [36]. Taken as the net ventilation rate in the target zone, L-PFR can be calculated by dividing (Sφ·V) by average scalar concentration (φa) in the zone, or by dividing the zone volume (V) by Ts [40]. Accordingly, Ts can be calculated as:
T s = φ a S φ
Importantly, Ts is the mean time for all the air pollutants generated in the canyon to stay there, not specified for those from the source. Therefore, Ts is possible to be greater than MRLA values.

3. Results

This section will introduce the simulation results of the flow field, local ventilation efficiency, quanta concentration, and infection probability. Here, local ventilation efficiency will be represented by MRLA and Ts, demonstrating ventilation impacts on the spread of exhaled viral bioaerosols, as well as the aerosol infection risk.

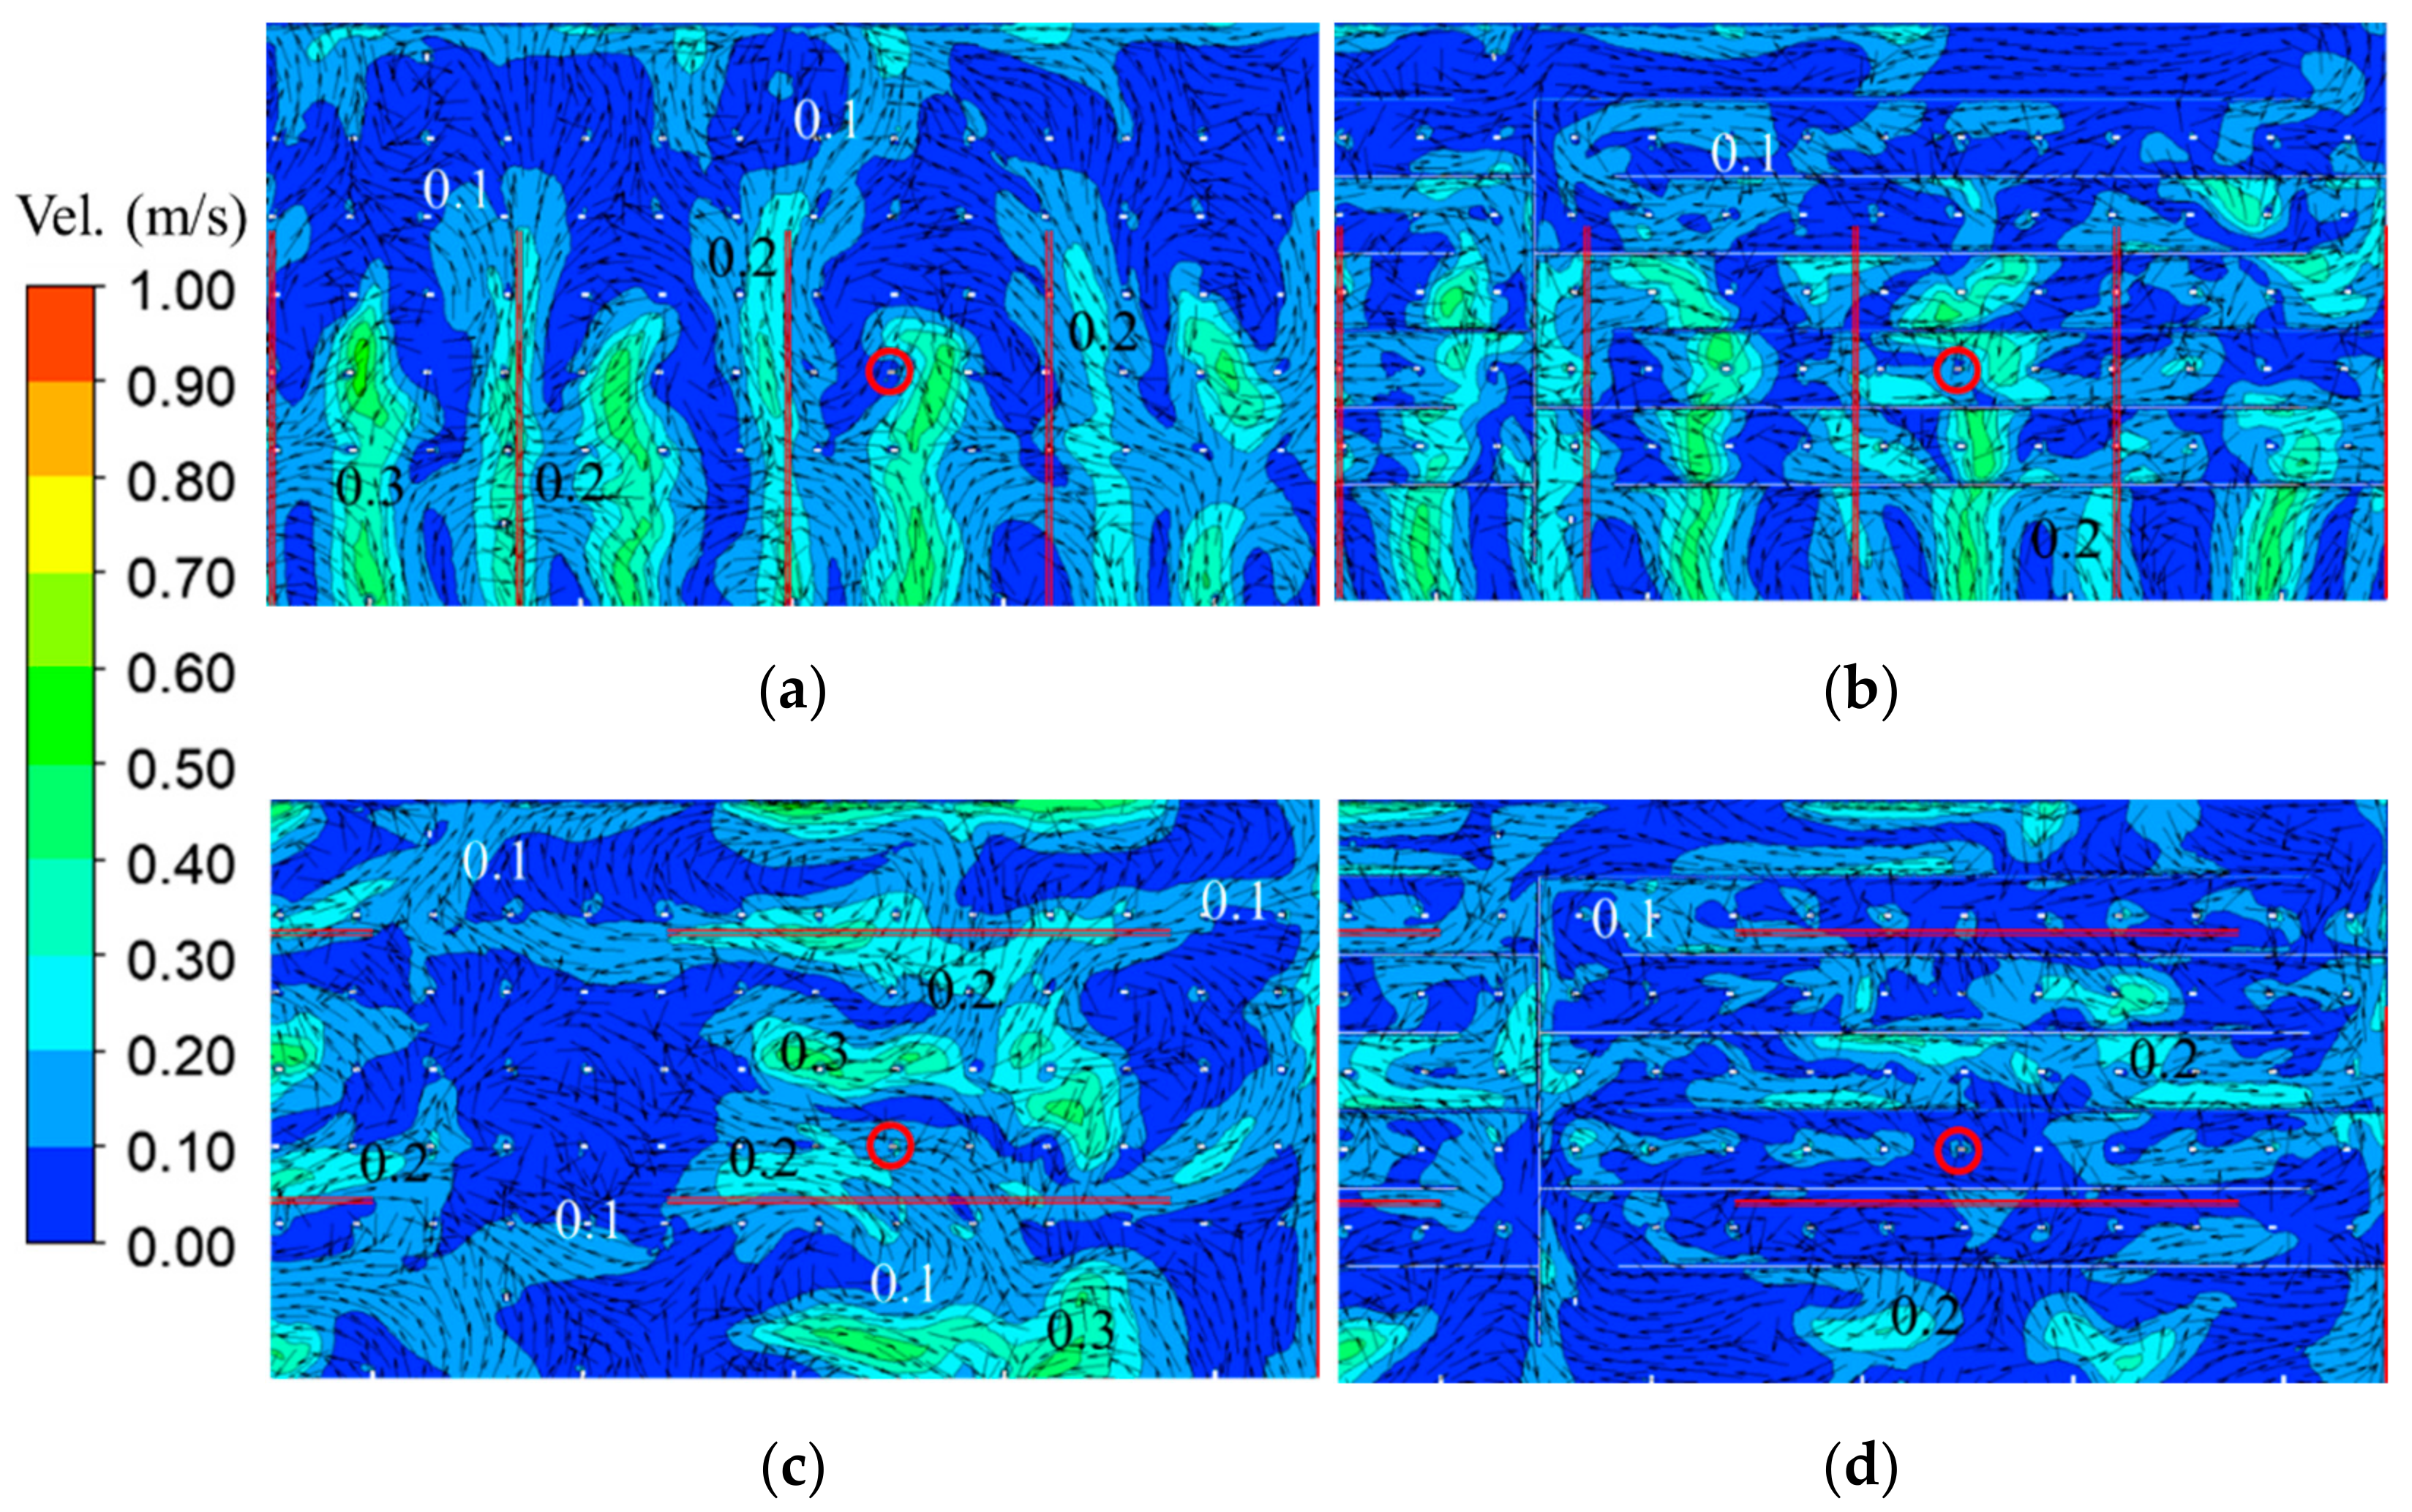
3.1. Velocity Distribution

Figure 2 and Figure 3 present the zoomed-in velocity distributions at the vertical section across the center of the source person’s mouth and the horizontal section at the height of mouth (1.56 m), respectively. According to Figure 2, air distribution determines the flow field around the human bodies. Particularly, without plastic barriers, air between the source human body and the person in front descended to the floor in Case 1-1 and rose in Case 2-1. According to Figure 2a, in Case 1-1, the downward airflow containing the shed viruses from the index case split into two branches after impacting the floor, flowing forward and backward. The forward moving air was mixed with the descending air between the two bodies in front of the index case at the floor level. The contaminated parcel of air was then involved in the circulated air potentially exposing the person directly in front of the index case. The air that diverted backwards flowed to the face of the person behind the index case. According to Figure 2c, in Case 2-1, the air rose between the index case and the people in front and behind. However, the exhaled gas by the index case mixed with the air at the ceiling level and then either flowed forward or backward. The forward airflow was blocked by the downward supply airflow and entrained into the air circulation between the two people in front of the index case. The air moving backwards went downward right behind the body standing behind the index case. In both cases, the presence of plastic barriers resulted in more uniform velocity distribution and changed the flow patterns in the canyon. As illustrated in Figure 2b, in Case 1-2, as the downward airflow from the ceiling was split by the plastic barriers and weakened, thermal plumes around human bodies became stronger and changed the size and location of the aforementioned air circulations in Case 1-1. In Case 2-2, the plastic barriers were perpendicular to the orientation of supplied air and demonstrated a more significant blocking effect on the supplied airflow from the ceiling as shown in Figure 3d, resulting in a stronger horizontal air movement above the canyon than in Case 1-2 as shown in Figure 3b, which suppressed the thermal plumes around the human bodies.

3.2. Local Ventilation Efficiency

Table 2 summarizes the MRLA at the source’s mouth opening and Ts in the breathing zone of the canyon where the source is. Consistent with velocity distributions, using the plastic barriers improved local ventilation in Case 1-2 because the enhanced thermal plumes promoted the exhaust of local air from the canyon, and it was deteriorated in Case 2-2 because the enhanced horizontal air movement suppressed the exhaust of local air from the canyon. However, plastic barriers resulted in marginal changes in MRLA and Ts (<10%). Using plastic barriers improved local ventilation efficiency where the source was in Case 1 but reversed in Case 2. In a large volume such as the studied space, using plastic barriers or not, it took over seven minutes in Case 1 and over ten minutes in Case 2 for the exhaled viruses to be exhausted. On average, viruses released in the canyon would stay there for approximately ten minutes in each case.

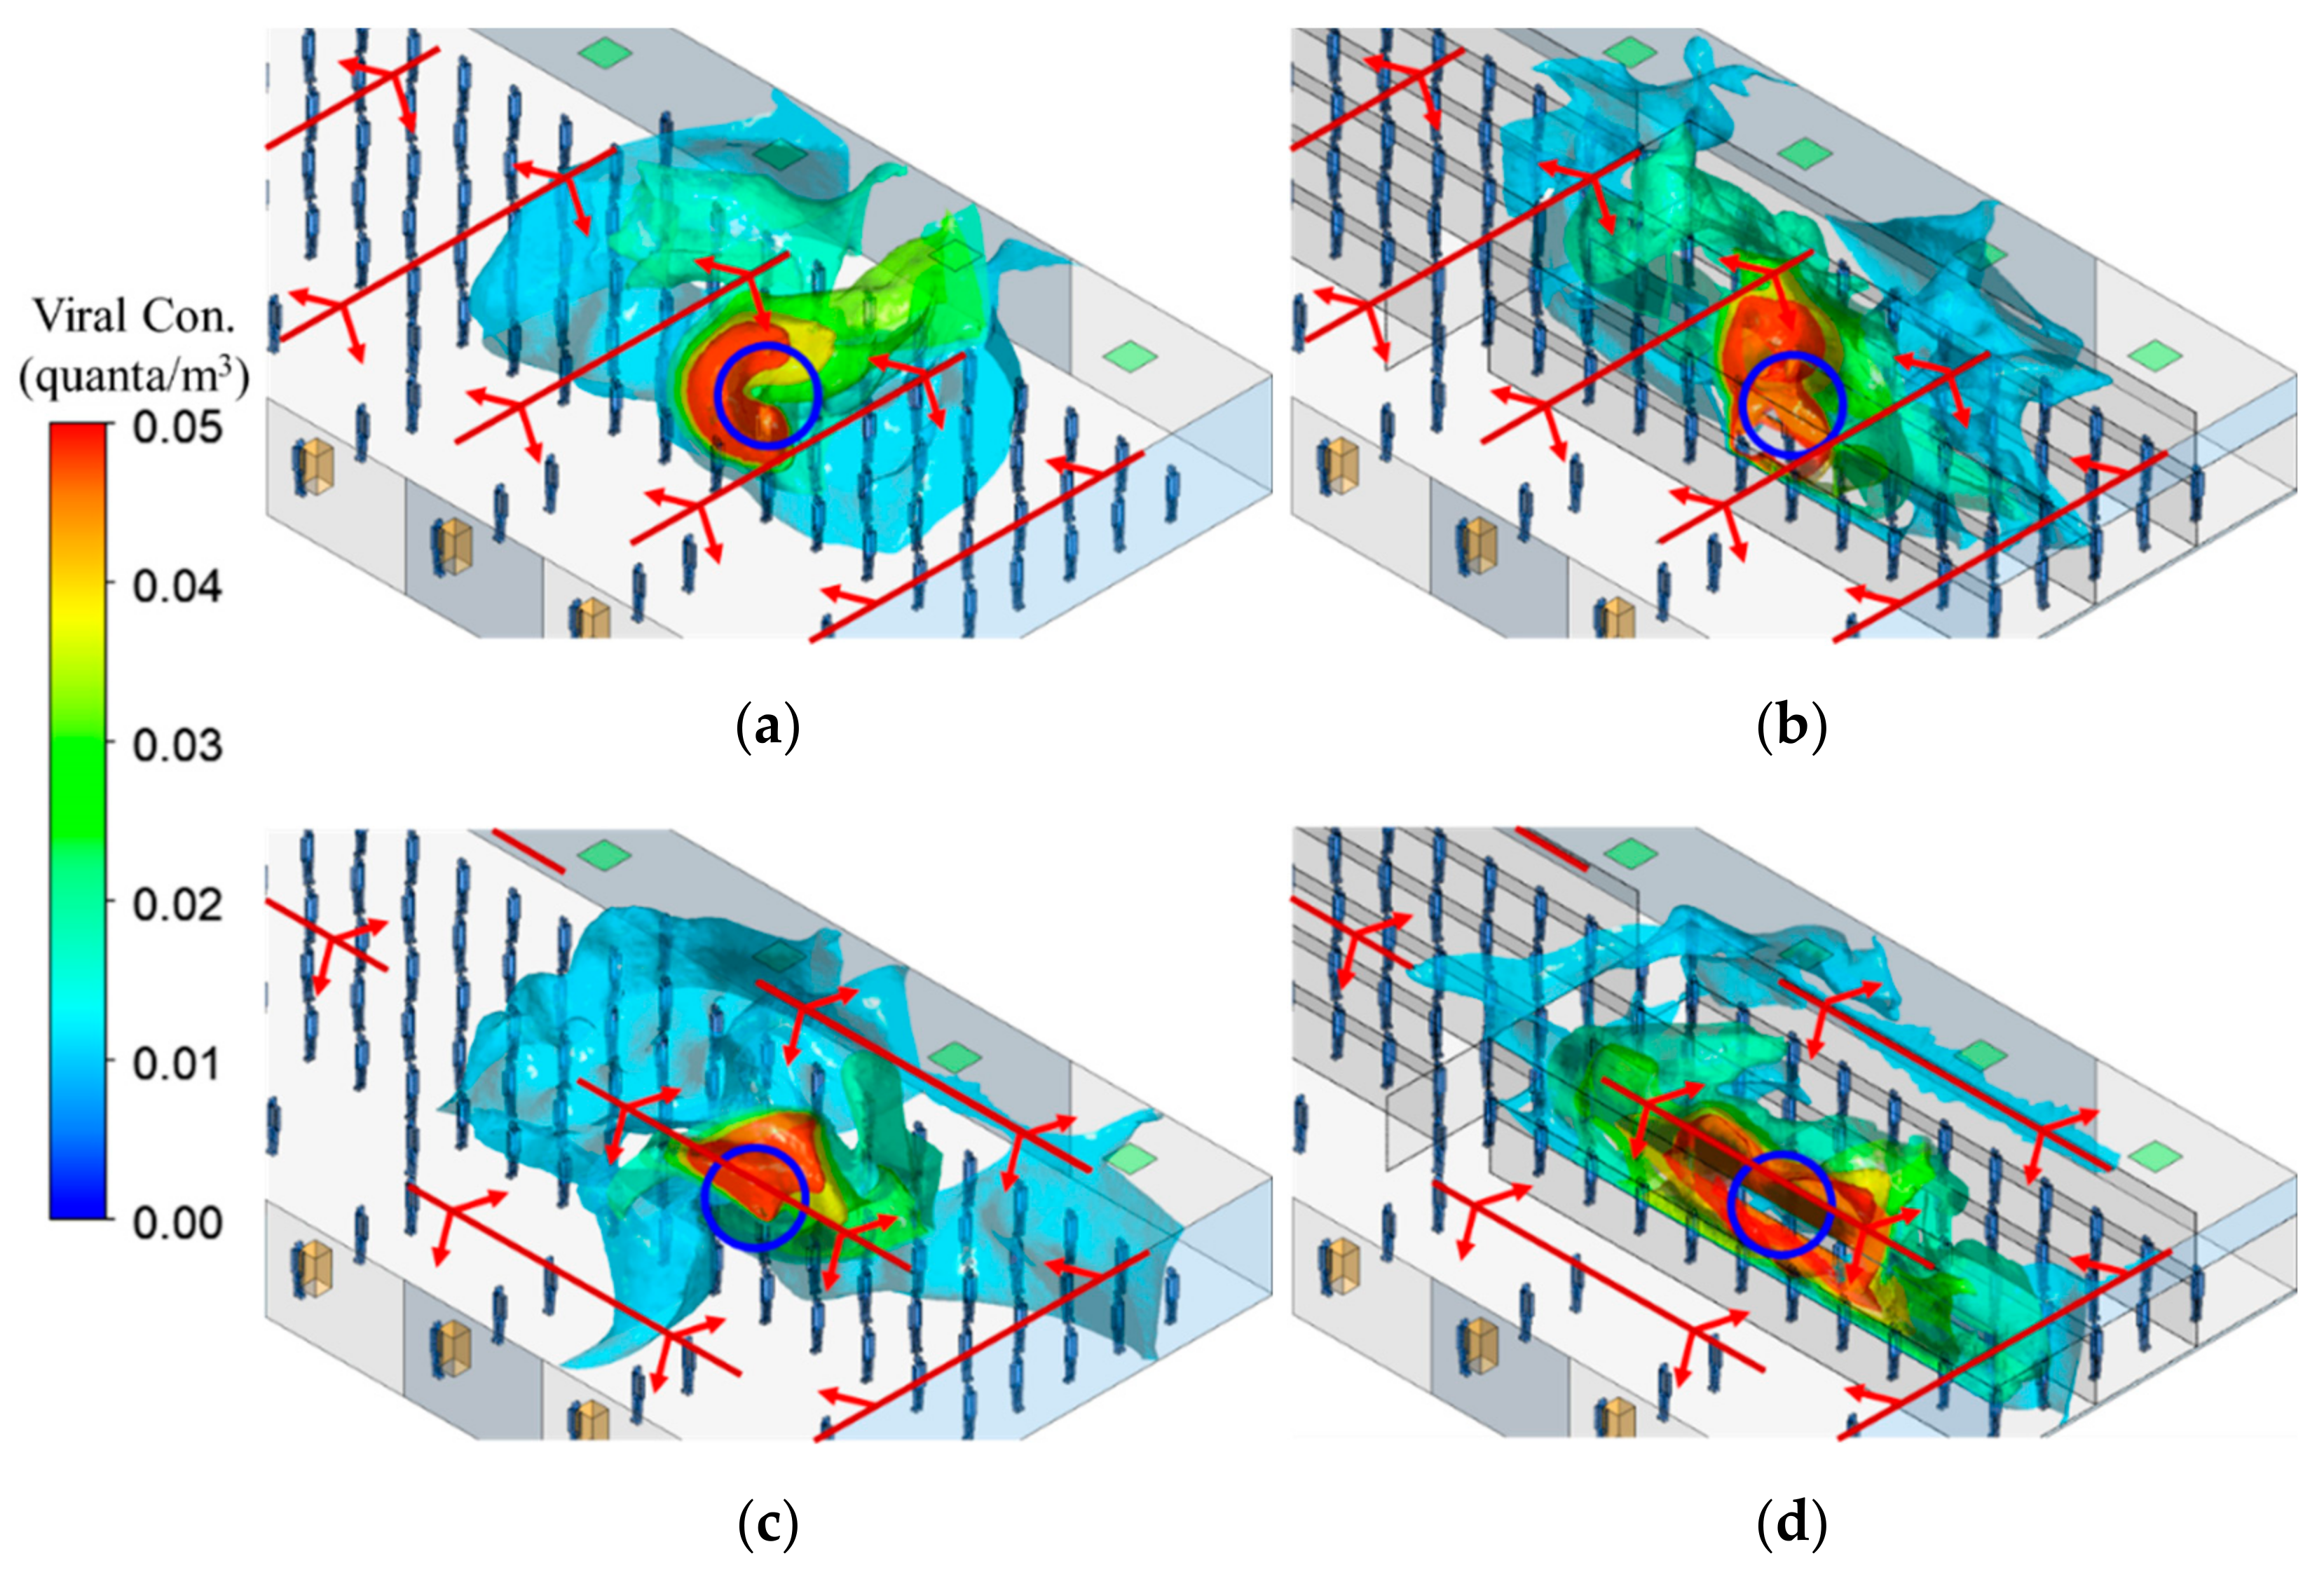
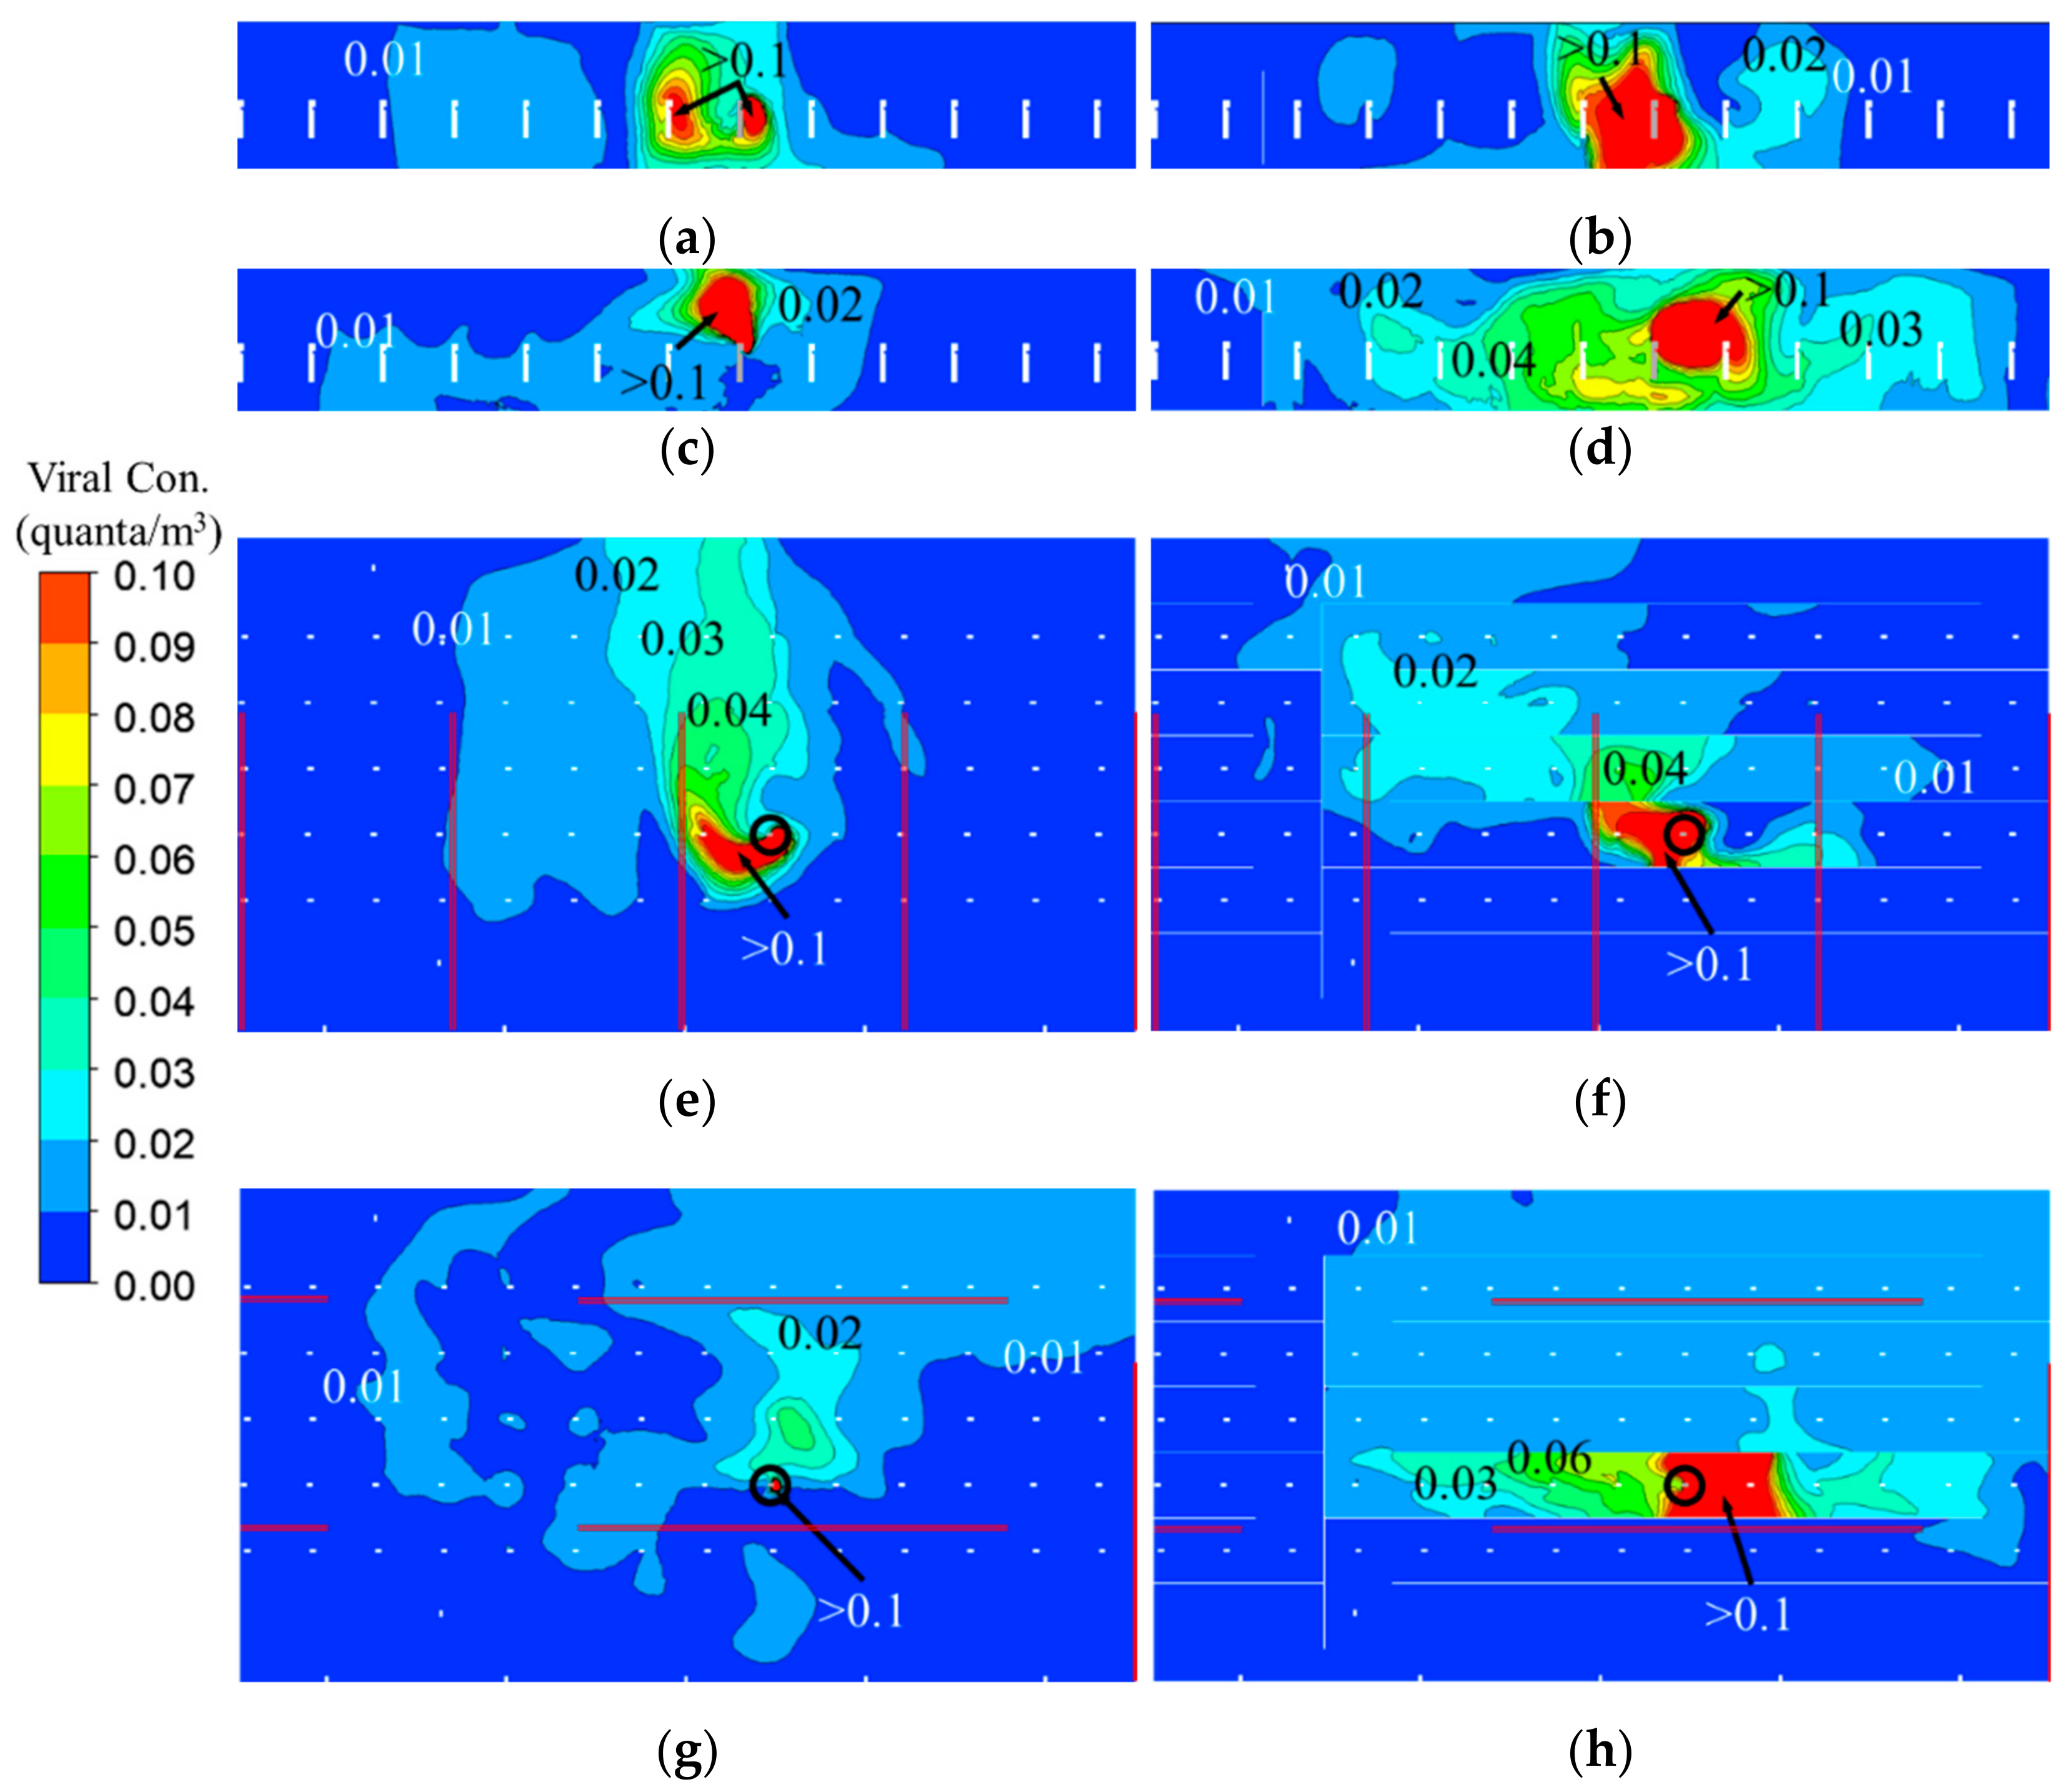
3.3. Viral Bioaerosol (Quanta) Distribution

Figure 4 demonstrates the spatial spread of SARS-CoV-2 quanta, with zoomed-in 3D quanta distributions by the iso-surfaces with concentrations of 0.01, 0.02, 0.03, 0.04, and 0.05 quanta/m3, respectively. Figure 5 gives the zoomed-in 2D quanta distributions in the vertical section across the source’s mouth and in the horizontal section at the height of the mouth. In each case, plastic barriers changed the spread pattern of viral bioaerosols and concentrated virus in the canyon where the source was. Particularly in Case 2-2, viral aerosol concentration increased everywhere in the canyon with the source due to the promoted air circulations in the canyon; moreover, viral aerosol concentration reached above 0.01 quanta/m3 at the height of mouth in all the canyons located at the side of the outlet. We also calculated the volumes with viral aerosol concentrations of >0.01 quanta/m3, >0.02 quanta/m3, and >0.05 quanta/m3 within the breathing zone, for each case. The results are given in Table 3. We can see that installing plastic barriers could only result in small differences in the volumes in Case 1, but significantly increased the volumes in Case 2.

3.4. Infection Risk

Figure 6 shows an increase of the region with the infection risks to be higher than 1% and 5% (called 1% risk region and 5% risk region henceforth) in the breathing zone along with time in each case. Here, the space occupied by the human bodies and plastic barriers was not counted. In Case 1, the 1% risk region was similar in size with the exposure less than 25 min whether plastic barriers were present or not. The increase of 1% risk region started to accelerate after a 25-min exposure in Case 1-1 and after a 45-min exposure in Case 1-2. For the 5% risk region, using plastic barriers did not make a notable change in its size with an exposure less than 34 min; however, later, the region was continuously larger than the condition not using plastic barriers and the difference was gradually increased. In Case 2, the presence of barriers always increased the risk regions, with the difference increased with time when compared to the no barrier case. The impact of barriers was even more striking for the 5% risk region. It is worth pointing out that the size of each risk region was always smallest in Case 2-1, independent of risk and exposure time because of the greater distribution of small viral aerosol concentration at the height of the breathing zone. In contrast, with plastic barriers aligned parallel to the ceiling diffusers (Case 2-2), the volume of the 1% risk region was larger than other cases up to 30 min. There was little difference among the cases for the 5% risk volume for the first 15 min. After 15 min, the effect of the Case 2-2 configuration produced an increasing volume of high risk.
Figure 7 demonstrates the risk distributions by iso-surfaces with the infection risk to be 1%, 2%, 3%, 4%, and 5%, in each case. Installing plexiglass barriers reduced infection risk distribution at the direction perpendicular to the passenger lines in Case 1-2; however, remarkably increased infection risk in the canyon with the source in Case 2-2.

4. Discussion

Installing plastic barriers affects the spread of exhaled viral bioaerosols and hence infection risk by interfering with the interaction of thermal plumes around human bodies and the ventilation-driven airflow of the area. While plastic barriers may help to maintain physical separation, they are ineffective in reducing localized concentrations of viral aerosols if present. The CFD results show that tall plastic barriers contribute to the concentration of virus plumes in these artificial canyons. The potential risk of infection among passengers queuing for TSA security checks is not reduced by plastic barriers. Even when the ventilation system aligns supply air diffusers perpendicular to the orientation of the barriers (Case 1-2), large volumes of air are directed downward into the narrow artificial corridors created by the plastic barriers. For the less favorable configuration where supply diffusers aligned parallel with the queuing lines, Case 2-2 dispersion is worse because there is little airflow directed into the canyons. Higher concentrations of virus may “linger longer” in under-ventilated canyons. Risk may be further increased given that subsequent passengers will inevitably have to pass along the same narrow corridor and through areas of potentially higher viral aerosol concentrations. Similar results have been observed in the indoor settings of canteens. Here, the effect of using physical partitions to block aerosol transmission was limited to some extent because the aerosols could gather viral aerosols in the breathing zone of partitioned space and pose a certain infection risk to the next people sitting there [41]. Our results are consistent with the finding in the canteen that using a physical partition introduced a new possible route of aerosol transmission [42]. Keeping queuing times short and increasing ventilation rates without plastic barriers is a preferred strategy to reduce transmission risk to passengers. Local air cleaning for the canyon is also considered an option; however, it should be cautioned that a portable air cleaner installed at the floor level may aid in the spread of exhaled viruses as well [43].
Simulating the dynamic movement of travelers in queueing lines and consideration of barriers with different heights and spacers were beyond the scope of this modeling effort. Furthermore, this analysis did not consider the effects of air displacement caused by the movement of human bodies in the queueing. The slow, infrequent, and short-duration nature of walking in the queueing lines did not have a significant effect on local viral aerosol concentrations because a much higher momentum would be needed to push viral aerosols on top of the barrier. Nevertheless, the simulations performed were illustrative in showing how airflow would be altered in the presence of plastic barriers. Plastic barriers have the potential to make transmission risk worse in a densely populated airport situation. Airport operators, when considering where and what time to install the barriers, must consider compatibility with existing ventilation systems.
Note that the 100 quanta/h emission rate [34] used in the simulation was derived from the transmission events caused by the previous SARS-CoV-2 viruses. The latest Omicron variant spreads more easily than the Delta variant and has become the dominant strain for COVID-19 infections [3,4,44]. As Delta was estimated to be 80 to 90% more transmissible than the Alpha [45], our simulation with 100 quanta/h emission rate may underestimate the transmission risk with regard to Delta and Omicron. In a Hong Kong hotel with strict quarantine precautions, Omicron was transmitted from an asymptomatic and fully vaccinated traveler to another fully vaccinated traveler in the room across a corridor [46]. Accordingly, Omicron can cause breakthrough infections in people who are fully vaccinated and spread from those vaccinated without symptoms, possibly by airborne route. Such a situation highlights the importance of properly creating infection control strategies with full consideration on fluid dynamics.
This study simulated two specified ventilation designs for a typical TSA area in a US airport. The simulation results regarding indoor flow pattern and viral distribution are not representative for all kinds of ventilation designs and all airport TSA areas. Conceivably, even the changes in boundary conditions, such as airflow rate and velocity, will result in completely different simulation results. However, the fact confirmed by this study, that using plastic barriers may increase aerosol infection risk under unfavorable ventilation conditions, is universally applicable.

5. Conclusions

This study investigated changes in local flow field, ventilation efficiency, viral aerosol concentrations, and aerosol infection risk resulting from the use of plastic barriers. The following major conclusions emerged:
(1)
Plastic barriers block air movement between two canyons created by barriers, while at the same time they support air movement along the canyon. Therefore, using plastic barriers can completely change air movement between the index case and other passengers, both in direction and speed. Apparently, the plastic barriers were positioned to impede air movement by the existing ventilation in Case 2 and hence locally concentrated viral aerosols in the canyon.
(2)
In Case 1, using plastic barriers only made small differences in the volumes with high viral aerosol concentrations in the breathing zone of TSA. In Case 2, using plastic barriers led to the volume increase of 40%, 1.7 times, and 108.6 times for the region with viral aerosol concentration to be >0.01 quanta/m3, >0.02 quanta/m3, and >0.05 quanta/m3, respectively. Consistent with the results of flow field, in Case 2, using plastic barriers significantly increased the volume of high viral aerosol concentrations in the breathing zone.
(3)
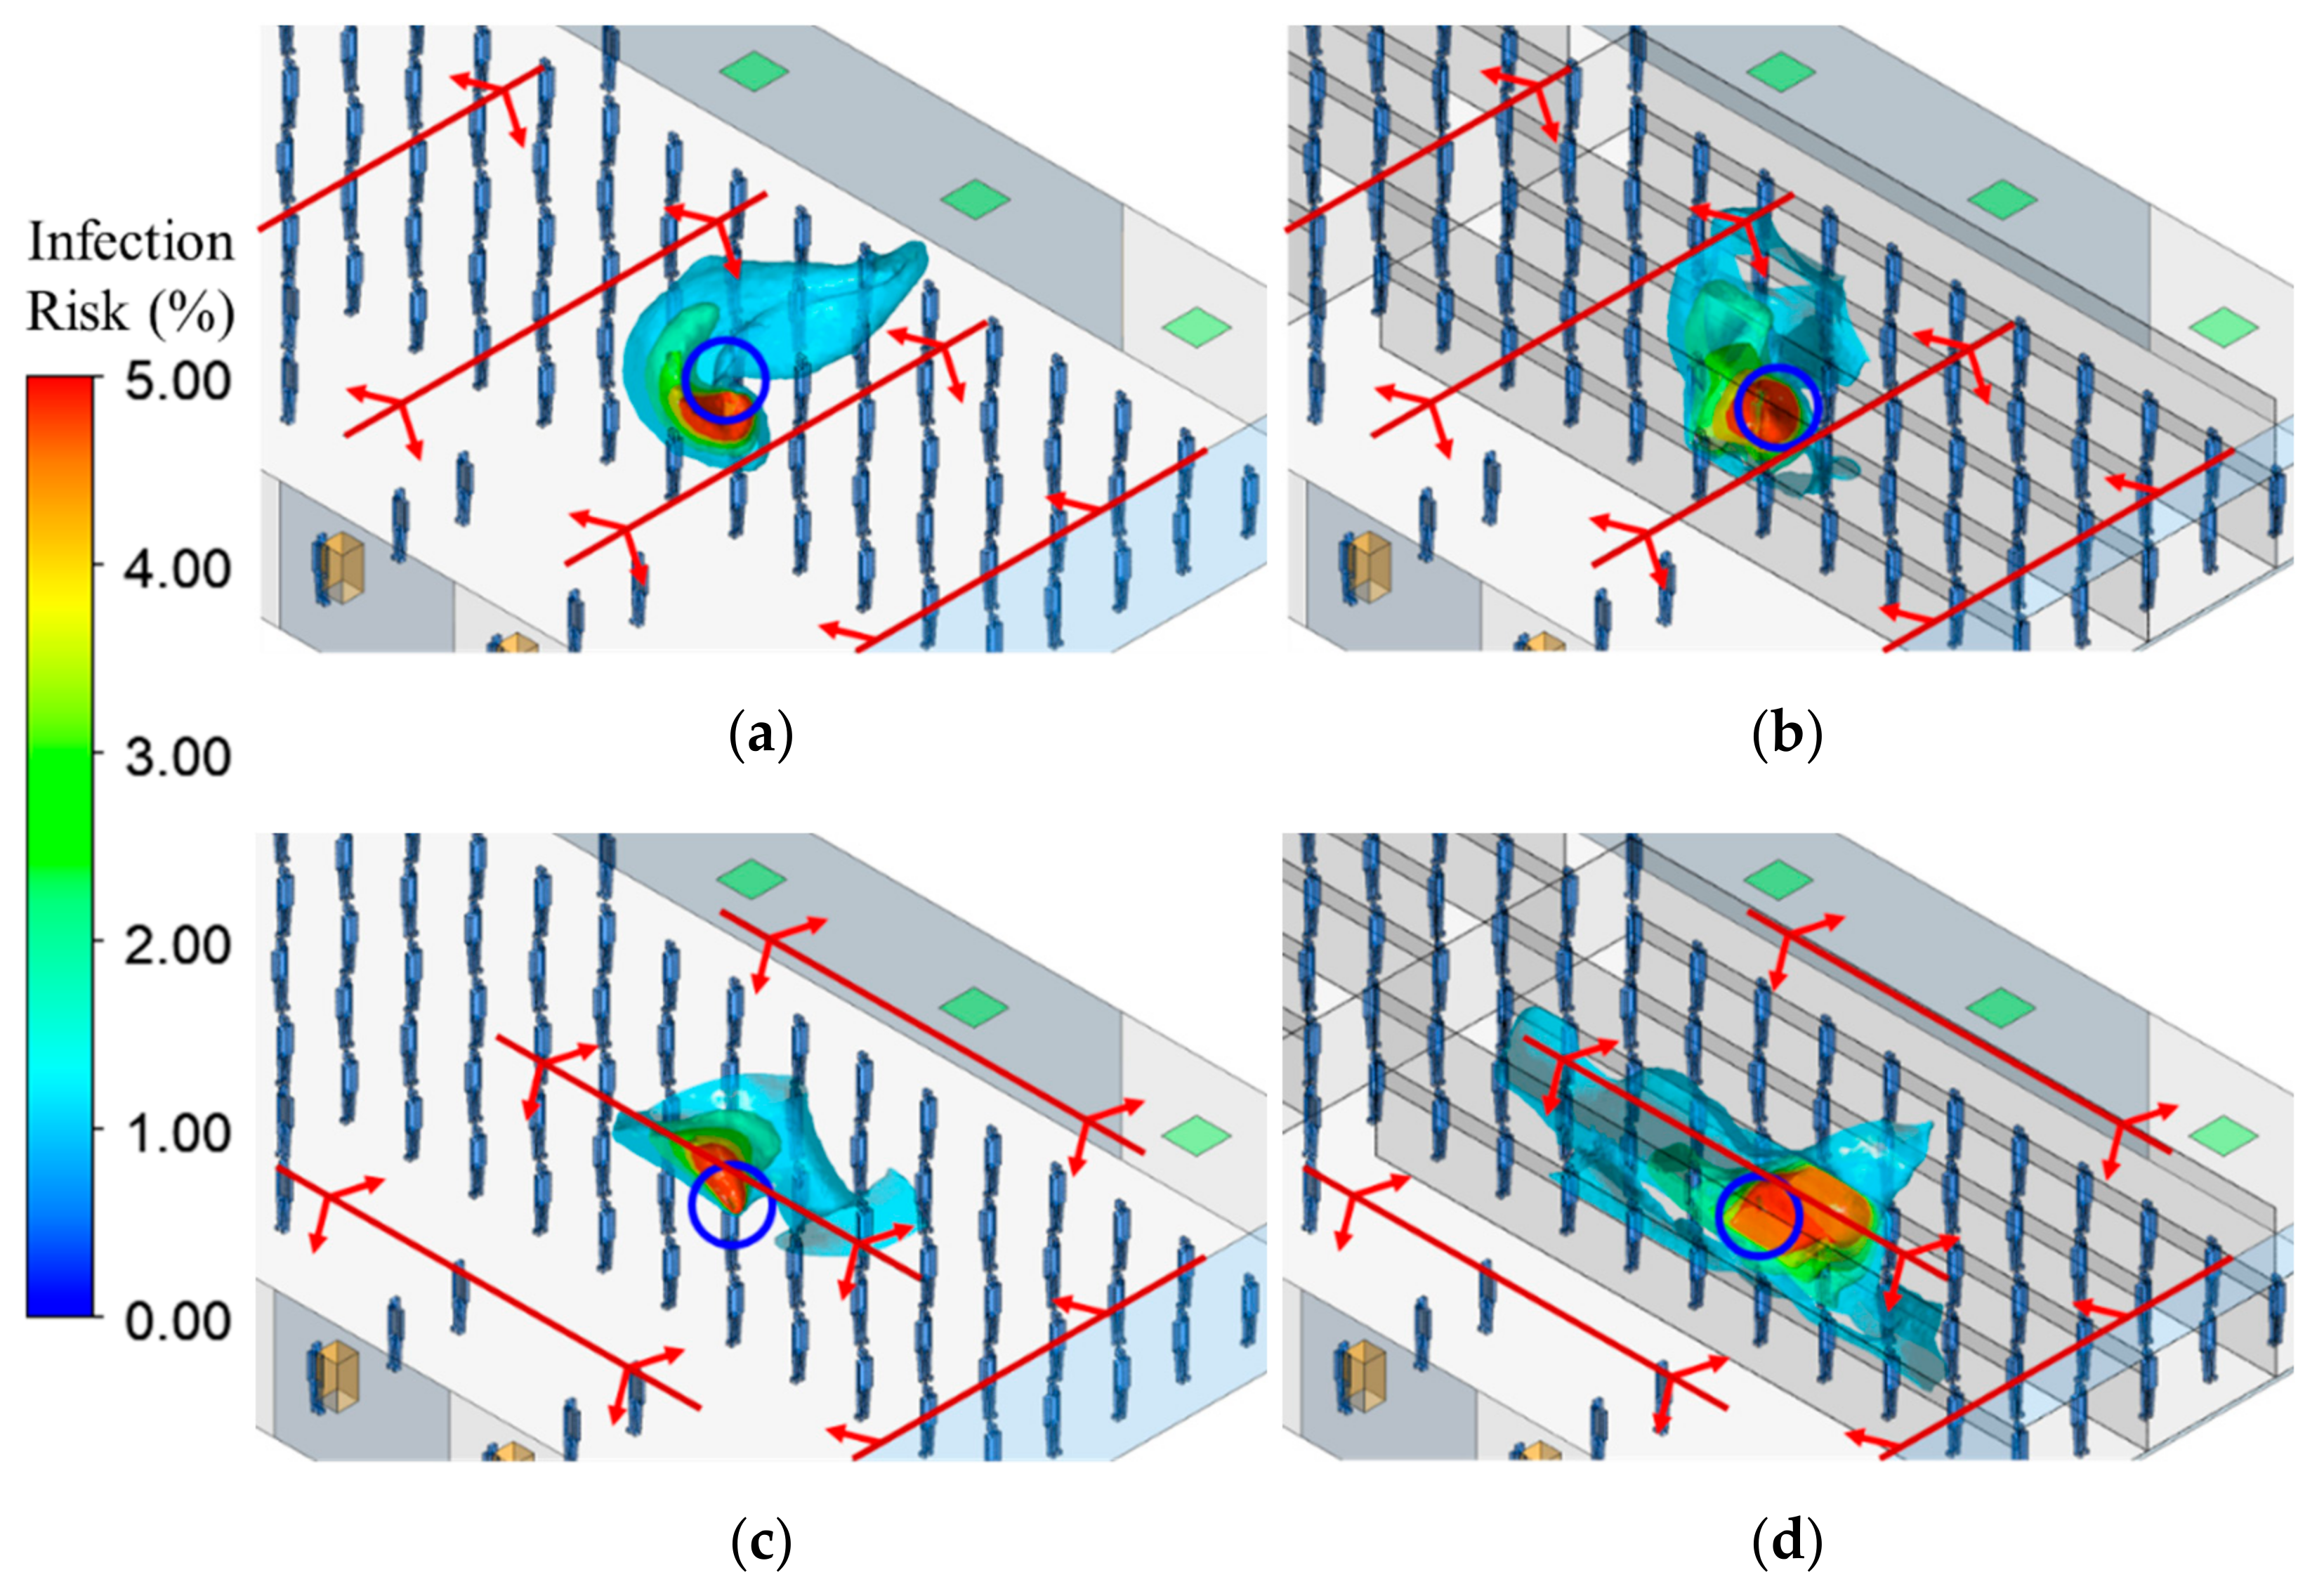
The volume with high infection risk in breathing zone is also greatly impacted by the relative spatial relationship between plastic barriers and air diffusers. Importantly, without plastic barriers and with diffuser distribution present in Case 2, the high-risk volume was approximately zero in the first 25 min, so infection control is effective with this ventilation system. However, the use of plastic barriers increased the risk for the passenger, resulting in the volume of 8.7 m3 for 1% risk region, and 1 m3 for 5% risk region, at 25 min. Meanwhile, in Case 1, the volume was <1 m3 for 1% risk region and <0.7 m3 for 5% risk region, in the first 25 min. Therefore, in the first 25 min, using plastic barriers made a small difference in risk for Case 1, but in Case 2, this difference was much more significant.
Using plastic barriers can negatively impact local air movement and may impede the ventilation-drive improvement in localized mixing, dilution, and removal of airborne bioaerosols. Overall, plastic barriers redistributed risk for passengers in such a way that localized ventilation or air cleaning in the canyons was needed to match the risk levels without the barriers.

Author Contributions

Conceptualization, J.S., J.D.S. and S.Z.; methodology, J.S. and S.Z.; software, S.Z. and T.L.; formal analysis, S.Z.; investigation, S.Z., J.S. and J.D.S.; resources, J.S. and J.D.S.; data curation, S.Z.; writing—original draft preparation, S.Z.; writing—review and editing, J.S., J.D.S. and J.G.C.L.; visualization, S.Z.; supervision, J.S. and J.D.S.; project administration, J.S.; funding acquisition, J.D.S. and J.S. All authors have read and agreed to the published version of the manuscript.

Funding

This research was partially funded by Airlines for America through a contract with the National Preparedness Leadership Initiative (NPLI), Harvard T.H. Chan School of Public Health (HSPH), and the RAPID-ES project “Energy-Efficient Disinfection of Viral Bioaerosols in Public Spaces: Vital for Lifting of the “Stay-at-Home” Orders during the COVID-19 Outbreak” funded by National Science Foundation (NSF), grant number “2032107”.

Institutional Review Board Statement

Not applicable.

Informed Consent Statement

Not applicable.

Data Availability Statement

Not applicable.

Acknowledgments

The authors would like to thank Edward A. Nardell and Steven R. Hanna from HSPH for their great contribution to the project through meaningful discussions. We would also like to thank David Jones from ARUP, New York City, NY, who provided a typical design value for heat production in a TSA area. We acknowledge receiving detailed information on the dimensions of a TSA security area and the HVAC system serving that location from a high-volume airport. We have chosen not to name that airport.

Conflicts of Interest

The authors declare no conflict of interest, and the funders had no role in the design of the study; in the collection, analyses, or interpretation of data; in the writing of the manuscript; or in the decision to publish the results.

References

  1. WHO Coronavirus (COVID-19) Dashboard. Available online: https://covid19.who.int (accessed on 1 July 2022).
  2. Petersen, E.; Koopmans, M.; Go, U.; Hamer, D.H.; Petrosillo, N.; Castelli, F.; Storgaard, M.; Al Khalili, S.; Simonsen, L. Comparing SARS-CoV-2 with SARS-CoV and Influenza Pandemics. Lancet Infect. Dis. 2020, 20, e238–e244. [Google Scholar] [CrossRef]
  3. CDC COVID-19 Response Team. SARS-CoV-2 B.1.1.529 (Omicron) Variant—United States, December 1–8, 2021. MMWR Morb. Mortal. Wkly. Rep. 2021, 70, 1731–1734. [Google Scholar] [CrossRef] [PubMed]
  4. Peebles, A. CDC Pares Omicron View to a Still-Dominant 59% of U.S. Cases (1). Available online: https://news.bloomberglaw.com/coronavirus/cdc-pares-omicron-estimate-to-a-still-dominant-59-of-u-s-cases (accessed on 31 December 2021).
  5. Slifka, M.K.; Gao, L. Is Presymptomatic Spread a Major Contributor to COVID-19 Transmission? Nat. Med. 2020, 26, 1531–1533. [Google Scholar] [CrossRef] [PubMed]
  6. Johansson, M.A.; Quandelacy, T.M.; Kada, S.; Prasad, P.V.; Steele, M.; Brooks, J.T.; Slayton, R.B.; Biggerstaff, M.; Butler, J.C. SARS-CoV-2 Transmission From People Without COVID-19 Symptoms. JAMA Netw. Open 2021, 4, e2035057. [Google Scholar] [CrossRef] [PubMed]
  7. Schoen, L.J. Guidence for Building Operations During the COVID-19 Pandemic. ASHRAE J. 2020, 62, 72–74. [Google Scholar]
  8. Kim, Y.-I.; Kim, S.-G.; Kim, S.-M.; Kim, E.-H.; Park, S.-J.; Yu, K.-M.; Chang, J.-H.; Kim, E.J.; Lee, S.; Casel, M.A.B.; et al. Infection and Rapid Transmission of SARS-CoV-2 in Ferrets. Cell Host Microbe 2020, 27, 704–709.e2. [Google Scholar] [CrossRef] [PubMed]
  9. Wölfel, R.; Corman, V.M.; Guggemos, W.; Seilmaier, M.; Zange, S.; Müller, M.A.; Niemeyer, D.; Jones, T.C.; Vollmar, P.; Rothe, C.; et al. Virological Assessment of Hospitalized Patients with COVID-2019. Nature 2020, 581, 465–469. [Google Scholar] [CrossRef] [PubMed]
  10. Stadnytskyi, V.; Bax, C.E.; Bax, A.; Anfinrud, P. The Airborne Lifetime of Small Speech Droplets and Their Potential Importance in SARS-CoV-2 Transmission. Proc. Natl. Acad. Sci. USA 2020, 117, 11875–11877. [Google Scholar] [CrossRef]
  11. Fineberg, H.V.; Council, N.R. Rapid Expert Consultation on the Possibility of Bioaerosol Spread of SARS-CoV-2 for the COVID-19 Pandemic (April 1, 2020); The National Academies Press NRC: Washington, DC, USA; The National Academies Council: Washington, DC, USA, 2020. [Google Scholar]
  12. Kwon, K.-S.; Park, J.-I.; Park, Y.J.; Jung, D.-M.; Ryu, K.-W.; Lee, J.-H. Evidence of Long-Distance Droplet Transmission of SARS-CoV-2 by Direct Air Flow in a Restaurant in Korea. J. Korean Med. Sci. 2020, 35, e415. [Google Scholar] [CrossRef]
  13. Shen, Y.; Li, C.; Dong, H.; Wang, Z.; Martinez, L.; Sun, Z.; Handel, A.; Chen, Z.; Chen, E.; Ebell, M.H.; et al. Community Outbreak Investigation of SARS-CoV-2 Transmission Among Bus Riders in Eastern China. JAMA Intern. Med. 2020, 180, 1665–1671. [Google Scholar] [CrossRef]
  14. Azimi, P.; Keshavarz, Z.; Laurent, J.G.C.; Stephens, B.; Allen, J.G. Mechanistic Transmission Modeling of COVID-19 on the Diamond Princess Cruise Ship Demonstrates the Importance of Aerosol Transmission. Proc. Natl. Acad. Sci. USA 2021, 118, e2015482118. [Google Scholar] [CrossRef]
  15. Hwang, S.E.; Chang, J.H.; Oh, B.; Heo, J. Possible Aerosol Transmission of COVID-19 Associated with an Outbreak in an Apartment in Seoul, South Korea, 2020. Int. J. Infect. Dis. 2021, 104, 73–76. [Google Scholar] [CrossRef]
  16. Li, Y.; Qian, H.; Hang, J.; Chen, X.; Cheng, P.; Ling, H.; Wang, S.; Liang, P.; Li, J.; Xiao, S.; et al. Probable Airborne Transmission of SARS-CoV-2 in a Poorly Ventilated Restaurant. Build. Environ. 2021, 196, 107788. [Google Scholar] [CrossRef]
  17. WHO. Transmission of SARS-CoV-2: Implications for Infection Prevention Precautions. Available online: https://www.who.int/news-room/commentaries/detail/transmission-of-sars-cov-2-implications-for-infection-prevention-precautions (accessed on 9 February 2022).
  18. CDC Science Brief: SARS-CoV-2 and Potential Airborne Transmission. Available online: https://www.cdc.gov/coronavirus/2019-ncov/more/scientific-brief-sars-cov-2.html (accessed on 17 March 2021).
  19. Kim, J.; Choe, Y.J.; Lee, J.; Park, Y.J.; Park, O.; Han, M.S.; Kim, J.-H.; Choi, E.H. Role of Children in Household Transmission of COVID-19. Arch. Dis. Child. 2020, 106, 709–711. [Google Scholar] [CrossRef]
  20. Marshall, K.; Vahey, G.M.; McDonald, E.; Tate, J.E.; Herlihy, R.; Midgley, C.M.; Kawasaki, B.; Killerby, M.E.; Alden, N.B.; Staples, J.E.; et al. Exposures Before Issuance of Stay-at-Home Orders Among Persons with Laboratory-Confirmed COVID-19—Colorado, March 2020. Morb. Mortal. Wkly. Rep. 2020, 69, 847–849. [Google Scholar] [CrossRef]
  21. Jiang, G.; Wang, C.; Song, L.; Wang, X.; Zhou, Y.; Fei, C.; Liu, H. Aerosol Transmission, an Indispensable Route of COVID-19 Spread: Case Study of a Department-Store Cluster. Front. Environ. Sci. Eng. 2020, 15, 46. [Google Scholar] [CrossRef]
  22. Wang, L.; Duan, Y.; Zhang, W.; Liang, J.; Xu, J.; Zhang, Y.; Wu, C.; Xu, Y.; Li, H. Epidemiologic and Clinical Characteristics of 26 Cases of COVID-19 Arising from Patient-to-Patient Transmission in Liaocheng, China. Clin. Epidemiol. 2020, 12, 387–391. [Google Scholar] [CrossRef]
  23. Park, S.Y.; Kim, Y.-M.; Yi, S.; Lee, S.; Na, B.-J.; Kim, C.B.; Kim, J.-I.; Kim, H.S.; Kim, Y.B.; Park, Y.; et al. Coronavirus Disease Outbreak in Call Center, South Korea. Emerg. Infect. Dis. 2020, 26, 1666–1670. [Google Scholar] [CrossRef]
  24. The APHI S&T Team. Aviation Public Health Initiative: Assessment of Risks of SARS-CoV-2 Transmission during Air Travel and Non-Pharmaceutical Interventions to Reduce Risk—Phase Two Report: Curb-to-Curb Travel through Airports; Havard, T.H., Ed.; Chan School of Public Health: Boston, MA, USA, 2021. [Google Scholar]
  25. Eykelbosh, A. A Rapid Review of the Use of Physical Barriers in Non-Clinical Settings and COVID-19 Transmission; National Collaborating Centre for Environmental Health: Vancouver, BC, USA, 2021; p. 16. [Google Scholar]
  26. Rooney, C.M.; McIntyre, J.; Ritchie, L.; Wilcox, M.H. Evidence Review of Physical Distancing and Partition Screens to Reduce Healthcare Acquired SARS-CoV-2. Infect. Prev. Pract. 2021, 3, 100144. [Google Scholar] [CrossRef]
  27. Zhu, S.; Demokritou, P.; Spengler, J. Experimental and Numerical Investigation of Micro-Environmental Conditions in Public Transportation Buses. Build. Environ. 2010, 45, 2077–2088. [Google Scholar] [CrossRef]
  28. Zhu, S.; Srebric, J.; Spengler, J.D.; Demokritou, P. An Advanced Numerical Model for the Assessment of Airborne Transmission of Influenza in Bus Microenvironments. Build. Environ. 2012, 47, 67–75. [Google Scholar] [CrossRef]
  29. ANSYS. Ansys Fluent V19.2 ANSYS Fluent Theory Guide; ANSYS, Inc.: Canonsburg, PA, USA, 2018. [Google Scholar]
  30. Nishi, Y. Human and Thermal environment. In Mechanism of Comfortable Thermal Environment; The Society of Heating, Air-Conditioning and Sanitary Engineers of Japan: Tokyo, Japan, 2005; p. 30. [Google Scholar]
  31. Wells, W.F. Airborne Contagion and Air Hygiene: An Ecological Study of Droplet Infections. J. Am. Med. Assoc. 1955, 159, 90. [Google Scholar] [CrossRef]
  32. Holmberg, S.; Li, Y. Modelling of the Indoor Environment—Particle Dispersion and Deposition. Indoor Air 1998, 8, 113–122. [Google Scholar] [CrossRef]
  33. Pichurov, G.; Srebric, J.; Zhu, S.; Vincent, R.L.; Brickner, P.W.; Rudnick, S.N. A Validated Numerical Investigation of the Ceiling Fan’s Role in the Upper-Room UVGI Efficacy. Build. Environ. 2015, 86, 109–119. [Google Scholar] [CrossRef]
  34. Buonanno, G.; Stabile, L.; Morawska, L. Estimation of Airborne Viral Emission: Quanta Emission Rate of SARS-CoV-2 for Infection Risk Assessment. Environ. Int. 2020, 141, 105794. [Google Scholar] [CrossRef]
  35. Riley, E.C.; Murphy, G.; Riley, R.L. Airborne Spread of Measles in a Suburban Elementary School. Am. J. Epidemiol. 1978, 107, 421–432. [Google Scholar] [CrossRef]
  36. Sandberg, M.; Sjöberg, M. The Use of Moments for Assessing Air Quality in Ventilated Rooms. Build. Environ. 1983, 18, 181–197. [Google Scholar] [CrossRef]
  37. Chanteloup, V.; Mirade, P.-S. Computational Fluid Dynamics (CFD) Modelling of Local Mean Age of Air Distribution in Forced-Ventilation Food Plants. J. Food Eng. 2009, 90, 90–103. [Google Scholar] [CrossRef]
  38. Ning, M.; Mengjie, S.; Mingyin, C.; Dongmei, P.; Shiming, D. Computational Fluid Dynamics (CFD) Modelling of Air Flow Field, Mean Age of Air and CO2 Distributions inside a Bedroom with Different Heights of Conditioned Air Supply Outlet. Appl. Energy 2016, 164, 906–915. [Google Scholar] [CrossRef]
  39. Kato, S.; Murakami, S.; Kobayashi, H. New Scales for Evaluating Ventilation Efficiency as Affected by Supply and Exhaust Opening Based on Spatial Distribution of Contaminant. In Proceedings of the ISRACVE’92, Tokyo, Japan, 22–24 July 1992; pp. 177–186. [Google Scholar]
  40. Davidson, L.; Olsson, E. Calculation of Age and Local Purging Flow Rate in Rooms. Build. Environ. 1987, 22, 111–127. [Google Scholar] [CrossRef]
  41. Liu, Z.; Li, R.; Wu, Y.; Ju, R.; Gao, N. Numerical Study on the Effect of Diner Divider on the Airborne Transmission of Diseases in Canteens. Energy Build. 2021, 248, 111171. [Google Scholar] [CrossRef]
  42. Ye, J.; Ai, Z.; Zhang, C. A New Possible Route of Airborne Transmission Caused by the Use of a Physical Partition. J. Build. Eng. 2021, 44, 103420. [Google Scholar] [CrossRef]
  43. Ham, S. Prevention of Exposure and Dispersion of COVID-19 Using Air Purifiers: Challenges and Concerns. Epidemiol. Health 2020, 42, e2020027. [Google Scholar] [CrossRef] [PubMed]
  44. CDC Omicron Variant: What You Need to Know. Available online: https://www.cdc.gov/coronavirus/2019-ncov/variants/omicron-variant.html (accessed on 27 December 2021).
  45. Omicron, Delta, Alpha, and More: What to Know About the Coronavirus Variants. Available online: https://www.yalemedicine.org/news/covid-19-variants-of-concern-omicron (accessed on 27 December 2021).
  46. Gu, H.; Krishnan, P.; Ng, D.Y.M.; Chang, L.D.J.; Liu, G.Y.Z.; Cheng, S.S.M.; Hui, M.M.Y.; Fan, M.C.Y.; Wan, J.H.L.; Lau, L.H.K.; et al. Probable Transmission of SARS-CoV-2 Omicron Variant in Quarantine Hotel, Hong Kong, China, November 2021. Emerg. Infect. Dis. 2021, 28, 460–462. [Google Scholar] [CrossRef] [PubMed]
Figure 1. CFD model in each simulation case: (a) Case 1-1, (b) Case 1-2, both have all slot diffusers perpendicular to passenger lines, but without and with plastic barriers, respectively; (c) Case 2-1, (d) Case 2-2, both have most slot diffusers parallel to passenger lines, but without and with plastic barriers, respectively. The modeled room is 82.3 m (270 ft) in length, 18.9 m (62 ft) in width, and 3.66 m (12 ft) in height.
Sustainability 14 11281 g001
Figure 2. Zoomed-in velocity distributions in the vertical section across the center of the source’s mouth in: (a) Case 1-1, (b) Case 1-2, (c) Case 2-1, and (d) Case 2-2. (Source human body is marked in gray and other passengers are in white).
Sustainability 14 11281 g002
Figure 3. Zoomed-in velocity distributions in the horizontal section at the height of mouths (1.56 m) in: (a) Case 1-1, (b) Case 1-2, (c) Case 2-1, and (d) Case 2-2. (Source is marked by red circle. Red lines denote the slot linear air diffusers).
Sustainability 14 11281 g003
Figure 4. Iso-concentration surfaces of 0.01, 0.02, 0.03, 0.04, and 0.05 quanta/m3 in: (a) Case 1-1, (b) Case 1-2, (c) Case 2-1, and (d) Case 2-2. (Blue circle identifies the source and red arrows show the air flowing from the slot linear air diffusers).
Sustainability 14 11281 g004
Figure 5. Zoomed-in 2D quanta distributions in the vertical section across the center of the source’s mouth in: (a) Case 1-1, (b) Case 1-2, (c) Case 2-1, and (d) Case 2-2; and in the horizontal section across at the height of mouth (1.56 m) in: (e) Case 1-1, (f) Case 1-2, (g) Case 2-1, and (h) Case 2-2. (Source human body is marked in gray in (ad) and marked by black circle in (eh). Red lines in (eh) denote the slot linear air diffusers).
Sustainability 14 11281 g005
Figure 6. The volume with infection risk > 1% (left) and infection risk > 5% (right), versus time.
Sustainability 14 11281 g006
Figure 7. Iso-surfaces for infection risk to be 1%, 2%, 3%, 4%, and 5% after a 30-min exposure, in: (a) Case 1-1, (b) Case 1-2, (c) Case 2-1, and (d) Case 2-2. (Blue circle identifies the source and red arrows show the air flowing from the slot linear air diffusers).
Sustainability 14 11281 g007
Table 1. Boundary conditions.
InletSize: 12 m × 0.025 m (13); airflow rate: 3.4 m3/s; velocity: 3.3 m/s at horizontal direction, 0.9 m/s downward to the floor; temperature: 17 °C
OutletSize: 1 m × 1 m (6), free-slip
Ceiling No-slip, 7.53 W/m2 for heat release from lighting
FloorNo-slip, 12.35 W/m2 for the radiant heat release from human bodies and heat release from equipment
WallNo-slip, adiabatic
Entrance, exit, and virtual sectionSymmetric
Human body surfaceNo-slip, 23.84 W/m2 for convective heat release
Source body’s mouthArea: 3 cm2, velocity: 1.33 m/s, temperature: 34 °C; quanta generation rate: 100 quanta/h
Table 2. Simulation results for MRLA at the source’s mouth and Ts in the canyon with the source.
Cases1-11-22-12-2
MRLA (s)464445603663
Ts (s)623595587603
Table 3. Simulation results of the volume with high infection risks in the breathing zone.
Cases1-11-22-12-2
>0.01 quanta/m371.41 m371.67 m389.12 m3125.04 m3
>0.02 quanta/m327.33 m324.51 m38.01 m321.89 m3
>0.05 quanta/m33.37 m33.80 m30.07 m37.36 m3
Publisher’s Note: MDPI stays neutral with regard to jurisdictional claims in published maps and institutional affiliations.

