Article

Saving CO2 Emissions by Reusing Organic Growing Media from Hydroponic Tomato Production as a Source of Nutrients to Produce Ethiopian Kale (Brassica carinata)

by
Adrian Vollmer
1,
Christoph-Martin Geilfus
2,
Annika Nerlich
1 and
Dennis Dannehl
1,*
1
Division Biosystems Engineering, Faculty of Life Sciences, Albrecht Daniel Thaer-Institute of Agricultural and Horticultural Sciences, Humboldt-Universität zu Berlin, Albrecht-Thaer-Weg 3, D-14195 Berlin, Germany
2
Department of Soil Science and Plant Nutrition, Hochschule Geisenheim University, Von-Lade-Str. 1, D-65366 Geisenheim, Germany
*
Author to whom correspondence should be addressed.
Sustainability 2022, 14(18), 11263; https://doi.org/10.3390/su141811263
Submission received: 15 July 2022 / Revised: 29 August 2022 / Accepted: 4 September 2022 / Published: 8 September 2022

Abstract

:
Large quantities of growing media residues that are rich in nutrients are disposed of after their use in hydroponics. The objective of this study was to investigate the benefits of different organic growing media (wood fibers, hemp fibers, sphagnum moss) residues from hydroponic tomato production as a nutrient source to produce Ethiopian kale. The amount of nutrients that can be reused as fertilizer and the associated CO2 savings have been calculated. Kale was cultivated in sand-residue mixtures, either with 25 or 50 vol% of the mentioned growing media residues. Control treatments with sand with or without nutrient addition were cultivated too. The incorporation of all growing media residues to sand increased the field capacity and growth. Plants that were supplemented with hemp fiber residues showed the strongest growth and highest yields. However, the hemp fiber residues that are used are not suitable for use in the open field due to its excessive content of certain nutrients, which restrict the output quantity. Regarding the fertilization effect of growing media residues, it was calculated that 11–300 kg nutrients ha−1 (N, P, K, Mg, Ca, S), with an average primary energy demand of 90–3435 MJ and 6–317 kg CO2 eq, could potentially be saved when different crops were considered.

1. Introduction

The sustainable production of crops in greenhouses has become increasingly important in recent times [1] and a total area of 497,815 ha is used to produce vegetables under protected conditions worldwide [2]. The role of rock wool as a growing media in hydroponic systems for intensive vegetable production is being criticized. During their use in hydroponics, the growing media are being enriched with nutrients through the nutrient solution to provide the plants with an optimal nutrient supply. At the end of cultivation, valuable unused nutrients, such as Ca, K, Mg, N, and P remain in the growing media [3,4]. In horticultural practice, used growing media are usually disposed of and thus, the remaining nutrients are wasted [5,6]. Reusing both the organic growing media and the adhered nutrients would reduce the environmental burden in crop production, because the environmental costs for production of growing media and fertilizer are high [7,8]. The production of 1 kg of ammonium nitrate has a primary energy demand of 41 MJ and releases 7.2 kg CO2 equivalents into the atmosphere [9]. An average primary energy demand of 990 MJ is required to produce one cubic meter of rock wool, with 167 kg CO2 equivalents being released into the environment [10]. To reduce the environmental burden, it would be reasonable to reuse the growing media residue from hydroponic crop production for the fertilization of crops in soil-based systems. However, from an environmental point of view, rock wool is not suitable for this purpose. It is not allowed to incorporate rock wool into the soil and it is suggested that rock wool has negative effects on human health [11]. Additionally, rock wool is not easily recyclable, which leads to the accumulation of approximately 112 m3 ha−1 y−2 (7 t ha−1 y−2) of waste [12]. Employing alternative organic growing media for the hydroponic vegetable production as done by Dannehl et al. [13] would give the possibility to reuse these growing media residues as organo-mineral fertilizers for soil-based crop production; they are referred to as organo-mineral substrates because they are made of organic material and supplied with mineral fertilizers in the hydroponic system. On one hand, this could reduce waste accumulation, as the growing media can be completely reused. On the other hand, the use of fertilizers could be reduced because these growing media carry a lot of drip-irrigated nutrients from the previous hydroponic drip fertigation. In addition, the organic component may achieve an additional soil improvement in the field [4], as organic matter incorporation usually correlates with an improvement of the physical properties and increased soil life; considering that soil fertility is not yet optimal [14,15,16,17].
The objective of this study is to investigate the effect of sphagnum moss (Sphagnum palustre), wood fiber, and hemp fiber residues from the hydroponic cultivation of vegetables as a nutrient source for Ethiopian kale. For this purpose, Ethiopian kale was grown in pots that were filled with sand and sand that was mixed with organic nutrient-rich residues with different percentage. The pots were not fertilized with other nutrients because this study aimed at quantifying the nutrient gap, i.e., the difference between the nutrient requirement and nutrient delivery from amended residues. In this context, it was aimed (i) to assess the plant development under the mentioned conditions, (ii) to determine the amount of nutrients that can be reused, and (iii) to estimate the environmental burden that can be avoided by such practice where different crops for open field production were considered for calculations.

2. Materials and Methods

2.1. Starting Materials for the Experiments

There were three different growing media that were previously used in hydroponic tomato production: Sphagnum palustre biomass, referred to as sphagnum moss residues (SMR); wood fiber residues (WFR); and hemp fiber residues (HFR). Please note that S. palustre was raised commercially and not taken from swamp-land. The growing media were provided by a growing media company (Klasmann-Deilmann GmbH, Geeste, Germany). The growing media slabs consisted of foil bags with the dimensions 100 cm × 15 cm × 8 cm (length × width × height) that were filled with the dried organic materials. The amount of organic material that was used was 1 kg sphagnum moss, 1.2 kg wood fibers, and 1.5 kg hemp fibers per slab. The chemical composition of the organic material can be found in the Supplementary Table S5. All of the growing media residues were previously used as growing media for tomato production in a hydroponic system from 13 March to 19 November 2019 (36 weeks) under culture management conditions as described by Dannehl et al. [13] and as indicated in the Supplementary Table S4. At the end of cultivation, the tomato plants except their roots were removed by cutting them directly at the growing media slab surface. Afterwards, the slabs were sanitized by drying them in a ventilated oven (Heraeus, Hanau, Germany) at 60 °C for seven days and then shredded with a Hege 44 sample chopper (Wintersteiger AG, Bad Sassendorf, Germany). The chemical composition of all the mentioned organic growing media residues is given in Table 3. This means after they were used in hydroponic tomato production.

2.2. Experimental Design and Plant Cultivation

To produce Ethiopian kale (Brassica carinata var. Arumeru), a greenhouse experiment was conducted from February to April 2020 in Berlin-Dahlem, Germany. The seeds were sown in a depth of 2 cm on 24 February. There were three seeds per pot (Ø = 16 cm; height = 14 cm; v = 2.8 l) that were sown to record the germination rate resulting in 24 seeds per treatment. The plants were then thinned to one plant per pot 7 days after sowing (DAS). Each organo-mineral growing media residue was mixed with quartz sand (Spielsand, grain size 0–2 mm, toom Baumarkt GmbH; Cologne, Germany) in a volume ratio of 25% (v/v) or 50% (v/v) (Table 2). The 25% variants are abbreviated as HFR25, WFR25, and SMR25, while the 50% variants are named HFR50, WFR50, and SMR50. The experiment was completed with three controls: The fully fertilized control consisted of quartz sand that was complemented with mineral nutrients (S100), the negative control consisted of quartz sand without the addition of any mineral nutrients (S0). Third, quartz sand with 50% of the nutrients from the fully fertilized control was used. This group is called medium control (S50) (Table 2). Overall, nine treatments were investigated. Based on the average concentration of mineral elements in the plant shoot dry matter that were deemed sufficient for adequate growth, as estimated by Kirkby [18], and the assumption that Ethiopian kale will build up about 30 g dry mass in nine weeks [19], each pot of the fully fertilized control S100 received in total 400 mg N, 170 mg P, 788 mg K, 96 mg Mg, 326 mg Ca, and 126 mg S. The nutrients were given as: KH2PO4, (KNO3), (Ca(NO3)2·4 H2O (Tetrahydrat)), and (Mg[SO4]·7H2O). Minerals were added in form of a nutrient solution 7 DAS (2 March) and 25 DAS (20 March). The nutrient supply for each variant is given in Table 3. The plants were cultivated at a field capacity of 80%. There were ten replicates per treatment that were arranged completely randomized from 24 February to 28 April. The mean daytime temperature averaged at 21.4 ± 2.5 °C and the mean night temperature averaged at 17.2 ± 2.0 °C throughout the experiment. The daytime relative humidity was 44.8 ± 21.5% and the night relative humidity was 65.5 ± 12.2% throughout the experiment. Additional light (62.3 ± 9.6 µmol m−2 s−1) was applied daily from 7:00 a.m. to 7:00 p.m. by high-pressure sodium lamps.

2.3. Field Capacity and Evapotranspiration

The field capacity (FC) was determined by supersaturating the pots with water and weighing them when no more water leaked. The difference in the weight between water-saturated and the dry pots (amount of water in the pots) was used to calculate how many g of water per g of substrate was kept, representing the field capacity. The evapotranspiration was estimated from the day of sowing to 25 DAS. To achieve this, the weights of all the pots were determined before being replenished with water to 80% of the field capacity.

2.4. SPAD Readings

The chlorophyll content is considered an indication of the nitrogen supply status of a plant. To measure the chlorophyll content in leaves, the SPAD-502P (Minolta Camera Co., Ltd.; Osaka, Japan) was used, which determines a numerical value from absorption measurements of leaves in red and infrared wavelengths. The results represent the means of five readings on the youngest, full developed leaf from eight plants per treatment. The SPAD values were documented at 6, 18, 25, 51, and 60 DAS.

2.5. Growth Performance

Plant height, number of leaves, senescent leaves, leaves length, and width were recorded 25 DAS and 60 DAS. After 64 DAS, the yields (fresh weight (FW) of leaves), dry biomass, and leaf area, were determined. In this context, the plant height was measured from the pot surface to the top of the highest leaf. The length of the largest fully developed leaf was measured from the tip of the leaf blade to the intersection of the leaf blade and petiole. The leaf width was measured perpendicular to the midrib at the widest point of the leaf. The leaf area per plant (cm2) was determined using a leaf area meter Model LI 3100 (LI-COR; Lincoln, NE, USA). The roots were gently washed out and freed from all substrates. The fresh biomass of leaves, stem, and roots was recorded. The dry biomass was determined after drying in a ventilated oven (Heraeus; Hanau, Germany) at 60 °C for five days. The root-to-shoot (R:S) ratio was calculated using the dry mass of the leaves and stem divided by the dry mass of the roots.

2.6. Nutrient Analysis of Organo-Mineral Growing Media Residues and Plants

For plant analysis, three plants per treatment were divided into leaves, stems, and roots, dried in an oven (Heraeus, Hanau, Germany), and ground (MM 30, Retsch GmbH; Haan, Germany). The analysis of the nutrient content of the used organo-mineral growing substrates was performed using a composite sample of three different substrate slabs of the same growing media, which were subsequently dried and ground for further analysis. The sand that was used in our experiment for mixing with the organo-mineral substrates was also dried and analyzed.
The elements K, Ca, Mg, P, and S were determined according to LUFA protocol Volume III, 10.8.1.2 using microwave digestion (microwave CEM, MARS Xpress, CEM; Matthews, NC, USA) followed by detection using ICP-OES with an ICP emission spectrometer (iCAP 6300 Duo MFC, Thermo; Waltham, MA, USA). The ICP-OES was operated at 1150 W RF power, 0.55 L min−1 nebulizer gas flow with argon as the plasmogen as well as the carrier gas and a cross-flow nebulizer (MIRA Mist, Thermo Scientific; Cambridge, England). The respective elements were analyzed in duplicate at the following wavelengths: K: 766.5 nm, Ca: 317.9 nm, Mg: 279.0 nm, P: 213.6 nm, and S: 182.2 nm. Each element was quantified using a calibration curve.
Carbon and nitrogen were determined by the catalytic combustion of 0.3 g of sample material with pure oxygen at 900 °C in an elemental analyzer (Vario MAX, Elementar Analysensysteme GmbH; Hanau, Germany) according to DIN-ISO-13878 [20]. All of the results of the nutrient analyses are given in g kg−1 dry matter (DM).

2.7. Calculations of Relative Nutrient Uptake and Saving Potential of Energy and CO2 Equivalents

To calculate the nutrient uptake of the individual elements and the total nutrient uptake of Brassica carinata plants as a function of the organo-mineral residues that were reused, the dry weight per plant and the nutrient content was analyzed as described in 2.5 and 2.6, respectively. The nutrient uptake in plants is expressed as [g plant−1] on a dry matter basis. From these results and the amount of nutrients that were present per pot (Table 3), the relative nutrient uptake of Ethiopian kale that was grown in different organo-mineral growing media residues was calculated and expressed as %.
The potential of fertilizer savings for N, P, K, Mg, Ca, and S by using the organo-mineral growing media residues was calculated using the nutrient content of the organo-mineral residues and their estimated application rate per ha. In addition to Ethiopian kale, four of the most widely cultivated crops in Germany were considered in our calculations: corn (Zea mays L.), sugar beet (Beta vulgaris L.), onion (Allium cepa L.), and white cabbage (Brassica. oleracea var. capitata). The application rates were limited in such a way that the given P quantity per ha corresponds to the expected P withdrawal by the respective crop per ha. For Ethiopian kale, the withdrawal was calculated by the mean of the average P content per plant of both the fully fertilized control and the 50% treatments and a plant density of 6 plants m−2 in the open field [21]. For the other crops, the expected withdrawals were calculated by the standard values for P content according to German law [22] and the average yields per ha [23,24]. The calculated fertilizer savings per ha, are expressed as kg ha−1 for each plant nutrient that was used. From these results, the saving potential of energy [MJ] and CO2 equivalent [kg] was calculated according to the results of Skowrońska and Filipek [25] for N, P, K, and Ca, and Umweltbundesamt [26] for Mg and S (Table 1).

2.8. Statistical Analysis

Statistical analysis was performed using agricolae [27] and PMCMRplus [28] packages in R Studio (Version 1.2.5042). The FC, SPAD values, plant parameters, and nutrient content was compared with one-way analysis of variance (ANOVA), using organo-mineral growing media residues as the factor. The data were tested for normality of the residuals by the Shapiro–Wilk test and for homogeneity of variances among the treatments with Levene test, before proceeding with ANOVA. Where these assumptions were not satisfied, the data were transformed with the natural logarithm (loge) to increase normality of the data. Tukey’s HSD post hoc test after ANOVAs at p < 0.05 was used to check which levels of a factor differed from one another. In the case of heterogeneous variances, a Dunnett’s T3 test at p < 0.05 was performed instead. Where an ANOVA could not be used, a multiple comparison with Kruskal–Wallis was used with p ≤ 0.05. The post hoc test is using the criterium Fisher’s LSD, adjusted with a Bonferroni correction.

3. Results

3.1. Organo-Mineral Growing Media Residue Properties

The field capacity (FC) varied significantly between the treatments (SMR > HFR > WFR > Sand) and decreased with an increasing amount of sand (Table 2). Evapotranspiration ranged from 1016.4 ± 35.4 g water (WFR50) to 1177.4 ± 19.6 g water (SMR25) and increased with the amount of sand in the growing media treatments (Table 2).
The nutrient contents and C:N ratios of the organo-mineral residues were analyzed (Table 3). The HFR showed the highest N content and the lowest C:N ratio, but the N content was significantly higher only compared to WFR. The contents of P (121.8 ± 11.9 g kg−1 DM) and Ca (168.3 ± 16.9 g kg−1 DM) in HFR were more than five times higher compared to those in SMR and WFR. Regarding K and Mg, the highest contents were found in sphagnum residues. The C:N ratio of HFR (13.4 ± 0.9) was about five times lower than WFR and about three times lower than SMR (Table 3). In all growing media residues, the concentrations of Ca and P were higher or substantially higher than the other nutrients, with HFR showing the largest differences in the concentration of the individual nutrients (N:P:K:Ca:Mg:S = 1:11.8:0.3:14.3:0.3:0.6) (Table 3).

3.2. Effect of Organo-MINERAL Residues on Chlorophyll Content Indicated by SPAD Readings

The SPAD values of all the treatments except S0 increased continuously during the experiment (Table 4). Regarding the negative control, no results were recorded 16 DAS. Early in the experiment, the highest SPAD values (35 ± 2) were measured in the leaves of hemp-grown plants but differed only significantly from WFR25- (28 ± 1) and SMR25 (27 ± 0)-treated plants. At 60 DAS, the fully fertilized control showed the highest SPAD value (54 ± 2), with a significant difference to HFR50 (48 ± 4) > SMR50 > WFR25 > SMR25 > S0 (30 ± 3) (Table 4).

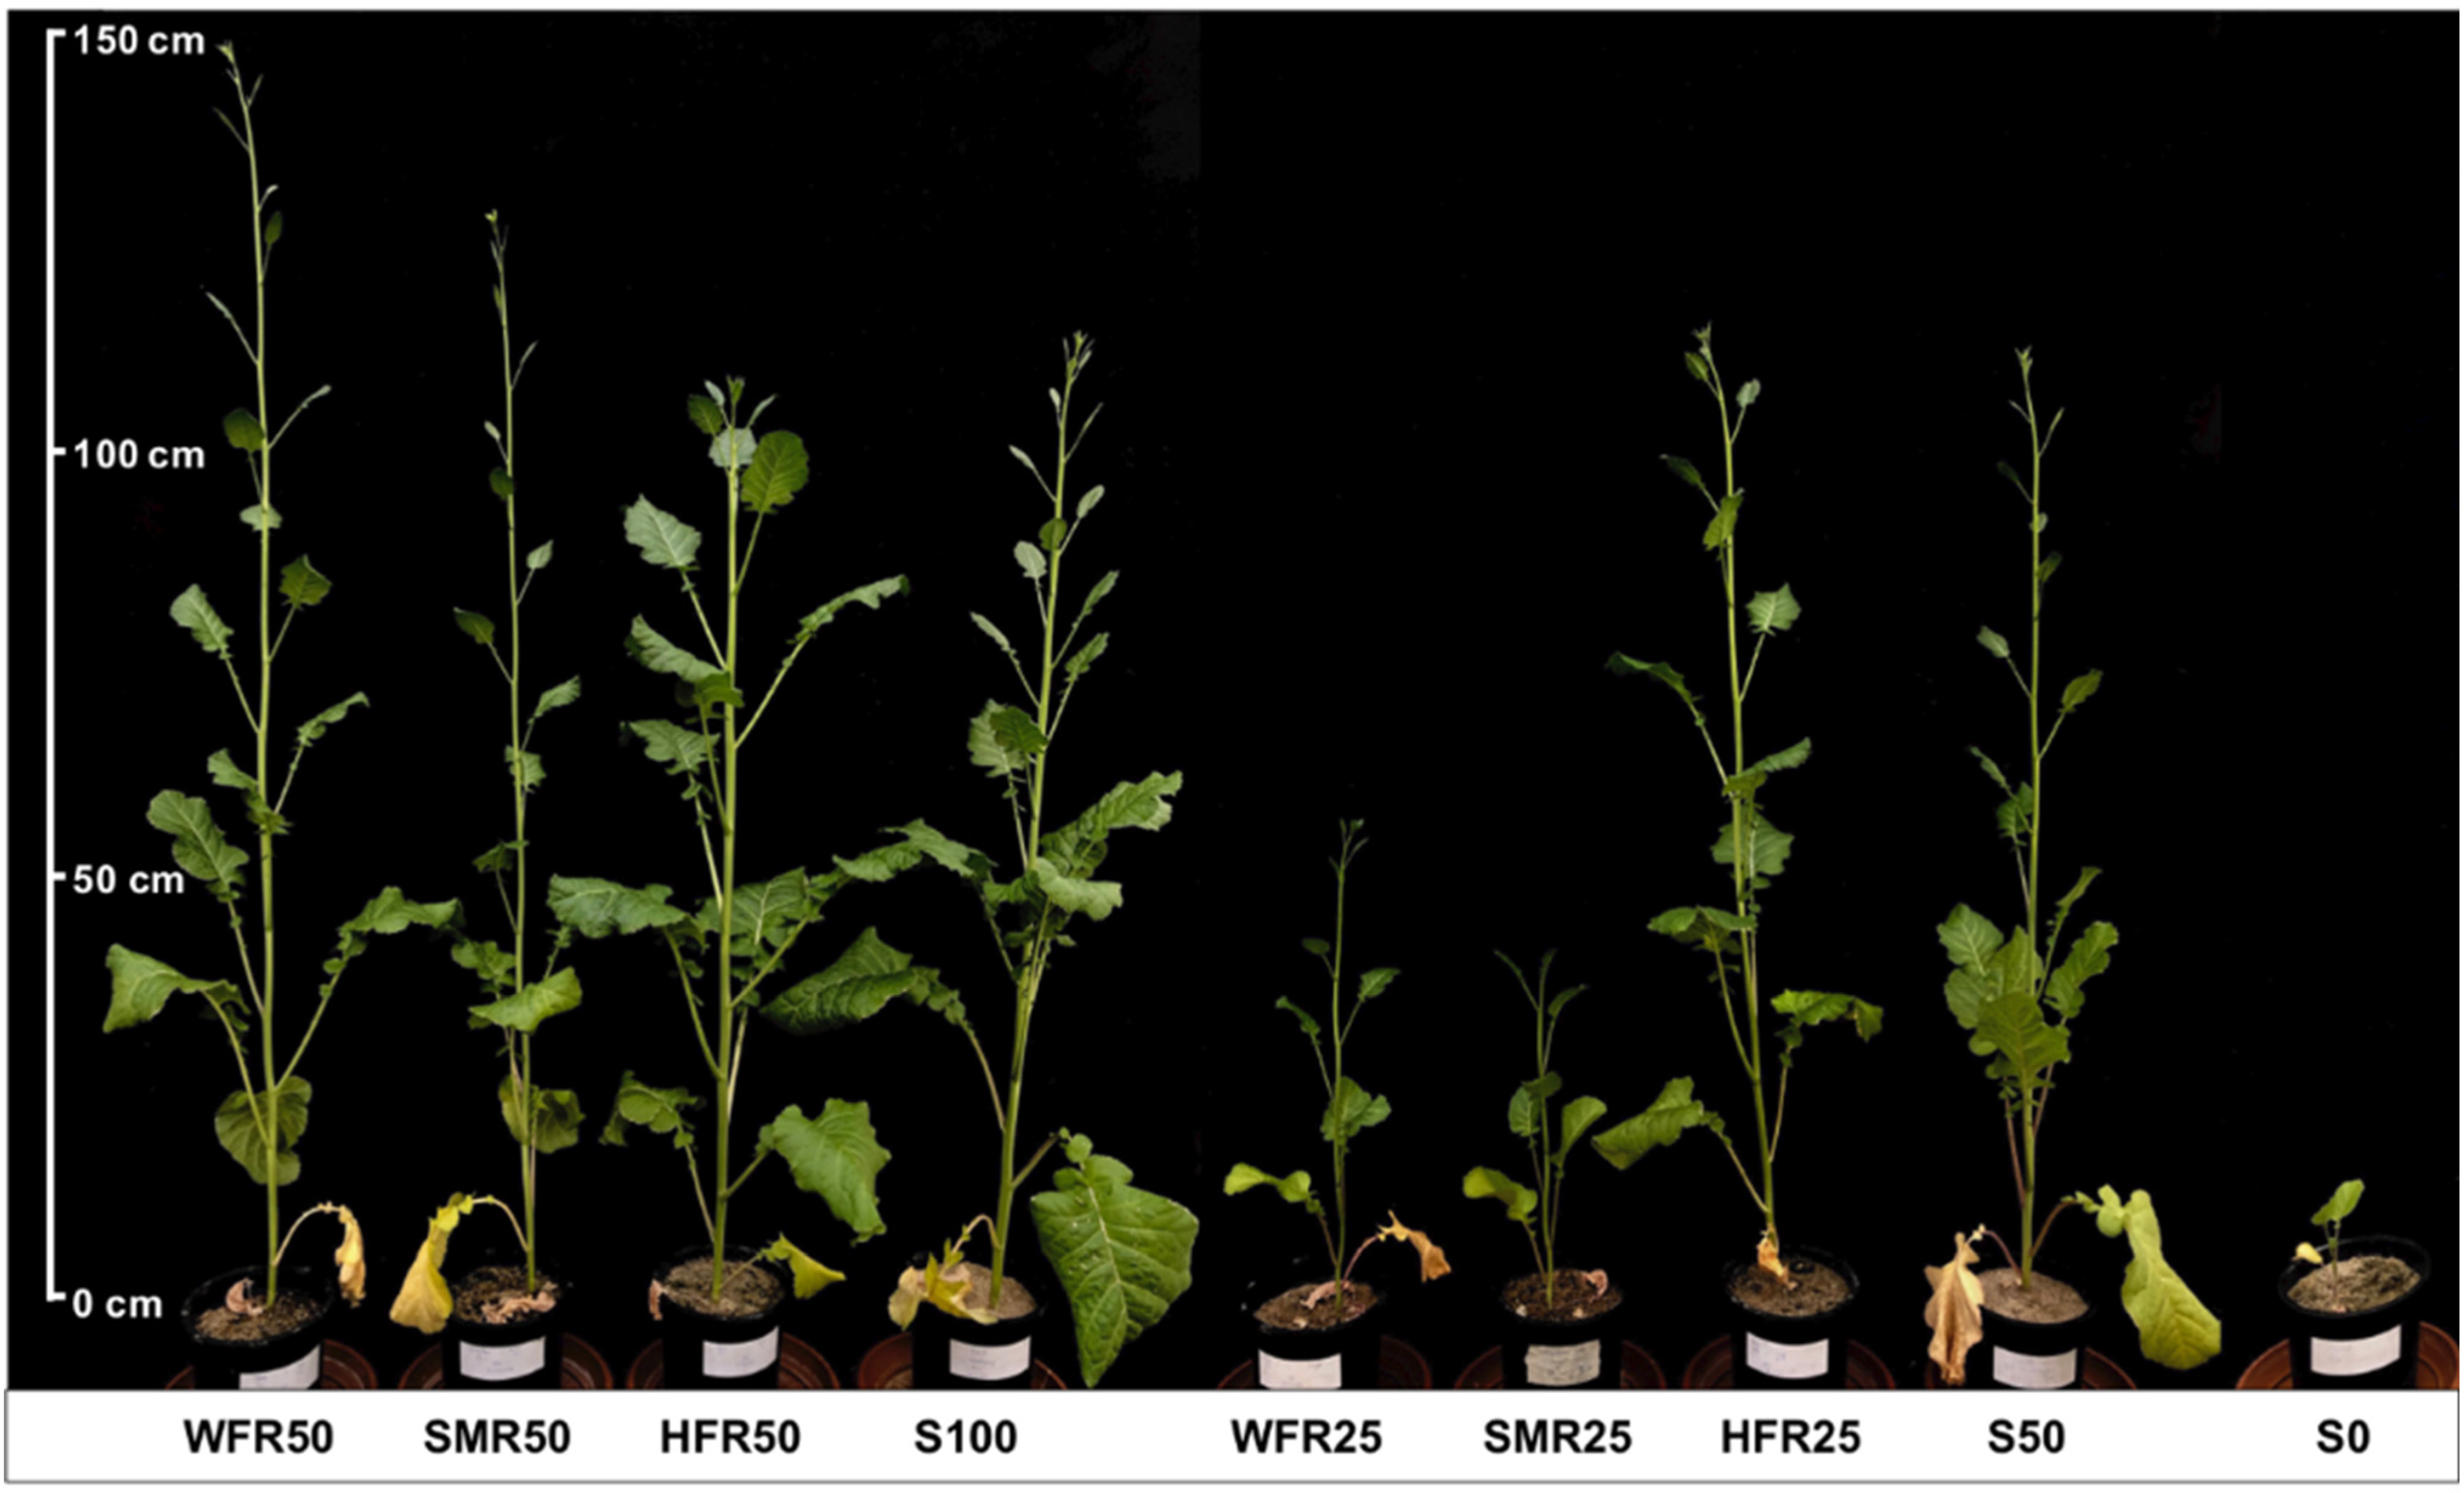
3.3. Effect of Organo-Mineral Residues on Plant Growth, Biomass, and Yield

In all variants, the germination rate was almost 100%. The only delay in germination occurred in the hemp residue treatments (Supplemental Table S3). At 25 DAS, no significant growth reduction, as indicated by the leaf sizes and plant heights, compared to the fully fertilized control was observed, except for the treatments S0 and HFR50 (Table 5). In terms of height, the plants in the treatments with wood and sphagnum residues were even significantly higher.
The S0- and HFR50-treated plants showed the smallest leaves and the lowest height (HFR50 > S0) compared to the other treatments 25 DAS (Table 5). However, this had changed at the end of the experiment, where plants that were grown in HFR50 showed only smaller leaves in comparison with the fully fertilized control and moreover the highest yield (81.35 ± 15.70 g leaf FW) and leaf area (19.06 ± 3.54 cm2) (Table 5 and Table 6). It should also be noted that there was no significant difference to the fully fertilized control in terms of yield, plant height, leaf area, number of leaves, or total biomass (Table 6). The treatments WFR50, SMR50, and HFR25 showed no significant differences to S50 in terms of yield, DM, leaf area, number of leaves, total biomass, and R:S ratio (Table 6). Plants of the negative control and those that were grown in SMR25 and WFR25 showed the strongest growth reductions (Figure 1, Table 6), and exhibited the lowest number of leaves (3–8.5), leaf area (0.4–3.6 cm2), yield (1.2–14.6 g FW), and total biomass (0.5–8 g DM). However, the DM content (17.6–20%) and root-to-shoot ratio (R:S) (0.2–0.28) was the highest when the same treatments were considered (Table 6). Concerning plant height, plants that were grown in WFR50 followed by plants in SMR50 showed the highest values. Comparing the effect of the two growing media volumes, the WFR50 treatment resulted in three times as much biomass, leaf area, and yield as the WFR25 treatment, while the other treatments usually showed values that were not even twice as high (Table 6).

3.4. Effect of Organo-Mineral Residues on Nutrient Content

Plant growth was not sufficient in the negative control, thus data on the concentrations of nutrients are not available. Plants of the HFR50 treatment and the fully fertilized control showed the highest overall nutrient content (total of all nutrients) per plant (Table 7). Followed by plants that were grown in HFR25 (containing 66% of the amount in S100), S50 and WFR50 (containing 59% and 54% of the amount in S100). The lowest nutrient content was found in the SMR25- and WFR25-treated plants (23%), and the SMR50 treatment (36%).
The relative nutrient uptake (Table 7) by kale plants shows for all the treatments that the added growing media residue contained more nutrients than the kale plant has taken up. Relative to the amount of nutrients that were present, the kale plants that were grown in wood fiber absorbed less in the 25% treatment than those in the 50% treatment. In all other treatments, including the controls, this ratio was reversed.

3.5. Potential Savings of Nutrients and Associated Energy Consumption

Regarding the fertilization effect of growing media residues, the reuse of HFR shows the lowest nutrient saving potential between 11 kg ha−1 (Ethiopian kale) and 154 kg ha−1 (sugar beet) (Table 8). The WFR ranges between 14 and 211 kg ha−1, and the highest saving potential was found with 21 to 300 kg/ha for SMR. Those savings could be realized by using (i) 0.1–1.7 m3 ha−1 of HFR (0.3–4.9 dt ha−1) or (ii) 2.0–28.1 m3 ha−1 of WFR (2.2–30.9 dt ha−1) or (iii) 4.5–63.5 m3 ha−1 of SMR (2.7–38 dt ha−1). The potential savings range from a total primary energy demand of 87 MJ and 6 kg CO2 eq for HFR amended to Ethiopian kale and 2879 MJ and 285 kg CO2 eq for SMR amended to sugar beet [25,26] (Table 8).

4. Discussion

The results show that all the organo-mineral growing media residues that accumulated from tomato production in greenhouses can be reused as soil amendment and a nutrient source to produce Ethiopian kale. The growing media sphagnum moss (SM), wood fibers (WF), and hemp fibers (HF) have different physicochemical properties, which certainly influence their suitability as organo-mineral fertilizer [29]. For instance, field capacity is an attribute that varies between the growing media residues (Table 2). Thus, it can be anticipated that soils that are poor in organic compounds might benefit from improved water holding capacities when being amended with the residues. Furthermore, the pot experiment witnessed a huge growth promotion when unfertilized sand (S0 variant) was supplemented with residues from SMR, WFR, or HFR (Figure 1; Table 5 and Table 6). This demonstrates in general that nutrients can be transferred and reused. Similar results have been found by others [4,17], who studied the reuse of coconut coir and their effects on growth of different horticultural crops and on soil chemical properties.
At 25 DAS, no drastic malnutrition symptoms could be observed when nutrient-poor sand was mixed with 50% (v/v) or 25% (v/v) of SM, WF, or HF. After 64 DAS, the plants that were supplied with 50% HFR showed no significant difference compared to the fully fertilized control, whereas all the other treatments showed a reduced yield (except for HF25), leaf area, and in most cases total biomass. Especially the 25% variants of sphagnum moss (SMR25) and wood fiber (WFR25) showed significantly reduced growth, biomass, SPAD, and yield when compared to all other treatments (Figure 1; Table 6). This can be attributed to the high nutrient load and to the physicochemical properties of the residues, since in all the treatments with residues, the nutrient load was much higher than in the fully fertilized control. The physicochemical properties do matter: the study from Stirzaker et al. [30] showed that the growth of barley plants could be affected by the bulk density. Since the growing media residues have very different masses, resulting in lower bulk densities (52% for SMR50 up to 79% for HFR25 in comparison to sand), this might also have an influence on the different growth performances. The incorporation of organo-mineral residues into soil will inevitably increase the C:N ratio. Due to immobilization of nutrients this could impose short-term problems regarding the nutrient supply. High C:N ratios can cause reduced rates of N mineralization, thereby reducing N availability [31,32]. Effects such as this could explain the reduced growth (Table 6) and lower nutrient content (Table 7) in plants with carbon-rich residue amendments such as SMR and WFR (Table 3), compared to plants that were amended with HFR (low C:N ratio) or minerally fertilized via a nutrient solution (S100). This assessment is supported by the results of Vandecasteele et al. [8], who reported low decomposition rates and lower N availability in the used growing media, while P and K were highly plant-available.
The relative nutrient uptake (Table 7) delivers information about the amount of lacking nutrients and can be used as an input factor for the identification of the fertilizer requirement. Since it is shown that the transfer of nutrients from hydroponics is possible, Table 8 shows the potential savings that result from the reuse of growing media that were calculated for different crops. Crop-dependent, approximately 11–300 kg nutrients ha−1 (N, P, K, Mg, Ca, S), with an average primary energy demand of 87–2879 MJ and 6–285 kg CO2 equivalent, could potentially be saved. The calculations demonstrate that the higher the nutrient requirement of the crop, the higher the energy and CO2-savings in fertilizer production. While Ethiopian kale shows the lowest savings potential, sugar beet, with its much higher demand, shows the highest energy and CO2-savings (Table 8). Other studies on the reuse of growing media (in this case coir) showed potential nutrient savings in the upper range of the calculations in this study. Koyama et al. [17] reported 294 kg ha−1 nutrient savings for the cultivation of cucumbers (20 t coir residues ha−1), while the data from Gougoulias et al. [4] showed a saving of 185 kg ha−1 in tomato production (28 t coir residues ha−1). These calculations are only estimates and do not consider mobilization and mineralization processes.
The data of this study show that the application is not easily done, due to the extraordinary high contents of P and unsuitable proportions of nutrients, especially in HFR (N:P2O5:K2O = 1:24:0.4). To exclude any impact on the environment in terms of P pollution, the calculation assumes that the total P in the growing media is mobile or plant-available (being aware that this is not the case). Thus, the application rates of the growing media were limited in such a way that the given P quantity per ha corresponds to the expected P demand by the respective model crop per ha. Due to the extremely high p values, Table 8 shows lower application rates than originally anticipated. This means that less positive effects (nutrient savings and organic matter) are to be expected, especially as the data from this study indicates that a large proportion of the applied nutrients are not directly available to plants (Table 7). HFR that was used in this experiment are not suitable for incorporation into the soil because environmentally harmful amounts of P would be given to fulfill the plants’ demands for the other nutrients. In addition, the calculated application rate of 0.1–1.7 m3 HFR ha−1 (corresponding to a thickness of 0.01–0.17 mm) would not be practicable, since the common application technology is not designed for such small quantities. This problem originates from the pretreatment. The nutrient solution that was applied to the tomatoes contained realistic phosphorus levels (Supplemental Table S4), yet a significant amount of P accumulated in the growing media (Supplemental Table S5). It can be assumed that the P requirement of the plants was lower than expected, as other studies showed a more balanced nutrient ratio [3,4,8]. To achieve an effective reuse with the highest possible relief for the environment, care must be taken in primary production to ensure a precise nutrient supply as it is needed from plants. This could highly increase the saving potential. Additionally, Dannehl et al. [3] reported that approximately 112.5 m3 of growing media waste per hectare greenhouse production area would be avoided through the use of alternative organic growing media and their reuse as organo-mineral fertilizer in an open-field production.

5. Conclusions

The study has shown that organo-mineral growing medium residues, which are residues in hydroponics for tomato cultivation in greenhouses, are nutrient carriers that can be used in a subsequent cultivation of kale, e.g., in outdoor production. Calculations have shown that the greater the nutrient requirement of the crop, the higher the application rate of the organo-mineral residue must be. Limits, such as for phosphorus, must be considered. This circular economy could save a part of the fertilizer purchase from the producer and thus a part of the fertilizer production in large farms. This in turn means that the energy for fertilizer production and thus CO2 emissions can be reduced. In addition, the use of all tested growing media leads to an increase in field capacity, which means that water storage in the soil can be improved and counteracts rapid drying of the soil. Furthermore, it can be concluded that the use of the organic substrates in hydroponic systems and its reuse in open field production as fertilizer and soil conditioner can save large amounts of waste, which so far often comes in the form of rockwool.

Supplementary Materials

The following supporting information can be downloaded at: https://www.mdpi.com/article/10.3390/su141811263/s1.

Author Contributions

Investigation, Writing—Original Draft, Formal analysis, A.V.; Writing—Review & Editing, Validation, Supervision, C.-M.G.; Investigation, Data Curation, A.N.; Conceptualization, Methodology, Resources, Writing—Review & Editing, Supervision, Project administration, D.D. All authors have read and agreed to the published version of the manuscript.

Funding

This research did not receive any specific grant from funding agencies in the public, commercial, or not-for-profit sectors.

Institutional Review Board Statement

Not applicable.

Informed Consent Statement

Not applicable.

Data Availability Statement

The original contributions that were presented in the study are included in the article. Further inquiries can be directed to the corresponding author.

Acknowledgments

We would like to thank all gardeners and all staff of the joint laboratory at Albrecht Daniel Thaer-Institute for Agricultural and Horticultural Sciences who helped us with plant care and chemical analyses.

Conflicts of Interest

The authors declare that the research was conducted in the absence of any commercial or financial relationships that could be construed as a potential conflict of interest.

References

  1. Geilfus, C.-M. Protected Cropp.ing in Horticulture. In Controlled Environment Horticulture: Improving Quality of Vegetables and Medicinal Plants; Geilfus, C.-M., Ed.; Springer International Publishing: Cham, Switzerland, 2019; pp. 7–17. [Google Scholar]
  2. Hickman, G.W. International Greenhouse Vegetable Production—Statistics (2018 Edition); Cuesta Roble Consulting: Mariposa, CA, USA, 2018. [Google Scholar]
  3. Dannehl, D.; Becker, C.; Suhl, J.; Josuttis, M.; Schmidt, U. Reuse of Organomineral Substrate Waste from Hydroponic Systems as Fertilizer in Open-Field Production Increases Yields, Flavonoid Glycosides, and Caffeic Acid Derivatives of Red Oak Leaf Lettuce (Lactuca sativa L.) Much More than Synthetic Fertilizer. J. Agric. Food Chem. 2016, 64, 7068–7075. [Google Scholar] [CrossRef] [PubMed]
  4. Gougoulias, N.; Vagelas, I.; Giurgiulescu, L.; Touliou, E.; Kostoulis, V.; Chouliara, A. The coir substrate for soilless cultures, reused as soil amendment (study in vitro and in vivo). Carpathian J. Food Sci. Technol. 2017, 9, 61–70. [Google Scholar]
  5. Papadopoulos, A.; Gosselin, A. Greenhouse vegetable production in Canada. Chron. Hortic. 2007, 47, 23–28. [Google Scholar]
  6. Incrocci, L.; Pardossi, A.; Minuto, A.; Diara, C. Reusing greenhouse growing media. Acta Hortic. 2010, 927, 793–800. [Google Scholar]
  7. Stanghellini, C.; Montero, J. Resource use efficiency in protected cultivation: Towards the greenhouse with zero emissions. Acta Hortic. 2012, 927, 91–100. [Google Scholar] [CrossRef]
  8. Vandecasteele, B.; Blindeman, L.; Amery, F.; Pieters, C.; Ommeslag, S.; Van Loo, K.; De Tender, C.; Debode, J. Grow-Store-Steam-Re-peat: Reuse of spent growing media for circular cultivation of Chrysanthemum. J. Clean. Prod. 2020, 276, 124128. [Google Scholar] [CrossRef]
  9. Williams, A.G.; Audsley, E.; Sandars, D.L. Environmental burdens of producing bread wheat, oilseed rape and potatoes in England and Wales using simulation and system modelling. Int. J. Life Cycle Assess. 2010, 15, 855–868. [Google Scholar] [CrossRef]
  10. Brandhorst, J.; Spritzendorfer, J.; Gildhorn, K.; Hemp, M. Dämmstoffe aus Nachwachsenden Rohstoffen, 4th ed.; Fachagentur Nachwachsende Rohstoffe e.V., Ed.; Druckerei Weidner: Rostock, Germany, 2012. [Google Scholar]
  11. Quantis Comparative Life Cycle Assessment of Horticultural Growing Media Based on Peat and Other Growing Media Constituents. Report Prepared for the European Peat and Growing Media Association; European Peat and Growing Media Association. 2012. Available online: https://www.growing-media.eu/our-work (accessed on 10 July 2021).
  12. Pieters, J.; Assche, B.; Buekens, A. Reducing Solid Waste Streams Specific to Soilless Horticulture. HortTechnology 1998, 8, 396–401. [Google Scholar] [CrossRef]
  13. Dannehl, D.; Suhl, J.; Ulrichs, C.; Schmidt, U. Evaluation of substitutes for rock wool as growing substrate for hydroponic tomato production. J. Appl. Bot. Food Qual. 2015, 88, 68–77. [Google Scholar]
  14. Raviv, M. Can compost improve sustainability of plant production in growing media? Acta Hortic. 2017, 1168, 119–134. [Google Scholar] [CrossRef]
  15. Hülsbergen, K.-J. Entwicklung und Anwendung eines Bilanzierungsmodells zur Bewertung der Nachhaltigkeit landwirtschaftlicher Systeme. In Berichte aus der Agrarwirtschaft; Shaker Verlag: Aachen, Germany, 2003. [Google Scholar]
  16. Six, J.; Bossuyt, H.; Degryze, S.; Denef, K. A history of research on the link between (micro)aggregates, soil biota, and soil organic matter dynamics. Soil Tillage Res. 2004, 79, 7–31. [Google Scholar] [CrossRef]
  17. Koyama, S.; Urayama, H.; Karunaratne, K.M.P.D.; Yamashita, T. Effects of Coir App.lication on Soil Properties and Cucumber Production as a Reuse Model of Organic Medium Used in Soilless Culture. Trop. Agric. Dev. 2009, 53, 7–13. [Google Scholar]
  18. Kirkby, E. Chapter 1—Introduction, Definition and Classification of Nutrients. In Marschner’s Mineral Nutrition of Higher Plants, 3rd ed.; Marschner, P., Ed.; Academic Press: San Diego, CA, USA, 2012; pp. 3–5. [Google Scholar]
  19. Seepaul, R.; Marois, J.; Small, I.M.; George, S.; Wright, D.L. Carinata Dry Matter Accumulation and Nutrient Uptake Responses to Nitrogen Fertilization. Agron. J. 2019, 111, 2038–2046. [Google Scholar] [CrossRef]
  20. ISO 13878:199; Soil Quality—Determination of Total Nitrogen Content by Dry Combustion (“elemental analysis”). ISO: Geneva, Switzerland, 1998.
  21. Shackleton, C.M.; Pasquini, M.W.; Drescher, A.W. African Indigenous Vegetables in Urban Agriculture; Earthscan: London, UK, 2009; p. 298. [Google Scholar]
  22. Bundesministerium der Justiz (BMJ). Bundesgesetzblatt, Teil I Nr. 20; Bundesministerium der Justiz (BMJ): Bonn, Germany, 2020; pp. 846–861. [Google Scholar]
  23. Destasis, Land- und Forstwirtschaft, Fischerei. Gemüseerhebung—Anbau und Ernte von Gemüse und Erdbeeren-; Statistische Bundesamt: Wiesbaden, Germany, 2021; Volume 3, pp. 2–79. [Google Scholar]
  24. Destasis. Wachstum und Ernte—Feldfrüchte; Statistische Bundesamt: Wiesbaden, Germany, 2021; Volume 3, pp. 2–30. [Google Scholar]
  25. Skowrońska, M.; Filipek, T. Life cycle assessment of fertilizers: A review. Int. Agrophysics 2014, 28, 101–110. [Google Scholar] [CrossRef]
  26. Umweltbundesamt. Prozessorientierte Basisdaten für Umweltmanagement-Instrumente (ProBas). Available online: https://www.probas.umweltbundesamt.de/php/prozessdetails.php?id={9D277D82-8884-45CC-8CE4-BF894726E240} (accessed on 6 February 2022).
  27. de Mendiburu, F.; Agricolae: Statistical Procedures for Agricultural Research. R Package Version 1.3–2. 2020. Available online: https://CRAN.R-project.org/package=agricolae (accessed on 10 November 2020).
  28. Pohlert, T. PMCMRplus: Calculate Pairwise Multiple Comparisons of Mean Rank Sums Extended, R Package Version 1.9.0. 2021. Available online: https://cran.r-project.org/web/packages/PMCMRplus/index.html (accessed on 10 November 2021).
  29. Nerlich, A.; Dannehl, D. Soilless cultivation: Dynamically changing chemical properties and physical conditions of organic substrates influence the plant phenotype of lettuce. Front. Plant Sci. 2021, 11, 1–13. [Google Scholar] [CrossRef] [PubMed]
  30. Stirzaker, R.J.; Passioura, J.B.; Wilms, Y. Soil structure and plant growth: Impact of bulk density and biopores. Plant Soil 1996, 185, 151–162. [Google Scholar] [CrossRef]
  31. Vityakon, P.; Meepech, S.; Cadisch, G.; Toomsan, B. Soil organic matter and nitrogen transformation mediated by plant residues of different qualities in sandy acid upland and paddy soils. NJAS—Wagening. J. Life Sci. 2000, 48, 75–90. [Google Scholar] [CrossRef]
  32. Le, T.; Marschner, P. Mixing organic amendments with high and low C/N ratio influences nutrient availability and leaching in sandy soil. J. Soil Sci. Plant Nutr. 2018, 18, 952–964. [Google Scholar] [CrossRef]
Figure 1. Above-ground biomass and its height in dependency of organo-mineral growing media residue amendment 60 days after sowing.
Sustainability 14 11263 g001
Table 1. The main burdens for producing, packing, and delivering different types of fertilizers (Data for N, P, K, and Ca according to Skowrońska and Filipek [25], and for Mg and S according to Umweltbundesamt [26]).
Fertilizer ProductPrimary Energy Consumption [MJ kg−1]Global Warming Potential [kg CO2 eq kg−1]
Ammonium Nitrate as N406.2
Single super phosphate as P130.6
Muriate of potash as K10.060.6
Limestone as Ca2.30.15
Magnesium sulfate as S and Mg *5.0740.295
* The amount of magnesium sulfate corresponding to the saving of S or Mg is used for the calculation. If a higher saving of S is possible, the amount of S is used and vice versa.
Table 2. Characteristics of the organo-mineral growing media residues and evapotranspiration until 25 days after sowing.
TreatmentsVolume
Sand
[l pot−1]
Volume Residues
[l pot−1]
Mass Sand
[g pot−1]
Mass Residues [g pot−1]FC
[g water g substrate−1]
Total Evapotranspiration
[g water pot−1]
HFR501.21.219203420.40 ± 0.02 b1038.00 ± 26.98 cd
HFR251.80.628801710.23 ± 0.01 e1076.13 ± 34.87 bcd
WFR501.21.219201320.38 ± 0.01 c1016.38 ± 35.44 d
WFR251.80.62880660.24 ± 0.01 e1059.38 ± 73.26 bcd
SMR501.21.21920720.46 ± 0.01 a1103.86 ± 22.80 ab
SMR251.80.62880360.26 ± 0.01 d1177.43 ± 19.61 a
S1002.40384000.17 ± 0.00 f1078.75 ± 20.60 bc
S502.40384000.17 ± 0.00 f1075.13 ± 51.58 bc
S02.40384000.17 ± 0.00 f1044.38 ± 16.26 cd
Hemp fiber residues (HFR), wood fiber residues (WFR), sphagnum moss residues (SMR), and sand (S). Differences are indicated by different lower-case letters (Tukey’s HSD-Test, p < 0.05, mean ± standard deviation, n = 10; for evapotranspiration Fisher’s LSD-Test, p < 0.05, mean ± standard deviation, n = 8).
Table 3. Nutrient contents in the growing media residues.
SubstrateNPKMgCaSC/N
g nutrient kg−1 DM growing media residue
HFR11.8 ± 2.5 a121.8 ± 11.9 a4.0 ± 0.4 b3.8 ± 0.5 b168.3 ± 16.9 a7.3 ± 1.0 a13.4 ± 0.9 b
WFR6.6 ± 1.7 b19.2 ± 3.3 b7.5 ± 1.7 b2.9 ± 0.7 b26.2 ± 4.2 b5.9 ± 1.1 a70.2 ± 18.1 a
SMR8.4 ± 1.8 ab15.6 ± 2.4 b11.9 ± 1.8 a6.9 ± 0.1 a31.1 ± 2.1 b5.5 ± 0.9 a48.6 ± 11.7 a
Sand0.1 ± 0.00.1 ± 0.00.8 ± 0.00.5 ± 0.01.2 ± 0.00.1 ± 0.0
g nutrient pot−1
HFR504.2941.904.593.3262.232.70
HFR252.2721.063.912.6833.461.45
WFR501.122.764.212.428.140.97
WFR250.681.503.722.236.410.58
SMR500.851.364.082.536.920.59
SMR250.550.793.652.285.800.39
S1000.650.404.022.145.010.32
S500.450.323.622.094.850.26
S00.250.233.232.044.680.19
Differences are indicated by different lower-case letters (Tukey’s HSD-Test, p < 0.05, mean ± standard deviation, n = 3).
Table 4. SPAD values in Brassica carinata that was grown in different growing media residues.
Treatment16 DAS25 DAS60 DAS
HFR5035 ± 3 a37 ± 2 a48 ± 4 bc
HFR2533 ± 2 a36 ± 4 a51 ± 4 ab
WFR5032 ± 3 ab34 ± 4 ab54 ± 2 a
WFR2528 ± 1 b33 ± 3 ab46 ± 4 bc
SMR5031 ± 1 ab34 ± 2 ab48 ± 2 bc
SMR2527 ± 0 b34 ± 3 ab45 ± 4 c
S10030 ± 1 ab36 ± 3 a54 ± 2 a
S5031 ± 0 ab34 ± 3 a49 ± 4 abc
S0 *NA29 ± 2 b30 ± 3 d
* Plants were too small in S0 at 16 DAS (NA = not applicable). Data that are displayed are the mean SPAD values of five readings on the youngest fully developed leaf per plant, from eight plants per treatment on different days after sowing (DAS). Differences are indicated by different lower-case letters (HSD-Test, p < 0.05, mean ± standard deviation, n = 8).
Table 5. Plant development of Ethiopian kale plants that were grown on different growing media residues.
25 DAS25 DAS25 DAS60 DAS60 DAS60 DAS
TreatmentLeaf Length [cm plant−1]Leaf Width [cm plant−1]Plant Height [cm plant−1]Leaf Length [cm plant−1]Leaf Width
[cm plant−1]
Plant Height
[cm plant−1]
HFR508.21 ± 1.03 b5.33 ± 0.84 b9.50 ± 1.52 c21.63 ± 1.55 b16.43 ± 0.94 a100.56 ± 7.31 bc
HFR259.99 ± 1.25 a6.30 ± 0.88 ab11.09 ± 0.79 bc18.19 ± 1.36 cd13.76 ± 1.30 bc116.98 ± 16.92 b
WFR5010.66 ± 0.54 a7.19 ± 0.57 a15.10 ± 1.29 a17.59 ± 1.22 cd13.59 ± 1.44 bc144.63 ± 15.25 a
WFR2511.31 ± 0.43 a7.15 ± 0.49 a14.78 ± 1.61 a12.86 ± 1.66 e8.60 ± 1.40 d78.89 ± 20.62 cd
SMR5010.56 ± 0.63 a6.91 ± 0.58 a14.75 ± 0.22 a16.21 ± 2.33 d11.80 ± 1.93 c125.45 ± 25.80 ab
SMR2511.11 ± 0.72 a6.91 ± 0.61 a14.61 ± 1.95 a12.63 ± 2.01 e8.81 ± 1.29 d67.71 ± 15.92 d
S10010.48 ± 1.26 a6.68 ± 0.53 a11.29 ± 1.02 bc24.31 ± 1.17 a18.03 ± 1.11 a109.63 ± 11.96 b
S5011.10 ± 1.26 a7.19 ± 0.61 a12.03 ± 1.69 b20.01 ± 1.27 bc14.08 ± 0.57 b106.86 ± 9.10 b
S02.13 ± 0.43 c1.86 ± 0.27 c3.03 ± 0.70 d5.70 ± 0.32 f3.98 ± 0.35 e12.70 ± 0.99 e
DAS means days after sowing. Differences are indicated by different lower-case letters (Tukey’s HSD-Test, p < 0.05, mean ± standard deviation, n = 8, for leaf width Dunnett’s T3-Test, p < 0.05, mean ± standard deviation, n = 8).
Table 6. Plant parameters of Ethiopian kale plants that were obtained at the end of the experiment.
TreatmentYield
[g Leaf Fresh Weight plant−1]
Leaf Area [dm2 plant−1]Leaves
[Number plant−1]
Total Biomass [g DM plant−1]DM Content in Leaves [%]Root: Shoot
Ratio
HFR5081.35 ± 15.90 a19.06 ± 3.54 a13.88 ± 0.64 a26.21 ± 4.12 a11.44 ± 0.91 d0.18 ± 0.02 bc
HFR2546.46 ± 8.79 ab11.89 ± 3.56 bc12.63 ± 1.60 a22.01 ± 3.02 ab13.60 ± 0.41 cd0.15 ± 0.02 c
WFR5045.50 ± 20.80 b12.15 ± 5.48 bc14.50 ± 1.60 a21.42 ± 4.50 ab14.16 ± 2.20 cd0.15 ± 0.01 c
WFR2514.03 ± 3.36 d3.63 ± 0.82 de8.50 ± 1.69 b7.99 ± 2.34 cd18.16 ± 1.01 a0.20 ± 0.03 ab
SMR5023.46 ± 7.75 cd6.18 ± 2.20 cde12.75 ± 2.82 a14.17 ± 5.36 bc16.38 ± 0.95 abc0.18 ± 0.02 bc
SMR2514.57 ± 2.76 d3.40 ± 0.94 de8.13 ± 0.99 b8.02 ± 2.60 cd17.56 ± 1.45 ab0.24 ± 0.03 a
S10068.42 ± 12.98 ab15.40 ± 1.70 ab14.75 ± 1.28 a29.73 ± 5.22 a14.47 ± 1.63 bcd0.19 ± 0.02 bc
S5036.98 ± 5.32 bc8.89 ± 1.40 cd12.38 ± 2.26 a22.01 ± 1.72 ab16.69 ± 0.60 abc0.17 ± 0.01 bc
S0 *1.24 ± 0.16 e0.43 ± 0.04 e3.00 ± 0.53 c0.51 ± 0.13 d19.99 ± 2.87 a0.28 ± 0.12 NA
* Plants were too small in S0 to rely on the data for root-to-shoot ratio, so it was not part of the statistical analysis (NA = not applicable). Differences are indicated by different lower-case letters (Tukey’s HSD-Test, p < 0.05, mean ± standard deviation, n = 4, for height and number of leaves n = 8, for DM content in leaves Fisher’s LSD-Test, p < 0.05, mean ± standard deviation, n = 4).
Table 7. Total nutrient content per plant and the estimated relative nutrient uptake in Ethiopian kale that was cultivated in different growing media residues for 64 days.
NPKCaMgS
Nutrient [g plant−1 DM]
HFR500.41 ± 0.06 a0.11 ± 0.02 a0.74 ± 0.09 a0.25 ± 0.06 bc0.13 ± 0.02 a0.23 ± 0.03 a
HFR250.24 ± 0.03 bc0.07 ± 0.01 b0.46 ± 0.12 b0.21 ± 0.04 bcd0.08 ± 0.02 b0.15 ± 0.02 bc
WFR500.17 ± 0.05 cd0.06 ± 0.01 bc0.36 ± 0.09 bc0.23 ± 0.06 bcd0.05 ± 0.01 b0.13 ± 0.03 cd
WFR250.06 ± 0.02 e0.03 ± 0.01 d0.14 ± 0.04 c0.12 ± 0.03 d0.02 ± 0.01 c0.06 ± 0.01 e
SMR500.10 ± 0.05 cd0.04 ± 0.01 cd0.24 ± 0.11 bc0.17 ± 0.06 bcd0.03 ± 0.01 c0.08 ± 0.03 de
SMR250.06 ± 0.02 e0.03 ± 0.01 d0.13 ± 0.05 c0.13 ± 0.05 cd0.02 ± 0.01 c0.06 ± 0.02 e
S1000.33 ± 0.03 ab0.07 ± 0.01 b0.71 ± 0.10 a0.44 ± 0.03 a0.07 ± 0.01 b0.22 ± 0.02 ab
S500.17 ± 0.02 cd0.04 ± 0.01 bcd0.40 ± 0.06 b0.30 ± 0.02 b0.04 ± 0.01 c0.13 ± 0.02 cd
Proportion of nutrients taken up from the plant from given nutrients in the pot [%]
HFR509.5% ± 1.3% c0.3% ± 0.0% c16.0% ± 2.0% a0.4% ± 0.1% e3.8% ± 0.6% a8.3% ± 1.1% c
HFR2510.6% ± 1.2% c0.3% ± 0.0% c11.7% ± 3.0% ab0.6% ± 0.1% de2.9% ± 0.6% ab10.6% ± 1.5% c
WFR5015.6% ± 4.6% c2.1% ± 0.4% c8.5% ± 2.0% abc2.8% ± 0.7% c1.9% ± 0.5% bc13.7% ± 3.1% c
WFR259.2% ± 3.0% c1.7% ± 0.5% c3.8% ± 1.1% cd1.8% ± 0.4% cde1.0% ± 0.2% de9.5% ± 2.0% c
SMR5011.5% ± 5.5% c2.8% ± 1.0% c5.8% ± 2.6% bcd2.5% ± 0.9% c1.3% ± 0.5% cde14.3% ± 5.0% c
SMR2510.3% ± 3.5% c3.2% ± 1.1% c3.5% ± 1.3% cd2.3% ± 0.9% cd0.9% ± 0.3% e15.4% ± 4.2% c
S10051.0% ± 4.6% a17.8% ± 2.4% a17.7% ± 2.5% a8.8% ± 0.6% a3.5% ± 0.3% ab67.2% ± 5.2% a
S5038.4% ± 3.9% b14.3% ± 1.8% b11.0% ± 1.6% ab6.2% ± 0.4% b1.9% ± 0.3% bcd51.7% ± 5.9% b
Differences are indicated by different lower-case letters (Tukey’s HSD-Test, p < 0.05, mean ± standard deviation, n = 3).
Table 8. The potential savings of nutrients [kg ha−1] and the associated energy savings [MJ ha−1] as well as CO2 eq [kg ha−1] that is caused by the reuse of growing media residues as fertilizer for different crops.
CropResidueReused Organo-Mineral ResidueNPKCaMgSTotal Energy Savings to Produce N, P, K, Ca, Mg, and STotal CO2 Emission Savings Caused by the Production of N, P, K, Ca, Mg, and S
kg ha−1Savings of Nutrients kg ha−1MJ ha−1CO2 eq ha−1
Ethiopian kaleHFR340.414.200.145.800.130.2590.416.28
WFR2191.444.201.645.730.631.29166.6614.75
SMR2692.264.203.208.371.861.48243.2122.43
CornHFR2783.2933.911.1146.861.062.03730.0250.67
WFR176611.6633.9113.2546.285.1210.421345.62119.07
SMR217418.2633.9125.8767.6115.0011.961963.77181.13
Sugar beetHFR4875.7559.321.9581.971.853.561276.9888.63
WFR309020.3959.3223.1780.958.9618.232353.81208.28
SMR380331.9459.3245.25118.2626.2420.913435.10316.84
OnionHFR1271.5015.490.5121.400.480.93320.4623.14
WFR8075.3215.496.0521.132.344.76548.3354.37
SMR9938.3415.4911.8130.876.855.46771.3782.71
White cabbageHFR1982.3324.060.7933.250.751.44495.2735.95
WFR12538.2724.069.4032.833.637.39838.3684.48
SMR154212.9624.0618.3647.9710.648.481172.71128.52
Calculated based on the application rate per ha limited by the expected withdrawal of P by the respective crop per ha [22,23,24]. Saving potential of energy and CO2 equivalent, calculated according to the results of Skowrońska and Filipek [25] for N, P, K, and Ca, and Umweltbundesamt [26] for Mg and S.
Publisher’s Note: MDPI stays neutral with regard to jurisdictional claims in published maps and institutional affiliations.

