Article

Supervised Machine Learning Algorithms to Predict Provenance of Archaeological Pottery Fragments

1
Department of Geology, Campus de la UAB, Autonomous University of Barcelona, 08193 Barcelona, Spain
2
Department of Geosciences, IDAEA-CSIC, Jordi Girona 18-26, 08034 Barcelona, Spain
*
Author to whom correspondence should be addressed.
Sustainability 2022, 14(18), 11214; https://doi.org/10.3390/su141811214
Submission received: 31 July 2022 / Revised: 30 August 2022 / Accepted: 5 September 2022 / Published: 7 September 2022
(This article belongs to the Special Issue Archaeology of Sustainability and Sustainable Archaeology)

Abstract

:
Code and data sharing are crucial practices to advance toward sustainable archaeology. This article explores the performance of supervised machine learning classification methods for provenancing archaeological pottery through the use of freeware R code in the form of R Markdown files. An illustrative example was used to show all the steps of the new methodology, starting from the requirements to its implementation, the verification of its classification capability and finally, the production of cluster predictions. The example confirms that supervised methods are able to distinguish classes with similar features, and provenancing is achievable. The provided code contains self-explanatory notes to guide the users through the classification algorithms. Archaeometrists without previous knowledge of R should be able to apply the novel methodology to similar well-constrained classification problems. Experienced users could fully exploit the code to set up different combinations of parameters, and they could further develop it by adding other classification algorithms to suit the requirements of diverse classification strategies.

1. Introduction

Pottery shards are possibly the most common artifacts among archaeological finds. These ceramic fragments can bring many types of information; among others, production technology [1,2], age [3] or evidence for cultural interactions through the identification of local and imported productions in the archaeological sites. In fact, one of the main branches of archaeometry regards the physical and geochemical analyses applied to provenance studies, mainly on pottery artifacts. The progressive increase in novel analytical techniques and approaches, along with digital methods and tools, has been argued to provoke a sustainability crisis due to the exponential growth of data. The generation of huge amounts of data is currently inherent to many other areas of present human activity, and its unsustainability would not be considered problematic per se. However, sustainability, as it applies to archaeology, can be understood in many different ways [4], and possibly the economic dimension of sustainability [5] is the one that should be particularly taken into account. In this sense, sustainable archaeology should promote the standardization of retrieved data, data sharing, open data and data recycling to minimize the number of required analyses to carry out an investigation.
The crucial step in provenance studies is the definition of reference groups, and this requires reference samples that only rarely are used by different authors. The typical approach is to use petrographical [6,7,8] and particularly chemical [9,10,11,12] analyses or a combination of both [13,14,15,16] to serve isolated research or, in some cases, multiple investigations directed by a given research group. Chemical data, commonly obtained using X-ray fluorescence (XRF) or neutron activation analysis (NAA), often consist of large datasets and imply lots of measurements. Their processing is usually addressed by the application of statistical methods. The most common approach is the use of principal component analysis (PCA), hierarchical cluster analysis (HCA) and other unsupervised clustering methods [17,18,19]. These unsupervised methods are also occasionally used to process other kinds of analytical data, such as X-ray diffraction [20], infrared spectroscopic data [21], shard shapes or profiles [22] or even visible colors [23] also with the goal of differentiating ceramics having different provenance or production technologies.
By using unsupervised clustering methods, the data are not labeled before classification. Without labeling, it is basically assumed that the different groups or classes emerge naturally because the algorithms find the most useful variables to highlight differences between data. Usually, in every analyzed consumption center, different classes are identified based on the relative distances or similarities between data [24,25]. Analyses on different sites, including production centers, enable inferring inter-site connections and, ultimately, assigning provenance to most of the identified classes [14,26]. In addition to the characterization of pottery sampled at the production centers [27], reference groups are often also defined using kiln wasters [28,29], ceramic analogous materials [30,31] produced from clays fired under controlled conditions or even simply the presumably used clay deposits [32,33]. However, the most frequently used unsupervised method (PCA) is not strictly a classification method [34]. Unsupervised methods can easily fail to discriminate classes corresponding to provenance sites sharing similar features.
In contrast to unsupervised methods, supervised methods deal with data previously labeled with their corresponding class (i.e., the provenance of the reference samples is known). The models learn from a given training dataset, and after optimization of the model parameters, the model is tested with new labeled data. The best performing predictive model can be selected by looking at their ability to predict class memberships for these new data. This approach was recently tested on geochemical data from clays and modern baked clays from six local production centers of pottery [35]. Despite the geographical proximity and the common or similar geological contexts, the supervised approach proved to successfully classify the data with an accuracy above 80%. This high capability of inter-site discrimination has opened the door to applying supervised machine learning methods in archaeology and specifically within the field of pottery provenance studies. Predictive modeling using supervised methods is still largely an underexploited field within archaeology [36,37].
The use of machine learning applications in the field of archaeology is growing fast, in part due to the increasing accessibility and capability of the algorithms [38]. Its applications are expected to diversify and improve, gaining in usability and performance [37], covering vast areas of archaeology. Supervised machine and, in particular, deep learning (specifically deep convolutional neural network (CNN)) is commonly used to analyze images and recognize patterns. CNN was successfully applied in remote sensing applications within archaeological prospection [39] as well as artifact classification by site and period [40]. Classification of pottery fragments based on images was also explored [41], in particular for reconstruction purposes. The assembly criterion is often the matching between the shape of the fragments [42], and some sophisticated approaches even consider an imperfect matching due to erosion [43]. Alternatively, the classification criterion can be other than morphology; for instance, in [44], the pottery is classified according to its engravings. Non-ceramic archaeological items can also be classified using supervised methods, for instance, bone surface modifications [45]. However, archaeological machine learning contributions that do not deal with input images are not so commonly found, and in the particular field of provenance studies, these are rather scarce. Some pioneering works treated geochemical data using these methods to classify archaeological soils [46], clays [47], obsidians [48] and pottery [49]. Rare applications based on analytical data beyond elemental geochemistry can also be found, for example, gemstone provenance based on Raman data [50] or pottery provenance based on ultrasound data [51].
This paper illustrates the use of supervised modeling for provenancing archaeological pottery using chemical analyses. A chemical dataset from previous work [35] with data from six nearby production centers was used and extended to an additional reference site representing the archaeological pottery produced in Barcelona (Catalonia, NE, Spain). After the training and optimization of a supervised discrimination models, the models were used to infer the provenance of several pottery samples retrieved from archaeological sites in Catalonia. Additionally, the models could potentially be applied to a large number of archaeological sites reported in this region. The presented approach is made available as an R-based code, including easy-to-read instructions to install and use.
The primary goal of this study was to evaluate the performance of supervised classification methods in those cases where the common unsupervised approach fails. Additionally, a secondary goal was to help the archaeological community easily implement the supervised clustering algorithms for provenancing pottery as a way to move a step forward from the common unsupervised practices.

2. Materials and Methods

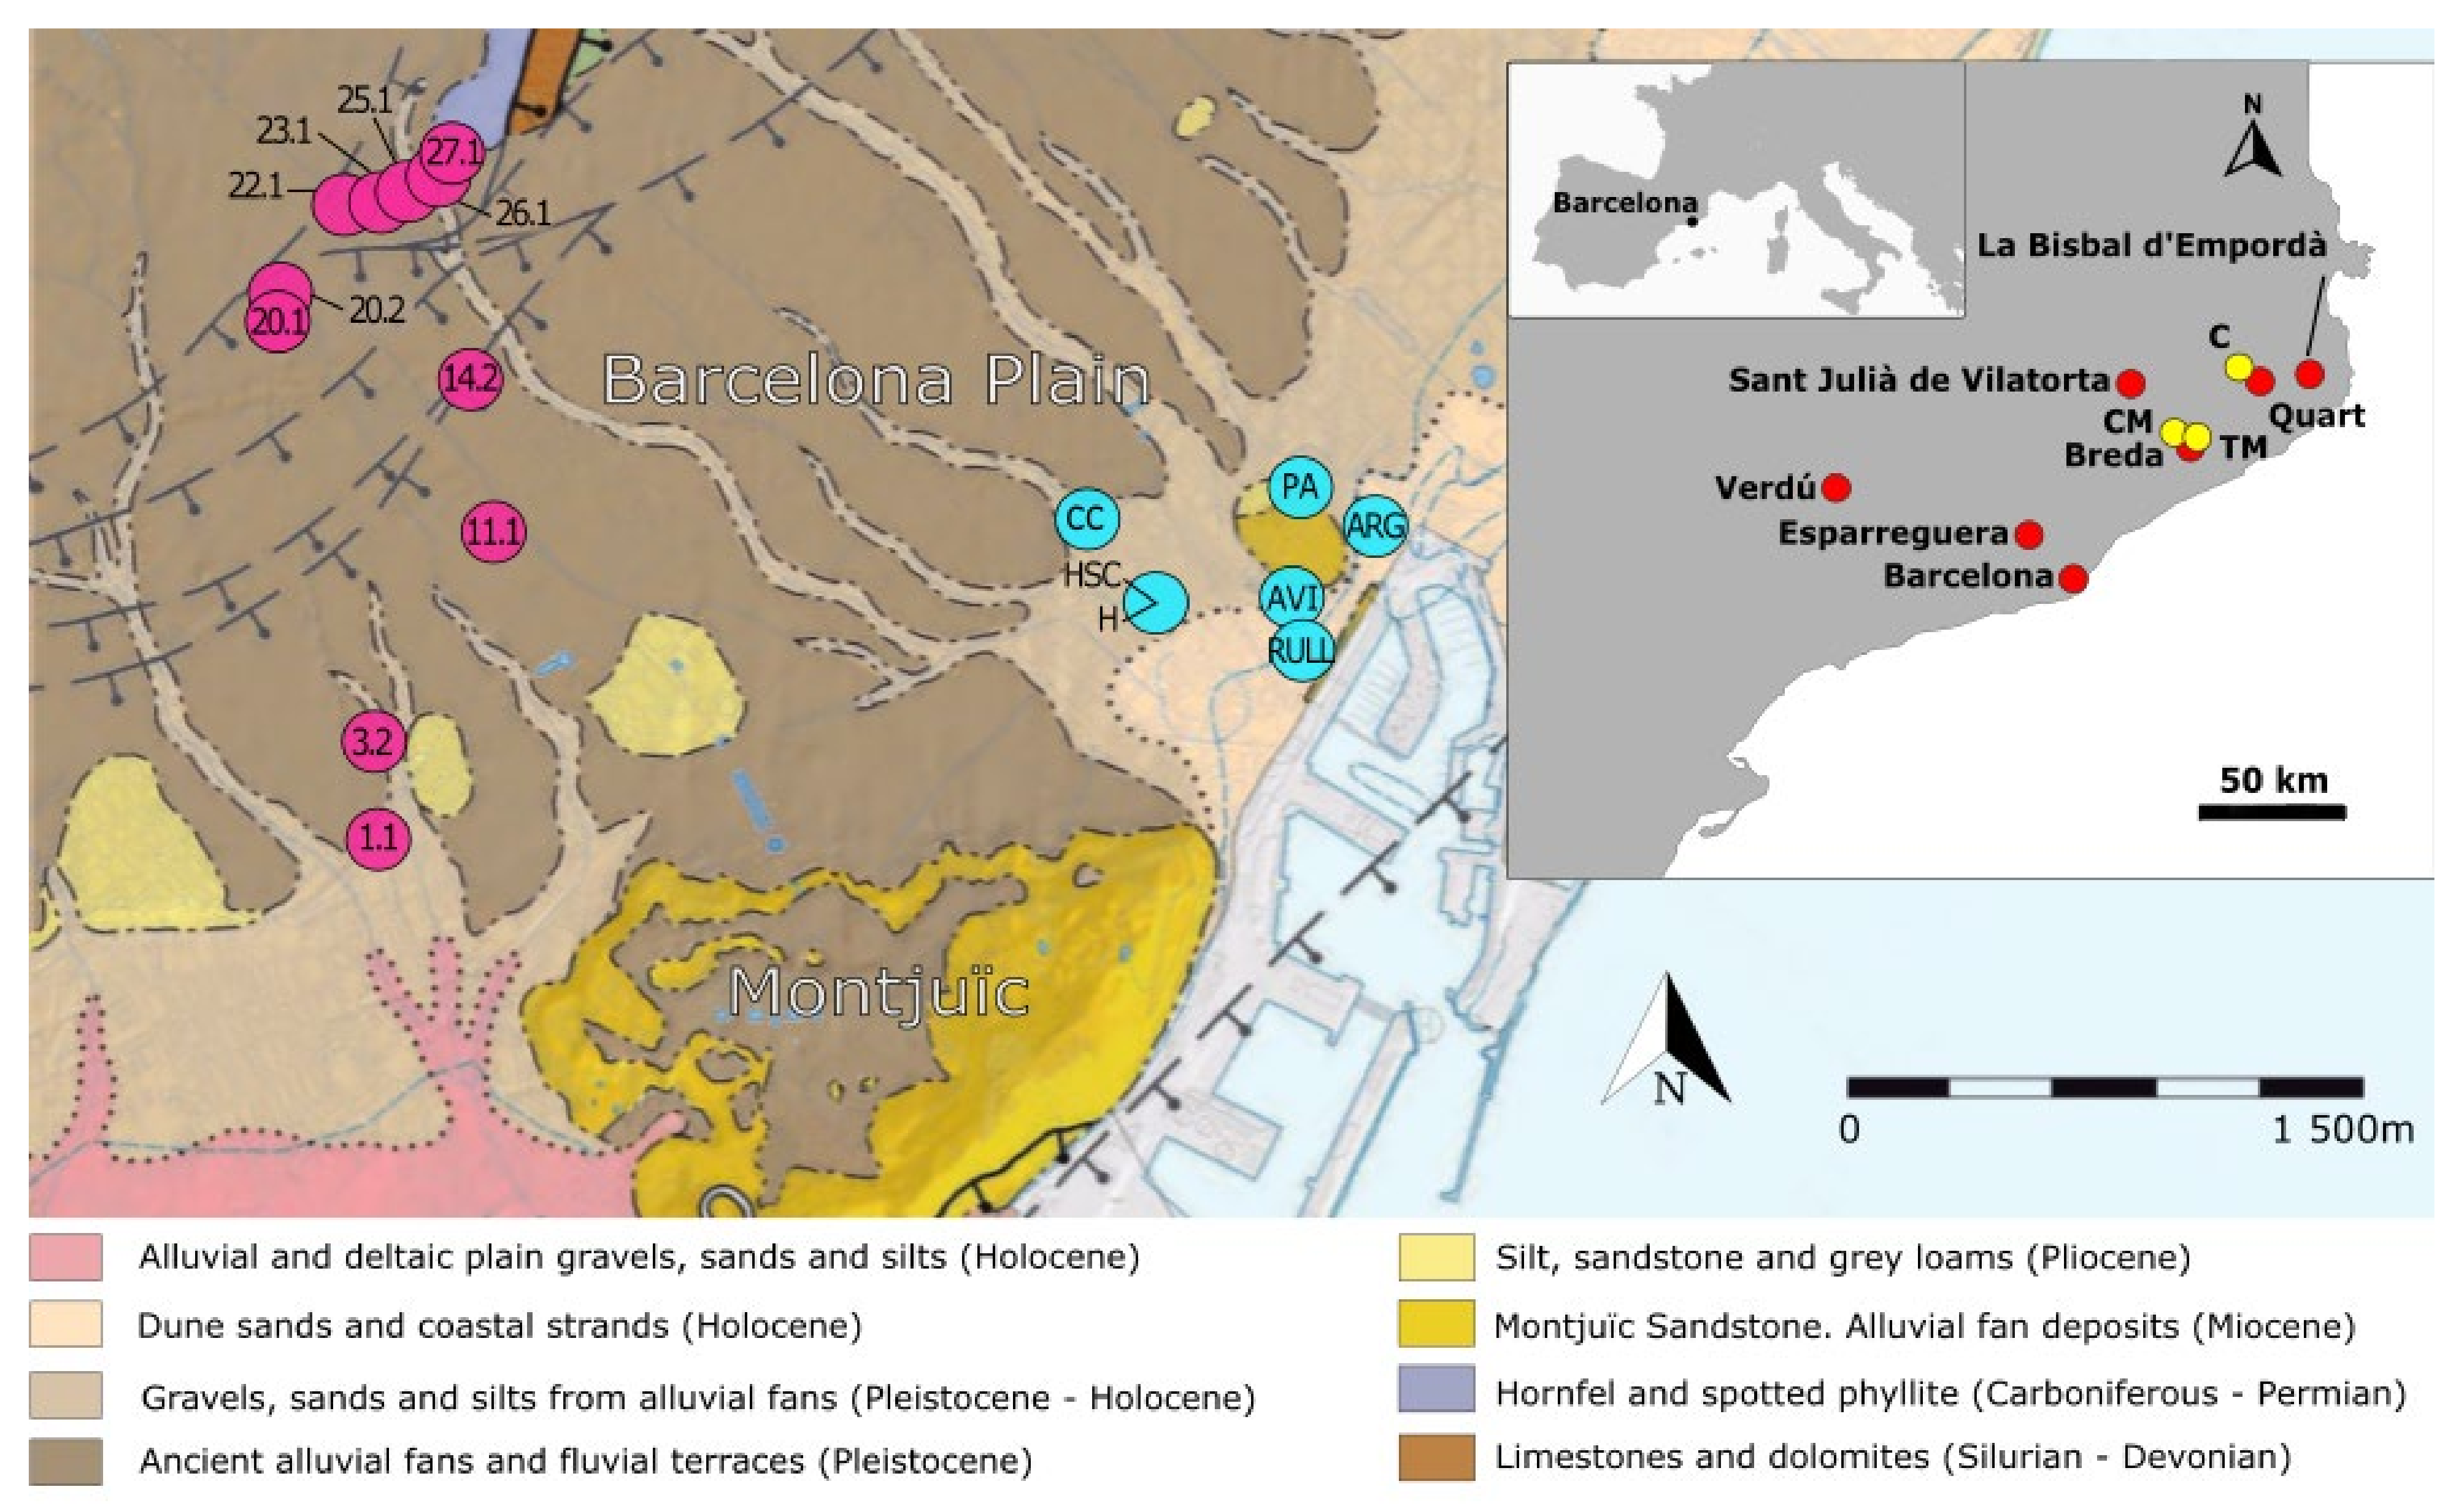
2.1. Reference Sampled Materials and Geochemical Data

A previously published geochemical database (see Supplementary Materials within [35]) was used in the present study. The data were produced by Energy Dispersive X-ray fluorescence (EDXRF) analyses on 208 samples. These samples were clays (80 samples), pottery shards (101 samples) and ceramic briquettes produced in an oven (27 samples). They belong to six traditional pottery production centers relatively close to Barcelona (Figure 1):
  • Esparreguera (~35 km northwest of Barcelona);
  • Breda (~50 km northeast of Barcelona);
  • Sant Julià de Vilatorta (~60 km north from Barcelona);
  • Quart (~80 km northeast of Barcelona);
  • Verdú (~90 km northwest of Barcelona);
  • La Bisbal d’Empordà (~100 km northeast of Barcelona).
These data can be labeled to their corresponding provenance class because the samples were directly extracted from their clay outcrops (clays and briquettes) or because they were known to have been produced from the corresponding local clays (pottery shards). To these six reference centers, an additional set of samples was also chemically characterized to add an extra class corresponding to the main center of the area, i.e., Barcelona itself. Since the foundation of the Crown of Aragon (12th century), Barcelona acted as the preeminent city in NE Iberia, and among many other activities, pottery production remains vastly attested from the 13th century onwards in many archaeological sites excavated in the city [52].
The extra reference dataset corresponding to Barcelona was produced by analyzing 84 samples comprising 64 archaeological samples and 20 clay samples (Figure 1). The archaeological samples were pottery shards from 7 archaeological sites (Table 1, for detailed data, see Table S1 within the Supplementary Materials). The sites cover a large time range (13th–19th centuries), and the shards were carefully selected from those constituting local productions and covering a wide range of typologies and techniques (non-glazed, glazed and glazed, including decoration). Concerning clays, as the Barcelona plain has been heavily urbanized, there is no trace of old clay pits. The 20 clay samples were extracted from eleven borehole cores drilled as part of geotechnical surveys on the Barcelona plain (Figure 1). The sampled clays were located at different depths (3 to 45 m, see Table S1 within the Supplementary Materials for detailed data), and they were selected as representative of the raw materials that could be used to produce pottery. Despite not corresponding to quarried clay pits, the sampled clays belong to levels that would have outcropped in places closer to the sea.
Similar to the other reference sites [35], the pottery samples from Barcelona [53,54,55,56,57,58,59] appear to be petrographically heterogeneous, particularly in terms of grain size and inclusions/matrix ratio. However, as a general trend, the samples tend to be fine-grained, mainly including quartz, feldspar and metamorphic (phyllite and mica schist) inclusions. The petrographic heterogeneity reinforces the need to prioritize a geochemical approach to define the reference groups.
In order to obtain the geochemical composition, exactly as in other reference samples [35], both the clay and pottery samples from Barcelona were dried and ground using a laboratory mill (Pulverissette™, Fritsch GmbH, Idar-Oberstein, Germany) to pass a 125 µm mesh. The powders were then prepared in the form of pressed powder pellets using a methyl methacrylate resin as a binding agent (Elvacite™ commercial resin) under a pressure of 10 T. The composition of the pellets was measured by Energy Dispersive X-ray fluorescence (EDXRF) into an S2 Ranger system (Bruker/AXS, GmbH, Karlsruhe, Germany). The raw data were fitted using the SPECTRA.EDX package (Bruker AXS, GmbH, Karlsruhe, Germany). Quantification was made by the assisted fundamental parameters method. Analyses were made in a vacuum atmosphere for better detection of low Z elements and using different conditions of voltage to properly excite low, medium and high atomic number elements existing in the samples; the measuring time was set at 400 s.
With the extra samples from Barcelona, the full geochemical database comprises the elemental analyses of 292 samples. These are class-labeled samples for a total of seven classes or reference groups.

2.2. Archaeological Samples of Unknown Provenience

Five sets of pottery of unknown provenience were selected. They belong to three different archaeological sites and time periods. These unlabeled samples were chosen because they were retrieved from sites that lie in the vicinity of one of the reference groups, and the archaeologists that worked on them defined their production as local. Here, “local” means that the pottery was not imported from overseas or distant sites but produced near the archaeological site where it was found. Therefore, “local” here would include any of our seven reference groups and actually many other possible local workshops.
Three sets of samples were retrieved from the Montsoriu castle, an important gothic castle (10th–14th centuries) that is located on top of the homonymous hill, only ~4 km north of Breda, one of our labeled reference groups. By the end of the 20th century, the castle was an abandoned ruin, and it is currently in the process of restoration. From the several archaeological excavations on the site in 2007, the excavation of the filling of a cistern from the castle’s bailey produced many types of pottery, both imported and local [60]. Among the local pottery, there are common table and cooking ware, both glazed and non-glazed. Glazes are usually transparent (simple lead glazes) or green-colored. Pastes can be both reddish/ochre (oxidizing conditions) or grey (fired in reducing conditions). The ensemble of local pottery is dated between 1475 and 1560 [60] and despite some resemblance with later productions from Breda, it is often assumed that this pottery, in particular the green-colored glazed pottery, was produced in Barcelona’s workshops [61]. The three types of pottery from Montsoriu selected for the present investigation correspond (Table 2) to non-glazed grey pottery (7 shards), ochre-reddish pottery with a lead-glaze (10 shards), and a green-glaze (6 shards).
Another set of studied samples was recovered from the Torre de la Mora site, a Roman watchtower that was reused during the Middle Ages. The tower, completely ruined at present, rose on top of a hill, also very close to Breda (~2 km northeast of it). Archaeological works undertaken in 1998–1999 produced Iberian and Early Medieval common ware. The Iberian pottery would be decontextualized, possibly integrated within rammed earth as part of the foundations. The Medieval pottery would be, according to morphological criteria, from the late 9th to the early 10th centuries [62]; 7 shards of this Medieval pottery were selected for the present study (Table 2).
Finally, another selected set of samples came from La Creueta. This is a prehistoric (Iberian) settlement that locates on top of a hill in the southern area of Girona, only 3km north of the village of Quart, i.e., one of our labeled reference groups. The site was discovered in the thirties of the 20th century, and it was repeatedly excavated. Different types of pottery were retrieved from these excavation works, including Hellenistic and Punic imports and local wheel-made and hand-built pottery. From the typology of the identified pottery, the site is dated to the 4th century BCE [63]. The hand-built pottery would correspond to the most primitive type of pottery from the site, and it is more likely to truly represent local pottery. For this reason, 8 shards of this pottery typology were selected to take part in the present investigation (Table 2)
For detailed data of the analyzed samples of unknown provenience, see Table S2 within the Supplementary Materials. A basic petrographic and mineralogic characterization of the samples cut as thin sections was performed using a petrographic microscope (Eclipse E200, Nikon Instruments Inc., Tokyo, Japan). This was performed to check whether the samples share the same basic components as the reference samples or if any of them contain a particularly distinct mineralogical component. The chemical composition of all the shards from the five selected sets was obtained following exactly the same procedure described in Section 2.1.

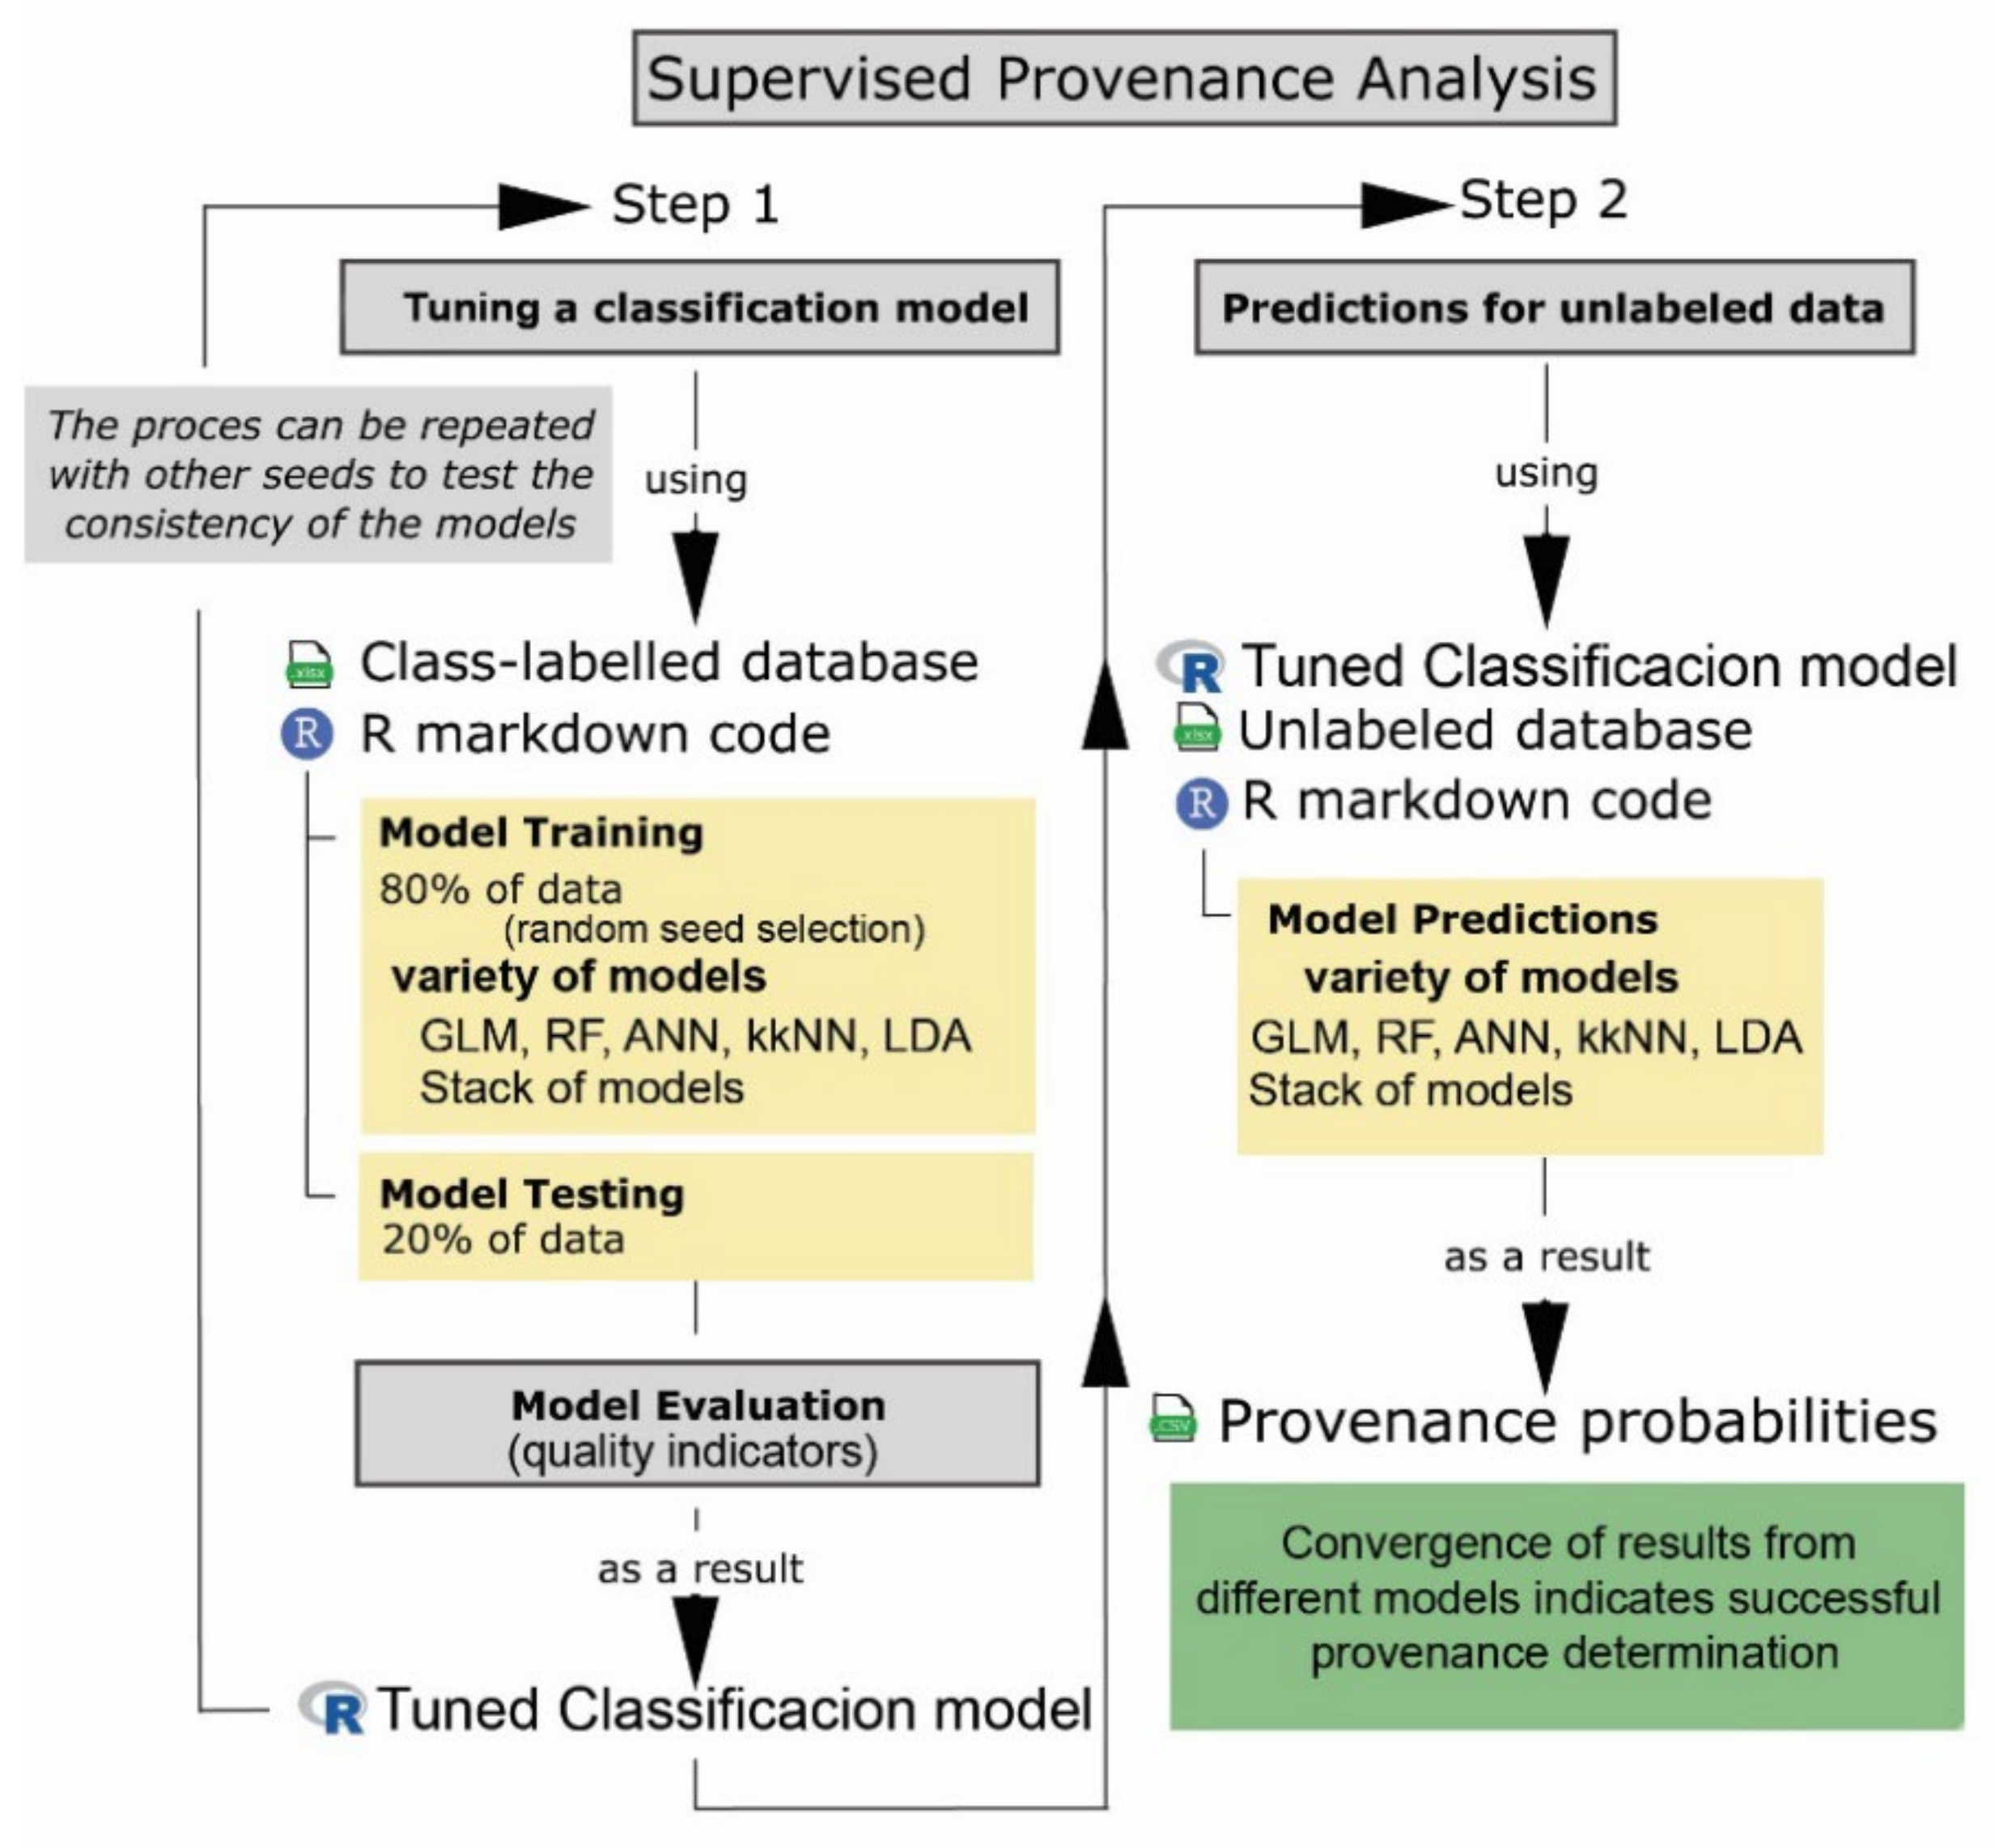
2.3. Data Processing, Modelling and Class Prediction

In order to apply scripts to optimize the classification models and to perform class predictions, it is necessary to use a homogeneous set of variables. Therefore, the pastes of all the samples (both class-labeled and unlabeled) must be characterized exactly by the same ensemble of geochemical elements. All the samples were characterized using the following elements: Al, Si, Fe, Na, Mg, Cl, K, Ti, Cr, Mn, Ni, Cu, Zn, Rb, Sr, Y, Zr, and Nb. These are elements that appear in the samples above their detection limit; Ca values were disregarded because their values are strongly correlated with Si; on the other hand, Pb was also removed from the database to avoid problems related to contamination from different sources (in particular from glazes).
By using the same set of elements, the common principal component analysis (PCA) was used to illustrate the inability of unsupervised learning to classify the unlabeled samples. PCA is a method that reduces the dimensionality of the original dataset by creating a new set of variables avoiding correlated variables. By using only a few of the new variables (the main components), it is possible to plot the distribution of the dataset, maximizing the separation between samples.
The supervised classification models that were trained to learn accurate class prediction of unlabeled data were:
  • Weighted k-nearest neighbors (kkNN); the samples are classified by taking into account the classes of their k-nearest neighbors;
  • Random forest (RF); the algorithm is based on a combination of multiple and uncorrelated decision trees operating as an ensemble;
  • Artificial neural network (ANN); this prognostic model uses an extensive network of nodes that exchange messages simulating the function of the human brain;
  • Linear discriminant analysis (LDA); similar to PCA, is a linear transformation used for dimensionality reduction, but LDA maximizes the separation between classes and not between individual samples;
  • Generalized linear models (GLM); this is a collection of regression models with the possibility to introduce a penalty term for the maximum likelihood (lambda) to move from a pure ridge model to a pure lasso model.
These models were chosen among the most widely used supervised learning algorithms [64,65,66]. They are substantially different approaches that exhibit low correlation. This ensures the effectiveness of stacking models as an additional classification approach that takes advantage of the strong points from each model. The stacking technique was implemented through a random forest approach. The performance of all these models, including the stack of models, was improved using the repeated k-fold cross-validation technique during the training step. All the models are made available through the R-based code downloadable from a GitHub repository as part of this article. The algorithms corresponding to these models can be obtained freely from the following packages in the Caret R library [67]: class (kkNN), randomForest (RF), nnet (ANN), lda (LDA), Glmnet (GLM). To make class predictions, the generic R function “predict” was used.

3. Results

A basic petrographic characterization reveals that all the archaeological samples from the five selected sets share the same main components: a ferric matrix characterized by silicate inclusions (quartz, feldspars, plagioclase and micas) and metamorphic rock fragments (mainly granitoid, phyllite and mica schist fragments). Some differences concern the state of oxidation that can change from well-oxidized (homogeneous red matrix for sets CM2 and CM3) to poorly oxidized (non-homogeneous dark-brown/grey matrix for the CM1 set), with all the other samples from other sets exhibiting matrixes with heterogenous and intermediate oxidation. Regarding the aplastic inclusions, these are very abundant and coarser for the samples of the C set (reaching sizes of 4 mm and with a dominance of sericited feldspars and biotite) and those of the TM set (with slightly smaller grain sizes). Inclusions are moderately abundant for CM2 and CM3 samples and scarce for the more fine-grained CM1 set (with a pre-eminence of quartz). The petrographic characteristics cannot be used to connect any of these samples of unknown provenience with the geochemical reference groups. In addition to grain size and mineral abundance, the mineralogical components are basically the same for the five sets of archaeological samples and also for the samples within the reference groups, which bear clay and baked-clay reference samples with heterogeneous petrographic traits but invariably with similar minerals and rock fragments. Therefore, there are no mineralogical reasons that could prevent undertaking a geochemical classification method. The results of both unsupervised and supervised approaches are presented below.

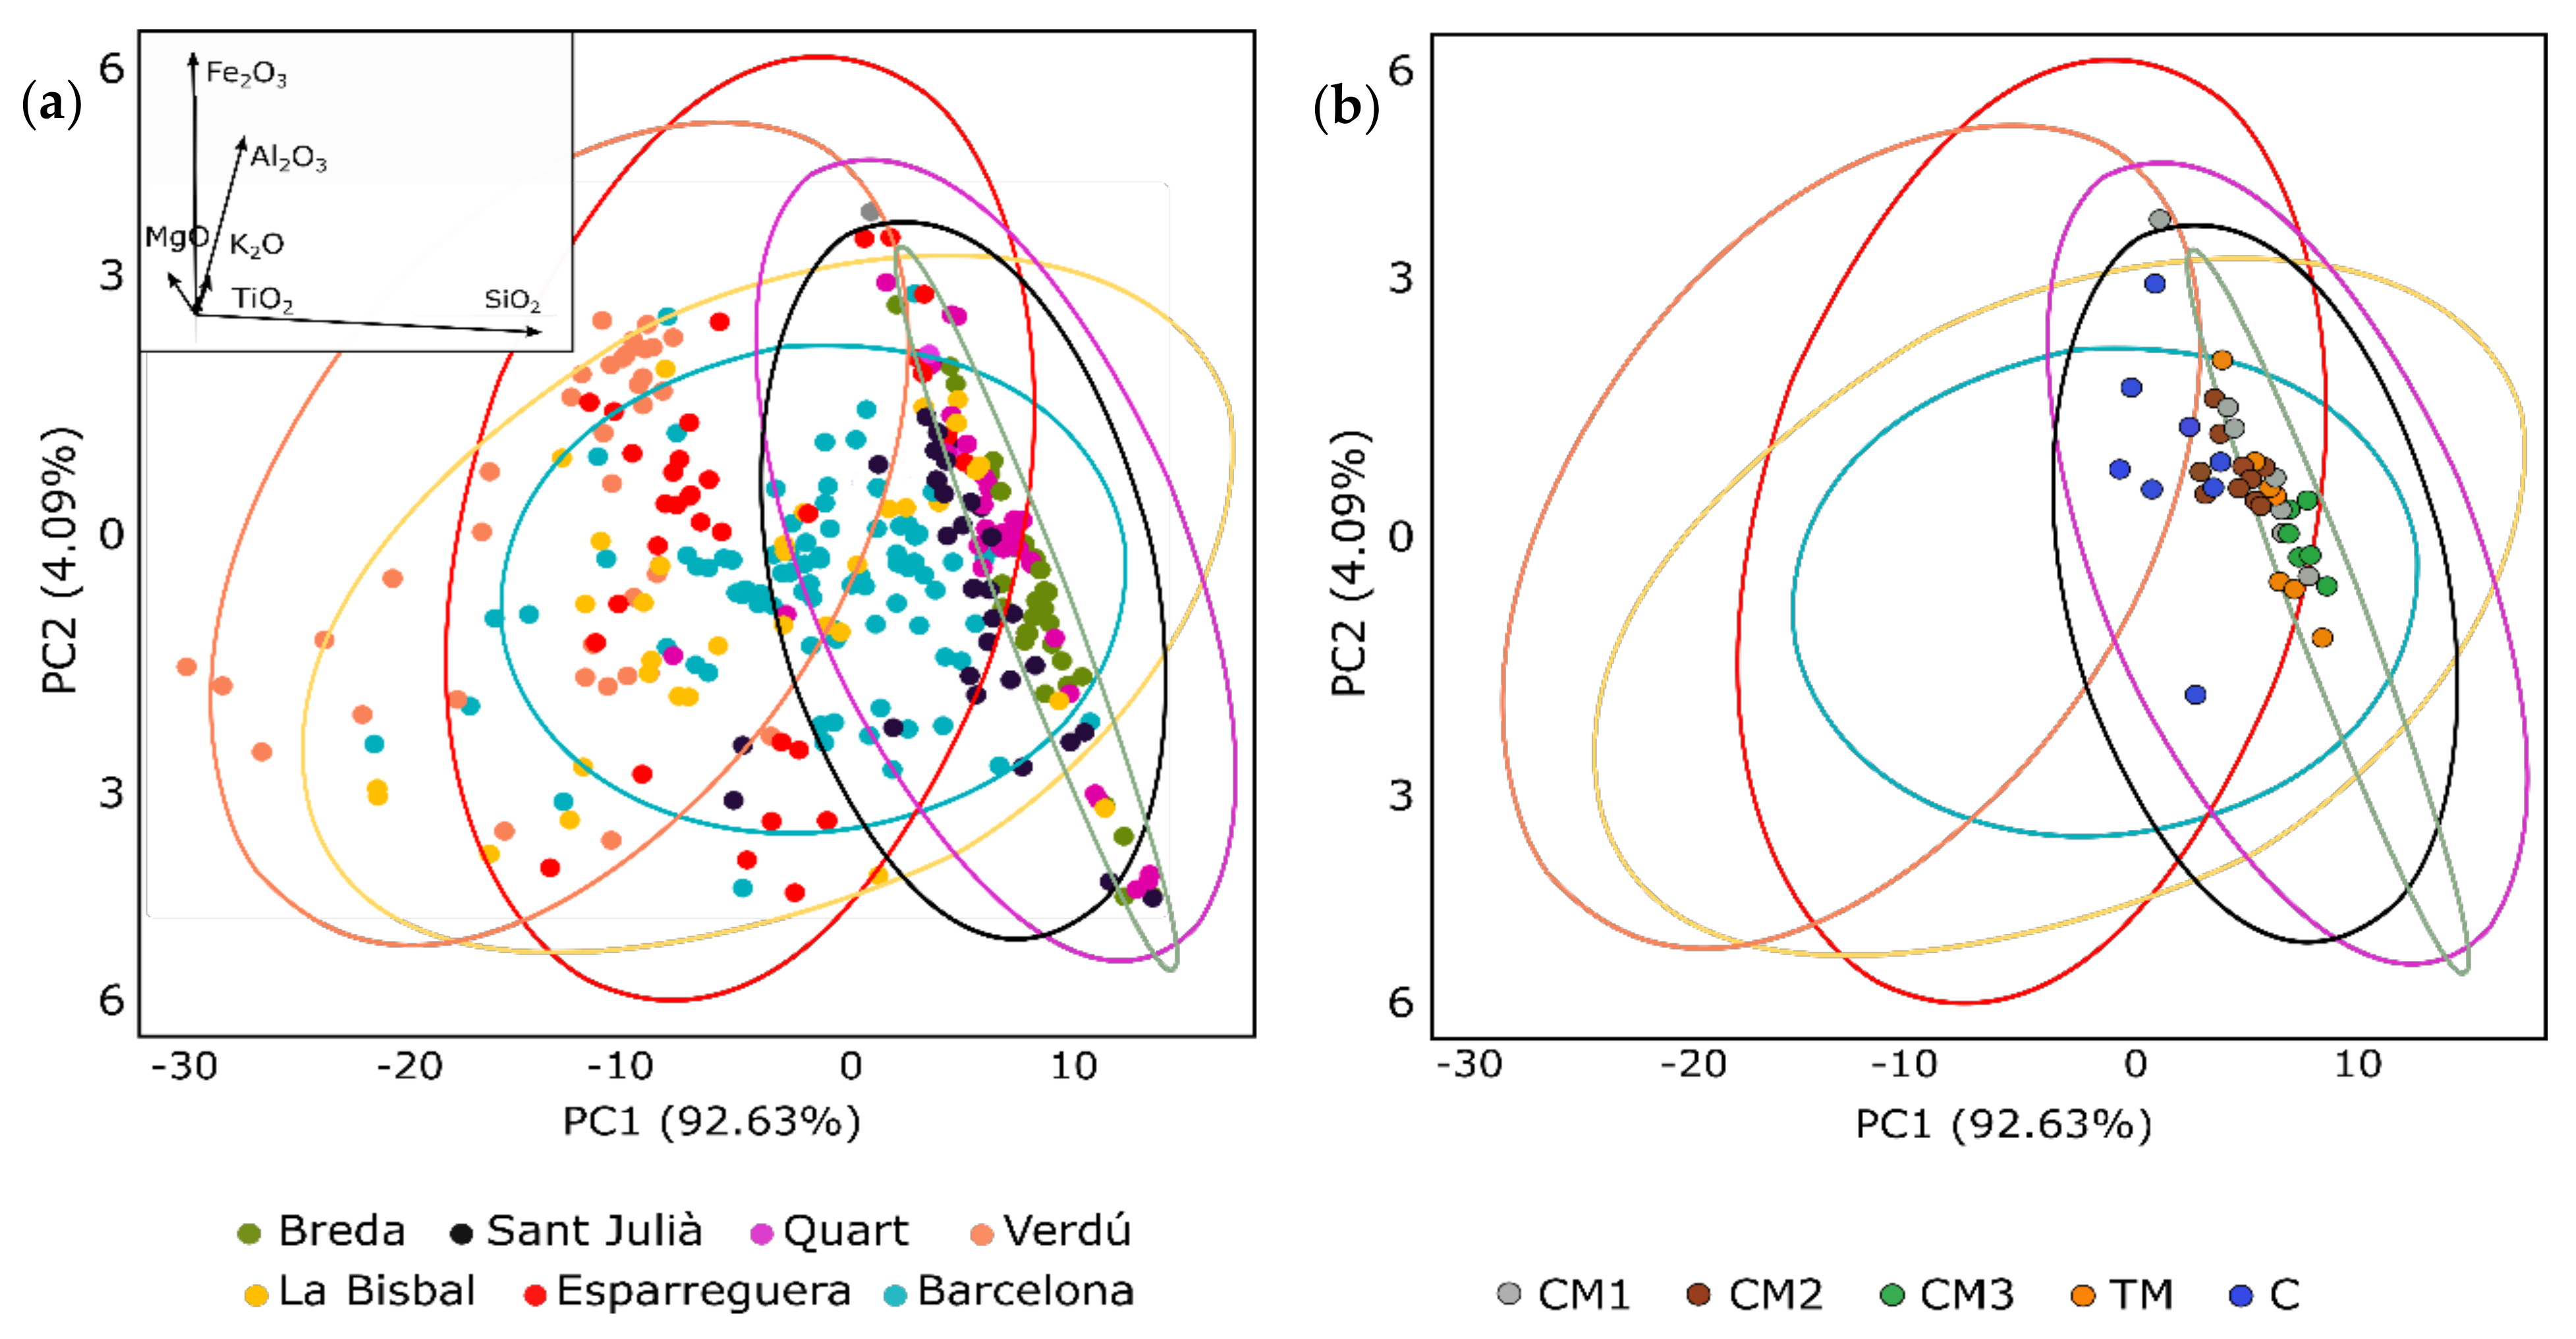
3.1. Unsupervised Approach

Several configurations of PCA were attempted (centered alone, centered and scaled, log-transformed, etc.) using all the reference samples (208 from [35] and 84 to account for a new set representing Barcelona’s class). In all the tested configurations, the data appear distributed in a cloud where the samples from different reference sites appear completely intermixed. This overlapping is not surprising due to the similarity between the different reference sites. The use of non-scaled data produces a PCA with data from several groups distributed along a straight line (Figure 2a). The 95% confidence ellipses for every class were also drawn in the figure. Comparing these PCA results with a previously computed PCA (Figure 4 in [35], it was apparent that the main components were almost unaffected by the addition of the new set of samples from Barcelona. PC1 (basically SiO2) copes almost 93% of the variance, and PC2 (which correlates strongly with the Fe2O3 contents and Al2O3) around 4% of it.
The samples from three reference sites (Breda, Sant Julià de Vilatorta and Quart) are those that overlap and distribute along a straight line indicating a strong correlation between PC1 and PC2. However, the corresponding confidence ellipse is only very narrow for the Breda samples. A few outliers from Sant Julià and Quart cause wider confidence ellipses for these two reference sites. The rest of the samples from the other reference sites appear much more scattered, and the corresponding ellipses cover higher areas and appear with a very high degree of overlapping. In particular, the ellipse for the new class representing Barcelona appears completely enclosed within the ellipse representing La Bisbal, but there is actually a certain degree of overlapping with all the other ellipses. In fact, the only two ellipses with almost zero mutual overlapping are those representing Breda (high SiO2 content) and Verdú (low SiO2 content).
The position of the samples of unknown provenience within the PCA biplot is shown in Figure 2b, along with the confidence ellipses of the reference groups. It appears that the gray (CM1) and the green glazed (CM3) pottery samples from the Castell de Montsoriu, as well as those from Torre de la Mora (TM), appear in the position that defines the characteristic alignment of samples observed for Breda, Sant Julià and Quart. The lead-glazed samples from Castell de Montsoriu (CM2) appear in a similar position but do not clearly define an alignment; finally, the samples from La Creueta (C) appear a bit more scattered. In any case, the PCA biplot cannot be used to connect unambiguously any set of samples to a particular reference group. Reversely, only the CM1 and C sets appear rather disassociated from a reference site (Verdú and Breda, respectively).

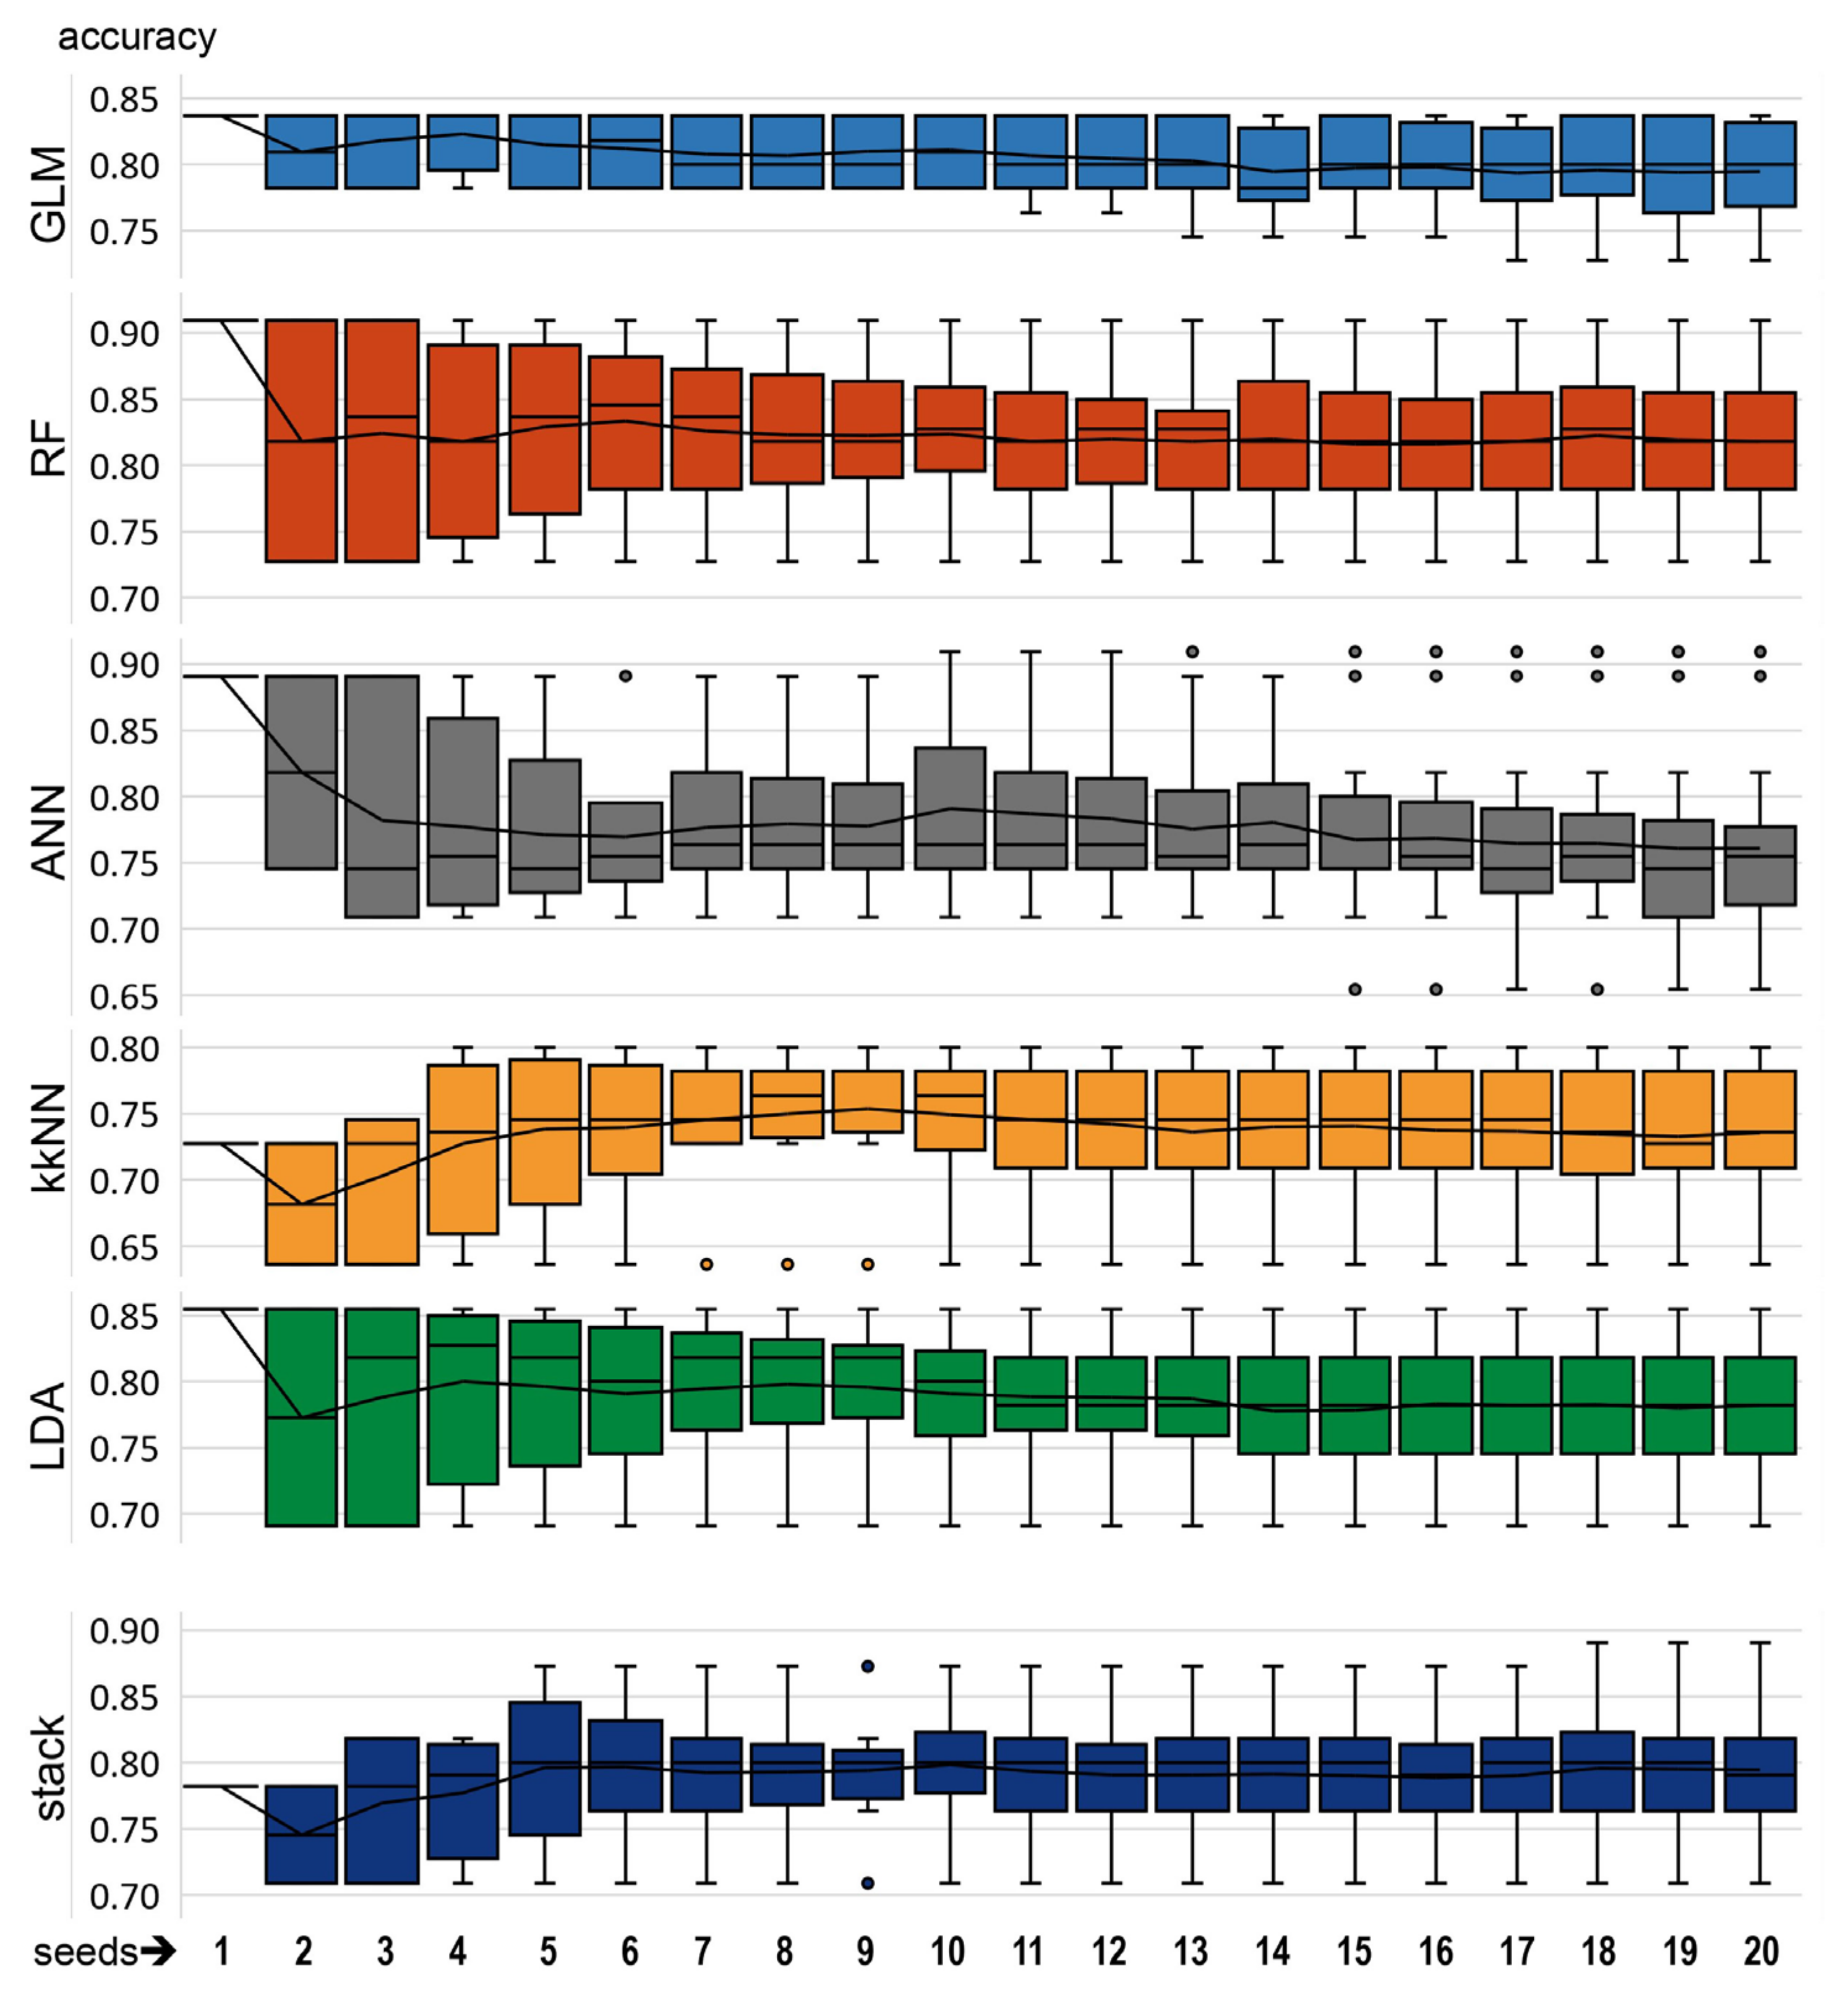
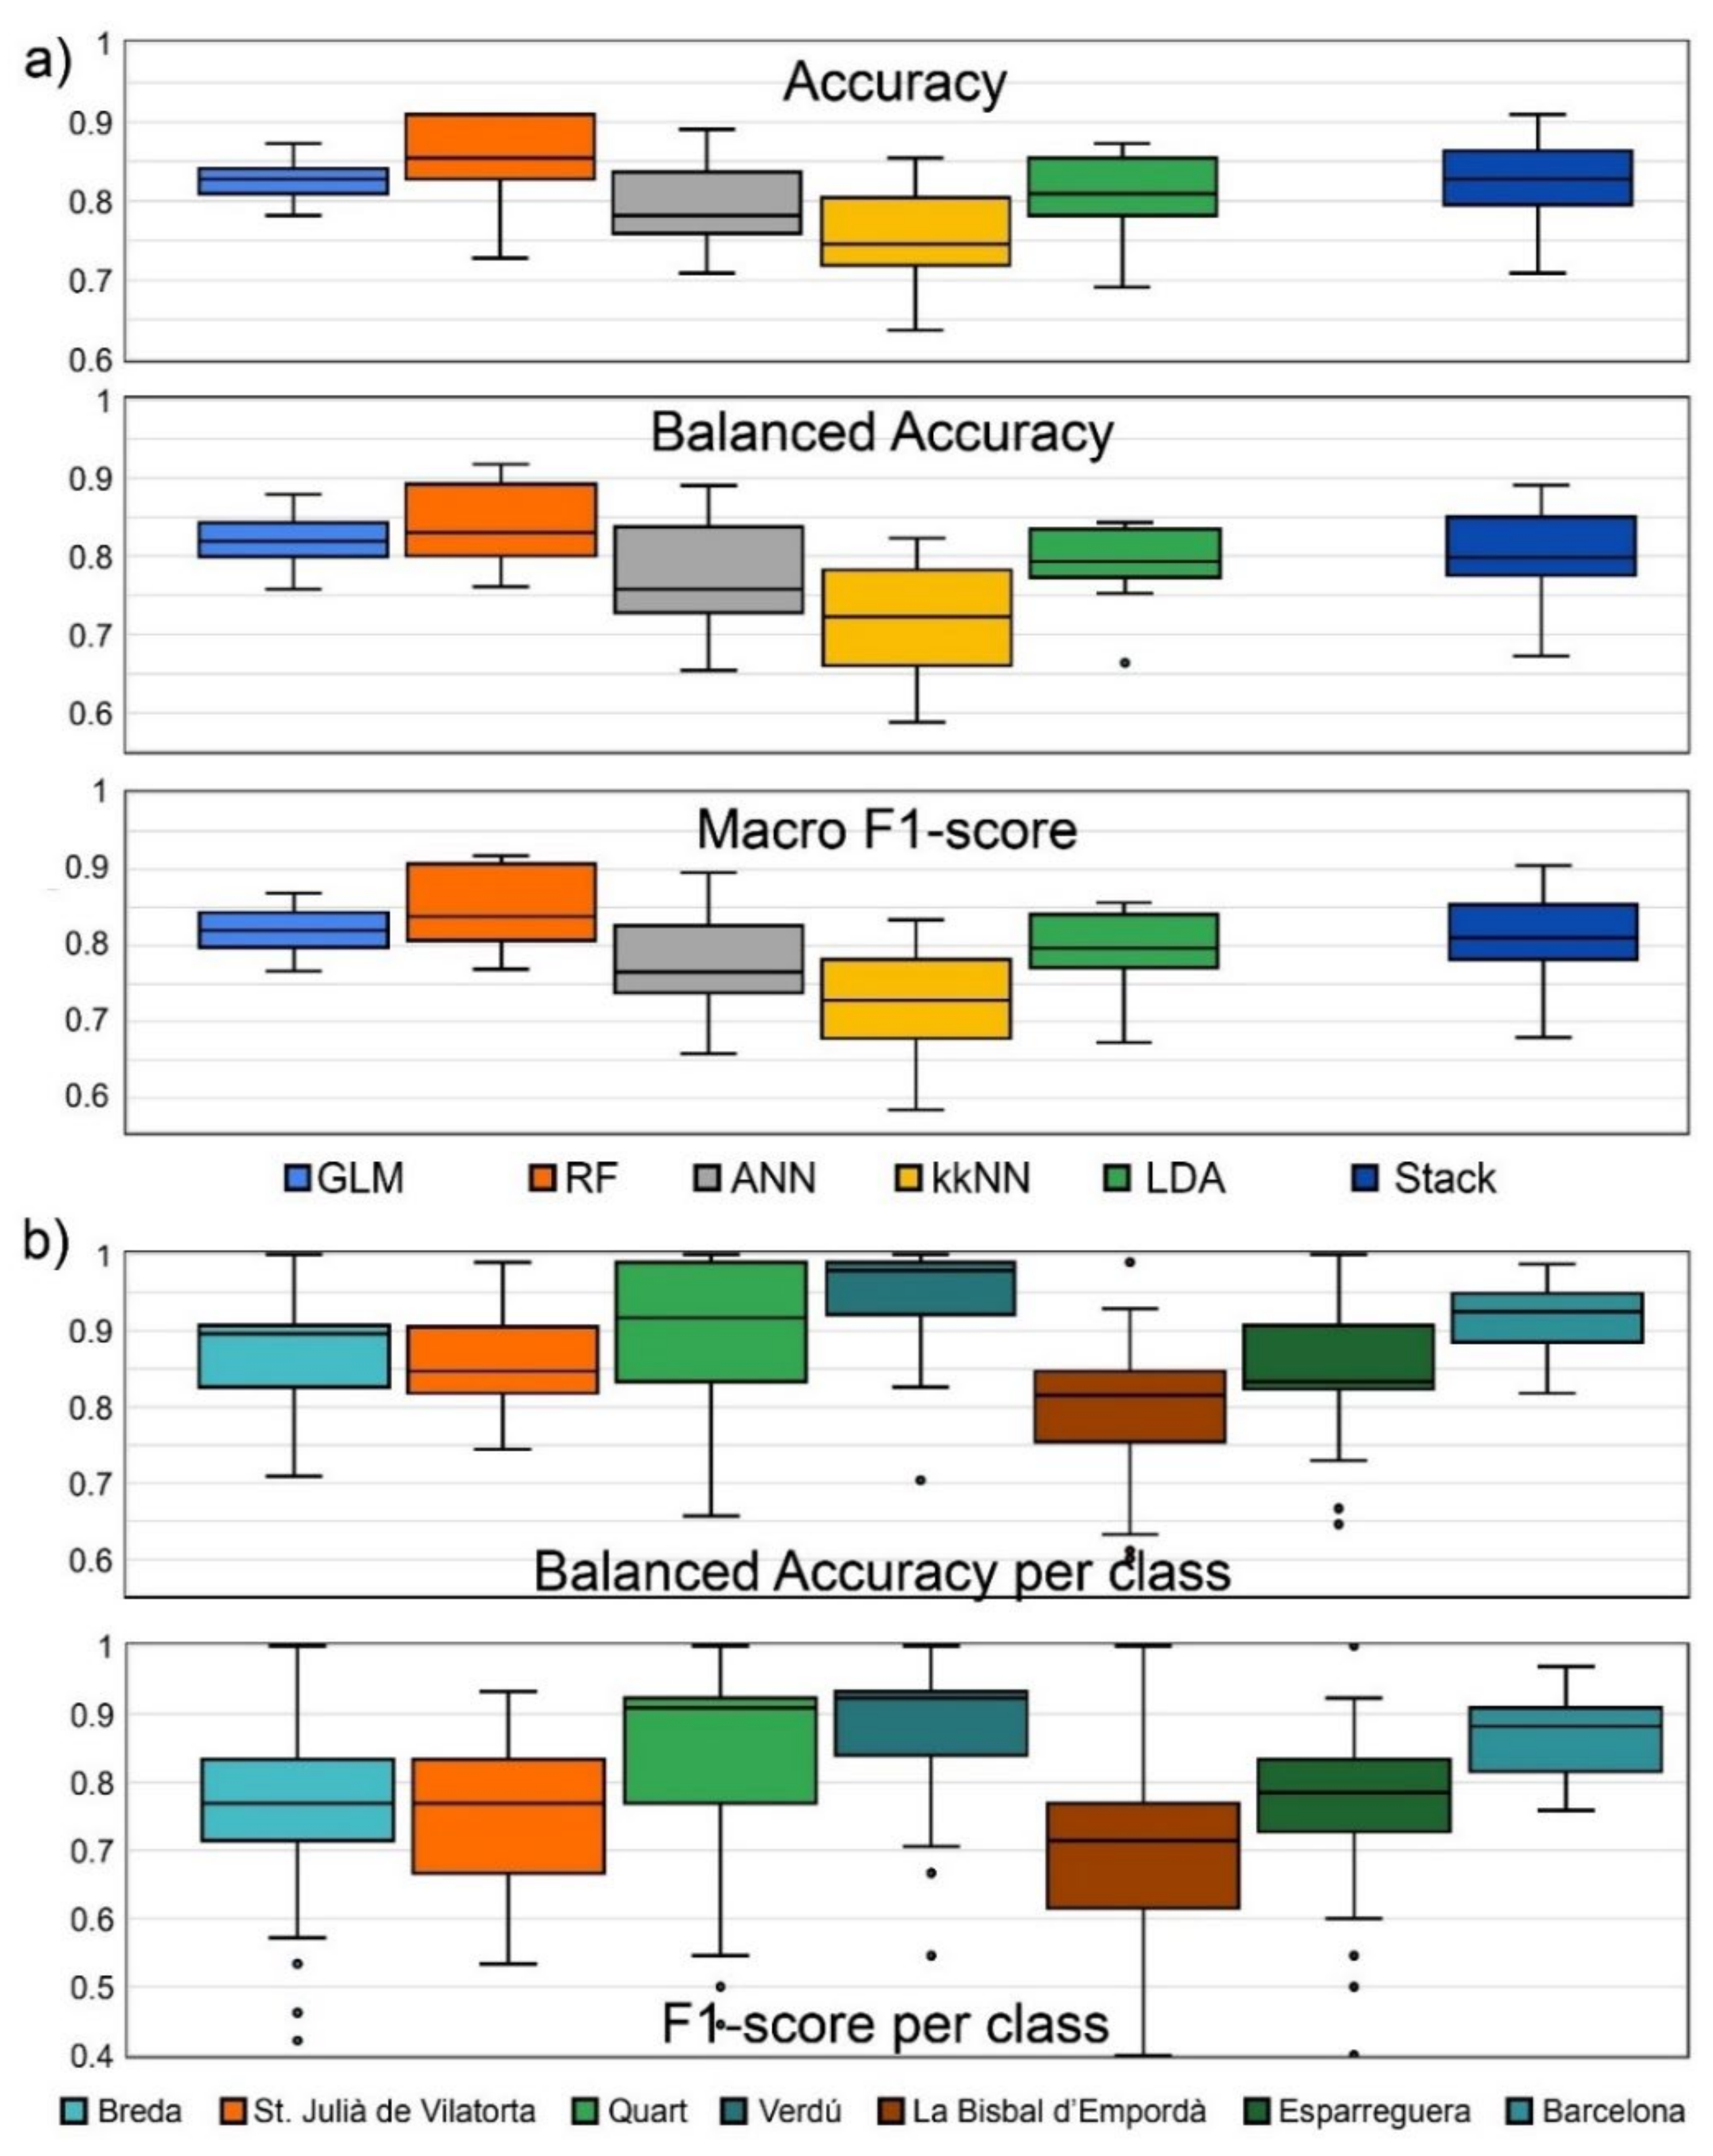
3.2. Supervised Classification Models

The different tested supervised classification models were trained using 80% of the 292 reference samples. Dataset partition was performed, also keeping the 80% proportion for every labeled class; apart from this restriction, samples were randomly selected. After model optimization, the remaining 20% of the samples were used to test the performance of the classification models. Different random seeds can be used to obtain different splits of the database into the train (80%) and test (20%) subsets. Statistical values of accuracy (true positives divided by the total predictions) were computed as an indicator of the classification capability and also to check if this capability varies significantly with the number of seeds tested. The results (Figure 3) indicate that almost all models show little variation in the corresponding accuracy boxplots after computing it with the results from around ten seeds. In particular, the interquartile range remains rather stable, and only the ANN model exhibits more difficulty in stabilizing.
By comparing the statistical distribution of accuracy for the different models as obtained using ten different random splits, it is apparent that the obtained accuracies (Figure 4a) range mostly between 0.75 and 0.85, with a moderate variation depending on the split. The low variability of the GLM model and the high accuracy values of the RF model is remarkable, and therefore these two models are less split-dependent. It is worth noting that with the addition of the new class (Barcelona), the targeted classes appear strongly imbalanced. The new class contains 84 reference samples whilst the others contain significantly fewer samples (from 33 to 37) [35]. Therefore, balanced accuracy [68] is a better indicator of the performance of the models. Additionally, an overall value of the F1-score was also computed as the simple arithmetic mean of the corresponding F1-scores per class. All three global performance indicators show very similar trends (Figure 4a), reinforcing the conclusion that ANN and, in particular, kkNN are the models with higher variability and lower mean performance.
Finally, the statistics on balanced accuracy per class and F1-score per class (Figure 4b) allow identifying Quart, Verdú and Barcelona as the classes with a higher positive prediction score whilst La Bisbal appear to be the class that is more difficult to predict and yet, on average according to the accuracy, is correctly predicted in four out of every five cases and just a bit less looking at the F1-score. In summary, accuracies are almost always above 0.6 and often above 0.8, and other performance indicators show the same trends. This enables supervised methods to be used to predict classes for unlabeled samples.

3.3. Cluster Prediction

Not surprisingly, the unsupervised methods fail to classify the unlabeled samples (samples of unknown provenience) into a given reference cluster (Figure 2b), whilst trained, supervised methods provide accuracies generally above 0.8. In this section, we show the classification results obtained by the application of several trained, supervised models onto the five types of unlabeled samples (CM1, CM2, CM3, TM and C).
Every training subset produces a trained model that, in a second stage, can be used to classify samples of unknown provenience. The classification results of an unlabeled sample are produced as a set of probabilities of this sample to belong to the different reference clusters. Despite the great performance of supervised classification models, it is worth mentioning the importance of applying different models, seeds and samples to obtain conclusions with statistical representativeness. By looking at the obtained results from a single run using only one sample from every unlabeled set and using a given trained model (e.g., LDA), we could preliminarily and misleadingly assume that all the provenances can be unveiled. As shown in Table 3, a single tested sample for the CM3 and C sample types produces a 100% probability of belonging to the Breda cluster and 88% to the same cluster for a TM sample. A single sample of CM1 type seems to belong to the Quart cluster (85%), whilst the tested CM2 sample would be assigned to Barcelona with a moderate 69% probability. By using all the available samples from every provenanced set (and not just a single sample), most of the preliminary conclusions hold, although some appear less clearly supported. The C set persists unambiguously assigned to Breda (100%), whilst the CM2 set appears to be assigned to Barcelona with a 78% probability and the CM3 to Breda (75%). In contrast, the probability percentages corresponding to the CM1 and TM sets appear now much more distributed into different classes.
As seen before, different training sets (i.e., runs with different seeds) could result in slightly different classification results, and this also applies to samples of unknown provenience. Ten different trained configurations were used for every model to obtain probabilities with associated uncertainties. Computing the mean probabilities now clearly results in much more scattered probabilities (Table 4). By looking at the results from the LDA model, the probabilities associated with the CM2, CM3 and C sets still appear rather concentrated in a given class (Barcelona, Breda and again Breda, respectively). However, taking into account the results from different models, it becomes apparent that the provenance of the samples remains unknown for almost all the sample sets. For instance, the LDA model indicates that the C-type samples belong to the Breda cluster with a 97% probability, but the RF model distributes the probability into all the classes. The only case of systematic attribution of a set of samples to a given cluster is that of the CM2 set. For this set, the probability percentages always indicate provenance from Barcelona regardless of the classification model. For all the other sets, the probability percentages distribute into different classes. In the case of the CM3 set, two classes cope systematically with most of the probability, but in other cases, the concerned classes vary significantly from model to model.

4. Discussion

4.1. Cluster Prediction

The presented cluster-prediction results highlight the importance of increasing the data population to gain statistical significance for the obtained results. The predictions from a single run or using only a given classification model could be misleading.
In order to increase the size of the data, it is advisable to analyze different archaeological samples from a given typology instead of individual samples. Obviously, for a given archaeological provenience problem, perhaps only unique samples are available, and therefore, it would be impossible to work with a set of different samples. In these cases, a possibility could be to measure different specimens from the unique sample. Another way to increase the size of data, equally important, is to apply different classification runs of the presented programmed approach, starting from different splits and using different classification models.
In the case of the presented archaeological samples, the use of several samples for every set, as well as different classification runs and models, allows the production of statistically significant results. The only clear and systematic univocal prediction from the results displayed in Table 4 is the ascription of the CM2 sample set (lead-glazed cooking ware from the Montsoriu castle) to the Barcelona cluster. This origin was already hypothesized by archaeologists [61] as a possible provenience for the three analyzed sample sets retrieved from the Montsoriu castle. However, for the other two sets from Montsoriu (CM1 and CM3), the probability percentages corresponding to the Barcelona origin are very low, and there is no other reference cluster that systematically captures a portion of probability above 60%. Instead, for CM1 and CM3, the probability is greatly split between different groups, with Quart bearing the highest percentage for CM1 and both Breda and Quart for CM3. Regarding the other two unlabeled sets, the one retrieved in Torre de la Mora (TM) shows probabilities also split into different reference clusters, although, regardless of the model, the higher percentage always corresponds to the nearby reference cluster of Breda. In contrast, the samples retrieved in La Creueta (C) do not show any particular affinity for the nearby site of Quart. In any case, the lack of systematic univocal prediction with high percentages (>60%) would indicate that all the unlabeled sets except CM2 do not really belong to any of the reference clusters. It is worth mentioning that the presented approach always produces probability percentages, even for samples that are known for sure not to belong to any of the labeled classes. We assumed that probability percentages greatly distributed into different clusters (either two or more) indicate that the true origin of the provenanced samples is an unknown site not included within the reference labeled samples.
For the successfully provenanced set, the probability percentages associated with the Barcelona cluster are always rather close to the measured accuracies using a test set. In particular, the percentage obtained using the stack of models is very high (99%). In fact, the stack of models uses, as input, the features from the different prediction models as a discrete income (1 or 0); therefore, the predictions from the stack of models also tend to be binary, and we should therefore expect a very high percentage for the labeled class that matches the true provenance. In the case of the unsuccessfully provenanced sets, the systematic concentration of probability into a given reference set or sets (see CM1 and Quart; C and Breda or CM3 and Quart/Breda) would only indicate that the true provenance site of these sets has a certain similarity with those reference sites, but the true provenance remains unknown. In order to unveil this provenance, the reference database of labeled samples should be expanded with new classes. New classes would require a given set of samples of known provenance that could be obtained and measured.
The presented supervised approach illustrates how, in the context of a very delimited archaeological classification problem, it is possible to assess the correctness of archaeological hypotheses statistically. As for the hypotheses that are not supported by the prediction results, it is apparent that archaeological assumptions, regardless of their plausibility, are not always accurate. Theoretically, the prediction capability of the trained models is not dependent upon the chronology dissimilarity between reference and archaeological samples. However, older samples could have been produced more easily from presently unknown claypits; therefore, the corresponding reference group would be impossible to produce unless kiln samples were available. Additionally, the correctness of the prediction results is highly dependent on the quality of the database of labeled samples. The models classify according to the categories they know about, and if the models do not incorporate the variability of the features being classified, they will be biased towards class subsets. Machine learning analyses are susceptible to missing the “forest for the trees” if the data used to train the models do not include sufficient information to distinguish between archaeologically relevant classes [38]. The database should therefore include representative samples covering all the internal variability of the reference site, including preferably also raw clay samples. Finally, another factor that should be considered is the experimental procedure. In order to avoid spurious correlations, all the geochemical values (for both labeled and unlabeled samples) should ideally be obtained using the same equipment and following the same experimental protocol.

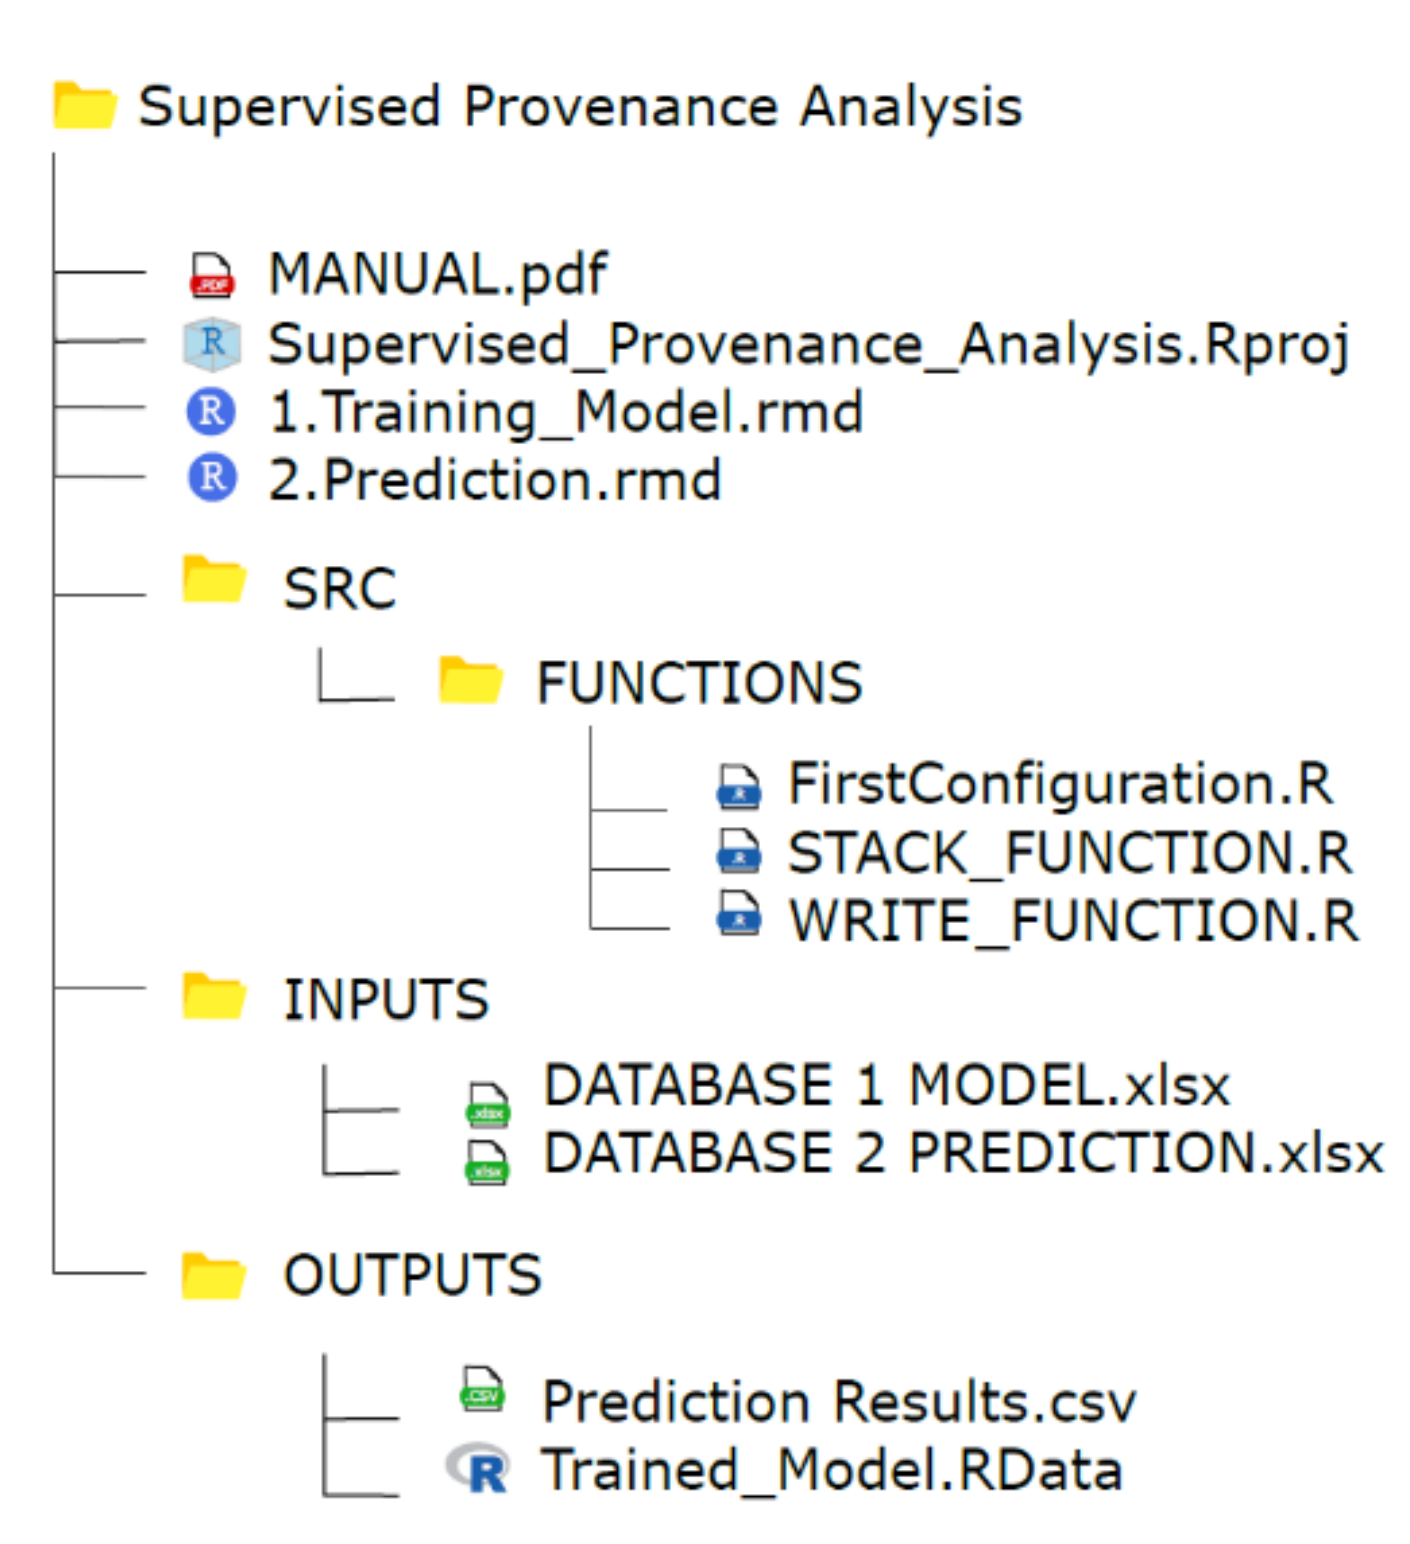
4.2. Using and Exporting the Presented Approach to Other Contexts

Often, provenance studies on archaeological pottery deal with a large number of samples, if not all, of unknown origin, and PCA is only performed to divide the samples in different groups, but the provenance remains unknown. In order to attempt provenance determination, the groups are then compared with reference samples (from kilns or clay samples) using unsupervised methods (in particular PCA and HCA). In the absence of correlation between the samples of unknown origin and the reference samples, it is assumed that the samples are imports. The supervised approach presented here is intended to be used for specific and very delimited archaeological classification problems where the samples are very likely to belong to any of the labeled classes and with the particularity that the labeled classes appear to be undistinguishable using unsupervised methods. In order to multiply the applicability of the approach, we envisage, in an ideal future, the building of a collective and standardized geochemical database corresponding to pottery/clay of known origin. This should constitute an increasing number of labeled classes that could be selected by any archaeologist interested in the application of the presented code. In the meantime, any researcher would have to obtain their own reference database. Keeping this in mind, the approach here is already available to any researcher that would like to apply it to a constrained classification problem, similarly to the one presented in Section 2.1. In order to facilitate this task, we provided the so-called “Supervised Provenance Analysis” (SPA) code that can be freely downloaded from a GitHub repository: https://github.com/AnnaAnglisano/SPA_Supervised_Provenance_Analysis.git (accessed on 1 September 2022).
This is an R language program in R Markdown format that can be used through the freely downloadable RStudio interface. In addition to the R Markdown (rmd) files, other files (Figure 5) are available with it, along with instructions to reproduce the illustrative example presented in this paper, even without previous knowledge of R projects. The files include both the faculty of training a model using a reference database and also that of predicting classifications from a database of unlabeled samples.
The downloadable materials contain a pdf file (manual.pdf) with detailed instructions on how to install and use the SPA code in all of its different options. The main document is the Supervised_Provenance_Analysis.Rproj file, which is an RStudio project file that is executed within an RStudio session and enables relative paths to read and save data as the programs within the project are executed. This allows the application to work properly on any computer regardless of the location of the files. The folder contains two R Markdown files (1.Training_Model.Rmd and 2.Prediction.Rmd) that should be executed one after the other (Figure 6). The first step tunes the models (through training and testing them), and once tuned, in the second step, the models are used to make class predictions. The use of rmd files within the RStudio project facilitates the use of the programming codes for non-specialist users throw color codes. This file format combines code (actions and functions) that appear on a gray background with information or instructions on a white background. The results appear directly under the corresponding actions upon execution on a white background.
Apart from the main files (Rproj and Rmd types), there are three folders: SRC, INPUTS and OUTPUTS. Within SRC, there are several codes that are called from the Rmd main programs. The INPUTS folder contains two Excel spreadsheet files. One of them, called here MODEL for short, is a database containing the features (geochemical values) of the class-labeled data that is used to train and test the models. The first two columns contain the numbers identifying the classes and the individual samples, respectively. The other spreadsheet, called here PREDICTION for short, contains the features of the non-class-labeled data that are intended to be classified. The data from this database can be altered by replacing them with new geochemical data to classify them within the clusters described in Section 2.1. Alternatively, and more likely, the user could change both the contents of MODEL and PREDICTION databases to fully export the approach to other contexts with completely different reference groups. Both databases should contain the same ensemble of features (i.e., the same set of analyzed chemical elements), and in any case, it is important to avoid empty fields within the geochemical values. Empty fields can be replaced by zeros, or alternatively, the whole column of the feature bearing empty fields could be deleted within the MODEL database. Regarding the OUTPUTS folder, a file named Trained_Model.Rdata appears in it after executing all the code within the 1.Training_Model.Rmd file. This newly created Rdata file overwrites any existing previous version of it within the folder, and it is required to produce cluster predictions using the 2.Prediction.Rmd file. In turn, the execution of this second rmd file (step 2 in Figure 6) creates another file within the OUTPUTS folder. This is a comma-separated file (Prediction_results.csv) containing a row for every unlabeled sample with the probabilities of belonging to any of the reference groups (numbered as within the MODEL spreadsheet) expressed on a per unit basis, and this is for every classification model (GLM = Generalised Linear Model; RF = Random Forest; NNET = Neuronal Networks; KNN = K-Nearest Neighbour; LDA = Linear Discriminant Analysis; STK = stack of models).

4.3. Contribution to Sustainable Archaeology

The presented study contributes to sustainable archaeology in various aspects. In this section, these are detailed, along with some reflections to promote sustainability in archaeology and particularly in research on the geochemical classification of pottery artifacts.

4.3.1. Free and Open-Source Software

In the current context of the continuous and unstoppable growth of software-based research, there are unsustainable practices than remain quite rooted. One of these is arguably the use of proprietary software. The use of such software often implies issues such as the impossibility of accessing the source code and the use of inaccessible file formats that make it difficult to export the obtained results; the results are often also difficult to reproduce, and the use of the software usually requires a license payment. The archaeological community is becoming increasingly aware that the use of free and open-source software (FOSS) is one of the steps toward the sustainable development of archaeology [69]. The presented classification and prediction approach was developed in R, a FOSS that is being widely used for statistical analysis, data mining and data visualization. After the release, in 2010, of RStudio [70], the usability of R greatly increased. The emergence of this integrated development environment enables archaeologists without any programming background to use R effectively. The complexity of the machine learning algorithms that were used is significant. The result of this complexity could be branded as a “black box” because their use relies on previously created classification models [38]. Archaeologists without a solid mathematic background accept their applicability to data without becoming too concerned over the mathematics and its possible limitations. However, the whole process is reproducible, and all its steps can be tracked.
In particular, the R Markdown file format that was used here is the antithesis of the black box approach of many proprietary software. In the classic black box software, after uploading the data, the parameters are set by a series of unrecordable clicks, and then, as if by magic, the results are produced. In contrast, R Markdown files are readable from RStudio or any common text editor; they contain editable R code blocks and text with instructions that guide the user through execution. Additionally, the functions are written one after the other in a chain of instructions (a so-called pipeline), which is the intuitive flow for most people new to programming. Therefore, it becomes clear the instructive implications of using R Markdown files and, in general, any kind of FOSS.
In addition to the pedagogical aspects, FOSS contributes to the economic dimension of sustainable archaeology and not only because of the lack of license payment. Reproducibility is essential to scientific progress and sustainable research. If research is non-reproducible, all the resources used to produce that research can be considered useless and wasted. The computer source code is critical for understanding and evaluating computer programs [71]. Full publication of the source code is a common demand in any scientific research involving computer codes. Reproducibility is one of the obvious criteria to assess the quality of archaeological research objectively [69]. The publication of the source code allows feedback in the form of collaborative peer review; the exchange of ideas can bring about improved, extended or customized versions of the code. A loyal open-source community results in insightful, careful and sustainable research development. The active online community of users of R is a paradigmatic example of collective development. Advanced users create contributed packages that help new users to be productive using R. Due to the large number of such packages, they were organized into lists relevant to specific areas of analysis and one of these areas is explicitly archaeology [72].

4.3.2. Open Access and Data Sharing

Publishing in open access is the best way to spread knowledge and allow that knowledge to be built upon. The move to open access is gradually changing working practices and helping the development of a sustainable future for data. The growth of data papers promotes new working practices enabling reuse and critical reassessment of primary data. Archaeologists are often reluctant to share data, arguing that in doing so, they are giving away their research. However, their research is built upon data often gathered at the public’s expense [37]. In our study, we not only present the potential of supervised classification methods but we also advocate geochemical data sharing. Our reference geochemical database with nearly 300 class-labeled analyses can be freely downloaded and used, and we prompt others to extend it to more samples and classes.
The quality of research results is highly dependent on the nature of the available data, issues of sustainability of digital data repositories, accessibility and reliability of data, standardization of data formats and management of property rights are currently widely debated [73]. In our approach, the data format is not really a big issue. Geochemical data consists of numbers commonly organized in columns that can easily be presented as a plain text table (CSV or Excel are suitable formats). However, it would be very important to monitor the quality of the data. In addition to the actual chemical analyses, a centralized repository should contain all details on the measuring conditions for every sample (technique and equipment used, measuring time, sample weight, sample format, etc.). Similar to other existing initiatives [74], a dedicated research project on a specific geochemical archaeological database for model training and cluster prediction would be helpful. However, the best way to guarantee the long-term sustainable archiving of the data would be to involve administrative authorities at either the national or transnational level. The current shared data initiatives are practices that should be followed by other data owners around the world in academia [37]. Publishing data papers and documenting good practices seem the most effective way to persuade reluctant archaeologists to share their data and the authorities to become involved in data curation.

5. Conclusions

The possibility of using supervised machine learning modeling for provenancing archaeological pottery was positively checked. A very delimited archaeological classification problem was used to illustrate this. From the five sets of pottery of unknown provenience but suspected to be produced locally in Catalonia, only the provenience of one (CM2) appears clearly defined. Therefore, the set of lead-glazed cooking ware retrieved from the Castell de Montsoriu site, dated between 1475 and 1560 CE, can be attributed to Barcelona according to the probability results of all the tested supervised models. In particular, a stack of models used repeatedly using different configurations produces an average estimate of the probability of 99% belonging to Barcelona for the CM2 set. For other provenanced sets, there is a lack of systematic univocal prediction, and we should conclude that these sets do not belong to any of the seven reference production centers.
In order to implement this supervised approach, it is essential to obtain a relatively large and reliable ensemble of reference samples for the several possible provenances of the samples that are intended to be provenanced. It is difficult to determine the minimum number of required labeled samples to define a reference group because it will depend on the homogeneity of its features. Clearly, the higher the number of reference samples, the better, although this would be an unsustainable solution. In the presented case, the reference group with fewer samples contained 33, and it is advised to use a balanced number of samples for all the reference classes.
After training and testing the classification models using the reference samples, it can be checked if the distinction between groups is feasible with an acceptable level of accuracy. In the case illustrated in this paper, all the models succeed with accuracies generally above 0.75 and relatively split-independent. Other performance indicators show the same trend. The approach could be exported to other similar classification problems following ideally the same train and test protocol to identify the useful (high accuracy) models to classify unlabeled samples (which should ideally consist of several samples for each sought classification). Classification conclusions should only be considered reliable in case of convergence of the predictions from all the high-accuracy models.
Archaeologists non-versed in statistical and machine learning techniques under R programming can use the files from the “Supervised Provenance Analysis” file folder that is made freely available with this paper and includes detailed installation and operation instructions. Interested archaeometrists without previous knowledge of R will be able to set up their own preloaded classification model using default parameters just by introducing the required databases. Additionally, experienced users could freely modify the preset parameters and adapt the codes to incorporate other classification models to suit the requirements of various classification strategies (not only necessarily based on geochemical data).
As a matter of principle, the presented approach contributes to sustainable archaeological practices as it is based on an open source R free software environment, and the user-friendly Rproject files are made freely available to any interested archaeologist. In the long term, generalized use of the presented approach and massive geochemical data sharing would result in a reduced number of analyses. Taken to the extreme, once established an exhaustive reference record for a given region, archaeologists should only analyze their samples of unknown origin without the need to provide reference samples. For the moment, our aim is to divulge the supervised approach and to help others to experiment with it.

Supplementary Materials

The following supporting information can be downloaded at: https://www.mdpi.com/article/10.3390/su141811214/s1: Table S1: detailed list of geological and archaeological samples that were used as reference samples to define the Barcelona reference cluster. Table S2: detailed list of the five sets of archaeological samples that were used to perform cluster predictions.

Author Contributions

Conceptualization and fieldwork—clay and shard sampling, A.A. and L.C.; experimental work—sample preparation, A.A. and R.D.F.; experimental work—petrographic analyses, A.A., L.C. and R.D.F.; experimental work—geochemical analyses, A.A. and I.Q.; code writing, A.A; formal analyses of data, A.A. and L.C.; writing—first draft preparation, A.A. and L.C.; writing—review and editing, all authors. All authors have read and agreed to the published version of the manuscript.

Funding

IDAEA-CSIC is a Centre of Excellence Severo Ochoa (Spanish Ministry of Science and Innovation, Project CEX2018-000794-S). Article processing charges were partially supported by funds from the Grup de Recerca Aplicada al Patrimoni Cultural (GRAPAC).

Institutional Review Board Statement

Not applicable.

Informed Consent Statement

Not applicable.

Data Availability Statement

The data presented in this study are openly available in the GitHub repository: https://github.com/AnnaAnglisano/SPA_Supervised_Provenance_Analysis.git (accessed on 1 September 2022).

Acknowledgments

We are grateful to Núria Miró and Emili Revilla (Servei d’Arqueologia de Barcelona) for providing the archaeological samples from Barcelona, to Gemma Font and Jordi Tura (Museu Etnològic del Montseny) for providing the archaeological samples from Montsoriu castle, Torre de la Mora and la Creueta. Albert Ventayol (Bac and Ventayol Geoserveis) is acknowledged from providing the geological samples from borehole cores. We are also thankful to Marc Gabasa for helping with sample preparation and experimental measurements. We are also very grateful to Marc Anglisano for helping to develop the SPA code. Finally, we would like to thank the editor as well as the reviewers for their valuable remarks and comments.

Conflicts of Interest

The authors declare no conflict of interest.

References

  1. Heimann, R.; Franklin, U. Archaeo-thermometry: The assessment of firing temperatures of ancient ceramics. J. Int. Inst. Conserv.-Can. Group 1979, 4, 23–45. [Google Scholar]
  2. Holakooei, P.; Tessari, U.; Verde, M.; Vaccaro, C. A new look at XRD patterns of archaeological ceramic bodies. J. Therm. Anal. Calorim 2014, 118, 165–176. [Google Scholar] [CrossRef]
  3. Aitken, M.J. Dating by archaeomagnetic and thermoluminescent methods. Philos. Trans. R. Soc. London. Ser. A Math. Phys. Sci. 1970, 269, 77–88. [Google Scholar]
  4. Howard, S. Understanding the concept of sustainability as applied to archaeological heritage. Rosetta 2013, 14, 1–19. [Google Scholar]
  5. Carman, J. Educating for sustainability in archaeology. Archaeologies 2016, 12, 133–152. [Google Scholar] [CrossRef]
  6. Reedy, C.L. Thin-Section Petrography of Stone and Ceramic Cultural Materials; Archetype Publications Ltd.: London, UK, 2008; ISBN 9781904982333. [Google Scholar]
  7. Quinn, P.S. (Ed.) Interpreting Silent Artefacts: Petrographic Approaches to Archaeological Ceramics; Archaeopress Publishing Ltd.: Oxford, UK, 2009; ISBN 9781905739295. [Google Scholar]
  8. Quinn, P.S. Ceramic Petrography: The Interpretation of Archaeological Pottery & Related Artefacts in Thin Section; Archaeopress Publishing Ltd.: Oxford, UK, 2013; ISBN 978-1-905-73959-2. [Google Scholar]
  9. Neff, H. (Ed.) Chemical Characterization of Ceramic Pastes in Archaeology; Prehistory Press: Madison, WI, USA, 1992; ISBN 0962911062. [Google Scholar]
  10. Hein, A.; Tsolakidou, A.; Iliopoulos, I.; Mommsen, H.; Garrigós, J.; Montana, G.; Kilikoglou, V. Standardisation of elemental analytical techniques applied to provenance studies of archaeological ceramics: An inter laboratory calibration study. Analyst 2002, 127, 542–553. [Google Scholar] [CrossRef]
  11. Baxter, M.J. Exploratory Multivariate Analysis in Archaeology; Eliot Werner Publications-Inc.: Clinton Corners, NY, USA, 2015. [Google Scholar]
  12. Ricca, M.; Paladini, G.; Rovella, N.; Ruffolo, S.A.; Randazzo, L.; Crupi, V.; Fazio, B.; Majolino, D.; Venuti, V.; Galli, G. Archaeometric characterisation of decorated pottery from the archaeological site of villa dei quintili (Rome, Italy): Preliminary study. Geosciences 2019, 9, 172. [Google Scholar] [CrossRef]
  13. Buxeda, I.; Garrigós, J.; Ontiveros, M.A.C.; Kilikoglou, V. Chemical variability in clays and pottery from a traditional cooking pot production village: Testing assumptions in pereruela. Archaeometry 2003, 45, 1–17. [Google Scholar] [CrossRef]
  14. Brorsson, T.; Blank, M.; Fridén, I.B. Mobility and exchange in the middle neolithic: Provenance studies of pitted ware and funnel beaker pottery from Jutland, Denmark and the West Coast of Sweden. J. Archaeol. Sci. Rep. 2018, 20, 662–674. [Google Scholar] [CrossRef]
  15. Papachristodoulou, C.; Oikonomou, A.; Ioannides, K.; Gravani, K. A study of ancient pottery by means of X-ray fluorescence spectroscopy, multivariate statistics and mineralogical analysis. Anal. Chim. Acta 2006, 573–574, 347–353. [Google Scholar] [CrossRef]
  16. Aquilia, E.; Barone, G.; Mazzoleni, P.; Ingoglia, C. Petrographic and chemical characterisation of fine ware from three archaic and hellenistic kilns in gela, sicily. J. Cult. Herit. 2012, 13, 442–447. [Google Scholar] [CrossRef]
  17. Munita, C.S.; Paiva, R.P.; Alves, M.A.; de Oliveira, P.M.S.; Momose, E.F. Provenance study of archaeological ceramic. J. Trace Microprobe Tech. 2003, 21, 697–706. [Google Scholar] [CrossRef]
  18. Scarpelli, R.; Robustelli, G.; Clark, R.J.H.; Francesco, A.M.D. Scientific investigations on the provenance of the black glazed pottery from Pompeii: A case study. Mediterr. Archaeol. Archaeom. 2017, 17, 1–10. [Google Scholar]
  19. Buxeda i Garrigós, J.; Kilikoglou, V.; Day, P.M. Chemical and mineralogical alteration of ceramics from a late bronze age kiln at Kommos, Crete: The effect on the formation of a reference group. Archaeometry 2001, 43, 349–371. [Google Scholar] [CrossRef] [Green Version]
  20. Maritan, L.; Holakooei, P.; Mazzoli, C. Cluster analysis of XRPD data in ancient ceramics: What for? Appl. Clay Sci. 2015, 114, 540–549. [Google Scholar] [CrossRef]
  21. Medeghini, L.; Mignardi, S.; Vito, C.D.; Conte, A.M. Evaluation of a FTIR data pretreatment method for principal component analysis applied to archaeological ceramics. Microchem. J. 2016, 125, 224–229. [Google Scholar] [CrossRef]
  22. Parisotto, S.; Leone, N.; Schönlieb, C.-B.; Launaro, A. Unsupervised clustering of Roman potsherds via variational autoencoders. J. Archaeol. Sci. 2022, 142, 105598. [Google Scholar] [CrossRef]
  23. Bratitsi, M.; Liritzis, I.; Vafiadou, A.; Xanthopoulou, V.; Palamara, E.; Iliopoulos, I.; Zacharias, N. Critical assessment of chromatic index in archaeological ceramics by Munsell and RGB: Novel contribution to characterization and provenance studies. Mediterr. Archaeol. Archaeom. 2018, 18, 175–212. [Google Scholar]
  24. Visiedo, J.P.; Madrid i Fernández, M.; Buxeda i Garrigós, J. The case of black and green tin glazed pottery from Barcelona between 13th and 14th century: Analysing its production and its decorations. J. Archaeol. Sci. Rep. 2021, 38, 103100. [Google Scholar] [CrossRef]
  25. Calparsoro, E.; Arana, G.; Iñañez, J.G. Pottery from orduña village in the 17th–19th centuries: An archaeometrical approach. J. Archaeol. Sci. Rep. 2019, 23, 304–323. [Google Scholar] [CrossRef]
  26. Baklouti, S.; Maritan, L.; Ouazaa, N.L.; Casas, L.; Joron, J.-L.; Kassaa, S.L.; Moutte, J. Provenance and reference groups of African Red Slip ware based on statistical analysis of chemical data and REE. J. Archaeol. Sci. 2014, 50, 524–538. [Google Scholar] [CrossRef]
  27. Mackensen, M.; Schneider, G. Production centres of African red slip ware (2nd-3rd c.) in northern and central Tunisia: Archaeological provenance and reference groups based on chemical analysis. J. Rom. Archaeol. 2006, 19, 163–190. [Google Scholar] [CrossRef]
  28. Monette, Y.; Richer-LaFlèche, M.; Moussette, M.; Dufournier, D. Compositional analysis of local redwares: Characterizing the pottery productions of 16 workshops located in southern québec dating from late 17th to late 19th-century. J. Archaeol. Sci. 2007, 34, 123–140. [Google Scholar] [CrossRef]
  29. Montana, G.; Randazzo, L.; Tsantini, E.; Fourmont, M. Ceramic production at Selinunte (Sicily) during the 4th and 3rd century BCE: New archaeometric data through the analysis of kiln wastes. J. Archaeol. Sci. Rep. 2018, 22, 154–167. [Google Scholar] [CrossRef]
  30. Maritan, L.; Gravagna, E.; Cavazzini, G.; Zerboni, A.; Mazzoli, C.; Grifa, C.; Mercurio, M.; Mohamed, A.A.; Usai, D.; Salvatori, S. Nile river clayey materials in Sudan: Chemical and isotope analysis as reference data for ancient pottery provenance studies. Quat. Int. 2021, in press. [Google Scholar] [CrossRef]
  31. Baklouti, S.; Maritan, L.; Casas, L.; Ouazaa, N.L.; Jàrrega, R.; Prevosti, M.; Mazzoli, C.; Fouzaï, B.; Kassaa, S.L.; Fantar, M. Establishing a new reference group of keay 25.2 amphorae from Sidi Zahruni (Nabeul, Tunisia). Appl. Clay Sci. 2016, 132–133, 140–154. [Google Scholar] [CrossRef]
  32. Montana, G.; Ontiveros, M.Á.C.; Polito, A.M.; Azzaro, E. Characterisation of clayey raw materials for ceramic manufacture in ancient sicily. Appl. Clay Sci. 2011, 53, 476–488. [Google Scholar] [CrossRef]
  33. Gutsuz, P.; Kibaroğlu, M.; Sunal, G.; Hacıosmanoğlu, S. Geochemical characterization of clay deposits in the Amuq Valley (Southern Turkey) and the implications for archaeometric study of ancient ceramics. Appl. Clay Sci. 2017, 141, 316–333. [Google Scholar] [CrossRef]
  34. Efenberger-Szmechtyk, M.; Nowak, A.; Kregiel, D. Implementation of chemometrics in quality evaluation of food and beverages. Crit. Rev. Food Sci. Nutr. 2018, 58, 1747–1766. [Google Scholar] [CrossRef]
  35. Anglisano, A.; Casas, L.; Anglisano, M.; Queralt, I. Application of supervised machine-learning methods for attesting provenance in Catalan traditional pottery industry. Minerals 2020, 10, 8. [Google Scholar] [CrossRef]
  36. Fiorucci, M.; Khoroshiltseva, M.; Pontil, M.; Traviglia, A.; Bue, A.D.; James, S. Machine learning for cultural heritage: A survey. Pattern Recognit. Lett. 2020, 133, 102–108. [Google Scholar] [CrossRef]
  37. McKeague, P.; van‘t Veer, R.; Huvila, I.; Moreau, A.; Verhagen, P.; Bernard, L.; Cooper, A.; Green, C.; van Manen, N. Mapping our heritage: Towards a sustainable future for digital spatial information and technologies in European archaeological heritage management. J. Comput. Appl. Archaeol. 2019, 2, 89–104. [Google Scholar] [CrossRef]
  38. Bickler, S.H. Machine learning arrives in archaeology. Adv. Archaeol. Pract. 2021, 9, 186–191. [Google Scholar] [CrossRef]
  39. Cheng, G.; Han, J. A survey on object detection in optical remote sensing images. ISPRS J. Photogramm. Remote Sens. 2016, 117, 11–28. [Google Scholar] [CrossRef]
  40. Resler, A.; Yeshurun, R.; Natalio, F.; Giryes, R. A deep-learning model for predictive archaeology and archaeological community detection. Humanit. Soc. Sci. Commun. 2021, 8, 295. [Google Scholar] [CrossRef]
  41. Navarro, P.; Cintas, C.; Lucena, M.; Fuertes, J.M.; Delrieux, C.; Molinos, M. Learning feature representation of iberian ceramics with automatic classification models. J. Cult Herit. 2021, 48, 65–73. [Google Scholar] [CrossRef]
  42. Wilczek, J.; Monna, F.; Navarro, N.; Chateau-Smith, C. A computer tool to identify best matches for pottery fragments. J. Archaeol. Sci. Rep. 2021, 37, 102891. [Google Scholar] [CrossRef]
  43. Derech, N.; Tal, A.; Shimshoni, I. Solving archaeological puzzles. Pattern Recognit. 2021, 119, 108065. [Google Scholar] [CrossRef]
  44. Chetouani, A.; Treuillet, S.; Exbrayat, M.; Jesset, S. Classification of engraved pottery sherds mixing deep-learning features by compact bilinear pooling. Pattern Recognit. Lett. 2020, 131, 1–7. [Google Scholar] [CrossRef]
  45. Domínguez-Rodrigo, M.; Cifuentes-Alcobendas, G.; Jiménez-García, B.; Abellán, N.; Pizarro-Monzo, M.; Organista, E.; Baquedano, E. Artificial intelligence provides greater accuracy in the classification of modern and ancient bone surface modifications. Sci. Rep. 2020, 10, 18862. [Google Scholar] [CrossRef]
  46. Oonk, S.; Spijker, J. A supervised machine-learning approach towards geochemical predictive modelling in archaeology. J. Archaeol. Sci. 2015, 59, 80–88. [Google Scholar] [CrossRef]
  47. Barone, G.; Mazzoleni, P.; Spagnolo, G.V.; Raneri, S. Artificial neural network for the provenance study of archaeological ceramics using clay sediment database. J. Cult. Herit. 2019, 38, 147–157. [Google Scholar] [CrossRef]
  48. Lopez-Garcia, P.A.; Argote, D.L.; Thrun, M.C. Projection-based classification of chemical groups for provenance analysis of archaeological materials. IEEE Access 2020, 8, 152439–152451. [Google Scholar] [CrossRef]
  49. Ma, Q.; Yan, A.; Hu, Z.; Li, Z.; Fan, B. Principal component analysis and artificial neural networks applied to the classification of Chinese pottery of neolithic age. Anal. Chim. Acta 2000, 406, 247–256. [Google Scholar] [CrossRef]
  50. Díez-Pastor, J.F.; Jorge-Villar, S.E.; Arnaiz-González, Á.; García-Osorio, C.I.; Díaz-Acha, Y.; Campeny, M.; Bosch, J.; Melgarejo, J.C. Machine learning algorithms applied to Raman spectra for the identification of variscite originating from the mining complex of Gavà. J. Raman Spectrosc. 2020, 51, 1563–1574. [Google Scholar] [CrossRef]
  51. Salazar, A.; Safont, G.; Vergara, L.; Vidal, E. Pattern recognition techniques for provenance classification of archaeological ceramics using ultrasounds. Pattern Recognit. Lett. 2020, 135, 441–450. [Google Scholar] [CrossRef]
  52. Buxeda, J.; Iñañez, J.; Madrid, M.; Beltrán, J. La ceràmica de Barcelona. Organització i producció entre els segles XIII i XVIII a través de la seva caracterització arqueomètrica. Quarhis 2011, 7, 192–207. [Google Scholar]
  53. Serra, J. Ceràmica de rebuig al carrer d’Avinyó. Un possible nou taller barceloní en el primer quart del segle XIII. Quad. D’arqueologia Història Ciutat Barcelona. Quarhis 2016, 12, 194–209. [Google Scholar]
  54. Miró, N. Excavació de les voltes de la sala de reserva de la biblioteca de Catalunya, antic hospital de la Santa Creu, Barcelona (el Barcelonès). In 15 Anys D’Intervencions Arqueològiques: Mancanes i Resultats, Proceedings of 1r Congrés d’Arqueologia Medieval i Moderna a Catalunya, Igualada, Spain, 13–15 November 1998; Associació Catalana per a la Recerca en Arqueologia Medieval: Barcelona, Spain, 2000; pp. 168–176. Available online: https://dialnet.unirioja.es/servlet/libro?codigo=782515 (accessed on 30 July 2022).
  55. Nebot, N. La botiga de Josep Barba: Un terrisser a la Barcelona del segle XVIII. Quad. D’arqueologia Història Ciutat Barcelona. Quarhis 2015, 11, 184–199. [Google Scholar]
  56. Madrid, M.; Marcos, C.F.D.; Barrachina, C.P.; Heredia, J.B.D.; Escribano-Ruiz, S.; Ibáñez, J.G.; Ferrer, S.G.; Febo, R.D.; Amores, F.D.; Buxeda, J. Ceràmica, tecnologia i transferències. Els centres productius del projecte tecnolonial. Quad. D’arqueologia Història Ciutat Barcelona. Quarhis 2017, 13, 16–67. [Google Scholar]
  57. Caixal, A.; Fierro, X.; López, A. Resultats de l’excavació arqueològica en la galeria alta del pati Manning de l’antiga Casa de Caritat. In Actuacions en el Patrimoni Edificat Medieval i Modern (Segles X al XVIII) = Actuaciones en el Patrimonio Edificado Medieval y Moderno (Siglos X al XVIII); Servei del Oatrimoni Arquitectònic: Barcelona, Spain, 1991; pp. 13–15. [Google Scholar]
  58. Oriol, J. Memòria de la Intervenció Arqueològica a Pia Almoina, Barcelona; Generalitat de Catalunya: Barcelona, Spain, 1993. [Google Scholar]
  59. Miró, N. Memòria de la Intervenció Realitzada als Carrers de l’Argenteria i Manresa de Barcelona (Barcelonès); Ajuntament de Barcelona: Barcelona, Spain, 1997. [Google Scholar]
  60. Font, G.; Mateu, J.; Pujadas, S.; Tura, J.; Llorens, J.M. Montsoriu al Segle XVI. Testimonis Arqueològics de L’abandonament d’un Gran Castell. Tribuna D’arqueologia 2011–2012. 2014, pp. 244–263. Available online: http://calaix.gencat.cat/handle/10687/91795#page=1 (accessed on 30 July 2022).
  61. Tura, J.; Font, G.; Pujadas, S.; Mateu, J.; Llorens, J.M. El conjunt arqueològic del segle XVI localitzat a la cisterna est del castell de Montsoriu. Rodis J. Mediev. Post-Mediev. Archaeol. 2022, 25–46. [Google Scholar]
  62. Tura, J.; Mateu, J. Torre de la Mora o del Far (Sant Feliu de Buixalleu, la Selva): Una ocupació alt-medieval al Montseny. In Fars de L’islam: Antigues Alimares d’al-Andalus, Proceedings of the Jornades Científiques Ocorde; Barcelona, Spain, 9–10 November 2006, Martí, R., Ed.; Edar Press: Barcelona, Spain, 2008; pp. 139–154. Available online: https://cataleg.parcs.diba.cat/cgi-bin/koha/opac-detail.pl?biblionumber=10093 (accessed on 30 July 2022).
  63. Pericot y García, L.; Corominas Planellas, J.M.; Oliva Prat, M.; Riuró Ilapat, F.; Padrol Salellas, P. La Labor de La Comisaria Provincial de Excavaciones Arqueologicas de Gerona. Informes y Memorias; Ministerio de educación nacional. Comisaria general de excavaciones arqueológicas: Madrid, Spain, 1952; Volume 27. [Google Scholar]
  64. Zhao, Y. R and Data Mining. In R and Data Minig; Zhao, Y., Ed.; Academic Press: Cambridge, MA, USA, 2013; Chapter 5; pp. 41–50. ISBN 978-0-12-396963-7. [Google Scholar]
  65. Praveena, M.; Jaiganesh, V. A literature review on supervised machine learning algorithms and boosting process. Int. J. Comput. Appl. 2017, 169, 32–35. [Google Scholar] [CrossRef]
  66. Kotsiantis, S.B. Supervised machine learning: A review of classification techniques. In Proceedings of the 2007 Conference on Emerging Artificial Intelligence Applications in Computer Engineering: Real Word AI Systems with Applications in EHealth HCI, Information Retrieval and Pervasive Technologies, Amsterdam, The Netherlands, 10 June 2007; IOS Press: Amsterdam, The Netherlands, 2007; pp. 3–24. [Google Scholar]
  67. Kuhn, M. Building predictive models in r using the caret package. J. Stat. Softw. Artic. 2008, 28, 1–26. [Google Scholar] [CrossRef]
  68. Grandini, M.; Bagli, E.; Visani, G. Metrics for multi-class classification: An overview. arXiv 2020, arXiv:2008.05756. [Google Scholar]
  69. Bibby, D.; Ducke, B. Free and open source software development in archaeology. Two interrelated case studies: GvSIG CE and survey2GIS. Internet Archaeol. 2017, 43. [Google Scholar] [CrossRef]
  70. Van der Loo, M.P.J.; de Jonge, E. Learning RStudio for R Statistical Computing; Packt publishing: Birmingham, UK, 2012; ISBN 1782160604. [Google Scholar]
  71. Morin, A.; Urban, J.; Adams, P.D.; Foster, I.; Sali, A.; Baker, D.; Sliz, P. Research priorities. shining light into black boxes. Science 2012, 336, 159–160. [Google Scholar] [CrossRef]
  72. Marwick, B. CRAN Task View: Archaeological Science. Available online: https://github.com/benmarwick/ctv-archaeology (accessed on 29 August 2022).
  73. Kintigh, K. The promise and challenge of archaeological data integration. Am. Antiq. 2006, 71, 567–578. [Google Scholar] [CrossRef]
  74. Derudas, P.; Dell’Unto, N.; Callieri, M.; Apel, J. Sharing archaeological knowledge: The interactive reporting system. J. Field Archaeol. 2021, 46, 303–315. [Google Scholar] [CrossRef]
Figure 1. Geological map of the clay sampling sites (pink dots) and archaeological sites (blue dots) mainly around the Sarrià-Sant Gervasi and Ciutat Vella districts, respectively. The geological base map was modified from ICGC. The top right corner shows a geographical map with the location of each characterized production center (red dots) and the location of the three archaeological sites that were studied (yellow dots).
Sustainability 14 11214 g001
Figure 2. (a) PCA biplot of factor scores for the first two principal components for all the reference samples, 95% confidence ellipses were drawn for every class. Inset: PCA biplot of the most relevant variables. (b) The position of the samples of unknown provenience within the PCA biplot where the confidence ellipses were kept.
Sustainability 14 11214 g002
Figure 3. Boxplots of the accuracy variation as a function of the number of runs corresponding to different random seeds for all the tested classification models. The line connecting all the boxplots indicates the corresponding mean values.
Sustainability 14 11214 g003
Figure 4. Different indicators of the performance of supervised models using ten different splits. (a) Boxplots corresponding to the accuracy, balanced accuracy and macro F1-score variations for each model. (b) Boxplots with indicators (balanced accuracy and F1-score) per class computed using the predictions from all the classification models.
Sustainability 14 11214 g004
Figure 5. Complete tree of folders, subfolders and files required to perform the “Supervised Provenance Analysis”. Freely downloadable from a GitHub repository.
Sustainability 14 11214 g005
Figure 6. Schematic diagram of the two-step process (model tuning and predictions) to produce provenance probabilities for samples of unknown provenience using the R code to perform the “Supervised Provenance Analysis”.
Sustainability 14 11214 g006
Table 1. Summary of the sampled pottery from Barcelona.
Archaeological SiteN. of SamplesAgeReferences
Avinyó (AVI)713th CE[53]
Hospital (H)613th CE–14th CE[54]
Rull (RULL)314th CE–18th CE[55,56]
Hospital de la Santa Creu (HSC)2717th CE[54]
Casa de la Caritat (CC)9mid 17th CE–18th CE[57]
Pia almoina (PA)6early 18th CE[58]
Argenteria (ARG)619th CE[59]
Table 2. Description of the five selected sets of samples of unknown provenience.
Archaeological
Site
TypologyChronologyTagNo.
Samples
References
Castell de
Montsoriu
gray ware1475–1560 CECM17[60]
lead-glazed cooking wareCM210
green-glazed cooking wareCM36
Torre de la Moracooking warelate 9th CE–early 10th CETM7[62]
La Creuetahand-built cooking pots4th BCEC8[63]
Table 3. Classification results in the form of percentages indicating probability of correspondence to every class. For every type of provenanced sample (CM1, CM2, CM3, TM and C), the first column indicates the probability obtained using a single sample in a single run, and the second column indicates the classification percentage mean (and uncertainty) also using single runs but here applied to all the available samples of every provenanced set. Only results of LDA model are shown.
ModelLocalityCM1CM2CM3TMC
Linear Discriminant AnalysisBreda123 ± 1857 ± 910075 ± 308850 ± 25100100 ± 0
Sant Julià516 ± 1221 ± 001 ± 0127 ± 2800 ± 0
Quart8545 ± 2511 ± 0014 ± 2602 ± 500 ± 0
Verdú10 ± 000 ± 000 ± 000 ± 000 ± 0
La Bisbal33 ± 0107 ± 303 ± 3015 ± 2300 ± 0
Esparreguera36 ± 4126 ± 300 ± 013 ± 700 ± 0
Barcelona25 ± 86978 ± 1307 ± 1093 ± 500 ± 0
Table 4. Classification results in the form of probability percentages (including uncertainties) obtained after running ten times the training and cluster classification code on all the samples from the 5 sets of samples of unknown provenience. Only results of LDA, RF and the stack of models are shown.
ModelLocalityCM1CM2CM3TMC
Linear Discriminant AnalysisBreda29 ± 219 ± 1376 ± 2858 ± 2597 ± 10
Sant Julià17 ± 121 ± 11 ± 122 ± 232 ± 7
Quart40 ± 240 ± 013 ± 231 ± 20 ± 0
Verdú2 ± 20 ± 00 ± 00 ± 00 ± 0
La Bisbal5 ± 37 ± 53 ± 511 ± 171 ± 2
Esparreguera4 ± 37 ± 50 ± 05 ± 120 ± 1
Barcelona4 ± 775 ± 167 ± 83 ± 50 ± 0
Random ForestBreda11 ± 108 ± 437 ± 1725 ± 2213 ± 16
Sant Julià20 ± 76 ± 25 ± 216 ± 821 ± 7
Quart33 ± 124 ± 246 ± 810 ± 411 ± 6
Verdú0 ± 00 ± 00 ± 00 ± 02 ± 1
La Bisbal16 ± 711 ± 55 ± 218 ± 717 ± 4
Esparreguera7 ± 43 ± 11 ± 13 ± 313 ± 6
Barcelona11 ± 568 ± 102 ± 121 ± 619 ± 7
Stack of ModelsBreda11 ± 160 ± 250 ± 3757 ± 3735 ± 31
Sant Julià17 ± 340 ± 00 ± 17 ± 2021 ± 29
Quart62 ± 390 ± 048 ± 370 ± 20 ± 1
Verdú0 ± 00 ± 10 ± 20 ± 03 ± 7
La Bisbal6 ± 180 ± 20 ± 08 ± 213 ± 8
Esparreguera3 ± 80 ± 00 ± 11 ± 26 ± 15
Barcelona1 ± 599 ± 42 ± 628 ± 3332 ± 33
Publisher’s Note: MDPI stays neutral with regard to jurisdictional claims in published maps and institutional affiliations.

