Abstract
Information technology (IT) has become common in various economic and social fields, accompanied by the objective of facilitating the development of human society. However, the business value of IT has always been uncertain, with the IT “productivity paradox” problem becoming a core research topic. Previous studies on this issue have largely ignored the influences of national characteristics, such as foreign direct investment (FDI) and research and development (R&D) expenditure, on the business value of IT. To address this research gap, this study examined the dynamic influences of FDI and R&D expenditures on the business value of IT. Based on the assumption that the adjustment speed of economic growth is affected by both FDI and R&D expenditures, we established a partial adjustment model of dynamic adjustment speed and the individual and combined effects of FDI and R&D expenditures during the period from 2000 to 2017 to empirically examine the economic performance of China and its “productivity paradox” problem. The findings revealed that the individual and combined effects of FDI and R&D expenditures significantly improved the adjustment speed and economic performance of China during that period, that IT significantly influenced economic growth but did not improve economic performance, and that an IT “productivity paradox” existed in China at that time. In addition, IT-driven changes in economic performance could be compensated for or replaced by FDI and R&D expenditures, suggesting that these two factors have a substitutive or complementary effect on IT-driven changes. Therefore, the business value of IT business value was not determined by IT itself; rather, the important effects of national macroscopic factors, including FDI and R&D expenditures, must be taken into account.
1. Introduction
As a novel technology with a profound influence on the contemporary era, information technology (IT) not only changed how humans live, study, and work, but also facilitated extensive technological progress while significantly affecting the economic growth and social development of countries around the world. Several innovations have been introduced via the use of IT, including the Internet of Things, high-performance integrated circuits, and cloud computing. IT has accelerated the development of productive social forces and improved the living quality of humans. However, IT has not provided productivity benefits or significant improvements in economic performance, leading researchers to doubt the business value of IT [1]. In 2017, Petr collected over 800 estimates of IT returns on investment from 70 studies and undertook a meta-analysis to examine the elasticity of IT output [2]. His empirical results showed that IT had an output elasticity of just 0.3%, which was smaller than the output elasticity determined 10 years earlier by applying the same method approximately 10 times [2]. Therefore, the economic value of IT investment may have been seriously overestimated. Furthermore, in their national-level study in 2005, Lee et al. revealed that IT promoted economic growth in developed countries but did not significantly influence economic growth in developing countries where a “productivity paradox” was observed [3]. However, their conclusion was disputed by other studies that argued that the “productivity paradox” could also be observed in developed countries, including Japan and Greece [4,5]. In 2014, Acemoglu et al. argued that the “productivity paradox” also existed in the United States, at least in its manufacturing sector [6]. In 2010, Lin et al. refuted the general argument that the IT “productivity paradox” had disappeared in developed countries and existed only in developing countries [7]. Therefore, the business value of IT and the “productivity paradox” (which may be observed in both developing and developed countries [8]) must be investigated in specific contexts.
As a result of its rapid economic development, China—the world’s largest developing country with the second largest economy in the world—is the largest IT market in the Asia–Pacific region [9]. However, whether IT investments promote China’s economic performance is still being debated by researchers and policymakers.
Due to their rapid social and technological progress and their challenges in implementing technological innovations, developing countries depend not only on R&D expenditures, but also on the introduction, absorption, and utilization of advanced technologies and on their own experiences to realize technological progress via the spillover effects of technologies on their economies [10]. However, the dynamic influences of foreign direct investment (FDI) and research and development (R&D) expenditure on the business value of IT have been neglected in the literature.
In addition, the existing studies have usually used empirical research methods to explore the impact of IT investment on economic growth. However, economic growth is driven by a variety of complex and interrelated influencing factors, so it is difficult to identify a causal relationship between IT investment and economic growth. In this study, we attempted to establish a partial adjustment model based on dynamic adjustment speed to determine the impact of IT investment on the quantity and quality of economic growth by comparing the changes in economic performance before and after the introduction of IT investment into the production process. Compared with existing research methods, this method can more comprehensively assess the economic value of IT.
Based on the assumption that FDI and R&D expenditures influence IT business value via adjustment speed, the dynamic influence of IT investment on the economic performance of China is empirically tested in this study and used as a basis for examining the IT “productivity paradox”. The rest of this paper is organized as follows: Section 2 reviews the literature on the business value of IT and proposes a partial adjustment theory as the theoretical foundation of this work; Section 3 describes the partial adjustment model based on dynamic adjustment speed, proposes the method for measuring the business value of IT, and describes the sources of data; Section 4 empirically analyzes the influences of IT, FDI, and R&D expenditures on economic performance in order to estimate the business value of IT; and Section 5 discusses our findings and states our conclusions.
2. Literature Review
Technology has played an important role in generating new products and services, so technological progress, technological change, and technological innovation have become one of the core driving forces for economic growth [11]. In addition to the characteristics of other common technologies, IT promoted profound changes in the economic paradigm, including technology, management, and institutional systems thanks to its high economic permeability, innovation, and value-adding property. Therefore, IT has been largely invested in. The amount of investment in the IT industry has increased in the US since 1973; however, the growth in productivity has obviously decelerated, so people have begun to doubt the business value of IT technology [1]. The phenomenon that investments in IT reduce productivity rather than improve it has been termed the “productivity paradox” [2]. In 2012, Chou et al. measured the economic performance of ICT production departments in 19 OECD countries and found that the IT department contributed much more to the total productivity than other departments, which affirmed the business value of IT [12]. In 2000, Dewan S. and Kraemer K. L. argued that the rates of return on IT capitals in developed countries were significantly positive while those of non-IT capitals were not in line with their investment shares [13]. This situation greatly contrasted with the case in developing countries where IT did not yield any economic benefits. This finding echoed the conclusions of Lee S. T. et al. in 2005, who found that IT investment promoted economic growth in developed and industrialized countries but not in developing countries [3]. This argument may be intuitively ascribed to a poor IT infrastructure, backward education, low human capital, and the business patterns of these developing countries, which have not yet transitioned from industrialization to informatization.
However, studies on the business value of IT in developing countries have not produced the same findings. For instance, in 2006, André H. et al. studied the influences of IT on the economic growth of five Latin American countries and found that IT had a very weak effect on economic growth and that physical capital was the main driver for economic growth in these countries [14]. In 2016, Abdul A. E. and Deb K. D. examined the role of IT in driving the economic growth of India after 1980 and found that IT promoted the Indian economy by increasing its investments and total productivity [15]. In 2014, Alma M. and Elina G. S. analyzed the correlation between IT development and labor productivity in 27 EU nations and found that IT did not influence the labor productivity of several countries, such as Ireland, Luxembourg, Sweden, the UK, and Malta [16]. In 2002, Colecchia and Schreyer compared the impacts of ICT capital accumulation on output growth in nine countries and found that ICT contributed an economic growth at a rate from 0.2 to 0.5 percentage points per year before 1990; however, during the second half of the 1990s, the rate rose from 0.3 to 0.9 percentage points per year. The impacts of ICT on economic growth were different for different countries [17]. Some studies also revealed that the “productivity paradox” was not common and could be observed in either developed countries or developing countries [7,18]. Therefore, the business value of IT must be studied in a specific country.
Moreover, the business value of IT cannot be entirely estimated by IT itself; its value should be also considered as an outcome of the interactions among numerous intermediary factors (variables). The business value of IT can be influenced by many factors at the microscopic level ranging from business process re-construction, total quality management [19], enterprise scale [20], organizational factors [21], IT management practices (IT investment evaluation), and executives’ perceptions [22], to strategic alignment [23], as well as on the macroscopic level, such as yields on government bonds, per capita consumption, international trade, the unemployment rate, and the inflation rate [8]. However, FDI and R&D expenditures, which have an important role in promoting IT value, have been rarely mentioned in the existing literature.
The measurement errors in production inputs and outputs are considered a critical reason for the “productivity paradox” problem. Since traditional empirical approaches mainly rely on economic growth models to measure the impacts of IT investments on output, different methods will produce different findings, such as different statistical calibrations on output and input, the choice of different production functions, and different methods for applying parameter estimation [24,25]. Furthermore, previous studies on the business value of IT and the “productivity paradox” problem have produced many confusing and conflicting results, as they have mainly focused on complex and confusing measurement methods and standards for those factors such as productivity [13], Tobin’s Q value [26], return on assets [27], and production efficiency [8].
In sum, those studies have analyzed the business value of IT and the “productivity paradox” problem from different aspects, and those studies may produce some useful references for the formulation of IT strategies. However, the standards employed in these studies to measure the business value of IT were somewhat confusing. Some research frameworks were not systematic enough; or some studies had a lack of solid economic foundations; or they neglected the dynamic influences of FDI and R&D expenditures on the business value of IT, which led to conflicts in their findings.
The proposed dynamic adjustment speed method was grounded on solid economic theories, including the partial adjustment theory and the production theory. The method was employed to devise a performance measurement tool that could demonstrate economic significance and could also be used in the manufacturing or service industries. The tool can also easily produce a relatively accurate estimate, and it can be served as a useful reference for studying the business value of IT. A dynamic adjustment velocity model considering the influences of FDI and R&D expenditures was eventually developed. By taking economic performance as a criterion for judging the “productivity paradox”, this study empirically investigated the impacts of IT on the economic growth of China as well as the individual and combined effects of FDI and R&D expenditures on the adjustment speed of economic growth.
3. Methodologies
3.1. Partial Adjustment Approach with Dynamic Speeds
The economic value of IT refers to the improvement of the economic performance of a country or a region with traditional industries through the development of an IT strategy and investment, the promotion of technological innovation ability, the upgrading of the industrial chain, and the reconstruction of the value chain. In 2010, Lin W. T. et al. proposed a measurement approach that applied the traditional partial adjustment theory to examine the economic value of IT [7]. Different from other index-based performance measurement methods, this approach designed the variables with the same monetary units of a certain economic significance. As a parameter estimation method, this approach could also be used to effectively explore the quantitative relationships among variables. The partial adjustment speed method suggested that during the economic growth stage, the present value input by production factors influenced the future expected economic growth value, which can be expressed as:
where was an expected optimal economic growth value determined by the optimal combination of input production factors, was the input quantity of production factors, was the proportion of factor inputs in the optimal combination, and were the actual variable quantities of economic growth, and the value obtained by deducting from denoted the deserved increment of economic growth according to the optimal production. Constrained by several factors (e.g., technology, environment, and institution), the actual increment in economic growth could only reach one part of its expected optimal values. In this case, only a partial adjustment could be realized, so it was called the partial adjustment model. In (1), denoted the partial adjustment speed, which was equal to 1 if the actual economic increment reached the expected optimal increment. However, given that achieving the expected optimal increment was impossible, assuming that seemed reasonable.
The above partial adjustment model assumed that the partial adjustment speed was constant. In other words, the proportion occupied by the annual actual economic increment in the expected optimal increment does not change. Moreover, considering that the factor inputs () varied over years, the expected optimal values that could be reached in these years also differ. In this case, the assumption that was constant was unreasonable. To address this defect, national characteristics were introduced in the partial adjustment model as factors that influenced the partial adjustment speed (i.e., ). The dynamic partial adjustment model was then constructed as follows:
where , and represented the dynamic adjustment speed, national characteristics, and vector of unknown coefficients, respectively. was assumed to be normally distributed according to .
If and were the estimators of and , The estimated performance value () was represented by
denoted the economic performances with monetary units. To facilitate comparisons of this proposed performance value () measure, the performance measure could be transformed into a ratio or index concept by dividing the performance value by the relevant observed output (denoted by in the Cobbs–Douglas (CD) production function) that is . In this way, the monetary performance value was converted into the index and ratio concepts’ value [28].
In order to calculate the mean of the sample statistical period, the average dynamic adjustment speed () equaled and the average value () equaled .
3.2. National Characteristics and Model Building
Previous studies suggested that the influences of IT on performance were not independently realized but are regulated by numerous intermediary factors or variables. From the national macroscopic level, some adjustment variables between IT inputs and economic outputs, namely, national characteristics [8], could affect IT operating efficiency and subsequently influence economic outputs. These studies also suggested that by contributing to technology transfer and diffusion, FDI played a critical role in the economic development of host countries, and it could significantly promote their economic growth [29]. However, Duasa rejected this argument and found no strong evidence of a causal relationship between FDI and economic growth, and he raised some doubts about the assumption that FDI caused growth based on the results. The study, however, found that the causality between FDI and GDP was not closely related to each other [30]. This argument has been supported by some relevant studies [31]. R&D input is also considered an important factor that influences the speed of economic growth. In 2015, Bozkurt argued that R&D investments were of high priority for economic growth; meanwhile, the growth rate of GDP would increase by 0.2630% if R&D shares in the GDP increased by 1%, which highlights that R&D is an essential factor for sustainability [32]. In 2015, Brautzsch et al. added that R&D subsidization brought out the possible crowding-out effects, and it mainly played the role of fiscal policy, which later on also unfolded technological progress [33].
In this study, FDI and R&D expenditures were taken as the influencing factors of dynamic partial adjustment speed. When combined with the Cobbs–Douglas (CD) production function, the dynamic partial adjustment model could be established as follows:
- Model 1: Two-factor production function, assuming
- Model 2: Three-factor production function, assuming
- Model 3: Two-factor production function, assuming
- Model 4: Three-factor production function, assuming
- Model 5: Two-factor production function, assuming
- Model 6: Three-factor production function, assuming
- Model 7: Two-factor production function, assuming
- Model 8: Three-factor production function, assuming
These partial adjustment models can be used to analyze economic performances under different circumstances. Models 1 and 2 ignored the effects of FDI and R&D expenditures on economic performance. However, unlike Model 1, the IT factor was added in Model 2. Obtained by using the established performance measurement tool, the comparison results of these two models highlighted the influences of IT on economic performances without national characteristics. Meanwhile, the comparison results for Models 3 and 4 and those for Models 5 and 6 reflected the changes in economic performances under the combined effects of IT and FDI and those of IT and R&D expenditure, respectively. The comparison results for Models 7 and 8 reflected the changes in economic performances under the combined effects of IT and R&D expenditures and FDI as well as the complementary or substitution effect of FDI and R&D expenditures. Among these models, Models 1 and 2 were classified as linear models that are estimated by using the linear least-square method, while Models 3 to 8 were classified as nonlinear models that were estimated by using the nonlinear least-square method.
3.3. Data Description and Resources
The main variables in this study included three production factors (i.e., physical, human, and IT capitals), two national-level characteristics (i.e., FDI and R&D expenditures), and economic output. (1) Economic output was expressed by GDP; (2) physical capital was expressed by the values obtained after deducting IT hardware expenditure, IT software expenditure, and office equipment from the national fixed capital formation; (3) human capital was expressed by the value obtained after deducting staff cost in the IT industry from the gross wages (including the payroll of state-owned units, urban collective units, and other units) and was converted into USD100 million according to the current exchange rate; (4) IT capital was computed as total IT expenditure +3 × staff cost in the IT industry [26,34]; (5) FDI was converted into USD100 million according to the current exchange rate; and (6) R&D expenditure was computed as the internal expenditure of national R&D development. The data for these variables were transformed into millions of USD. To eliminate heteroskedasticity, the above variables are in a logarithmic form in Models 1–8.
Since 2000, China has started to lay out the field of information technology. Information and network technologies have gradually penetrated into various fields, and the information industry has become an important pillar of China’s national economy. Due to data resources, the data of all the samples in this paper are from 2000 to 2017, which fully reflects the dynamic relationship between information technology investment and economic growth in the rapid development stage of China’s information industry.
The data for fixed capital formation and GDP were derived from the China Statistical Yearbooks published from 2003 to 2018. The data for staff cost in the IT industry and total IT expenditure were obtained from the China Information Industry Yearbooks published from 2013 to 2017 and from Digital Planet 2008: The Global Information Economy (for 2000 and 2001). The data of FDI and R&D expenditures were obtained from the China Science and Technology Statistical Yearbooks published from 2001 to 2018.
4. Results Analysis
4.1. Coefficient Estimates of the Models
The EVIEW 6.0 software was used to estimate all eight models, and the estimated results are presented in Table 1. Moreover, the influencing factors of partial adjustment speed, namely FDI and R&D expenditures, were both significant at the 1 or 5% levels, which suggested that the partial adjustment speed was not fixed and that both FDI and R&D expenditures have significant influences on adjustment speed. In addition, with the introduction of national characteristics, the fitting R2 degree of the model was also gradually improved when the national characteristics were not considered. The fitting R2 degrees of the two- and three-factor models were 0.696 and 0.697, respectively. When FDI and R&D were simultaneously considered, the fitting R2 degrees of the two- and three-factor models were 0.821 and 0.843, respectively. This showed that the introduction of national characteristics improved the explanatory power of the model, and showed that the national characteristics had a significant impact on the adjustment speed. Furthermore, the fitting R2 degree of the model in this study was above 0.697, which reflects the scientificity and rationality of the model constructed in this research.

Table 1.
Coefficient estimates of Models 1 to 8.
The adjustment speeds of Models 1 and 2 reflected the constant adjustment speed when the national characteristics were not considered. When only two production factors were present, the constant could be understood as a self-adjustment speed. Meanwhile, when the influence of external variables was not considered, the self-adjustment speed () was 0.632. When IT was added to the economic system, the adjustment speed () decreased to 0.631, which indicated that IT decelerates the adjustment speed of economic growth. In Models 3 and 4, the adjustment speed becomes dynamic due to the introduction of national characteristics, but the addition of IT also changes the extent of influences of national characteristics on the adjustment speed. According to the estimated results in Model 3, the elasticity coefficient for the influence of FDI (LnFDI) on adjustment speed was 0.498 under two factors and was significant at the 5% level, suggesting that FDI significantly and positively promoted the adjustment speed of economic growth. When FDI increased by 1%, the adjustment speed increased by 0.498%. When IT capital was introduced in Model 4, the pulling effect of FDI on economic growth speed remained positive and significant, while the coefficient for the influence of FDI (LnFDI) on adjustment speed increased to 0.808, thereby suggesting that IT strengthened the pulling effect of FDI on the economic growth speed and that both IT and FDI had certain complementary effects on adjustment speed. The estimated results in Model 5 indicated that when only physical and human capitals were present, the coefficient for the influence of R&D expenditure (lnR&D) on adjustment speed was 0.156 and significant at the 1% significance level, thereby verifying that R&D expenditure significantly and positively promoted economic adjustment speed. When R&D expenditure increased by 1%, the adjustment speed will increase by 0.156%. Meanwhile, the self-adjustment speed of the economic system was significantly negative at −0.541; after introducing IT capital in Model 6, the coefficient for the influence of R&D expenditure (lnR&D) on adjustment speed increased to 0.175, thereby suggesting that IT strengthened the pulling effect of R&D expenditure on economic adjustment speed and that both IT and R&D expenditures had certain complementary effects on adjustment speed. However, these results changed when the effects of FDI and R&D expenditures on adjustment speed were simultaneously considered. When IT factor was not considered, the influence of FDI on adjustment speed was not significant while that of R&D expenditure was significantly positive. The influence elasticity (lnR&D) was 0.246, which was significant at the 1% level. In the three-factor Model 8, the elasticity coefficient of FDI was still insignificant while that of R&D (lnR&D) decreased to 0.230, thereby verifying the substitution effects between IT and R&D and complementary effects between FDI and R&D expenditures.
The estimated results of the Cobbs–Douglas (CD) production function revealed that physical capital significantly contributed to economic growth across all established models possibly because China is currently in an economic structural transition period when the domestic economy tends to be stable with a high dependence on physical capital. Therefore, the hypothesis that the relative status of physical capital declines in the economic growth process is not completely applicable to China.
Meanwhile, the elasticity coefficient of human capital to economic growth was not significant in all models, which was possibly caused by many factors such as the severe inequality in the level of higher education [35], the increase in people’s life expectancy, the acceleration of population aging, the shrinking working-age population, the decreasing fertility rate in China [36], and the gradual disappearance of its long-term demographic dividend. Therefore, China’s economic growth depends on the continuous improvement of the quality of laborers where human capital can promote economic growth. Meanwhile, after IT entered the production process, the elasticity coefficient of physical capital generally increased, thereby suggesting that IT strengthened the contribution of physical capital to economic growth and that both IT and physical capital were complementary resources to a certain degree, thereby verifying the conclusion drawn by Hitt and Snir in 1999 [37].
In the partial adjustment Model 2, the promoting effect of IT on economic growth was not obvious under a constant adjustment speed. However, when FDI was considered, the influence of IT on economic growth was significant. The IT elasticity coefficient (lnI) was 0.537, which was significant at the 10% level. In Model 6, after adding R&D expenditure to the production system, the elasticity coefficient of IT (lnI) to economic growth was 0.877 at the 1% significance level, thereby suggesting that R&D expenditure could influence the contribution of IT to economic growth. In Model 8, when FDI and R&D expenditures were both considered, the IT elasticity coefficient (lnI) was 0.475 and significant at the 10% level, thereby suggesting that FDI, IT and R&D expenditures had mutual influences as important channels for an international technology spillover.
4.2. Economic Performance of IT without the Effects of FDI and R&D Expenditures
According to the estimated results of Models 1 and 2, when the influences of national characteristics were not considered, the adjustment speeds of the two- and three-factor models were 0.632 and 0.631, respectively. Based on these adjustment speeds, Table 2 presents the expected output of the two- and three-factor models, the two economic performance values ( and ), and the average performance value APR in the statistical period.
Table 2.
Patterns of the performance measure with and without IT: constant adjustment speeds.
According to Formula (3), economic performance depends on two factors, namely, the partial adjustment speed and the expected economic growth, and that multiplying these two factors determines economic performance. As can be seen from the PV values with monetary units, similar to the gradual increase in the production factors, the expected economic growth steadily rose. The expected economic growth gradually increased from 13.86 in 2000 to 16.47 in 2017 under the two-factor model and it increased again from 13.88 to 16.48 during the same period under the three-factor model. Therefore, from a vertical scale, economic performance showed a steady increasing tendency, which is in line with the actual situation in China.
To describe the economic value of IT and the “productivity paradox” problem, PV value was converted into PR values of index and ratio. The PR changes that were driven by the entry of IT in the production process were then horizontally compared. For instance, PR value was 0.632 with two factors in 2000. When the IT factors were added, the PR value decreases to 0.631. This phenomenon has also been observed in the subsequent years, thereby suggesting that the addition of IT drove the decline in economic performance. If the average value was taken, then the APR value decreased by about 0.158% from 0.635 to 0.634 within 18 years, which suggests that the IT “productivity paradox” phenomenon exists in China. This conclusion is similar to the one drawn by Zhang et al. from an entirely different set of data in 2019. Moreover, while this study applied a partial adjustment approach with different speeds of adjustment to investigate the business value of IT, the productivity paradox, and the relations of complementarity and substitution among three input factors (K, L and I). In this case, the productivity paradox may exist in a country regardless of whether it has a developed or developing economy; the relationship between traditional and IT capital and between traditional labor and IT capital differ from country to country [18].
4.3. Economic Performance of IT with Effects of FDI or R&D Expenditure
The above-mentioned value of IT and economic performance without the effects of FDI and R&D does not consider the influences of national characteristics on economic performance and assumes that the adjustment speed is constant while the change in economic performance mainly depends on the expected economic growth. However, in the IT economic performance model under the individual effects of FDI or R&D expenditures, the change in economic performance was jointly influenced by the change in adjustment speed caused by FDI or R&D expenditures and expected economic growth. Therefore, given the dynamic changes in adjustment speeds and expected economic performance, economic performance (PR) also showed a dynamic changing tendency. In order to analyze the changes in adjustment speeds and economic performance after IT entered the production system under the effects of national characteristics, Figure 1 and Figure 2 present the changing trend when the FDI and R&D expenditures of two-factor adjustment speed and economic performance as well as those of three-factor adjustment speed and economic performance are considered, respectively.

Figure 1.
FDI as a national characteristic.
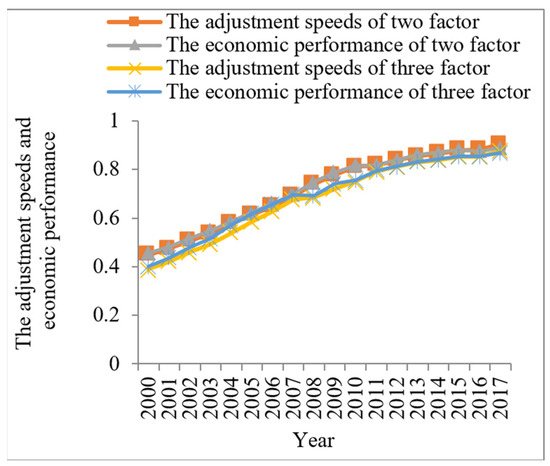
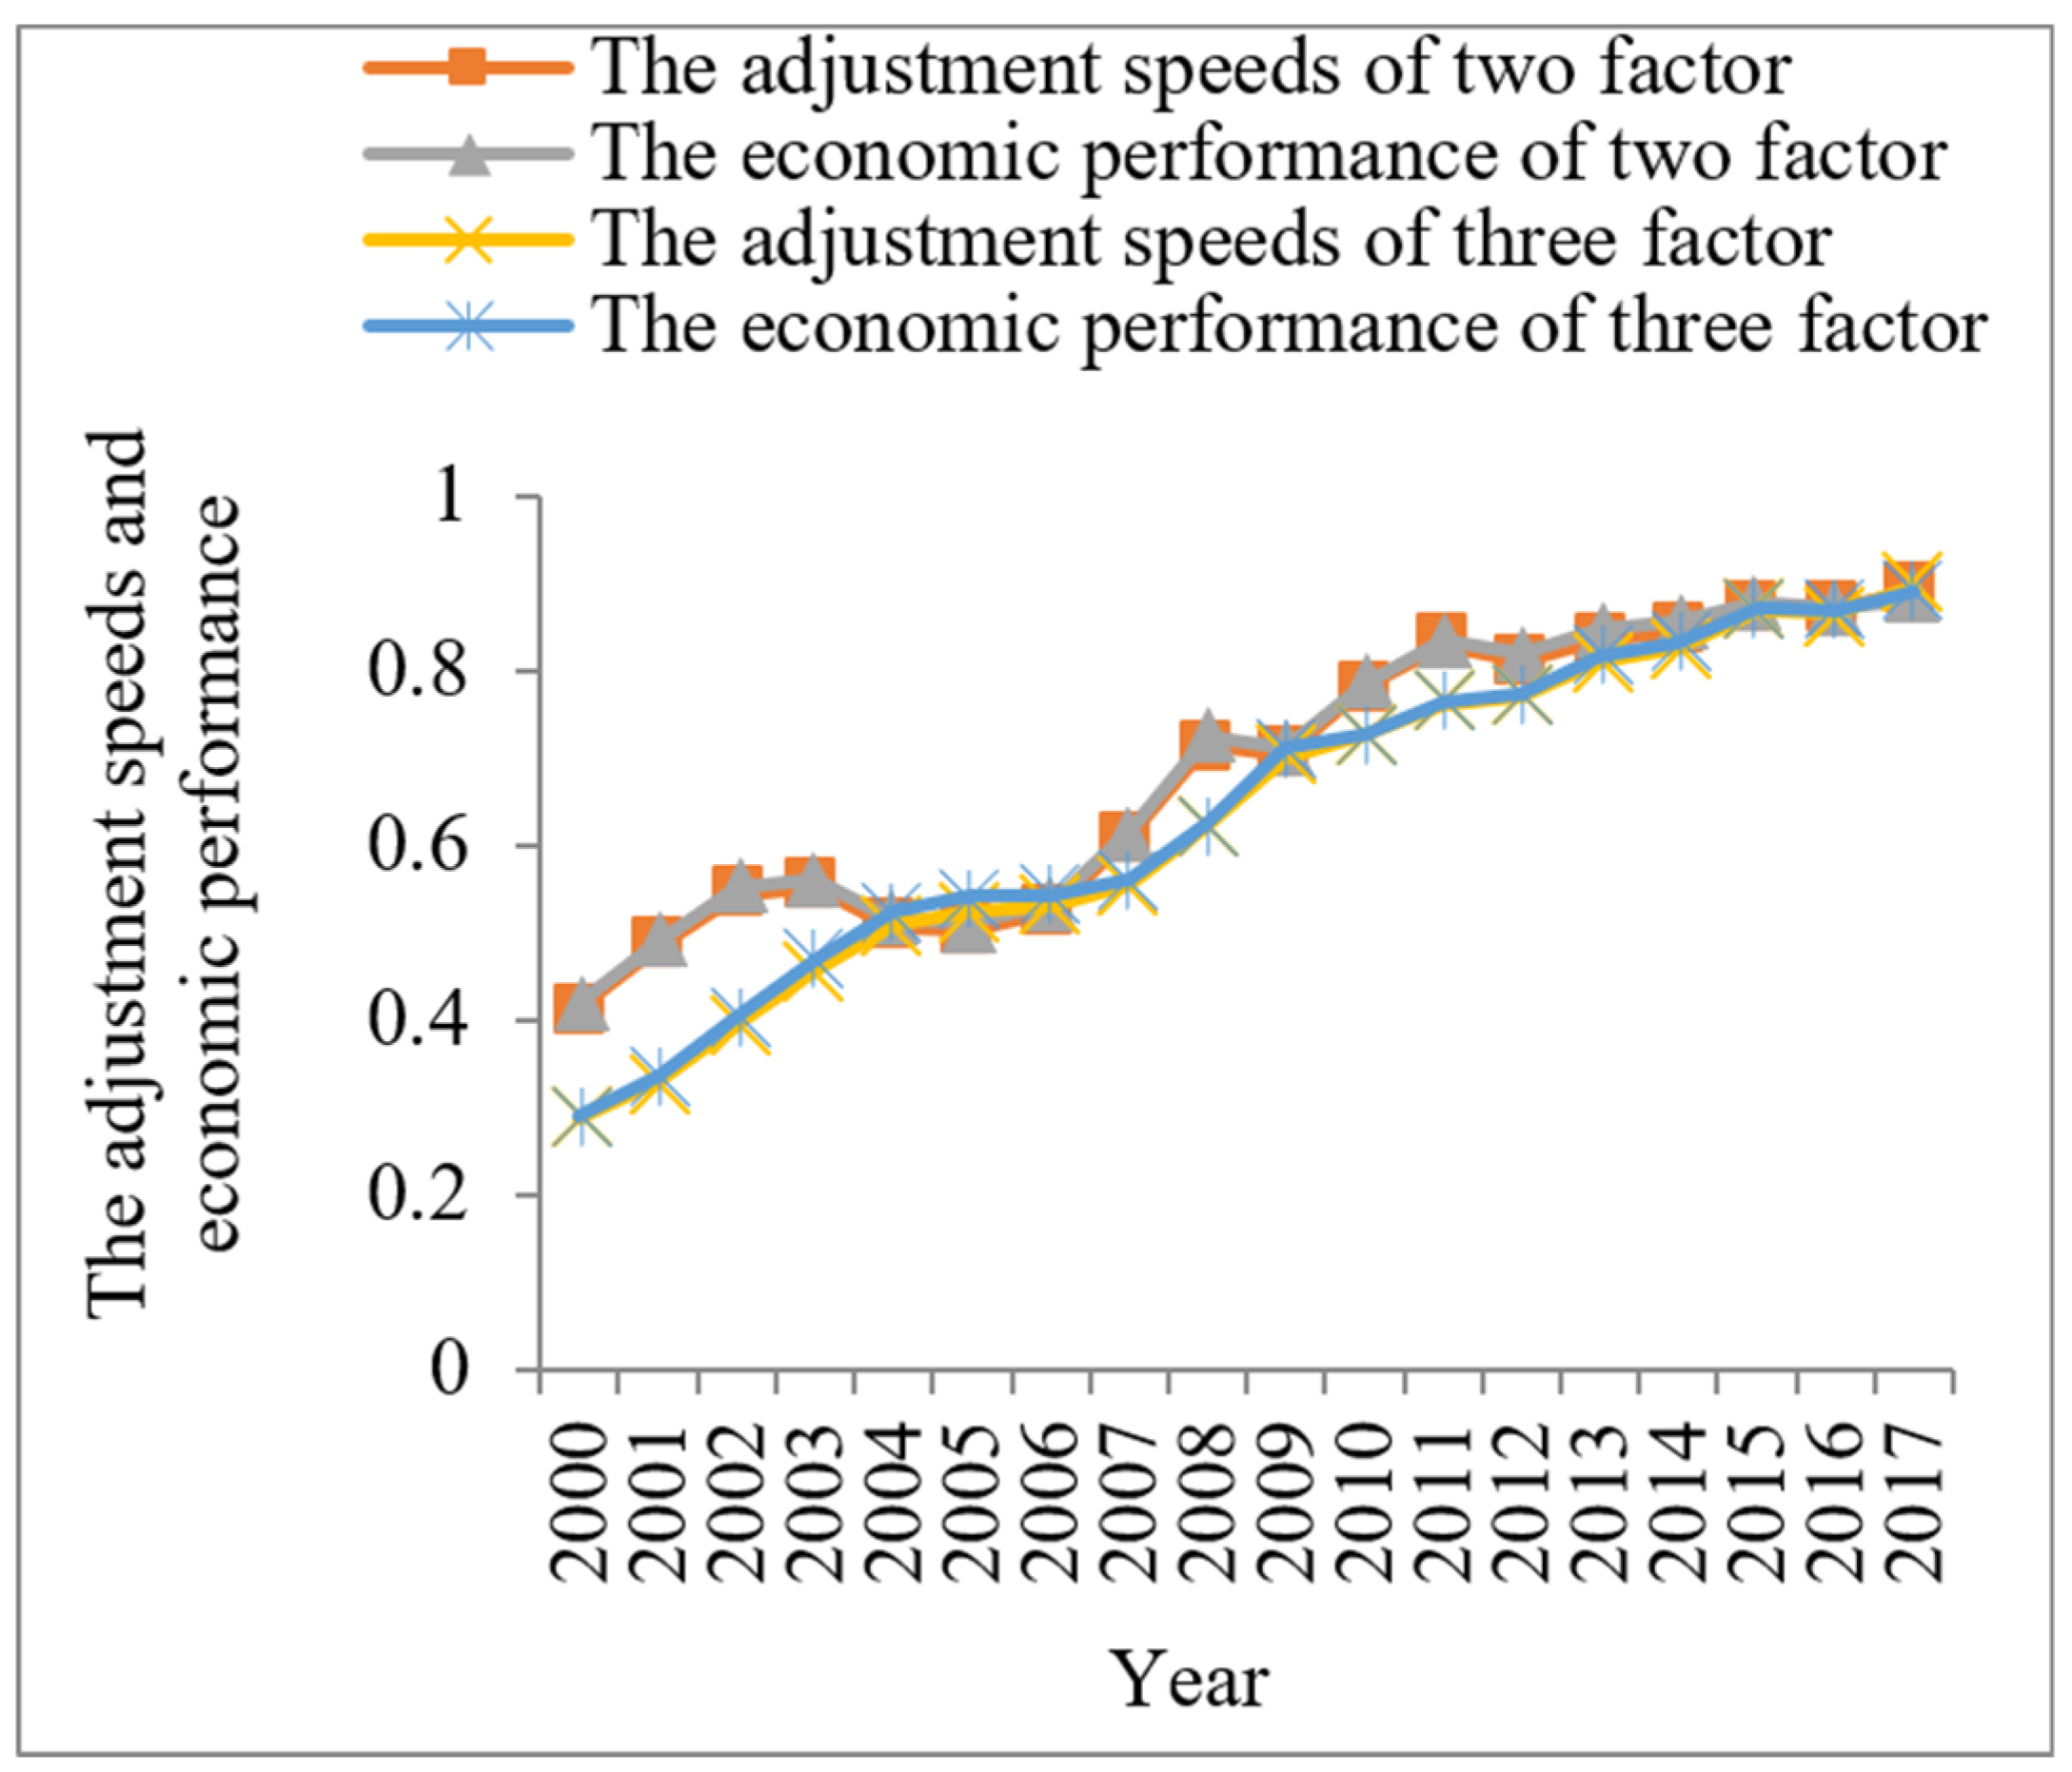
Figure 2.
R&D expenditure as a national characteristic.
As shown in Figure 1, the adjustment speed of the economic system and economic performance showed similar tendencies. The two-factor adjustment speed overlapped with two-factor economic performance, and the same could be observed for the three-factor adjustment speed and three-factor economic performance as verified in Figure 2. This finding could be ascribed to the fact that the ratio of the expected optimal and actual economic growth () is one or near one. This finding also identified partial adjustment speed as a main driver of improved economic performance. Therefore, the importance of national characteristics was embodied. In addition, under the FDI-dominated adjustment speed condition, the two-factor economic performances in 2004, 2005, 2006, 2009, and 2017 are 0.516, 0.513, 0.534, 0.712, and 0.884, respectively, which are slightly smaller than the corresponding three-factor economic performances 0.527, 0.543, 0.545, 0.713, and 0.884, respectively. These results contradicted those observed for the other years where the two-factor economic performances are larger than the three-factor performances. In terms of average values, compared with the situation where IT was absent, the change in APR from 0.691 to 0.643 meant that IT reduced economic performance as a production factor. This finding echoed the conclusion drawn from the partial adjustment model under a constant adjustment speed. As shown in Figure 2, in consideration of the influences of R&D expenditure, the adjustment speed and economic performance under the two-factor circumstance were always higher than those under the three-factor. From 2000 to 2017, the average economic performance (APR) decreased by about 4.07% from 0.720 to 0.691. In sum, the “productivity paradox” phenomenon exists in China, even if FDI is taken as a national characteristic. FDI and R&D expenditures also do not address the decline in economic performance as driven by IT.
However, the national characteristics strengthen economic performance. When these characteristics were not considered, the two- and three-factor economic performances were 0.635 and 0.634, respectively. When the effect of FDI as a national characteristic was considered, these values increased to 0.691 and 0.643, respectively. Meanwhile, when the effect of R&D expenditure as a national characteristic was considered, these values increased further to 0.720 and 0.691, respectively. These values were larger than their counterparts without FDI and R&D expenditures, thereby suggesting that the selected national characteristics strengthened economic performance and that the promoting effect of R&D expenditure on economic performance was greater than that of FDI.
4.4. Coefficient Estimates of the Models
Table 3 presents the estimated economic performances under the joint effects of FDI and R&D expenditures. The PR values for both the two- and three-factor situations showed a steadily increasing tendency, which suggested that the economic performance was favorable and benefited from the production factors.
Table 3.
Patterns of the performance measure with and without IT: dynamic adjustment speeds considering FDI and R&D expenditures.
A comparison of the PR values before and after the entry of IT in the production process revealed that IT contributed to an improved economic performance from 2000 to 2010 under the joint effects of FDI and R&D. However, in the following seven years (2011 to 2017), the introduction of IT resulted in a decline in economic performance as well as a “productivity paradox”. In sum, the average economic performance APR decreased by 2.635% from 0.683 to 0.665, thereby reconfirming the existence of an IT “productivity paradox”.
A comprehensive analysis of the influences of FDI and R&D expenditures, and IT on economic performance revealed that the economic performance values under the two-factor circumstance were 0.635, 0.691, 0.720, and 0.683 when national characteristics were not considered, when FDI and R&D expenditures were separately considered, and when FDI and R&D expenditures are simultaneously considered, respectively. The following conclusions could be drawn from these results: (1) R&D expenditure offered the highest contribution to economic performance, followed by FDI. The economic performance values under the joint effect of FDI and R&D expenditures was higher than when the national characteristics were not considered, but lower than under the individual effects of national characteristics. In other words, FDI and R&D expenditures had a substitution effect in promoting the business value of IT. A similar situation was observed in the three-factor circumstance but not in the two-factor. (2) The IT factor changed the joint effect of FDI and R&D expenditures on economic performance, and the performance value under the individual effect of FDI was higher than that under the individual effect of R&D expenditure. In other words, under the influence of IT on economic performance, FDI and R&D expenditures demonstrated a substitution effect.
5. Discussion
The above empirical test results verified that the expected optimal economic growth was impossible to reach and only a partial adjustment could be realized. The partial adjustment speed was not fixed but influenced by national characteristics. On the one hand, the change in FDI and R&D expenditures drove a dynamic change in the adjustment speeds. On the other hand, as a production factor, IT changed the expected economic output. These two factors interacted with each other to realize the business value of IT.
The findings of this work indicated that IT decreased economic performance and that a “productivity paradox” exists in China. As mentioned earlier in the paper, economic performance depends on the adjustment speed of the economy and the expected output caused by factor input. In recent years, the average economic growth rate in China was 10% from 2000 to 2013, and then began to decline from 7.77% in 2013 to 6.95% in the sample deadline of 2017, indicating that the adjustment speed of China’s economy had progressively slowed, from focusing on speed to focusing on quality. On the other hand, in recent years, China has increasingly emphasized the transformation of the economic growth mode from factor- to innovation-driven, and it paid more attention to ecological protection and sustainable development, so its actual economic output was lower than expected. These two aspects are accompanied by the rapid growth of information technology investment. The informatization strategy has proposed by China means that limited resources are invested in the field of information technology innovation. At present, China has embraced the stage of Internet promoting industrial transformation. During the process, information technology investment has reduced the speed of economic adjustment and expected economic output. The economic value of China’s information technology needs to be tracked for a long time. This conclusion is like those of previous studies, which highlights an obvious “digital divide” between developing and developed countries [38]. Realizing the business value of IT requires certain hardware and complementary resources, such as a high-quality human capital, an effective management support, and a good market environment. Although China has recently increased its investments in IT, its related IT infrastructure is far from perfect while its IT resource management efficiency needs improving. Therefore, the country’s investments in IT offer only minor contributions to productivity growth. To realize the business value of IT, developing countries should consolidate their IT infrastructure, enhance their IT management efficiency, and create a benign market environment. Moreover, China’s economic development is spatially uneven. Specifically, its eastern region has a perfect economic infrastructure and an efficient public management system, while its central and western regions have a very poor economic infrastructure. Therefore, IT positively promoted productivity in the eastern region but is negatively correlated with productivity in the central and western regions. On the whole, IT has a negative influence on productivity in China [39]. Moreover, IT has become a fundamental technology and non-strategic resource, while IT investments aggravate the economic burdens of enterprises and they also bring about huge challenges in their business patterns, the HR management, the process management, and the cost management. According to Dedrick et al. in 2003, technology is never a scarce resource; what is scarce is the ability to use technologies to promote management, to reform organization and to create business value [40].
With regard to the relationships of national characteristics with adjustment speed and economic performance, the findings of this study provide an empirical basis for improving the business value of IT. Previous work on IT business values are usually restricted to IT itself. Meanwhile, this study indicated that IT was not the only way to improve economic performance. National characteristics could also be used to increase the adjustment speed and subsequently improve economic performance, and this conclusion is of great significance for policymakers in their implementation of IT strategies. Policymakers can encourage local governments, state-owned enterprises, and research institutes to be engaged in IT research and development and product production by formulating various development plans and policies and measures related to IT and encourage private enterprises to increase their IT investments. Therefore, policymakers can boost the development of IT and enhance the economic value of IT by creating a good external environment. R&D expenditure, FDI, and IT are currently the three main tools for China to acquire technology spillovers. All these factors also have a significantly positive promoting effect on the technological progress of China. However, the relationships among these factors have been rarely studied, especially the influences of R&D expenditure and FDI on the business value of IT in China. The findings of this work showed that the loss of business value caused by IT can be compensated for through R&D expenditure and FDI. FDI has diversified features in spillover channels within an international scope. Specifically, the host country can realize technological progress and upgrade its industrial structure by acquiring intellectual resources and management systems from the home country [41]. FDI can also promote the technological progress of the host country. It can also optimize its industrial environment, and it can provide a platform for IT to enhance its business value. Meanwhile, R&D expenditure can significantly improve the R&D capabilities of colleges, universities, scientific research institutions, and the IT industry to establish a relational network in this industry, thus realizing the business value of IT. Therefore, China should promote cooperation and exchange of the IT industry with colleges, universities, and scientific research institutions by issuing incentive policies.
IT has always been regarded as an important path to economic growth, especially for developing countries. Although IT can lead to a decline in economic performance, which verifies the existence of a “productivity paradox” phenomenon in China, this technology can still significantly promote economic growth in China when the influences of FDI and R&D expenditures are taken into account. An important mechanism for IT to promote economic growth is the substitution effect of IT hardware and software capitals on other capitals. For instance, as the comparable prices of integrated circuits continuously drop, information communication devices generate a substitution effect on other capitals to accelerate the capital deepening process of the economy. In recent years, the substitution effect of IT capital on other capitals has gradually weakened, yet it continues to promote economic growth [42]. Another important mechanism for IT to promote economic growth is its permeation effect. With the extensive use of IT, economic agents can easily have access to production, information, knowledge, market intelligence, and far-reaching markets via cloud computing service, big data analytics, the Internet, enterprise resource planning, and other digital platforms, which provide new opportunities for foreign investors to gain a higher return on their investment. [43]. The IT industry has also become an important industrial sector in China. The development of this industry will increase the demand for laborers and influence the income distribution structure of labor forces, thereby promoting economic growth in China.
6. Conclusions
Based on macroscopic economic data for physical, human, and IT capitals as well as for the FDI and R&D expenditures in China between 2000 and 2017, this work empirically investigated the business value of IT and the “productivity paradox” problem in China before analyzing the dynamic influences of FDI and R&D on the business value of IT. The following conclusions were drawn from the findings:
FDI and R&D expenditures significantly influenced the partial adjustment speed. As the annual investments in FDI and R&D expenditures differed from one year to another, the adjustment speed of economic performance also followed a dynamic changing process. Although the addition of IT can promote the economic performance in some periods, in terms of APR in the statistical period, the economic performance decreased, thus the IT “productivity paradox” phenomenon exists in China.
FDI and R&D expenditures could not only promote economic growth in China but could also improve its economic performance. The promoting effect of R&D expenditure on the business value of IT is stronger than that of FDI, while national characteristics strengthened the economic value of IT. IT could effectively improve economic value and performance if the national characteristics were reasonably controlled. The economic value of IT and the “productivity paradox” phenomenon presented a complex problem for China. Studies on IT must not be restricted to IT itself. It could also be studied from certain variables, including macroscopic policies, industrial coordination, and technology progress, as well as their relationships.
Although the empirical results indicated that an IT “productivity paradox” exists in China, this finding did not indicate that IT has no promoting effects on economic growth. An extensive application of IT is an important path for technology spillovers. The complementary and substitution effects between IT and national characteristics could also influence the measurement of the economic value IT. As the investments in IT continue to increase, more importance should be ascribed to the crowding-in effect of FDI and knowledge transfer in the R&D process.
The main contributions of this study lie in its analysis of the influences of FDI and R&D expenditures on the business value of IT, its establishment of functional relationships between national characteristics and adjustment speed by employing dynamic partial adjustment speed models, and its usage of economic performance as a criterion to measure the business value of IT, thus providing a reference for analyzing the IT “productivity paradox”. This study also verified that the realization of the business value of IT was not solely completed by IT but was also closely related with FDI and R&D expenditures. The main limitation of this study could be attributed to the fact that the realization of IT business value is a complex process and a product of the effects of several factors. Although FDI and R&D expenditures can significantly influence the business value of IT, the concrete influence mechanism was not investigated in this paper. The influence mechanisms of new generation information technologies, including big data, mobile Internet, cloud computing, and Internet of Things, on productivity and economic growth are highly complex, which can be a promising research field on the “productivity paradox”.
Author Contributions
Z.Z.—formal analysis, investigation, methodology, and editing of the original draft. H.H.—study design. X.Z.—results analysis and method testing. Y.B.—data collection. All authors have read and agreed to the published version of the manuscript.
Funding
This work was supported by the National Natural Science Foundation of China (No. 72072144), Natural Science Basic Research Program of Shaanxi Province (No. 2021JQ-491), and the China Postdoctoral Science Foundation (No. 2018M633551).
Institutional Review Board Statement
Not applicable.
Informed Consent Statement
Not applicable.
Data Availability Statement
Not applicable.
Acknowledgments
The researchers would like to thank the National Natural Science Foundation of China, the Natural Science Basic Research Program of Shaanxi Province, and the China Postdoctoral Science Foundation.
Conflicts of Interest
The authors declare no conflict of interest.
References
- Solow, R. We’d Better Watch Out; New York Times Book Review: New York, NY, USA, 1987; Available online: http://www.standupeconomist.com/pdf/misc/solow-computer-productivity.pdf (accessed on 4 May 2022).
- Petr, P. The productivity paradox: A meta-analysis. Inf. Econ. Policy 2017, 38, 38–54. [Google Scholar]
- Lee, S.T.; Gholami, R.; Tong, T.Y. Time series analysis in the assessment of ICT impact at the aggregate level-lessons and implications for the new economy. Inf. Manag. 2005, 42, 1009–1022. [Google Scholar] [CrossRef]
- Harada, T. The IT Paradox and Its Economic Impacts on Japan; Program on US-Japan Relations; Harvard University: Cambridge, MA, USA, 2005. [Google Scholar]
- Martínez, D.; Rodríguez, J.; Torres, J.L. The productivity paradox and the new economy: The Spanish case. J. Macroecon. 2008, 30, 1569–1586. [Google Scholar] [CrossRef]
- Acemoglu, D.; Dorn, D.; Hanson, G.H.; Price, B. Return of the Solow Paradox? IT, Productivity, and Employment in US Manufacturing. Am. Econ. Rev. 2014, 104, 394–399. [Google Scholar] [CrossRef]
- Lin, W.T.; Chuang, C.H.; Choi, J.H. A partial adjustment approach to evaluating and measuring the business value of information technology. Int. J. Prod. Econ. 2010, 127, 158–172. [Google Scholar] [CrossRef]
- Chen, Y.H.; Lin, W.T. Analyzing the relationships between information technology, inputs substitution and national characteristics based on CES stochastic frontier production models. Int. J. Prod. Econ. 2009, 120, 552–569. [Google Scholar] [CrossRef]
- Lee, S.; Xiang, J.Y.; Kimb, J.K. Information technology and productivity: Empirical evidence from the Chinese electronics industry. Inf. Manag. 2011, 48, 79–87. [Google Scholar] [CrossRef]
- Can, M.; Doğan, B.; Değer, O. The Relationship between research & development investment expenditure, foreign direct investment and economic growth. J. Appl. Econ. Sci. 2017, 12, 58–62. [Google Scholar]
- Martina, B.R. The evolution of science policy and innovation studies. Res. Policy 2012, 41, 1219–1239. [Google Scholar] [CrossRef]
- Chou, Y.C.; Shao, B.M.; Lin, W.T. Performance evaluation of production of IT capital goods across OECD countries: A stochastic frontier approach to Malmquist index. Decis. Support Syst. 2012, 12, 173–184. [Google Scholar] [CrossRef]
- Dewan, S.; Kraemer, K.L. Information technology and productivity: Evidence from country-level data. Manag. Sci. 2000, 46, 548–562. [Google Scholar] [CrossRef]
- André, H.; Claudio, A.; Vianka, A. Information and communication technologies and their impact in the economic growth of Latin America, 1990–2013. Telecommun. Policy 2016, 40, 485–501. [Google Scholar]
- Abdul, A.E.; Deb, K.D. Information and communication technology and economic growth in India. Telecommun. Policy 2016, 40, 412–431. [Google Scholar]
- Alma, M.; Elina, G.S. Impact of information and telecommunication technologies development on labour productivity. Procedia-Soc. Behav. Sci. 2014, 110, 1271–1282. [Google Scholar]
- Colecchia, A.; Schreyer, P. ICT investment and economic growth in the 1990s: Is the United States a unique case: A comparative study of nine OECD countries. Rev. Econ. Dyn. 2002, 5, 408–442. [Google Scholar] [CrossRef]
- Zhang, Z.; Haiqing, H.; Winston, T.L. Analyzing the Impacts of Unobserved National Characteristics on Economic Performance of Information Technology based on a Partial Adjustment Approach With Dynamic and Variable Speed of Adjustment. J. Econ. Forecast. 2019, 1, 128–142. [Google Scholar]
- Loukis, E.; Pazalos, K. An empirical investigation of the moderating effects of BPR and TQM on ICT business value. J. Enterp. Inf. Manag. 2009, 22, 564–586. [Google Scholar] [CrossRef]
- Lin, W.T.; Shao, B.B.M. The business value of information technology and inputs substitution: The productivity paradox revisited. Decis. Support Syst. 2006, 42, 493–507. [Google Scholar] [CrossRef]
- Wiengarten, F.; Humphreys, P.; Cao, G. Exploring the important role of organizational factors in IT business value: Taking a contingency perspective on the resource-based view. Int. J. Manag. Rev. 2013, 15, 30–46. [Google Scholar] [CrossRef]
- Tallon, P.P.; Kraemer, K.L.; Gurbaxani, V. Executives’ perceptions of the business value of information technology: A process-oriented approach. J. Manag. Inf. Syst. 2000, 16, 145–173. [Google Scholar] [CrossRef]
- Tallon, P.P.; Kraemer, K.L. Investigating the relationship between strategic alignment and information technology business value: The discovery of a paradox//Creating business value with information technology: Challenges and solutions. IGI Glob. 2003, 1–22. [Google Scholar] [CrossRef]
- Yorukoglu, M. The Information Technology Productivity Paradox. Rev. Econ. Dyn. 1998, 1, 551–592. [Google Scholar] [CrossRef]
- Brynjofsson, E.; Hitt, L.M. Beyond computation: Information technology, Organizational Transformation and Business Performance. J. Econ. Perspect. 2000, 14, 23–48. [Google Scholar] [CrossRef]
- Mithas, S.; Rust, R.T. How information technology strategy and investments influence firm performance. Mis. Q. 2016, 40, 223–246. [Google Scholar] [CrossRef]
- Zhu, K. The complementarity of information technology infrastructure and e-commerce capability: A resource-based assessment of their business value. J. Manag. Inf. Syst. 2004, 21, 167–202. [Google Scholar] [CrossRef]
- Lin, W.T.; Kao TW, D.; Chou, C.C.; Sharman, R.; Simpson, N.C. The complementarity and substitutability relationships between information technology and benefits and duration of unemployment. Decis. Support Syst. 2016, 90, 12–22. [Google Scholar] [CrossRef]
- Alfaro, L.; Chanda, A.; Kalemli-Ozcan, S.; Sayek, S. FDI and economic growth: The role of local financial markets. J. Int. Econ. 2004, 64, 89–112. [Google Scholar] [CrossRef]
- Duasa, J. Malaysian foreign direct investment and growth: Does stability matter? J. Econ. Coop. Islamic Ctries. 2007, 28, 83–98. [Google Scholar]
- Chowdhury, A.; Mavrotas, G. FDI and growth: What causes what? World Econ. 2006, 29, 9–19. [Google Scholar] [CrossRef]
- Bozkurt, C. R&D expenditures and economic growth relationship in Turkey. Int. J. Econ. Financ. Issues 2015, 5, 188–198. [Google Scholar]
- Brautzsch, H.U.; Günther, J.; Loose, B.; Ludwig, U.; Nulsch, N. Can R&D subsidies counteract the economic crisis?–Macroeconomic effects in Germany. Res. Policy 2015, 44, 623–633. [Google Scholar]
- Shu, W.S.; Lee, S. Beyond productivity–productivity and the three types of efficiencies of information technology industries. Inf. Softw. Technol. 2003, 45, 513–524. [Google Scholar] [CrossRef]
- Heckman, J.J.; Yi, J. Human Capital, Economic Growth, and Inequality in China; National Bureau of Economic Research: Cambridge, MA, USA, 2012. [Google Scholar]
- Bairoliya, N.; Miller, R. Demographic transition, human capital and economic growth in China. J. Econ. Dyn. Control. 2021, 127, 104117. [Google Scholar] [CrossRef] [PubMed]
- Hitt, L.M.; Snir, E.M. The role of information technology in modern production: Complement or substitute to other inputs? In Workshop on Information Systems and Economics; 1999; Available online: http://plaza.ufl.edu/stefanie/accurate_response.pdf (accessed on 4 May 2022).
- Fong, M.W.L. Digital divide: The case of developing countries. Issues Inf. Sci. Inf. Technol. 2009, 6, 471–478. [Google Scholar]
- Chen, S.Y.; Zhen, X. Is China’s e-governance sustainable? Testing Solow IT productivity paradox in China’s context. Technol. Forecast. Soc. Change 2015, 96, 51–61. [Google Scholar] [CrossRef]
- Dedrick, J.; Gurbaxani, V.; Kraemer, K.L. Information technology and economic performance: A critical review of the empirical evidence. ACM Comput. Surv. 2003, 35, 1–28. [Google Scholar] [CrossRef]
- Archanun, K.; Juthathip, J. International Production Networks, Clusters, and Industrial Upgrading: Evidenc from Automotive and Hard Disk Drive Industries in Thailand. Rev. Policy Res. 2013, 30, 211–239. [Google Scholar]
- Gordon, R.J. The Rise and Fall of American Growth: The U.S. Standard of Living Since the Civil War; Princeton University Press: Princeton, NJ, USA, 2015. [Google Scholar]
- Arvin, M.B.; Pradhan, R.P.; Nair, M. Uncovering interlinks among ICT connectivity and penetration, trade openness, foreign direct investment, and economic growth: The case of the G-20 countries. Telemat. Inform. 2021, 60, 101567. [Google Scholar] [CrossRef]
Publisher’s Note: MDPI stays neutral with regard to jurisdictional claims in published maps and institutional affiliations. |
© 2022 by the authors. Licensee MDPI, Basel, Switzerland. This article is an open access article distributed under the terms and conditions of the Creative Commons Attribution (CC BY) license (https://creativecommons.org/licenses/by/4.0/).