1. Introduction
Consumption has increased rapidly worldwide as economies and industries have expanded and developed [
1]. There is significant concern regarding the detrimental effects that this phenomenon has had on the environment [
2,
3]. The reason for this concern is that there are no such things as perfectly ecological products: with the development and production of any product, waste is generated throughout its manufacture, distribution, consumption, and final disposal [
4,
5,
6]. In light of this fact, despite the benefits that consumerism has brought to the economy and society, true sustainability cannot be achieved if the products consumed cause significant environmental damage [
7]. In this context, the importance of green products becomes apparent since they perform the same functions as conventional products, but their environmental impact is mitigated [
8].
This has led to a variety of studies in recent decades on green products in an effort to reduce the environmental impact of consumerism and contribute to a sustainable society [
1,
3,
9,
10,
11,
12]. Additionally, consumers are increasingly aware that conventional products have significant negative effects on human health and the environment throughout their entire lifecycles, from the moment they are produced to the moment they are used and disposed of at the end of their useful lives [
13]. A green product has less environmental impact over the entire lifecycle of the product compared to a standard reference product with similar market characteristics [
6]. Therefore, recent studies have examined and developed green products, primarily using lifecycle analysis (LCA) tools on products that can theoretically produce equivalent green products, ranging from unmanned aerial vehicles (UAVs) to fruits [
14,
15,
16].
A more recent definition of the term “green product” refers to products that use recycled resources, provide environmental benefits, or reduce toxic environmental damage during their useful life [
12]. A growing number of green products are becoming increasingly important as environmental degradation and the concept of sustainable development gain more relevance. As a result, research activities on this topic have continued to increase substantially over the past decades [
17,
18]. Similarly, there has been an increase in concern and relevance regarding the consumption of green products in the business community [
19]. There is significant potential for growth in the green products market, which can generate economic benefits, create new jobs, and contribute to the development of sustainable economies [
20,
21].
It is critical to fully understand the issue of green product consumption research since there have been estimations that approximately 30% of environmental problems can be attributed to consumer decisions that are unsustainable [
22,
23]. As research makes consumers become more aware of environmental issues, their consumption habits are increasingly becoming environmentally conscious [
24]. Companies are increasingly using green product research to assist in modifying their products and processes to make them more environmentally friendly in response to increased demand for such products.
With this context, it can be seen that a society cannot achieve sustainability simply by focusing on the economic and social development of the society; the negative effects of consumerism on the environment must be mitigated. There is no doubt that research on green buyer behavior is of the utmost importance. Despite the discussed growing body of research on the topic, no studies have attempted to summarize the current landscape, verify the trends over the years, and identify gaps that require further research. In particular, the topic of green product consumption is timely since environmental concerns continue to arise every day, and people worldwide are becoming more aware of how the environment is degrading.
With this background, we attempt to fill this gap in the literature by providing a comprehensive overview of the overall scientific literature concerning green product consumption. We summarize the literature studies and identify gaps and future research opportunities. While there are several methods for reviewing literature quantitatively that can explain current trends, directions, and the state of the art, bibliometrics analysis was considered the most suitable for the present work due to the broad range of possible green products. Since bibliometrics does not require similar empirical results using identical units, a larger number of studies may be examined simultaneously. One major characteristic of the approach applied in this study is that it focuses primarily on quantitative evaluation of article characteristics (i.e., publications, citations, keywords, etc.).
Our next section provides details about the methodologies utilized in this study, followed by a presentation and discussion of the results. Since this study had a broad scope and generated a significant number of results, the results section was further divided into four major sections. The first presents a general analysis of the evolution of research on the subject of this study. Subsection two examines more specifically the most important publications in terms of influence in the scientific community. Subsection three performs a mapping of global knowledge on the subject. The fourth subsection longitudinally examines the evolution of research topics and proposes suggestions for the future of research. Finally, the article concludes with general conclusions and recommendations for future research.
2. Materials and Methods
Bibliometric analysis is a research method that is rapidly gaining popularity and is being applied to a wide range of subject topics. This is made possible by the development of databases and tools that enable the application of this quantitative evaluation method. This method makes extensive use of computational resources, primarily for the purposes of data mining, statistical analysis, and calculations, to reveal trends in a particular area of research [
25]. The purpose of this method of research is to gain a better understanding of the interrelationships between journal citations, as well as to provide a summary of the current state of knowledge about an existing or new research topic.
Before starting the investigation, the scope and amount of research to be analyzed must be precisely established as a first step in the bibliometric analysis. Otherwise, the results would be poor, irreproducible, and potentially inconsistent with the main objective of the study. Consequently, it is essential to carefully evaluate the keywords and the database to be used for data collection.
Different databases can be used to obtain the data for analysis. The database selected for this study was Scopus, which is comprehensive and has often been used in bibliometric analysis of subjects in an ecological context. Research published by Kumar et al. [
26], Khanra et al. [
27], and Nobanee et al. [
28] are three instances of recent work that we might use as examples that also relied on the Scopus database.
In the search for data, we considered the need to search for four indicators (words): an indication that it is a product (or the synonym “merchandise”); an indication that it is ecological (or any of the following equivalent words: green, eco-friendly, or Earth-friendly); an indication that there is a customer for the product (buyer, shopper, and consumer were also used as synonyms); and an indication that the context is a purchase (or the synonym “buy”).
A first search resulted in 38,965 results. However, in an initial screening, many of the articles did not address the objective theme of this study because the text often made use of the words in a very peripheral way in the body of the article, or the words were only found in the references. It was also observed that many articles analyzed green hotels. Therefore, we refined the search so that the words had to be included in the title, abstract or keywords, and the word “hotel” was excluded from these fields. The final string of the search was as follows:
(TITLE-ABS-KEY (green*) OR TITLE-ABS-KEY (ecological*) OR TITLE-ABS-KEY (eco-friendly) OR TITLE-ABS-KEY (earth-friendly) OR TITLE-ABS-KEY (environmentally)) AND (TITLE-ABS-KEY (customer*) OR TITLE-ABS-KEY (client*) OR TITLE-ABS-KEY (consumer*) OR TITLE-ABS-KEY (buyer*) OR TITLE-ABS-KEY (shopper*) OR TITLE-ABS-KEY (purchaser*)) AND (TITLE-ABS-KEY (product*) OR TITLE-ABS-KEY (merchandise)) AND (TITLE-ABS-KEY (intention*) OR TITLE-ABS-KEY (intent*)) AND (TITLE-ABS-KEY (buy*) OR TITLE-ABS-KEY (purchase*) OR TITLE-ABS-KEY (acquire*)) AND NOT (TITLE-ABS-KEY (hotel*)).
It is important to remember that bibliometric analysis is used when the bibliometric data and the breadth of the literature review are extensive for a manual study. Our final string resulted in 837 results on 27 May 2022, which is consistent with the recommendation [
29] that the number of references to be evaluated should be greater than 200 in a bibliometric analysis.
To operationalize the mapping of themes, we opted for a global analysis of the themes using the VosViewer software. This allowed us to determine the most frequently occurring words in the articles, and the links between them enabled us to more precisely define the thematic groups included in the overall subject. The analysis was performed using VosViewer (version 1.6.18) and focused on the co-occurrence mapping of words.
To identify the most frequently used terms in the research, the text to be analyzed should be preprocessed. However, VosViewer itself lacks any preprocessing features that enable words that are typed differently to be merged under the same term. Examples are words that are used in singular and in plural, the use of American or British spelling, or a text that was written using the present or past tense of verbs. The whole text to be analyzed in VosViewer was preprocessed with MATLAB (version 2022a) using the text analytics toolbox to remove stop words and lemmatize so that the text was suitable for analysis.
In the co-occurrence mapping, titles and abstracts were considered for the analysis, which enabled a fine mapping of the subjects treated and methods used by the studies. We used the binary counting method, which enabled the words to be detected to avoid the results being biased by the writing style of the authors. This is especially important when studying a large range of the analyzed period. The threshold of the minimal occurrence of terms used in this study was 12, which resulted in exactly 100 terms that met this threshold. After calculation by software of the relevance score for the initially selected terms, a standard filter to select only the 60% most relevant words was applied. Finally, the resulting terms were screened manually to remove words from the results that, although they were not stop words, lacked specific meaning to help identify field-specific thematics, such as “abstract” and “study purpose”.
In the case of longitudinal analysis, Scimat version 1.1.04 was used. This version has its own tool for the preprocessing of the text to be analyzed. The deduplication of terms by plural and Levenshtein distance (1, 2, and 3) was applied and carefully validated. In addition, a semantic search was performed to gather terms with different spellings (keeping the meanings unchanged). Unlike VosViewer, Scimat has many configuration parameters that match how clusters are made and the final graphical representation. For reference, the parameters used are listed in
Table 1. A feature of Scimat is that co-word analysis allows thematic or topical regions to be traced using strategic diagrams. This strategy analysis is conducted over several periods of time. The expected result is that the thematic regions represented in the strategic diagram are based on their centrality and density, which place them in four quadrants of a two-dimensional space. Centrality is the degree to which the many themes (keyword groups) are interrelated, while density indicates how well developed the themes are. Using this methodology, it is possible to understand how the research theme has evolved and to propose a projection for the future.
3. Results and Discussion
3.1. Overall Scientific Production Evolution
This first part of the results is a general quantitative analysis of the publications included in the study.
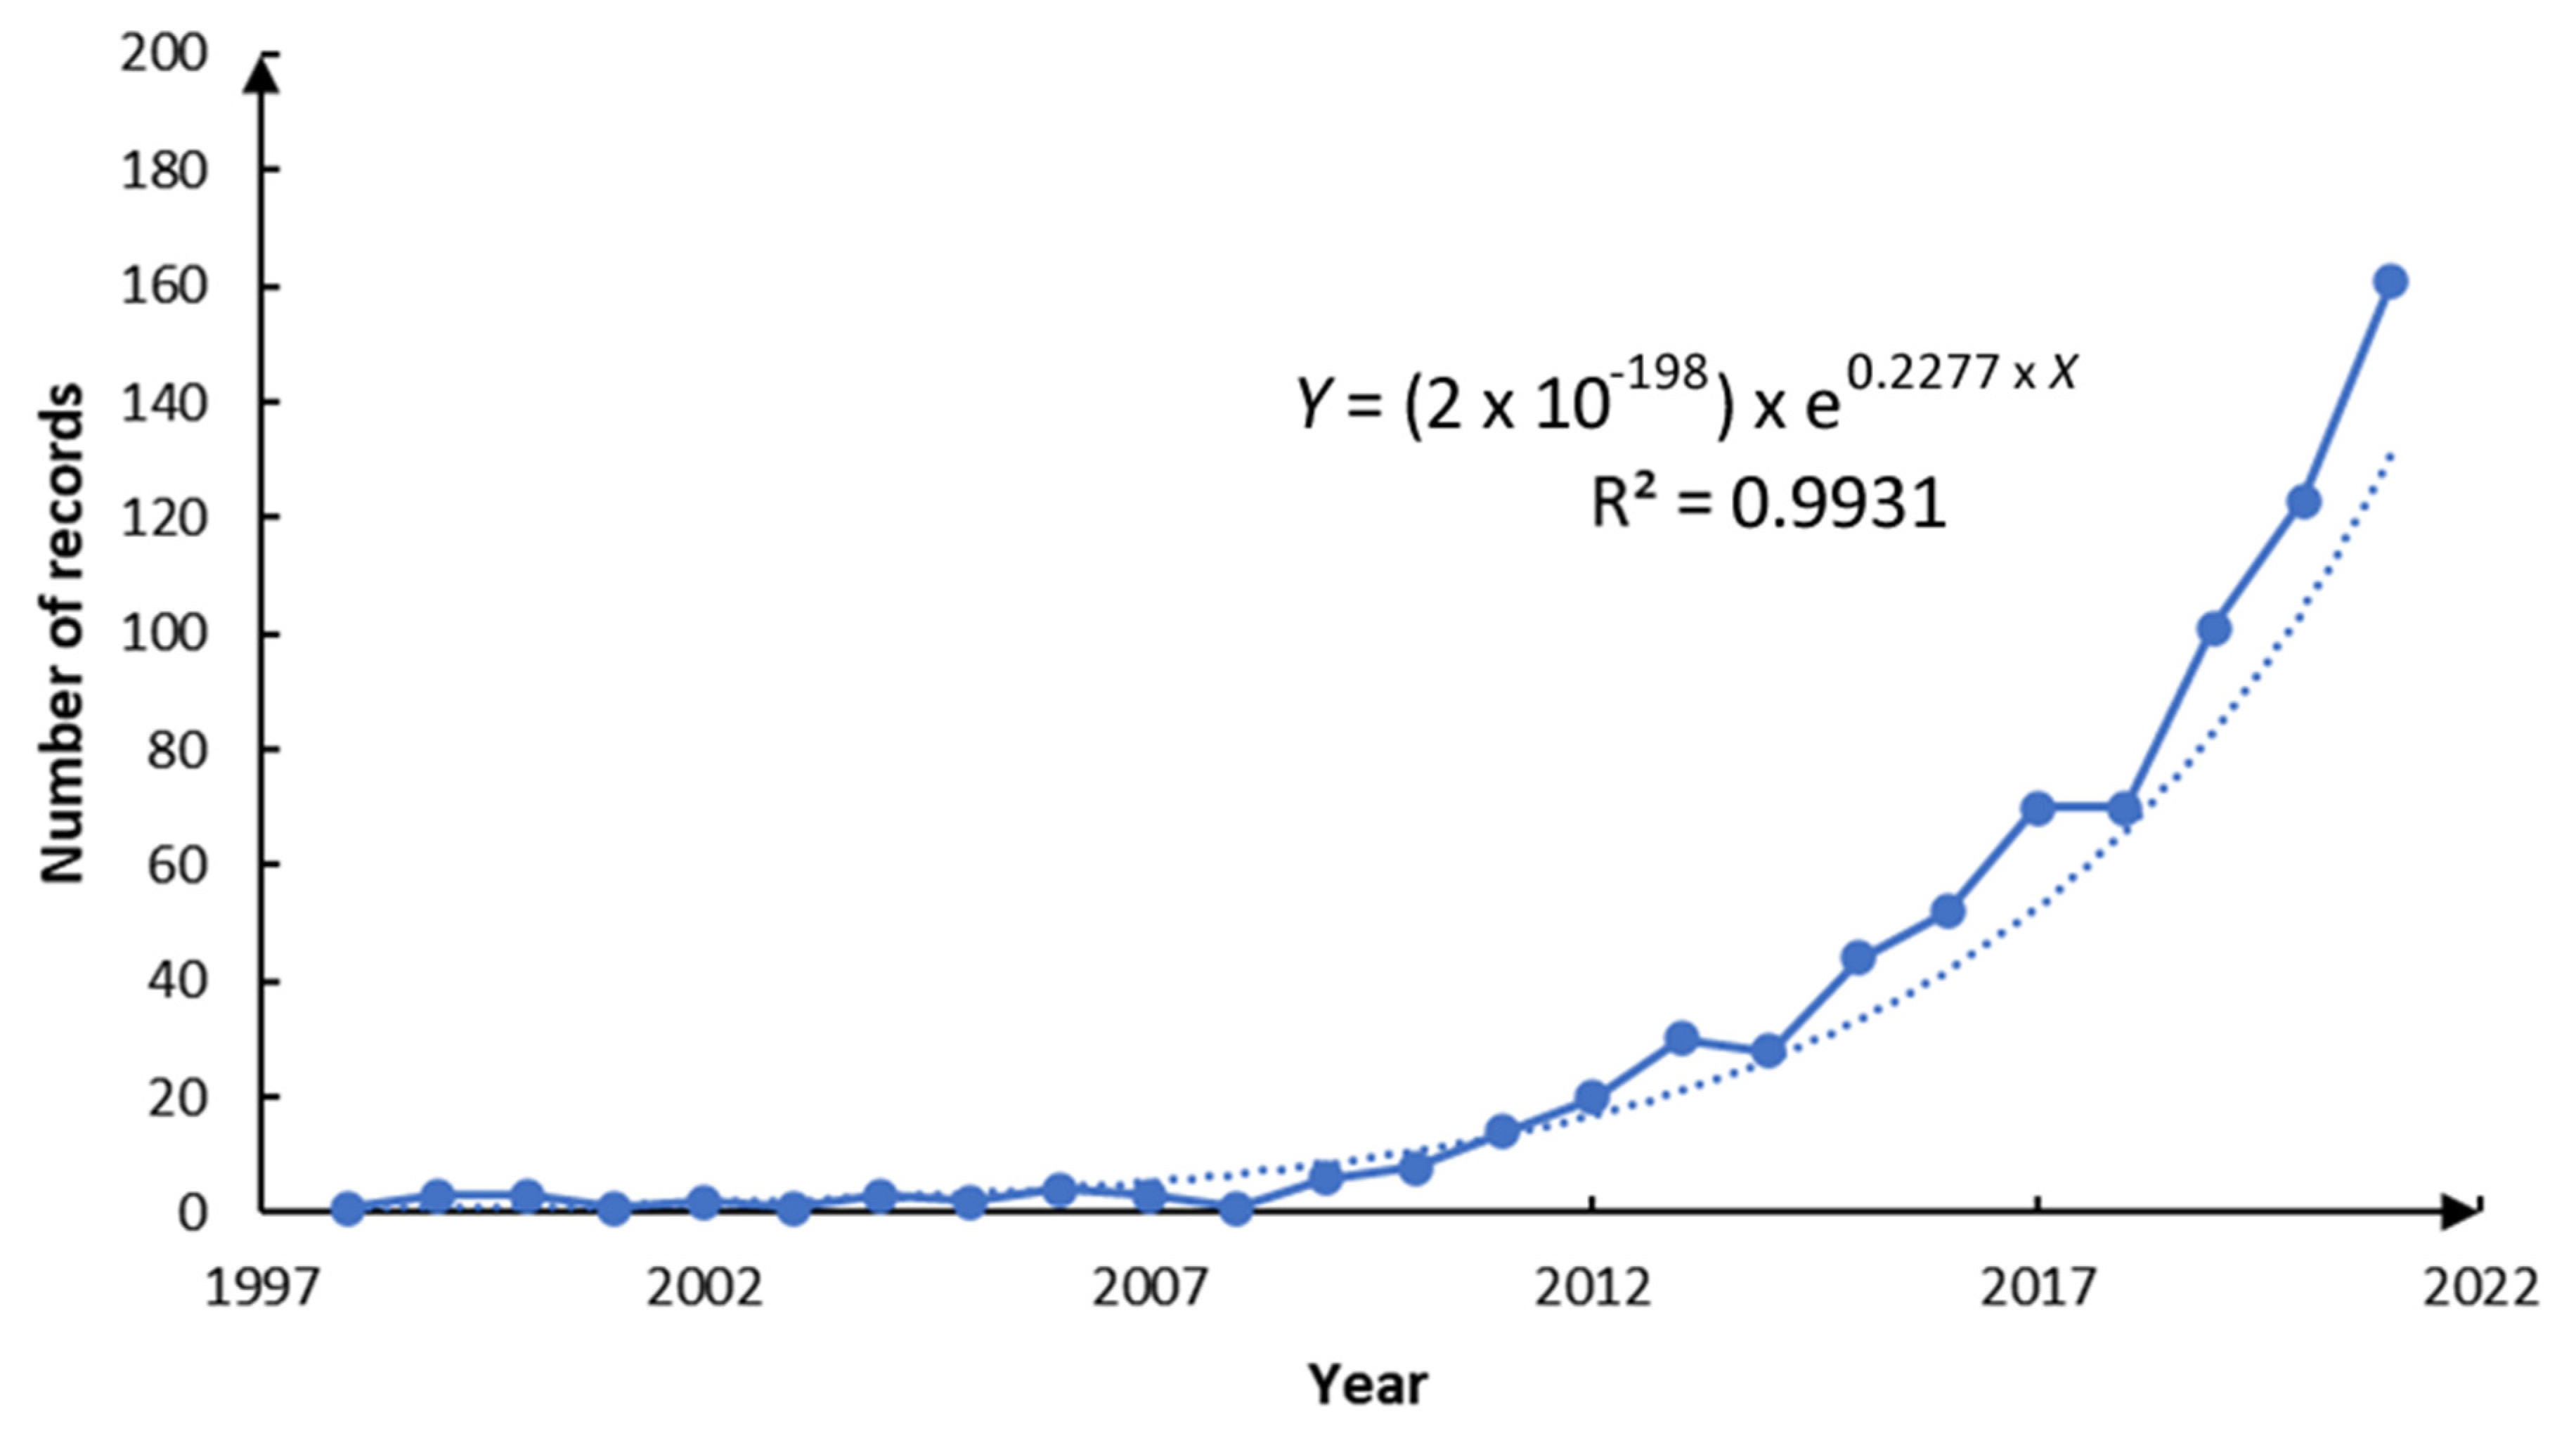
Figure 1 shows the evolution of the number of scientific publications in each year from 1998 to 2021. It is important to note that the first study on the subject appeared in 1974. To date, this article has been cited only twice and was accompanied by a 21-year hiatus without any document on the theme of this research until 1995, when another article was published. The results of the impact of the 1974 research, the low citation rate, and the large gap in publications that followed shows great disinterest not only from the scientific community but also from society in general in the 1970s, 1980s, and early 1990s. The 1995 article had great resonance in the scientific community because it currently has 214 citations. Although in the long term, this 1995 study was a mark in scientific production, its effect in sparking scientific interest was not immediate because after this study followed another period of hiatus without any scientific publications until 1998, when there was another publication. There were three publications in 1999. Until 2008, the number of annual publications fluctuated between one and three publications per year, except for the year 2006, which had four publications.
It is possible to use the data in
Figure 1, which shows the evolution of the number of annual publications from the period without a hiatus (1998) to the last full year (2021), to approximate a mathematical model. After a period of great stability and a low number of publications, there was growth between 2009 and 2013, with an average growth in the number of publications of 50.30% per year, from 6 publications in 2009 to 30 in 2013. The year 2014 was exceptional; it broke this trend of growth with a slight drop of 6.67% in the number of publications (28 publications). From 2015 to 2017, growth resumed with an average growth of 36.65%, from 44 publications in 2015 to 70 in 2017. The year 2018 was also an atypical year because there was no growth compared to the previous year. After this, the years 2018 to 2021 were also marked by important growth in the relative numbers of publications, with an average growth of 32.32% compared to the previous year; the year 2021 had 161 publications.
It can be observed from
Figure 1 that in general, there is a tendency toward exponential growth in the absolute number of publications over the years in the period of complete years without a publication hiatus. In fact, this hypothesis can be validated by approaching the data via regression in an exponential equation. The result is the following equation:
The equation is valid only for periods after 1998, and it results in a very high coefficient of determination (R2) of 99.31%. Using this equation, an expected result of 143 publications for 2021 is obtained, or a difference of 18 publications from the real result, an estimation error of the order of 11%. Extrapolating to 2022, 180 publications are expected; thus far, 84 are recorded, i.e., 46.7% of what is expected for the year. This is consistent because research ended in the middle of May, which is equivalent to 45.8% of the full year.
Table 2 indicates the nations that produced the most studies of green products. Interestingly, most of the top countries in production are developing countries, with the exception of South Korea and the United States. The latter is the leader in terms of scientific production (143 documents), which is expected of a large developed nation. Strong runners-up are India and China, with 114 and 103 documents, respectively. Distant from the three leaders, Malaysia had a production of 66 documents.
Due to the prevalence of these three top-producing countries, it is not uncommon to find recent studies comparing consumer behaviors and attitudes between these countries. For example, we can cite the study of Clark et al. [
30], which examined gender and country in China and the USA and found that Chinese buyers were more influenced by society. Additionally, the women interviewed were more environmentally conscious. Chinese men have strong buying attitudes, while Chinese women are more influenced by environmental concerns. Another example is the study of Muralidharan et al. [
31], where the authors sought to examine the effect of culture on the selection and knowledge of green products. In this case, Indian and American millennials were interviewed online. In both countries, interpersonal sources encouraged green buying more than conventional media. The study found that millennials in the United States have a skeptical attitude toward the mainstream media.
The leadership of the first three countries in scientific production is so strong that in relative terms, these three countries accounted for almost half of the scientific production (43%). It can also be observed that there is a strong prevalence of Asian countries in the largest producers of scientific results; the only exceptions are the United States and Brazil, which is the only developing nation outside Asia to be a principal producer of scientific articles.
The case of Brazil can be explained by the fact that despite being a developing nation, it has strong funding of research by public agencies. As seen in
Table 2, CNPQ is the second body that finances the most research, and CAPES is the sixth. It can also be seen in
Table 2 that of the top funding agencies, half come from China. It can be concluded from
Table 2 that although China and India are production leaders with similar numbers, China’s research is much more subsidized. An interesting case is that of Europe, which, despite having the fifth body that finances the most research, has no prominent country listed.
3.2. Most Important Publication Sources and Influential Studies
In this section, the most influential publications and sources of scientific publications are discussed.
Table 3 lists the most impactful articles in terms of citations. It is interesting to note that of the five most impactful studies, four specifically used the theory of planned behavior (TPB).
The TPB focuses on anticipating and understanding what leads to the intention of buying green [
48,
49]. Attitude is a path that leads to intention and consists of favorable and unfavorable evaluations of a person, derived from behavioral beliefs. Another path that leads to intention according to the TPB is the subjective norm, which is an individual’s perception of social pressures to perform or refrain from performing a certain action. Finally, another pathway is perceived as behavioral control, which is an individual’s assessment of whether he or she has control over an action [
50].
Another important aspect of the most influential literature that can be found in
Table 3 is that many studies have focused on the intention to buy green products and not on the purchasing itself [
36,
37,
41,
46]. This assumes that people usually perform as intended. However, intention is better understood as an expression of a person’s expectations about his or her behavior in a given environment and is therefore a precursor that indicates the probability of the actual behavior of buying [
51].
In addition, it can be highlighted that many of the influential studies on products considered ecological work with organic food as the green product to be studied [
36,
39,
41]. Some studies indicate that attitudes toward the environment and health are the main drivers of the desire to pay for organic products [
52]. At the same time, the literature indicates that the production and consumption of organic products have been constantly growing over the past few decades [
53]. This is important because high energy and chemical use, global contamination of the food chain and water by persistent pesticide and nitrate residues, and reduced nutrient and flavor content as a result of low-cost and intensive food production and extensive grinding or processing have generated significant concern [
54]. In the past decade, we have seen combined awareness of environmental preservation, food safety, and well-being that has significantly increased public concern and demand for ecologically grown basic foods [
54,
55,
56]. It seems that interest and scientific production in the subject have followed public interest, a phenomenon similar to what was previously observed for general environmental issues and green products in the 1970s and 1980s.
It is also interesting to note that the most influential studies have targeted developing nations [
34,
35,
42,
47]. Many studies have focused on the population of India, but they have not provided specific explanations for why the Indian population is often chosen, only that it is a developing nation. This indicates that there is interest and a particular dynamism among Indian researchers with regard to green product consumption, even if Indian organizations are not among the largest research financing organizations (cf.
Table 2).
With regard to the largest vectors of publication on the subject, there are diverse results.
Table 4 lists the top five publishers of green product consumption articles. Four of the five are scientific journals, and one is the proceedings of a marketing conference. The presence of a conference and a marketing journal shows a willingness to conduct studies on how to convince consumers to turn toward green products. However, the journal
Sustainability is the undisputed leader of publications. It is important to note that green products are not synonymous with sustainable products. A sustainable product not only considers environmental issues but also commits itself to sustainability as a whole, that is, all points of contact between the product and society. Green products have a much more restrictive definition. However, green product studies are an important step toward sustainability, and the fact that the journal
Sustainability is open access also allows a greater number of researchers to be informed of the latest developments in terms of green products that may eventually be sustainable. The second journal with the most publications (
Journal of Cleaner Production), although not open access, has a very high impact factor (9.3) and CiteScore (13.1), showing great interest in the results of green research in 2022. The other important vectors of publication focus on the consumer and/or marketing, which is expected because it is the consumer who ultimately decides whether to turn toward real green consumption. Convincing consumers and fostering this turn is necessary for effective marketing.
3.3. Overall Subject Bibliometric Mapping
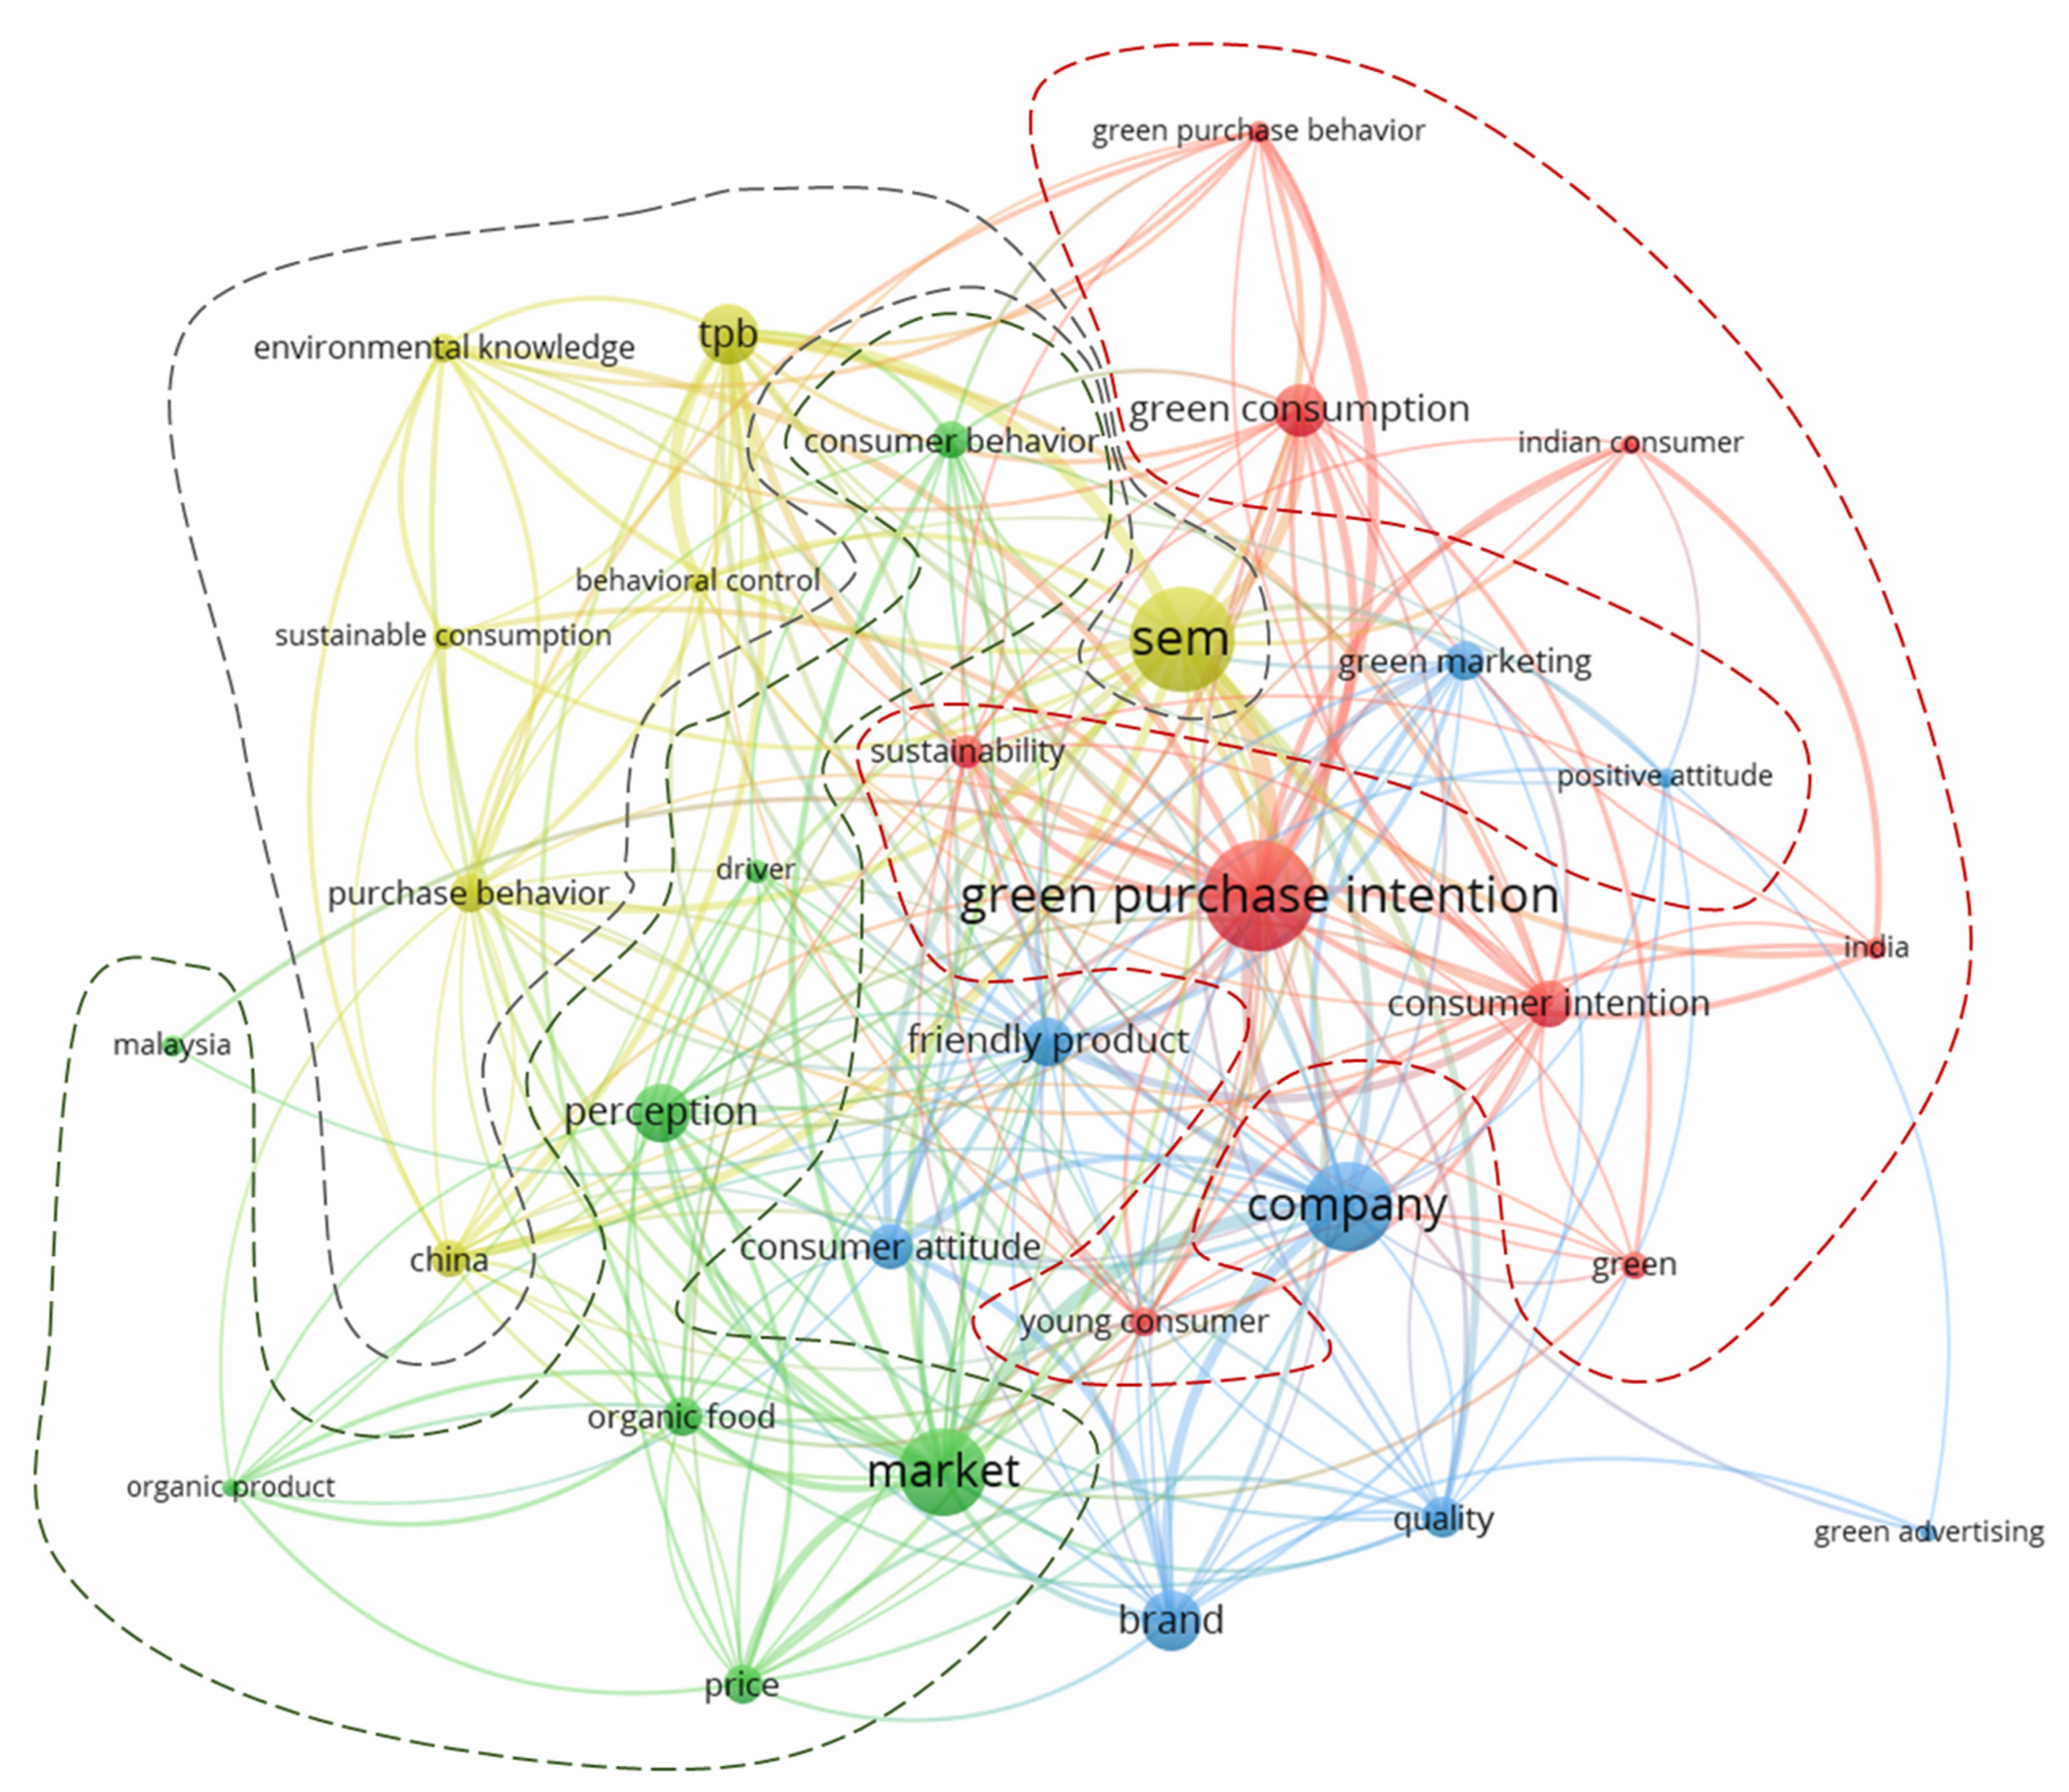
In this section, the results of the analysis of abstracts, titles, and keywords of all of the included data using the VosViewer software are discussed. A network visualization of the interaction among terms can be seen in
Figure 2. Each term was analyzed using the software, and the links, total link strengths, and occurrences were computed. The size of the bubble indicates the occurrences; it can be seen visually that the top four terms were much more expressive than the others. The term with the highest occurrence was “green purchase intention” (101), with a link weight of 30 and a total link strength weight of 164. The second term with the highest occurrence was “SEM” (96) (“structural equation modeling”), with a link weight of 31 and a total link strength weight of 174. The third term with the highest occurrence was “company” (83), with a weight link of 30 and a total link strength weight of 112. The fourth term was “market” (81), with a link weight of 27 and a total link strength weight of 81. The other terms had substantially fewer occurrences (less than 56) and substantially less total link strength weight (less than 79). The only exception is “TPB”, which had 56 occurrences and a total link weight of 109.
The colors indicate the different clusters of terms: red indicates cluster 1, green cluster 2, blue cluster 3, and yellow cluster 4. Each of the four prevalent words belongs to a different cluster. The clusters in
Figure 2 are also separated by dashed lines for easier identification (with the exception of cluster 3, which increases overall figure readability). Furthermore, each term belonging to each cluster is indicated in
Table 5. A deeper analysis and interpretation of each cluster will follow.
3.3.1. Cluster 1—Customer and Purchasing
The first cluster is a nine-word cluster. It is basically focused on the consumer and purchasing in a green context. In this cluster, the term with the highest occurrence is “green purchase intention”, with 101 occurrences. Studies of intentions capture the motivational factors that influence the buying behavior and intentions of green product consumption [
42,
57].
As previously mentioned, conventional products are responsible for far more negative effects on human health and the natural environment than green products. Therefore, a product is considered environmentally friendly if it has minimal impact on the environment, conserves resources, and can be recycled (where applicable) [
58]. Green buying intention is a crucial component of consumers’ actual green buying behavior, indicating that customers intend to buy a green product if they find it attractive [
59]. Green purchase intention, in contrast, is defined as the possibility for consumers to choose a product with ecological characteristics above other conventional items as part of their purchasing considerations [
60]. All of these elements are correlated and are part of cluster 1.
This is reinforced by the fact that the second most common element was “green consumption” (49). This form of consumption requires the acquisition of environmentally friendly products that offer a greener alternative to conventional options [
61]. This is very important because, despite sometimes sacrificing the quality or quantity of consumption, green consumption has emerged as an efficient technique to mitigate the impact on the environment [
62]. Furthermore, green consumption is considered a type of consumption that is consistent with environmental protection for future generations [
63].
The third most common element was “consumer intention” (43). Green purchase intentions are correlated with customer perceptions about the environmental advantages of a product. In fact, customers are more likely to want to shop green when they have a higher level of confidence [
64,
65]. Therefore, it is essential to provide customers with accurate and useful information about green products to increase their confidence in green shopping.
The links between nodes also indicate that cluster 1 involves consumer intention because GPI is strongly linked to GPB (12) and GPI is strongly linked to “green consumption” (9). As expected, “green consumption” is strongly linked to “purchase behavior” (12). It can be concluded that cluster 1 assigns consumers responsibility or co-responsibility for addressing environmental issues through the adoption of environmentally friendly behaviors such as the use of organic products, clean and renewable energies, and the search for goods produced by companies with zero or almost zero impact on the environment [
10,
35,
66].
The terms that reference India were the two last terms, with 21 occurrences of “India” and 19 occurrences of “Indian consumer”. We have already discussed the strength of Indian research in research related to ecological products. VosViewer’s result states that, more specifically, this research focuses on the aforementioned elements of cluster 1.
3.3.2. Cluster 2—Product Characteristics and Market
In this cluster, the most frequent word was “market” (81). Green marketing, according to Polonsky et al. [
67], can be described as a company’s effort to create, advertise, distribute, and sell its products in a way that supports environmental protection. Companies that offer greener products are in constant competition with other companies because of the ability to quickly adapt to different market requirements in various areas, and transmitting and reacting to these trends and needs is critical [
68,
69,
70]. For green products to be dominant, the companies that sell them must succeed, and these companies grow by their ability to recognize and adapt to market trends and demands [
71]. A possible source of competitive advantage for multinational business organizations working with green products is the ability to efficiently use market knowledge derived from different internal and external sources [
68].
The second most important term of this cluster was “perception” (54). In terms of companies, sellers of green products tend to take advantage of the positive image and go beyond the offer of greener products to emphasize that they are responsible companies. According to Siegel and Vitaliano [
72], corporate social responsibility (CSR) arises when companies engage in behaviors that seem to promote a social goal beyond what is required by law. CSR can help promote product market perception by increasing customer perception and satisfaction [
73]. Additionally, many studies focus on a younger population and find that they have a better perception of green concerns and perceive green products and their environmental and personal advantages positively. There is also a positive perception among young people that green products are superior to traditional products in terms of quality, durability, performance, and health advantages [
9].
Another characteristic of green products is the perception that consumers often associate locally produced and organic foods with better quality standards (freshness, nutritional content), healthy eating, pleasant taste, cultural values, and ecologically responsible production techniques [
74,
75]. Over the past few decades, consumers have gradually increased their consumption of organic food, creating a market for organic food and beverages worth 92 billion euros in 2017 [
76]. This leads us to the third, fourth, and fifth most important terms, which are “organic food” (37), “price” (37) and “consumer behavior”, respectively (35).
In addition, inside the cluster, the strongest links are between “market” and “price” (9) and “perception” and “market” (5). Stores should be aware of organic food price promotions. The interface with perception leads us to understand that supermarkets may find it interesting to try to connect environmental and health messages related to their products to capitalize on the favorable influence of customers’ feelings in relation to both areas [
52]. From these links, it can be concluded that one of the reasons for this growth in organic food consumption is the increase in environmental awareness, as demonstrated by consumer knowledge and attitudes, which motivates ecological purchasing behavior [
77,
78,
79].
Interestingly, “Malaysia” is the antepenultimate term (21), showing that this country is an important producer of knowledge in the themes of this cluster, especially with aspects related to organic food consumption [
80,
81,
82].
3.3.3. Cluster 3—Company and Brand
In this cluster, the term with the most occurrences is “company” (83); it is also interesting to note that this term is strongly linked to “market” from the previous cluster (16). Green industries have undertaken positive activities and efforts to achieve sustainable growth to gain a competitive advantage in a dynamic and challenging global market [
83]. From what we have seen from consumers in other clusters, there is a growing demand on the part of consumers for companies to create environmentally friendly products, and companies that understand this and support sustainable development tend to increasingly have a competitive advantage. Thus, green products, environmental health, and green philosophy should be part of the practical basis of companies [
84].
Customers interpret the image of green brands that represent the company not only for the company’s social initiatives but also for the offer of products [
85]. It is recommended that companies prioritize their growth through the introduction of new ideas about green goods, thus transmitting new knowledge on this topic to their consumers. This is a way to adapt to changes in customer preferences and raise public awareness about the benefits of green products to society [
83]. Smart companies have the ability to see environmental issues as possibilities for new business rather than as dangers and are able to meet the desires of customers more profitably [
86].
Similarly, the adoption of new methods and adaptation to new environmental concerns allow companies to produce greater brand value by meeting consumer demands for environmentally responsible goods [
83]. By the same token, the second most important term of the cluster was “brand” (56), which is consistent with the previous remarks. The green brand image has been shown to influence the customer’s perception in the evaluation of products [
87,
88]. One of the goals of the marketing strategy should be to increase the value of a company through the brand image [
87,
89]. The implementation of proper green advertising can improve the company’s image, increasing customer confidence [
90].
Creating a strong brand can provide benefits such as less vulnerability to competitive marketing actions, higher margins, and more brand extension opportunities [
91,
92]. In this sense, we can observe in our results that the “brand” is strongly linked with “consumer attitude” (7). Moreover, there is a strong connection between the “company” and “GPI” (11). Due to the appeal of the brand name, buyers may be willing to pay more for the same level of quality if the brand value is higher [
93]. Another strong link in the cluster is between “company” and “brand” (11). It can therefore be concluded that maintaining the company’s image and reputation requires consumers to view the company’s actions as environmentally conscious [
94]. In summary, the reputation of green companies contributes to improving the companies’ favorable image, which leads to better business [
95].
3.3.4. Cluster 4—Modeling and Theories
This cluster revolves around the term with the most frequent occurrences, “SEM” (96). Structural equation modeling (SEM) is a statistical technique used to test the consistency of a model with its theory. By simultaneously modeling interactions between various independent and dependent factors, SEM allows researchers to answer a collection of connected research questions through a unique, systematic, and exhaustive investigation [
96]. SEM is a method of data analysis that can be seen as a generalization, integration, and extension of well-known methods such as variance analysis (ANOVA), factor analysis, and multiple regression analysis [
97,
98]. It allows researchers to simultaneously estimate the associations between observable and unobserved variables as well as the correlations between unobserved variables. Within SEM, unobserved variables are called latent variables, factors, or constructs. A latent variable or factor is measured indirectly by means of one or more observable indicator variables that reflect or form the factor.
The second most important term of this cluster is “TPB” (56). The theory of planned behavior (TPB) derives from significant empirical confirmations of the prediction of a wide variety of ecologically beneficial intentions and actions, particularly in the field of food selection [
99,
100,
101,
102]. The TPB remains one of the most widely used structures for research on consumer behavior. In the TPB, it is believed that behaviors are the result of individual desire and perceived behavioral control. Three factors simultaneously shape an individual’s behavioral intention: (1) attitude, (2) subjective norm, and (3) perceived behavioral control [
103].
It can also be observed that SEM is strongly linked to the TPB (15), indicating that the studies of this cluster use SEM as a tool based on TPB theory. Although the efficacy of the TPB in predicting behavior has been demonstrated, researchers and theorists continue to criticize the deficiencies of the model and propose modifying it to increase its predictive usefulness [
104].
It is also noteworthy that SEM is strongly linked to “green consumption” (12) and GPI (25) in cluster 1 and that TPB is strongly linked to GPI (9). This indicates that intention is fundamental to the analysis of consumer behavior in research since it can be seen as the motivation to perform an action based on the result of a customer’s past assessment [
105]. In the current state of research, green purchase intent is often used to describe customer behavior toward environmentally conscious products [
64], including when using SEM in conjunction with the TPB. However, it should be noted that further research in the field of support to the consumer’s purchase intent should be encouraged, as this will lead to good buying behavior [
106].
3.4. Longitudinal Analysis
3.4.1. Publication Periods and Eras
A pre-study was performed on the database to define the significant periods of research, and five periods were defined to be studied. The results of this study on the development of research can be seen in
Table 6. The standard period length comprised a four-year interval; a noteworthy exception is the first period. In this case, the period represents when very few studies were performed; therefore, the number of years included had to be much larger than the others to be a significant period. Therefore, a total of 36 years are included in the first period.
It also noteworthy that these five periods actually represent four different eras (or waves) of research. In this study, eras are defined by periods that share common characteristics. Considering this definition, periods four and five actually pertain to the same wave since they have no distinctive observable characteristic between them. They can also be interpreted as follows: period four represents the first years of wave number four, and period five represents the last years up to the current day. Therefore, wave four has the same overall year span as the other waves (with the exception of the first wave) but is comprised of two periods, enabling a finer analysis of this wave. This process enables us to separately analyze the current year of this study (which is incomplete) together with the immediately preceding year (full year) and to compare it with the first two full years of the same wave. A summary of the describing characteristics of each wave is presented in
Table 7 and is discussed in greater detail in the following paragraphs.
During the first wave, research was very limited. In fact, in the total period of 36 calendar years covered by this era, only 15 years had published studies (that is, only 41.67% of the years presented scientific results). In total, there were only 40 publications but a great diversity of journals, showing that specialized publications had not yet been consolidated. A small fraction of the research is available in the form of open access (i.e., only four publications or 10% of the total period). This fact did not prevent this research from being fundamental to the development of the research of the subsequent era since there are a total of 3215 citations of articles from this period, a high average of approximately 80.4 citations per article.
By far, the most influential study in the era was Kalafatis et al. [
33]. In this study, the United Kingdom and Greece were selected to symbolize the two extremes of popular knowledge and environmental concerns. The actual scenario of the study consisted of wooden-based objects, i.e., tables and dining chairs. Although the results provide substantial support for the robustness of the TPB in explaining the intention in both samples, there is some evidence that the theory is more applicable to well-established markets with well-defined behavioral patterns (i.e., the fitting of the U.K. samples are superior to the corresponding Greek ones). The other important study of this period [
38], the research results of which indicate that ecologically responsible buying habits are not common in Egypt and was based on the actual behavior of sustainable purchasing as opposed to self-reports of care for the environment.
The second wave marks the beginning of the movement of drastic growth in research on green products. In the four-year period (i.e., 2011–2014), the total production of scientific articles was slightly more than double that during the period of the 36 previous years. This steep growth in the number of publications was the main milestone of this wave, while most other characteristics of the first wave remained. For example, the 92 publications occurred in 70 different sources, indicating a wide diversity of publication routes without the appearance of a notable publishing channel. The percentage of open access public articles also remained practically the same at 10.87%. However, the documents in general were slightly less influential than those of the first wave, with a total of 4380 citations, i.e., an average of 47.6 citations per document. This is equivalent to a 40.8% decrease in the number of citations per document.
The most important study of this period was Kim and Chung [
37], which was an online survey from the United States with diverse results. Consumer values and attitudes and environmental and appearance awareness, rather than health awareness, proved to be significant predictors of customers’ attitudes toward organic personal care products. This study indicated that an individual’s previous experiences with various organic items had a substantial influence on the individual’s propensity to buy organic personal hygiene products, providing evidence that an individual’s consumption pattern reflects an organic lifestyle. The second most influential study of the period [
41] examined Indian consumers who were satisfied with organic foods for various reasons. Healthy content was more important to them than ecological safety because it meets changing consumer tastes and attitudes and helps preserve social standing.
The third wave maintained the trend of high growth in the number of publications; between 2015 and 2018, 236 documents were published, resulting in approximately two and a half times more publications per year compared to the previous period. There are, however, two characteristics that differentiate this period from the others. First, there was a peak in the number of different sources of publications, 134, that is, 91.43% more sources of publications compared to the previous period. Another difference in the publications was the movement toward an increase in the number of articles available in the form of “open access”. In this case, there were 68 documents, representing 28.81% of the total of the period; i.e., the relative percentage of open access documents almost tripled compared to the percentages observed in the previous periods.
In this period, the most influential studies analyzed potential improvements in the TPB [
32] and expanded and integrated environmental concern, a key variable in the green marketing literature. Empirical findings in an Indian population using SEM indicate that the extended TPB is more predictable than the TPB and TRA in green marketing contexts. In contrast to the subjective norm, consumer attitude and perceived behavioral control strongly influence purchasing intention. The second most influential study [
34] sought to understand the intentions of young Indian consumers in buying environmentally friendly items. The research used the TPB as a theoretical reference and sought to expand it by introducing new components (environmental concern and environmental knowledge). The study demonstrated the efficacy of the TPB in predicting the intention of young consumers to buy green items. The results also validated the applicability of the inclusion of new components in the TPB.
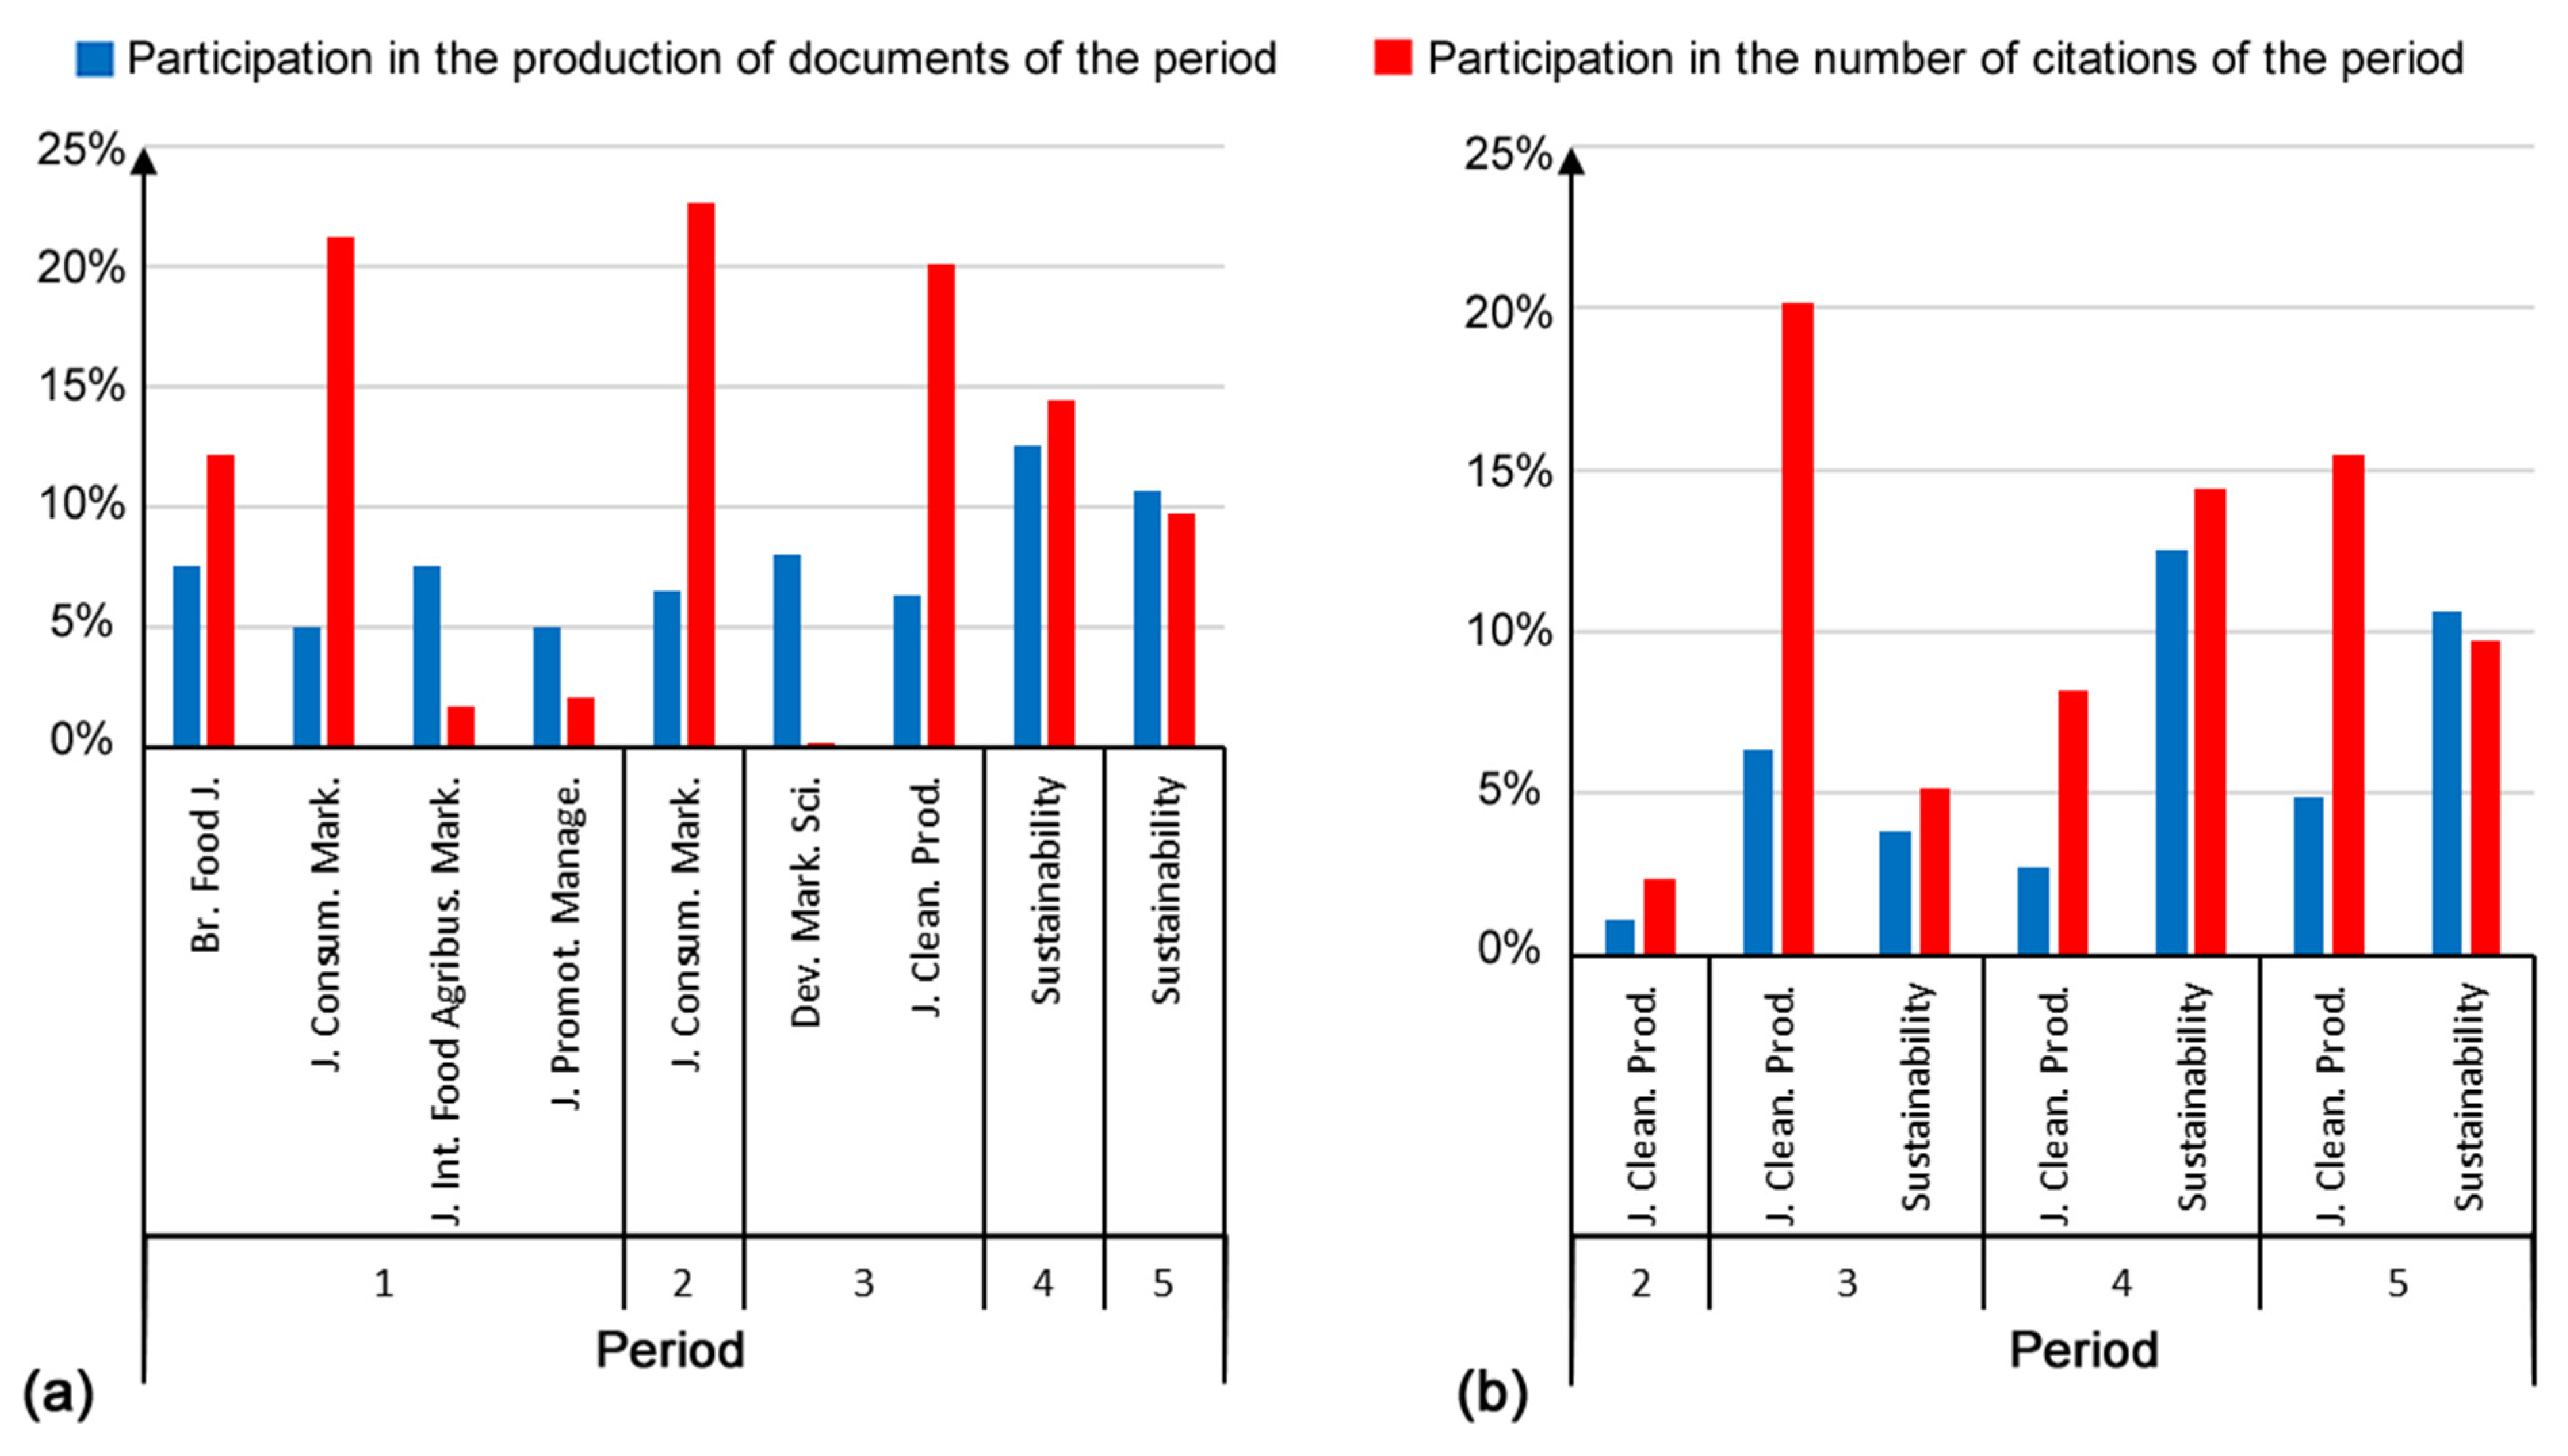
After the diversification of the third wave, the fourth wave was marked by the consolidation of the main sources of publication. This can be seen in
Figure 3a, which shows the main avenues of publication, that is, those which had more than 5% of the total publications in each period. This graph shows that in the first period, there were four publication sources that exceeded this threshold. In periods four and five (which are part of the fourth wave), only one journal was above the threshold. In both cases, the journal was
Sustainability, which is open access. From the fourth wave, there was stabilization in the percentage of open access articles; for example, in period four, the percentage was 40.2%, and in the fifth period, it was 37.6% (cf.
Table 6). These levels of open access publications are very high, and they are beneficial for the development of greener societies because they allow for easier access to important information about consumers and green products, especially for entrepreneurs outside academia.
It is also interesting to note in
Table 8 the evolution of the most popular journals in each period. The table shows the journals with more than 5% of the total number of citations in each period. It is possible to observe that the first period had a diversity of popular journals. In the second period, the consumer marketing journal stood out, not only due to the relative number of publications (cf.
Figure 3a) but also due to the influence of this journal in the period, as demonstrated by the high partitioning in the percentage of citations of the period representing 22.7% of the total. In contrast, the current fourth era (i.e., periods four and five) publishes mainly via sustainability-oriented journals. Therefore, the third period was a transitional one, during which studies were published in marketing and sustainability-oriented journals. This fact can be seen by the two journals that published the most in this period being the
Journal of Retailing and Consumer Services and the
Journal of Cleaner Production. The end of the diversification of the publication vectors of the fourth wave is clearly demonstrated in
Figure 3a; although the absolute number of publications in periods four and five is much greater than that observed in period three, the number of sources of publications is smaller.
This phenomenon of the concentration of publication journals began in the third wave and consolidated in the fourth with the
Journal of Cleaner Production and
Sustainability representing approximately one-seventh of the total publications, i.e., 10.2%, 15.2%, and 15.5% for the third, fourth, and fifth periods, respectively. In terms of influence, the concentration in these two journals was even higher, stabilizing at approximately a quarter of the total citations in each period (25.3%, 22.6%, and 25.1% for the third, fourth, and fifth periods, respectively). As shown in
Figure 3b, the
Journal of Cleaner Production has a slight tendency to have fewer published documents that are more influential than
Sustainability, but the difference is not large.
3.4.2. Keyword Clustering Analysis Evolution
In this section, we analyze the results of keyword cluster analyses by period to discover the temporal evolution of the topics addressed.
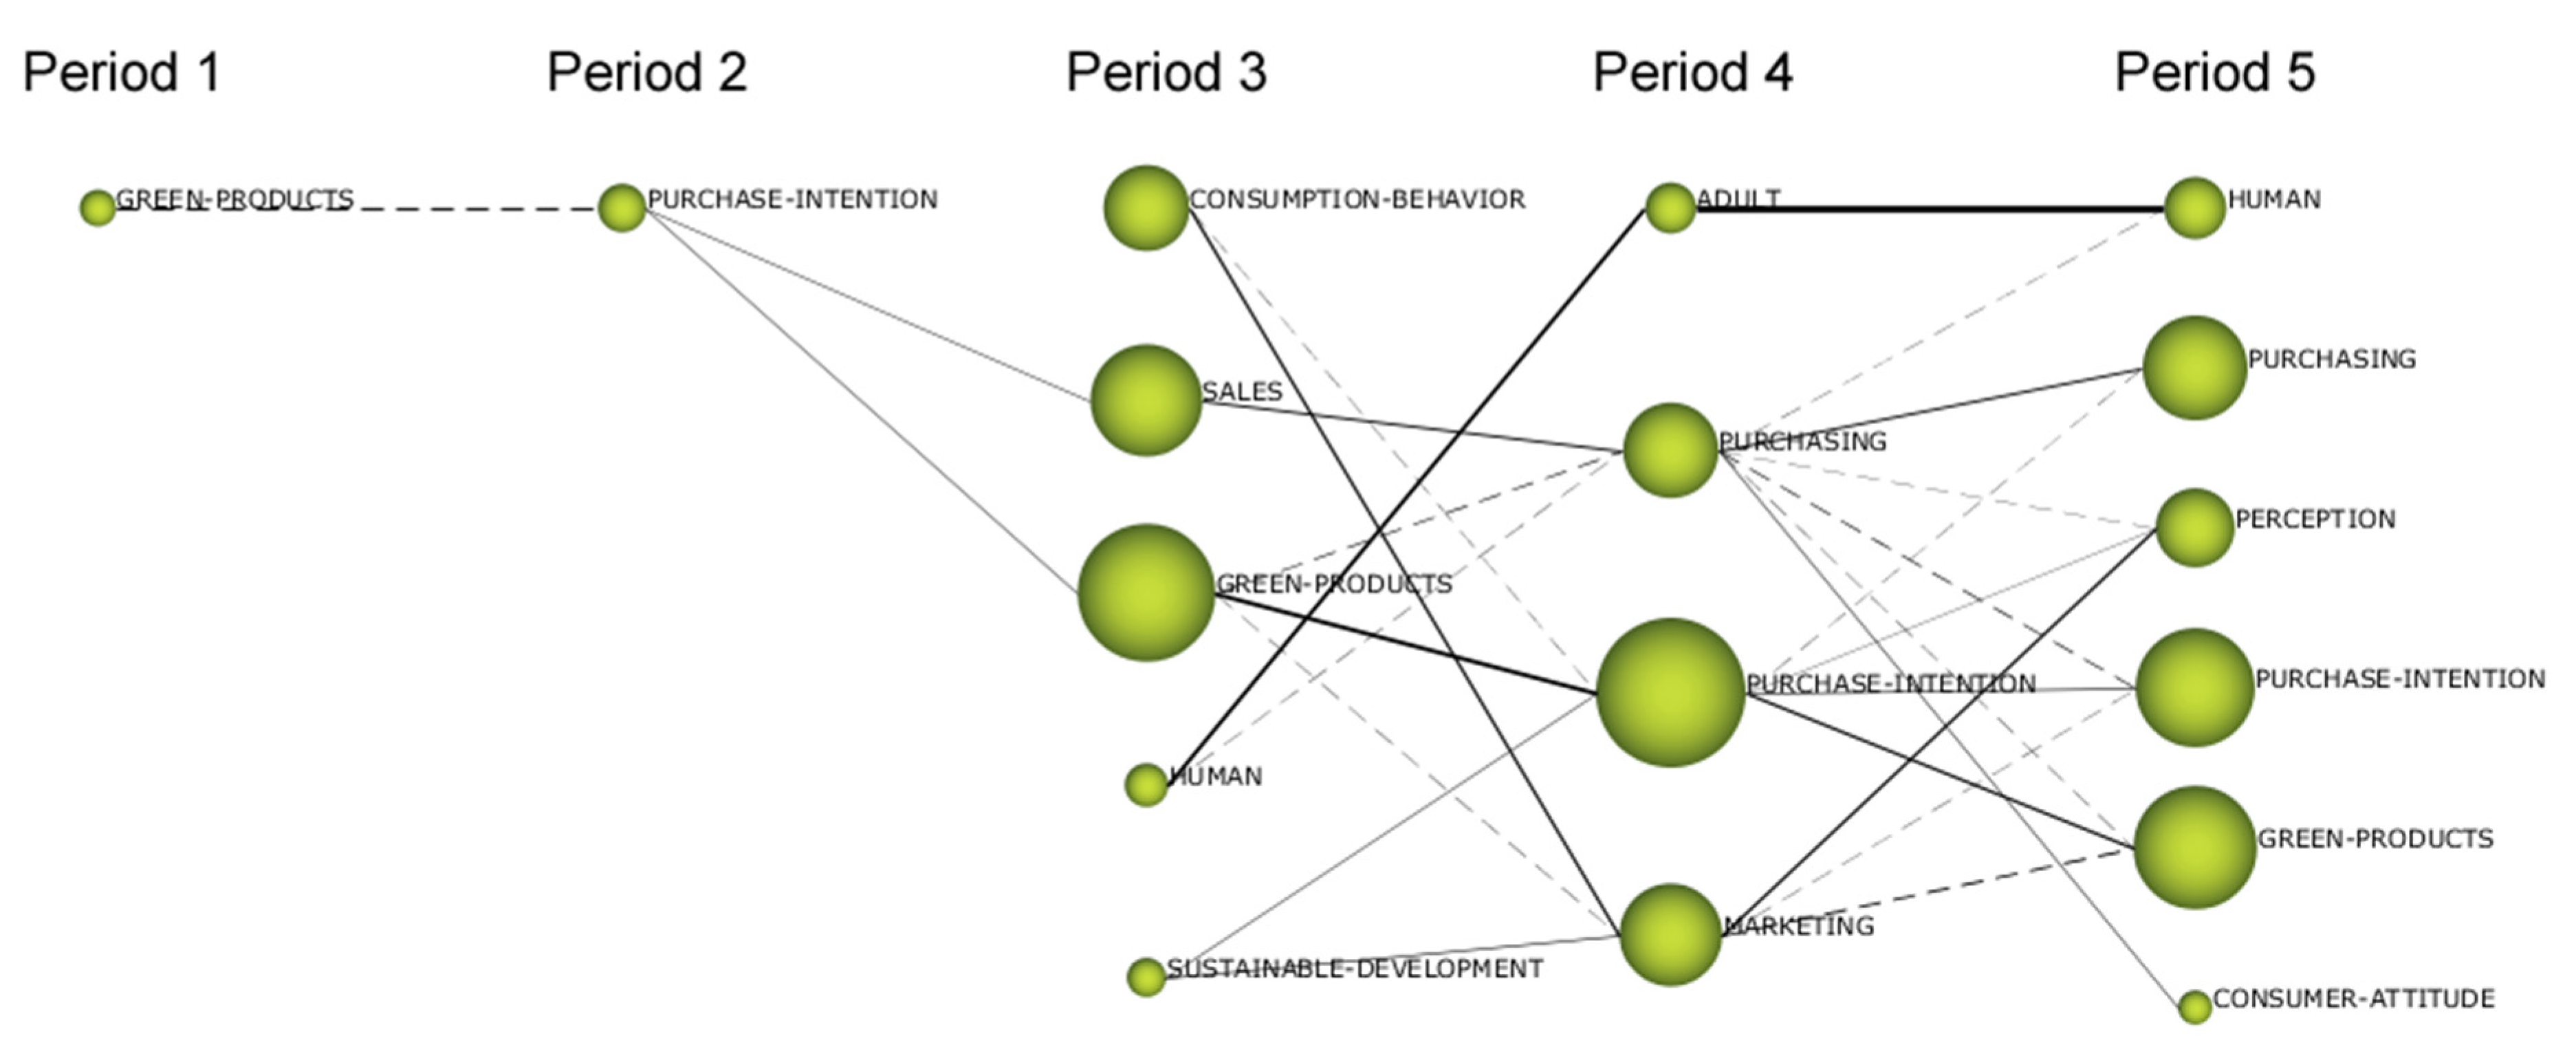
Figure 4 shows the results of the analysis of the most relevant keywords of each period and the link between them. For periods one and two, only one cluster was formed, “green products”. This is interesting because it shows that the term “green” has been used to designate ecological products since its inception. A slight connection with purchase intention can be observed in period two. This shows that consumer intention is an old interest in the area of green products. From period two onward, there is diversification of the number of connections between clusters. The main lines of research are discussed below.
The two different lines of research cover all five time periods. The first, entitled “green products—purchase intention—green goods—purchase intention—green products”, demonstrates that research has consistently focused on the relationship between environmentally friendly items and the consumer’s desire to make a purchase. The second line is entitled “green products—purchase intention—sales—purchasing” and describes how the research line was derived from the consumer’s purchase intention for green products until the sale and purchase itself. These two results are consistent with the previous results. However, as shown by the diameter of the spheres in
Figure 4, there are more documents in the line of studies on purchase intention compared to the line that studies the purchase itself. This is also consistent with previous results.
Two other lines of research started in period three and continued until the last period. The first is “human–adult–human”, showing that research focuses on humans, which is not surprising and is consistent with the overall theme of the consumer as the main object of research on green products. It is, however, somewhat surprising that in period four, the word “adult” was highlighted; many influential studies focused on young people from developing countries, especially in period three. Surprisingly, the word “young” was not highlighted in the keywords of any period.
Human activity in relation to the environment has become a global issue. It is characterized by the movement of energy savings and the movement of environmentally friendly product consumption patterns [
109]. It is also important to highlight that this line may be due to studies that discuss the issue of human awareness of environmental issues and a consequent improvement in consumption habits. This is directly linked to customer awareness of the qualities of environmentally friendly products [
110]. It is often known as green consciousness, and its influence on consumer behavior is significant [
111]. Green awareness alters customers’ perspectives on limiting the use of traditional products to endorse and select environmentally beneficial products [
112]. In general, environmental awareness can be measured by an individual’s knowledge and attitude toward the environment, which often involves effort, label, slogans, symbols, and brands [
113]. Other techniques that influence the green awareness of the customer include the company’s green brand image [
114]. Finally, green consciousness is a source of the customer’s intention to purchase the product as a result of the company’s green advertising and the green brand [
115].
We also find research on “consumption behavior–marketing–perception”. This indicates the line of research that tries to influence the perception and behavior of consumers with marketing [
115]. This research line is mainly based on green awareness being able to flourish due to the application of green marketing by a company [
116]. Moreover, it is known from the literature that the consumer’s purchase intention is influenced by environmental knowledge of environmentally friendly products [
87]. Therefore, modern companies must modify their marketing approaches to become proactive and learn more about the influence of green awareness on customer behavior [
117].
In addition, this line of research has had the effect of an increase in the degree of green consumer awareness by the marketing strategy of a company based on an environmental awareness that is reflected in green advertising [
111]. Furthermore, it is important to note that generally, in the minds of customers, an effective green mark image is developed through a sequence of perceptions [
114]. This is further evidence that corporations should engage in green advertising with product promotion that incorporates environmentally friendly components [
87]. It also noteworthy that previous research has shown that green advertising can increase customers’ purchase intention [
118] and add value to a business [
119]. Further development in this sense establishes that marketing campaigns should not involve only an environmentally friendly product characteristics; environmental sustainability features can and should be displayed [
117].
3.4.3. Strategic Evolution of the Themes
Scimat provides strategic diagrams of the arrangement of themes in terms of centrality and density. Centrality should be understood as the degree of interaction between two networks and is a measure of the importance of a topic within the entire context of a research field. The greater the number and strength of these relationships, the more the cluster will present a set of research problems that the scientific or technological community considers crucial. Density measures the internal strength of a network or the development of a theme. The stronger these links are, the more the research problems corresponding to the cluster form a coherent and integrated whole. Density provides an appropriate representation of the cluster’s ability to sustain and develop over time in the field under consideration.
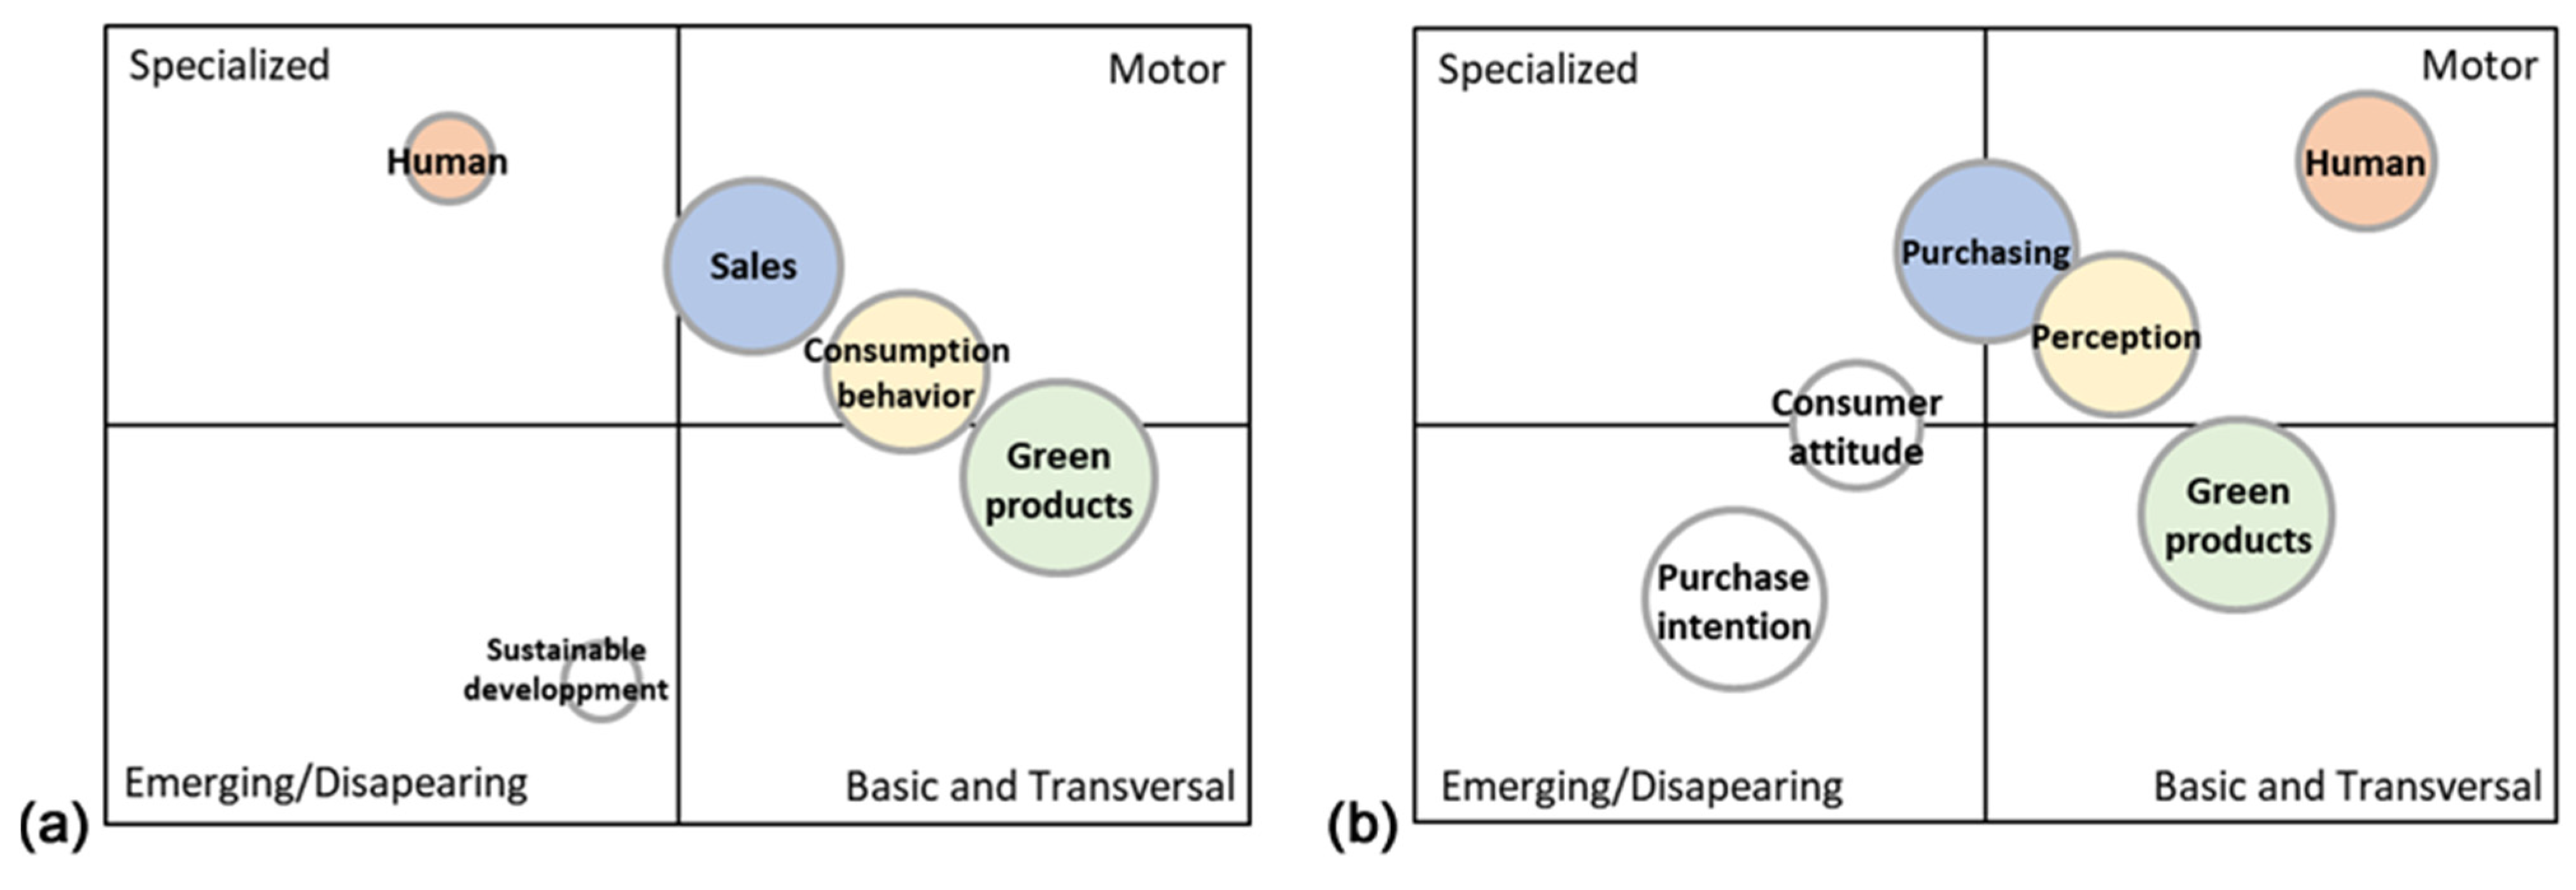
This allows us to study the scientific positioning of the themes. In this case, it is particularly interesting to see the situation in period three, from the era of diversification to the most current period, or period five.
Figure 5 shows these two periods. Each chart can be analyzed as follows. With its high density and strong centrality, the upper right quadrant represents the “motor themes”. The upper left quadrant represents “specialized themes”, which are highly developed and isolated clusters. The lower right quadrant contains significant but underdeveloped topics, or “transversal but basic themes”. The left lower quadrant, low density, and low centrality, reflects “developing or disappearing themes” [
120,
121,
122].
To further complete the strategy diagrams, we use a standard scientific impact measure. Hirsch invented and defined the h-index to assess a researcher’s productivity based on his or her publications and citations [
123]. However, the h-index calculated will not be affected by citations obtained by few highly cited articles [
124]. On the other hand, the g-index gives greater weight to highly cited publications [
124]. Therefore, few very successful articles distort the g-index [
125]. Consequently, we use the hg-index, which is calculated as the geometric mean of the h and g indices. This index is considered more adapted because it supplements the deficiencies of the two popular indices. In
Figure 5, the diameter of each sphere represents the hg-index.
Further information represented in the graphs is the inclusion of the lines of research previously identified in
Figure 4. These lines are differentiated by the different colors of each sphere. It can be observed that in both periods, the term with the greatest impact was “green products”, once again validating previous observations of the tendency of the literature to use the term “green” for ecological products since the first period (cf.
Figure 4). It is also interesting to note that in both periods, the term “green products” is considered a transverse term but with a tendency to be a motor theme, especially in period three.
In the big picture, “green products” currently tends to be a slightly less motor theme because, as seen in period five, the most motor theme currently is “human”, which has maximum centrality and density and is a developed and structured theme of the field of ecological products. This theme is no longer specialized compared to period three. At this time, the theme “human” was considered important for specific scientific developments. In addition to becoming more transversal, the relevance of the theme increased in period five, as we can see by the larger diameter of the sphere.
Sustainable development was an emerging theme with relatively low scientific impact in period three. However, as seen in the paths of
Figure 4, this theme has been bifurcated, mainly in “purchase intention” and “consumer attitude”. In both cases, the relevance of the derived themes increased, especially in the case of “purchase intention”. The reason why sustainable development has been divided into two may be because sustainability is much more complex and goes beyond studying only the human being, the economy, or society. At the same time, it is more pragmatic to study “purchase intention” and/or “consumer attitude”, which interact in a rather synergistic way with the most motor theme of period five, “human”. Additionally, it interacts well with the other motor themes of “perception” and “purchasing”, as in theories derived from the TPB.
It is important to note, however, that currently, “purchasing” is at the limit of motor themes with a specialized theme, indicating moderate transversality. This can be explained by the fact that a good part of the studies of ecological products center on humans, but many are limited to a model with a final dependent variable being the intention of the purchase and not the purchase itself. This is a limitation of the current literature since there are no real benefits to the environment if individuals have good intentions but continue with old habits that are not beneficial to the environment or are blocked by barriers such as price. This last factor is particularly interesting as a barrier to effective purchase. However, convenience, availability, and ease of substitution are other elements that can affect the act of opting for ecological products. All these factors have not been examined in a general way in the literature on green products, thus representing a great opportunity, and, as discussed, the need to achieve more concrete results in terms of environmental impact.
4. Conclusions and Limitations
In this work, we used bibliometric analysis to provide a comprehensive overview of the overall scientific literature concerning green product consumption. As a result of the wide range of possible green products, this approach was deemed the most appropriate for the proposition of this research. In light of the wide scope of the study, the results section was further divided into four sections. Herein, we present the summary of the conclusions of each of the four results subsections sequentially, followed by a discussion of limitations, future work possibilities, and managerial implications.
The first subsection of the results presented a general analysis of the evolution of research on the subject of this study. It was concluded that after a rather slow start in 1974, research on eco-friendly goods began to expand rapidly from 2014 onward. From this point, there was a tendency for the absolute number of publications to increase exponentially over time. This hypothesis was confirmed using regression on an exponential equation to examine the data. This led to an equation with a high coefficient of determination.
The second subsection of the results examined more specifically the most important publications in terms of influence in the scientific community. It was concluded by analysis of the most influential literature that many studies focus on the intention to purchase green items, not actual purchase, with the assumption that individuals act as planned. Furthermore, many prominent product studies have used organic food as a green product. In terms of countries, the United States, China, and India lead the world in terms of scientific productivity; in fact, these three nations account for approximately half of the world’s scientific production. Asian countries also dominate the largest producers, with two exceptions being the United States and Brazil.
The third subsection performed a mapping of global knowledge on the subject. In the available literature overview, it was possible to identify four clusters. The first cluster focuses on green consumers and purchases. Intent studies highlight the motivating variables that drive green product purchase behavior. The second cluster revolves around the market; companies that provide green goods are in continuous rivalry with other companies, so adapting quickly to market trends and demands is crucial. Green goods will be more dominant if sellers can understand and respond to market trends and desires. The third cluster revolves around companies. Positive green industries have been working to create sustainable development to gain a competitive edge in a dynamic global market. Finally, the fourth cluster focuses on SEM and the TPB. SEM tests a model’s compatibility with its theory. The TPB remains one of the most widely used frameworks in consumer behavior research.
In the fourth subsection, the evolution of research topics was examined longitudinally. From the data, five periods could be defined. These five periods constitute four eras of research since the final era is divided into two sections to compare the current (incomplete) year with the two full first wave years. In the 36 calendar years covered by the first era, only 15 years included published studies. The second era started a wave of greater green product research. In the third era, the number of journals peaked, and publications also promoted an increase in “open access” materials. After the diversification of the third era, the fourth era consolidated the journals.
Additional conclusions were also drawn from the longitudinal analysis, where we observed only two lines of research covering all five time periods. The first shows that research has always focused on the link between environmentally friendly objects and the consumer’s willingness to make a purchase. The second line illustrates how the research line was developed from the customer’s purchase intention in green products to the sale and purchase itself, known as the consumer fact. Two other lines of study started in period three. The first shows that the research focuses on people, which is not unexpected and is consistent with the concept that consumers are the main focus of research on green products. The other line of research describes the field of study that attempts to affect customer perception and behavior through marketing.
It was also interesting to observe that by comparing the period of diversification with the current period, in both moments, “green products” had greater influence in a strategic analysis. “Green products” are borderline in both eras but tend to be emergent in period three. “Green products” tend to be less of a driving theme in period five because, as observed, the primary driving theme is “human”. “Shopping” approaches the border of emerging with a specific theme, showing modest transversality. This is because many human-focused studies on ecological goods use a model with customer intent as the dependent variable.
Therefore, it can also be concluded from our findings that an important limitation of the literature is not considering the purchase itself as the final dependent variable. This is important because there are no genuine environmental advantages if people have good intentions but maintain old practices or are held back, for example, by price. This final component is especially of interest to research as a barrier to a successful purchase, although the convenience, availability, and simplicity of alternatives are also important. We recommend further research in this sense to balance the literature. There is enormous research potential in specific quantitative research to translate general good intentions into a real consumerism pattern for specific environmental effects.
Finally, as a result of the extensive review of the scientific literature, some important managerial implications can be identified. The demand for environmentally friendly products has increased in recent decades, and companies that support and understand sustainable development have an advantage over their competitors. Consumers must perceive a company’s actions as environmentally conscious if the company wishes to maintain its image and reputation. Furthermore, businesses can take advantage of the positive image and emphasize their commitment to social responsibility, in addition to offering greener products. As a result of the creation of a strong brand, companies might be less vulnerable to competitive marketing actions, enjoy greater margins, and have greater possibilities for brand extension. A smart business is able to see environmental issues as potential opportunities for new business rather than as risks and is able to meet customer demands more profitably. Companies should prioritize their growth through the introduction of new ideas about green goods, thereby transferring new knowledge on this topic to consumers.


