Article

Evaluation of Urban Green Building Design Schemes to Achieve Sustainability Based on the Projection Pursuit Model Optimized by the Atomic Orbital Search

1
Design and Research Institute of Nanchang University, Nanchang University, 235 East Nanjing Road, Nanchang 330096, China
2
College of City Construction, Jiangxi Normal University, 99 Ziyang Avenue, Nanchang 330022, China
3
College of Architectural Engineering and Planning, Jiujiang University, 551 Qianjin East Road, Jiujiang 332005, China
4
School of Civil Engineering and Architecture, Wuhan University of Technology, Wuhan 430070, China
5
Shanxi Academy of Urban & Rural Planning and Design Co., Ltd., 9 Xinjian South Road, Taiyuan 030000, China
*
Author to whom correspondence should be addressed.
Sustainability 2022, 14(17), 11007; https://doi.org/10.3390/su141711007
Submission received: 26 July 2022 / Revised: 29 August 2022 / Accepted: 31 August 2022 / Published: 3 September 2022

Abstract

:
The popularization and use of green buildings are of great significance for reducing the carbon emissions of buildings and achieving sustainable development. Scientific evaluation of the green building design scheme is the key factor in ensuring the popularization and use of green buildings. To overcome the shortage of a systematic evaluation index system and comprehensive evaluation method, an evaluation index system of green building design schemes and an evaluation method based on the projection pursuit model were developed. First, according to the needs of green building development, an evaluation index system of green building design schemes was systematically constructed from the five aspects of the economy, the resource utilization index, environmental impacts, technical management, and social impacts. The calculation methods of all secondary indexes are provided in detail. Then, a novel evaluation method based on the projection pursuit model optimized by the atomic orbital search was constructed. This method searches for key influencing factors and determines the evaluation grade from the evaluation data structure, and realizes the scientific and objective evaluations of green building design schemes. Finally, the Nanchang Hengda Project was selected to conduct a detailed empirical study. The research results show that the incremental net present value of the investment, the energy consumption of the air conditioning system, and the ratio of the window area to the indoor area are the most important secondary indexes. Moreover, the environmental impact index was found to be the most important primary index. Via comparisons with different optimization algorithms and evaluation methods, the superiority of the proposed model is proven.

1. Introduction

Globally, energy resource shortages are becoming worse. In 2022, the global energy shortage is expected to reach 9%, and the price of fossil energy is rising rapidly. More than half of the material and water resources obtained from the natural environments of human beings are used in the construction industry and affiliated industries, resulting in large amounts of air pollution, water pollution, light pollution, and electromagnetic pollution [1,2]. Moreover, the energy consumption per building area in developing countries is two to three times that in developed countries. Therefore, the reduction in energy consumption from the construction industry and the decrease of adverse impacts on the environment from the construction industry are unavoidable problems that must be solved for society to achieve sustainable development.
Green buildings, also called sustainable buildings, refers to minimizing the impact of a building on the environment via creative structures and designs, and resource savings during the building’s life cycle [3]. Compared to traditional buildings, green buildings are able to make effective use of energy, water, and other resources, protect the health of occupants, improve productivity, and reduce garbage, pollution, and biodegradability [4]. The promotion of green buildings is an important method to realize energy conservation and emission reduction in the construction industry, and is also a key measure for the realization of the sustainable development of society [5]. Unlike other developing countries that adopt international investment and international standards to develop green buildings [6], almost all green buildings in China adopt domestic investment and domestic evaluation standards for green buildings. For this reason, the research of this paper mainly adopted China’s national norms.
The planning stage is the foundation of a project. The cost of an architectural design scheme is less than 5% of the project cost, but it determines the purpose of more than 70% of the project costs [7,8]. There was a lack of scientific (and effective) evaluation of the design scheme at the design stage, so the popularization and application effects of green buildings are not as good as expected. There are two principal reasons for this predicament. (1) The evaluations of green building design schemes are very complicated and involve many aspects, such as architectural engineering design, construction, and operation. A variety of green building evaluation standards that have been issued only evaluated the design schemed of green buildings from single dimensions, which could not effectively deal with their complexities. (2) The evaluation of green building design schemes involves a typical comprehensive evaluation problem. Commonly used comprehensive evaluation methods include the analytic hierarchy process (AHP) [9], value engineering [10], matter–element extension theory (MET) [11], the technique for order preference by similarity to an ideal solution (TOPSIS) [12], and fuzzy comprehensive evaluation (FCE) [13]. However, these methods are almost all qualitative analysis methods. These research methods are only susceptible to subjective factors and cannot make full use of the evaluation data of green building design schemes.
The projection pursuit model is a typical data-driven method that can directly obtain the evaluation results from the structural characteristics of the evaluation data. PPM has been successfully used in the decision support model for the bidding of construction projects [14], group optimization–projection tracking evaluation [15], waterlogging risk assessments of deep foundation pit engineering [16], and the calculation of the weights of seawall safety evaluation indexes [17]. Solving the optimal projection vector in the PPM is essential to ensuring the correctness of the calculation results. At present, meta-heuristic optimization algorithms are often used to solve it. AOS was a new intelligent optimization algorithm proposed in 2021 [18]. It is optimized based on some principles of quantum mechanics and the behavior of the quantum atom model and is characterized by robust optimization ability and a fast convergence speed. As the algorithm has just been put forward, it has not been implemented in practical engineering.
Based on the preceding analysis, an evaluation index system and a comprehensive quantitative evaluation method for green building design schemes were constructed in this study. The main contributions of the thesis are as follows. (1) The economic indicators, resource utilization indicators, environmental impact indicators, technical and management indicators, and social impact indicators of green building design schemes were comprehensively considered to construct a comprehensive evaluation index system. This index system expands the dimensions of the traditional evaluation system of architectural design schemes, and effectively responds to the complexity of the evaluation of green architectural design schemes. (2) Based on the projection pursuit model (PPM) optimized by the atomic orbital search (AOS), A comprehensive evaluation model of green building design schemes was constructed. Based on the evaluation of data structures, this model seeks the key influencing factors, determines the evaluation grades of green building design schemes, and realizes the scientific and objective evaluations of green building design schemes. (3) The Nanchang Hengda Project, different from the simulation examples used in other studies, was selected to conduct a detailed empirical study. Insights are provided, and the findings have engineering guidance value for related research.
The arrangement of the remaining chapters is as follows. Section 2 summarizes the research work associated with this study. In Section 3, the evaluation index system of green building design schemes is presented, and the data acquisition methods of all indexes are provided in detail. In Section 4, an evaluation model based on the PPM optimized by AOS is presented. In Section 5, the Nanchang Hengda Project is presented (to accomplish an empirical study). In Section 6, the computational performances of classical research methods and the proposed model are compared. Section 7 summarizes the research results and lists the main limitations of this work.

2. Related Research

The research results related to green buildings mainly evaluated the design schemes of green buildings from a single dimension, which could not effectively deal with their complexities. Chen et al. [8] analyzed passive and active technologies for the reduction of the carbon emissions of green buildings, and comprehensively evaluated various influencing factors, such as the building layout, building envelope thermophysics, and building geometry. However, the economic rationality and other influencing factors of green buildings were not discussed. Meng et al. [19] constructed an evaluation index system for the green renovation of existing buildings from the architectural dimension. Parallel to the research results of Chen et al. [8], the evaluation index system focused on the factors related to energy conservation and environmental protection without considering other factors. Yuan et al. [10] analyzed the green building envelope from the perspective of economic rationality via value engineering and the building information model (BIM). Their paper was not able to quantitatively analyze the value and function of the green building, which were the two most important indexes of value engineering. Different from other studies, only economic factors were considered; green buildings in relation to resource savings, protecting the environment, and their influences on society were not considered. Omar et al. [20] analyzed the practicality of green buildings from the perspective of improving the indoor living environment. Acomea-Frimpong et al. [21] analyzed the economy of green buildings from the perspective of macroeconomics, their research results were of great significance to the green building industry, but lack specific engineering guidance values for green building projects.
Qualitative methods have always been used in relevant research. This is associated with the low credibility of research results and a large amount of quantitative data on green building designs not being effectively used. To effectively evaluate the green performance of building products, Huang and Wang [22] ‘set out’ from the whole life cycle of the project, and constructed an evaluation method based on the AHP and gray relational analysis. Xu and Sun [9] stressed the importance of developing green buildings to achieve the goal of sustainable development and established a green building evaluation model based on the fuzzy comprehensive evaluation. They mainly demonstrated the rationality of the evaluation index system of green buildings but did not demonstrate the scientificity and effectiveness of the evaluation model. The AHP, which was easily influenced by the extreme opinions of experts, was used to calculate the index weight, so their research results were subjective. Moreover, the FCE needed to set the membership functions artificially. Via the decision-making trial, evaluation laboratory, and analytical network process (DANP), Shao et al. [23] formulated an evaluation model for the development of green buildings. DANP is a novel sociological research method but it can only use the subjective judgment of experts instead of quantitative data. Kuo et al. [13] comprehensively utilized the fuzzy AHP and the fuzzy transformation matrix to analyze the relevant policies of intelligent green buildings in Taiwan, China. It was noted that the green building measures in the planning and design stage were superior to those in the construction or operation stage. Li et al. [11] constructed a green building operational performance evaluation model based on the MET and the entropy weight method. In addition, they found that the evaluation system of green buildings was not perfect, which seriously restricted the promotion and application of green buildings. MEF is also a classical subjective evaluation method, and the evaluation results are easily influenced by the subjective opinions of experts. Bo et al. [7] posited that almost all the evaluation fields of green buildings adopt qualitative analysis methods and that the research results lack credibility. Therefore, they developed a quantitative evaluation model via the least-squares support vector machine (LSSVM), and empirical research showed that the LSSVM, a nonlinear modeling tool, had better evaluation accuracy.
The PPM is a typical data-driven method that can directly obtain the evaluation results from the structural characteristics of the evaluation data. Zhang et al. [14] put forward a PPM-based decision support model for the bidding of construction projects. The empirical study showed that this method could meet the engineering requirements better than the current binding decision-making methods based on the subjective evaluation of contractors in the construction industry. To obtain information for the evaluation of the carrying capacity of water resources from management information, Yu et al. [15] proposed an evaluation model of group optimization–projection tracking evaluation. The chicken swarm optimization model was compared with three other algorithms—the particle swarm optimization (PSO) algorithm, the firefly algorithm, and the path-finding optimization algorithm. Wu and Wang [16] effectively processed the data of the waterlogging risk assessment of deep foundation pit engineering via PPM. PSO was utilized to solve the complex function of the PPM, but it was not compared with the latest meta-heuristic optimization algorithm. To improve the accuracy of seawall safety evaluation results, Lan and Huang [17] utilized the PPM optimized by the water circulation algorithm to calculate the weights of seawall safety evaluation indexes.

3. The Evaluation Index System of Green Building Design Schemes

3.1. Analysis of the Evaluation Factors

The traditional evaluation of architectural design mainly includes safety, economy, applicability, and aesthetics. The evaluation of green building design schemes is also required to consider the economy of incremental investment, saving resources, protecting the environment, and the impact on society [7,24]. Referring to the assessment standard for green building (GB/T 50378-2019), the Leadership in Energy and Environmental Design building rating system established and implemented by the U.S. Green Building committee, and the research achievements in the field of green building, the primary indexes include the economic index ( X 1 ), the resource utilization index ( X 2 ), the environmental impact index ( X 3 ), the technical management index ( X 4 ), and the social impact index ( X 5 ). It should be emphasized that most of the researchers analyzed the economy of green buildings from the perspective of macroeconomics, but a typical project was selected to analyze it from the perspective of microeconomics, which has a clearer engineering significance.
X 1 is related to the level of resource input and output benefits of green building design schemes. The fewer resources allocated to the green design scheme, the higher the output benefit and the better the economy. X 2 is primarily used to evaluate the resource-saving, recycling, and reuse of the design scheme, and the final harmless treatment and recycling of wastes. X 3 is used primarily to evaluate the indoor environment of each scheme. X 4 includes the maturity, risk coefficient, organizational structure, and management process in the production and construction process of green technologies adopted in the design scheme. X 5 evaluates the possible social impacts of green buildings.

3.2. Evaluation Index System

According to the analysis in Section 3.2, a comprehensive evaluation index system of green building design schemes was constructed, as shown in Table 1. The selections of secondary indexes were made with reference to the relevant research results, the evaluation standards for green building (GB/T50378-2019), and the Leadership in Energy and Environmental Design building rating system established and implemented by the U.S. Green Building committee. See column 4 of Table 1 for the literature basis of secondary indicators.
In Table 1, a cost index indicates that the lower the index score, the better the design scheme, while a benefit index indicates that the higher the index score, the better the design scheme.

3.3. Definition and Data Acquisition Methods of Secondary Indicators

(1) Project cost.
The project cost ( X 11 ) is the construction cost of the whole building. The data can be obtained by consulting the bidding documents and cost management materials of the project. For the convenience of calculation, unless otherwise noted, the monetary unit used in this article is million CNY.
(2) Incremental net present value (NPV) of investment.
The incremental NPV of investment ( X 12 ) is a dynamic evaluation index that reflects the profitability of green buildings throughout their whole life cycles. The calculation equation of this index is
X 12 = ( Q 1 Q 2 ) F ( P A , i , N ) ( I 1 I 2 ) ,
where Q 1 is the difference in the annual expenditure of the green building, Q 2 is the difference of the annual expenditure of a traditional building, F is the unit price of the expenditure in the later period of construction, I 1 is the initial investment of the green building, I 2 is the initial investment of a traditional building, i the social benchmark rate of return, and n is the year of buildings.
(3) Incremental payback period.
The incremental payback period ( X 13 ) is the time required for the investment recovery increased by the green building design. The calculation equation of X 13 is
X 13 = n 1 1 + | i = 1 n 1 N C F i | / N C F n ,
where n 1 is the number of years in which the accumulated net cash flow has a positive value, i = 1 n 1 N C F i is the present value of the accumulated net cash flow in year n 1 , and N C F n is the present value of net cash flow in the n-th year.
(4) Rate of land use.
The higher the land utilization rate, the lower the building density, the higher the green space rate, and the better the residents’ living experiences. The equation for the rate of land use ( X 21 ) is
X 21 = V t / V l 100 % ,
where V t is the designed and utilized land area, and V l is the total land area.
(5) Energy consumption of the air conditioning system.
The energy consumption of the air conditioning system ( X 22 ) is the sum of the energy consumption of heating for the whole year and the cooling and heating air conditioning system. The ratio of the total annual energy consumption of the heating and air-conditioning system to the building area is the annual energy consumption of the heating air-conditioning system. Its calculation equation is
X 22 = M t / S 100 % ,
where M t is the total annual energy consumption of the heating and air conditioning system (KWh), and S is the building area.
It should be emphasized that when using Equation (4) to calculate the index score of X 22 , the local outdoor meteorological parameters of each month throughout the year should be adopted.
(6) Energy consumption of the lighting system.
The energy consumption of the lighting system ( X 23 ) is one of the main forms of energy consumption of buildings during the operation stage. In case of poor lighting conditions or special requirements, artificial lighting must be adopted to make up for the shortage of natural light. The calculation equation is
X 23 = φ E a v η s U K ,
where φ is the lamp efficiency, Eav is the average illuminance, ( lm / m 2 ), η s is the average lighting efficiency of the light source (including the ballast) in the room (lm/w), U is the utilization coefficient, and K is the maintenance factor.
(7) Utilization rate of reclaimed water.
Reclaimed water utilization is one of the main measures by which to save water in green buildings. From the economic perspective, the cost of reclaimed water is the lowest, and from the environmental perspective, sewage recycling is helpful for improving the ecological environment and the realization of a virtuous cycle of water ecology. The calculation equation of the utilization rate of reclaimed water is
X 24 = W m W l 100 % ,
where W m is the designed usage of the reclaimed water, and W l is the total design amount of water. For the convenience of calculation, all units of water consumption in this study are m 3 .
(8) Utilization rate of rainwater.
Rainwater collection and utilization design are other important measures for the sustainable utilization of water resources. The calculation equation of the utilization rate of rainwater ( X 25 ) is
c = W r W l 100 % ,
where W r is the rainwater utilization and W l is the total design water consumption.
(9) Utilization rate of new wall materials.
The use of new wall materials can effectively reduce environmental pollution, reduce production costs, increase the use area of houses, reduce the weight of buildings themselves, and help to resist earthquakes. The calculation equation of X 26 is
X 26 = U t U l 100 % ,
where U t is the wall volume using new wall materials and U l is the total wall volume, the units of which are both m 3 .
(10) Recovery rate of construction waste.
In the design of green buildings, the disposal of waste generated during the construction process and the site cleaning in the later stage of construction should be planned, and the requirements of recycling should be met. This indicator can be measured by the recovery rate of construction waste:
X 27 = G r G a 100 % ,
where G r is the total weight of the designed recycled building materials, and G a is the estimated total weight of the waste building materials. For the convenience of calculation, all units of weight in this study are T.
(11) Indoor sunshine.
Building sunshine is very important for people’s psychological and physiological health. The indoor sunshine design of green buildings should conform to the current national standards, and the sunshine quality cannot be analyzed simply via the sunshine spacing coefficient. The measurement standard should include the sunshine time and sunshine quality. The test standards of these two indicators can be made with reference to the relevant provisions in the code for the planning and design of urban residential areas (GB 50180). The evaluation method is based on design drawings and sunshine simulation calculation, and a comprehensive score is used to obtain the score of X 31 .
(12) Ratio of the window area to the indoor area.
Good natural ventilation design can improve the indoor air quality and thermal environment to the maximum extent in the mode of zero energy consumption. Active ventilation with induced airflow should be adopted in green building design. The ratio of the window area to the indoor area ( X 32 ) is used to describe the ventilation performances of green buildings:
X 32 = A c A d 100 % ,
where A c is the area of the side window opening, and A d is the floor area of the room. The unit is m 2 .
(13) Effect of sound insulation and noise reduction.
Green buildings should control the indoor background noise level, and reasonable arrangements should be made for building partitions and space functions during design. According to the design drawings, simulation experiments of air and sound insulation and impact sound insulation were carried out to measure and calculate the sound insulation and noise reduction effect, after which a comprehensive score was assigned. Please see the code for the design of the sound insulation of civil buildings (GB50118-2010) for the calculation rules of this indicator.
(14) Technical difficulty of construction.
Due to the preliminary application of green building construction technology, it is necessary to evaluate its difficulty and safety reliability. As there are many kinds of construction technologies, a comprehensive qualitative index was selected. The index data of all qualitative indexes used in this study were obtained by questionnaire survey.
(15) Reduction of the construction period.
The construction period is an index reflecting the quality of engineering construction management from the perspective of construction speed. The reasonable planning/design of the construction period is a key point that the construction party pays attention to. The calculation equation of the reduction of the construction period is
X 42 = B x B y 100 % ,
where B x is the saved time limit and B y is the planned time limit. The unit of B x or B y is days.
(16) Difficulty of project management organization.
To ensure the quality of green buildings, a reasonable organizational structure and management process should be planned. A comprehensive qualitative index is selected because of the complexity of project management,
(17) Ratio of the total energy supply of green building projects to the GDP.
The energy consumption of the building area per GDP ( X 51 ) reflects the energy utilization efficiency of green building projects. It is an index of energy utilization efficiency. The calculation equation of this index ( X 51 ) is
X 51 = B t P t 100 % ,
where the unit of X 51 is one ton of standard coal/10,000 CNY, B t is the total energy consumption, the unit of which is tons of standard coal, and P t is the gross production value of the green building project, the unit of which is 10,000 CNY.
(18) Coordination between architectural modeling and regional planning.
The external shape design of green buildings should be coordinated with the surrounding environment, regional history, and regional control construction planning. This index is a qualitative comprehensive index.
(19) Effect of protecting the human environment.
Because regional architecture can be regarded as a manifestation of regional history and culture in material form, the elements of the regional development of architecture include the traces of the continuation of history in the transformation of traditional architecture and the indicators of the effects of the protection and development of new buildings on the surrounding human environment. This index is a qualitative comprehensive index.

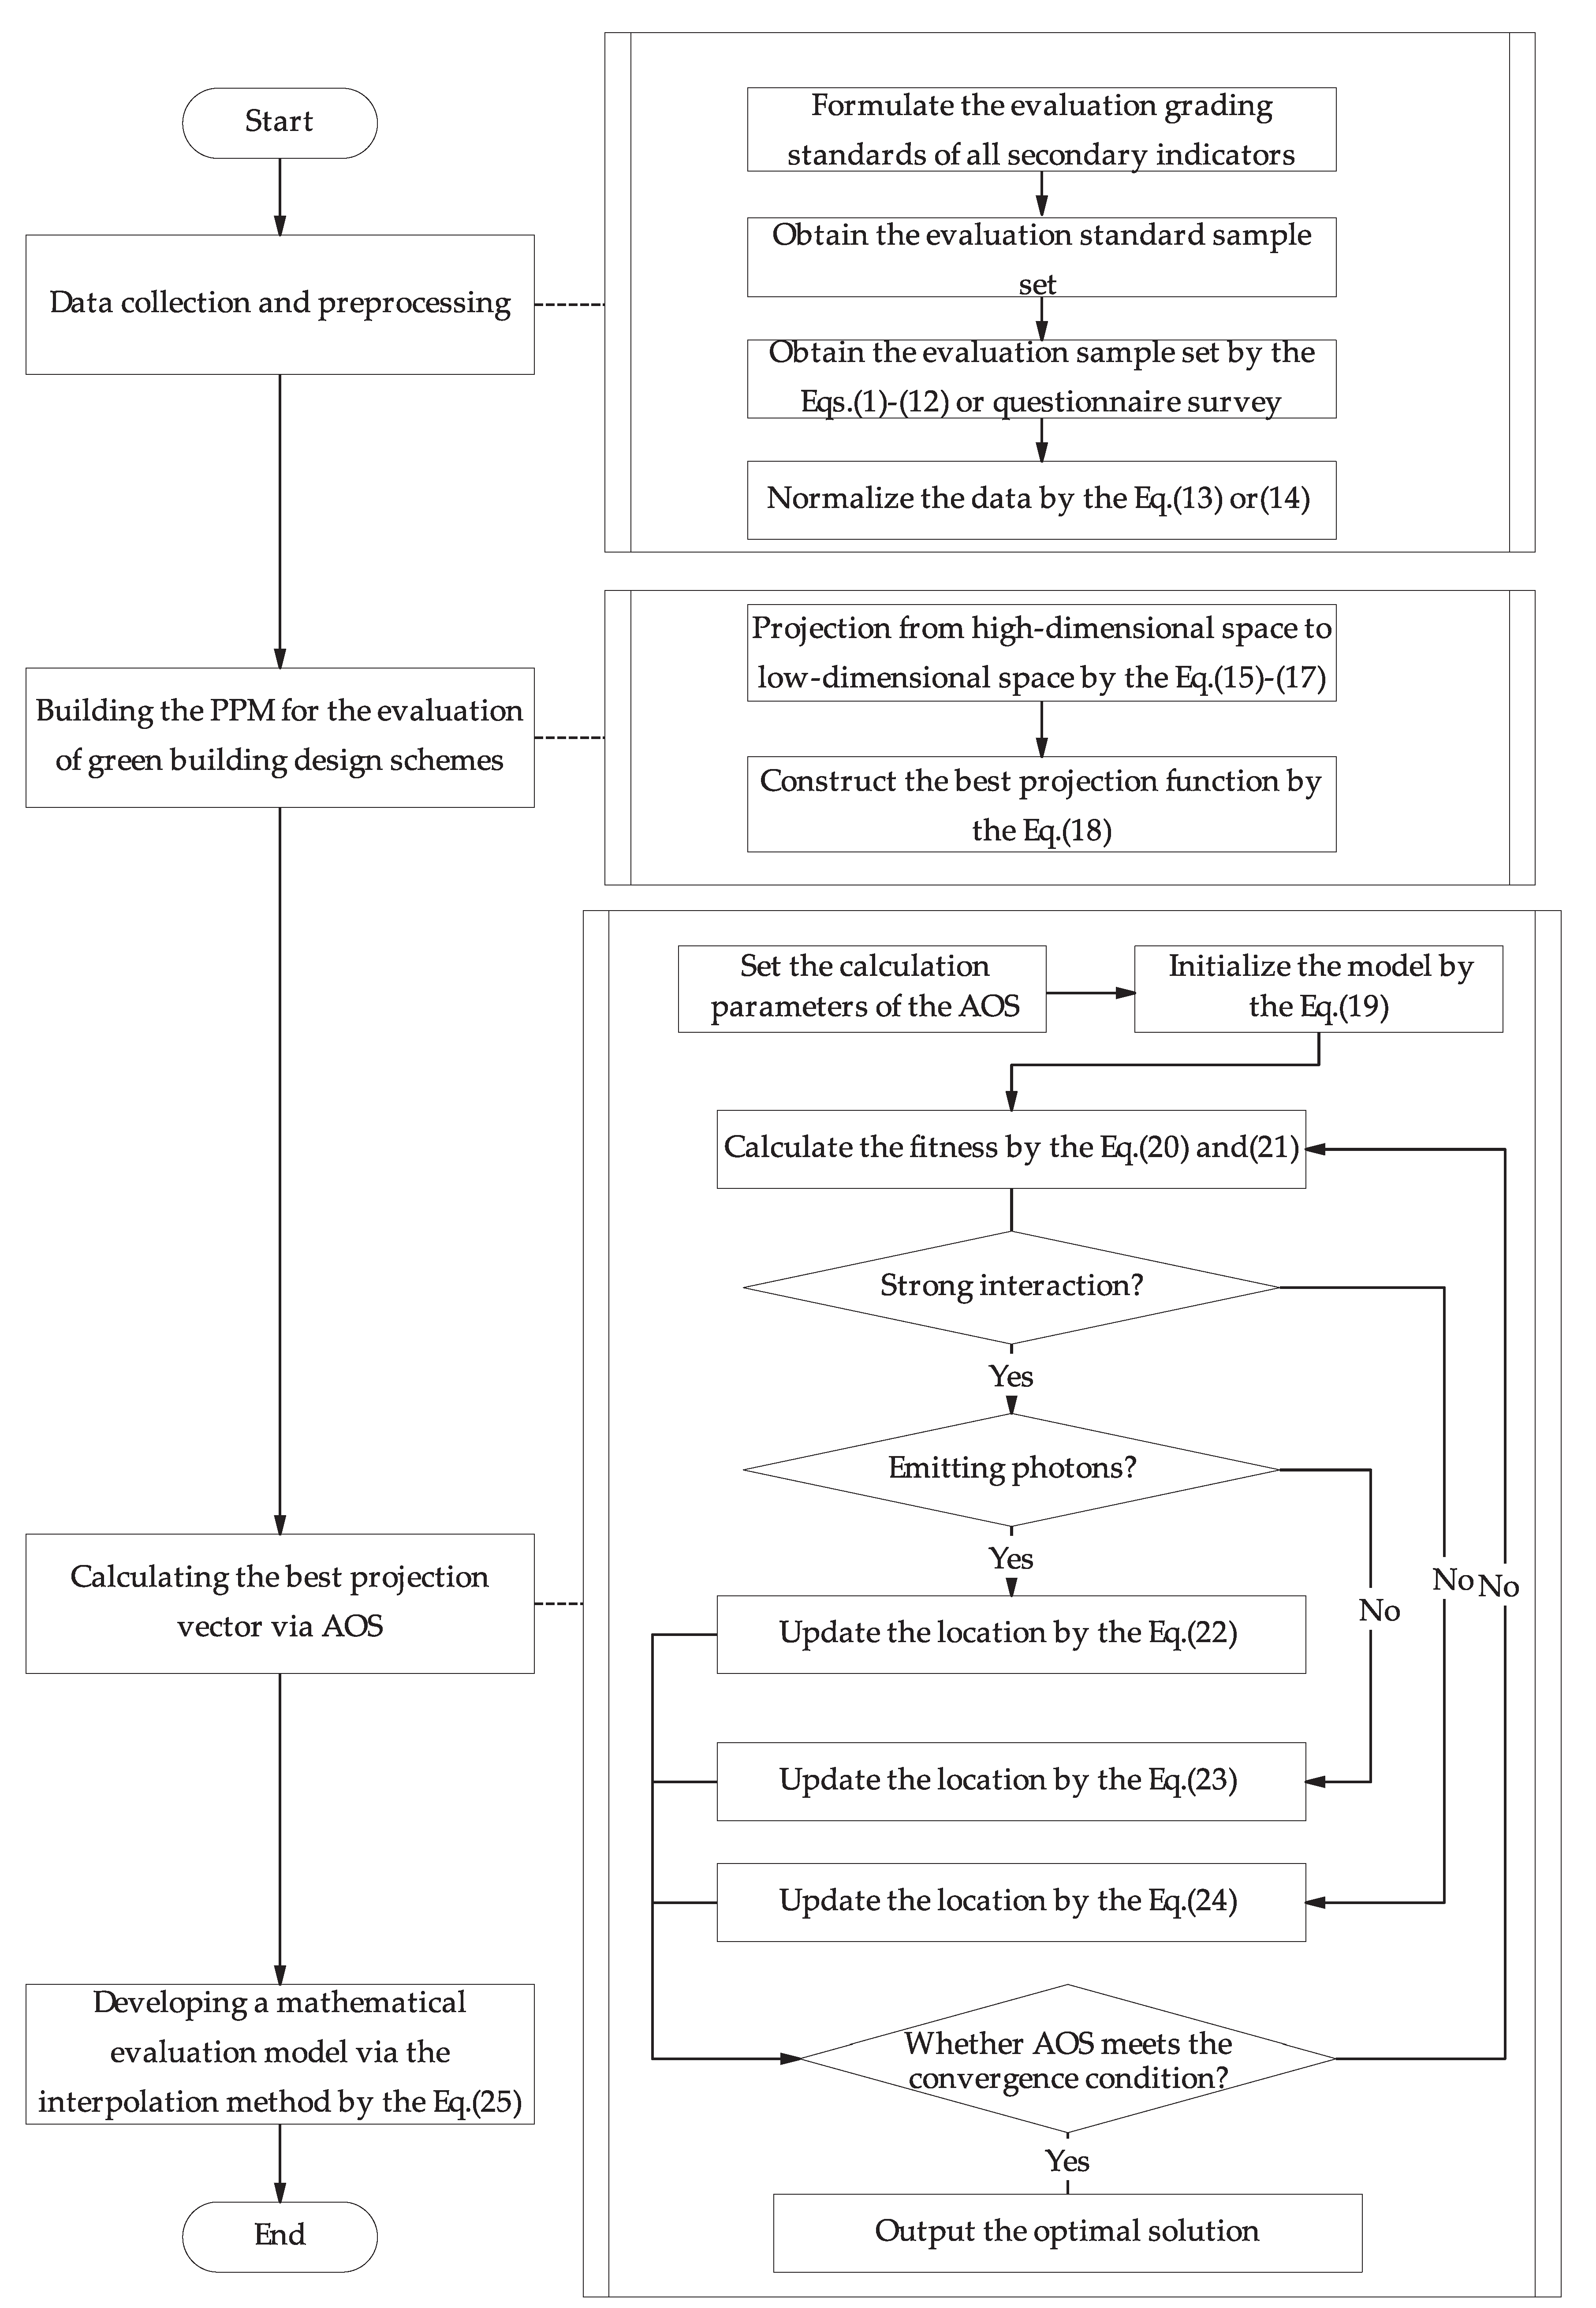
4. The Proposed Evaluation Model of Green Building Design Schemes

According to the general paradigm of systematic evaluation research, the proposed evaluation model of green building design schemes includes the following four parts: (1) data collection and preprocessing, (2) building the PPM for the evaluation of green building design schemes, (3) calculating the best projection vector of the PPM by AOS, and (4) constructing the mapping relationship between the best projection value and the evaluation grade via the interpolation method.

4.1. Data Collection and Preprocessing

Step 1. Formulate the evaluation grading standards of all secondary indicators.
According to the definitions of the 19 secondary indicators, the practical needs of green building design evaluation, the requirements of relevant policy documents and specifications, and the grading standards of all secondary indexes were formulated.
Step 2. Obtain the evaluation standard sample set X 1 .
There are few green building projects in China, and it is difficult to obtain a large amount of data by analyzing the existing engineering cases. Therefore, via random sampling in each evaluation grade interval of each secondary index, enough evaluation standard sample data were generated, and the evaluation standard sample set X 1 was formed. Moreover, the evaluation grade Y = ( y 1 , y 2 , , y ( p n ) ) T of each standard sample in X 1 is known.
Step 3. Obtain the evaluation sample set X 2 of the object to be evaluated.
According to the data acquisition method of each secondary index given in Section 3.3, the data of each secondary index of the object to be evaluated was acquired, and the evaluation sample set X 2 was formed. The elasticity grade of each evaluation sample in X 2 is to be solved.
Step 4. Normalize the data.
Due to the complexity of the evaluation of green building design schemes, there are great differences between the secondary index data and their measurement units, increasing the workload of subsequent optimization calculations. Therefore, Equation (13) or (14) was adopted to normalize all of the data:
Benefit index [16]:
x i j * = x i j m i n ( x j ) m a x ( x j ) m i n ( x j ) ,
Cost index [16]:
x i j * = m a x ( x j ) x i j m a x ( x j ) m i n ( x j ) ,
where x i j is the normalized result, x i j is the original data, and m a x ( x j ) and m i n ( x j ) , respectively, represent the maximum and minimum values of the j-th index.

4.2. Building the PPM for the Evaluation of Green Building Design Schemes

Step 5. Projection from a high-dimensional space to a low-dimensional space. After data preprocessing, the sample data X * = [ x i j * ] were projected to the low-dimensional space [56]:
Z ( i ) = j = 1 d c ( j ) x i j * ,
where Z ( i ) is the projection of sample data in the low-dimensional space, c ( j ) is the projection direction, and d is the dimension of the projection vector and the number of secondary indicators.
The following projection index function is selected [57]:
Q ( C ) = L Z H Z ,
where L Z is the standard deviation of all data in low-dimensional space, and H Z is the local density of all data in low-dimensional space.
L Z and H Z were obtained by Equation (17) [56,57]:
L Z = i = 1 l ( Z ( i ) E ( Z ) ) 2 l 1 H Z = i = 1 l j = 1 l ( R v ( i , j ) ) t ( R v ( i , j ) ) ,
where E ( Z ) is used to represent the average value of Z ( i ) of each sample, v ( i , j ) is the distance between the projection values of the i-th and j-th samples, v ( i , j ) = | Z ( i ) Z ( j ) | , and R is the local density window parameter, the value of which is generally taken as 0.2 L z . Moreover, t ( R v ( i , j ) ) is a unit jump discrete function, and its value is related to the magnitude of R v ( i , j ) .
Step 6. Construct the best projection function.
The following optimal projection functions were constructed [56].
Max : Q ( C ) = L H z st . j = 1 d c 2 ( j ) = 1 ,
Equation (18) is a typical nonlinear optimization problem, and AOS is chosen to solve it. The square of each element in the obtained best projection vector is the objective weight of the corresponding index, and the best projection value reflects the ranking of different methods to be evaluated.

4.3. Title

The core idea of AOS is to simulate the transfer process of electrons outside the nucleus between high- and low-energy states. Electrons can always find a suitable orbit according to their excitation energy, so this algorithm has a good global search ability and fast convergence ability. The main steps of using AOS to calculate the best projection vector can be summarized as follows.
Step 7. Set the calculation parameters of the AOS algorithm.
The AOS algorithm requires the setting of the maximum number of generations, the maximum number of initial candidates, the maximum number of layers around the nucleus, and the photon rate for the position determination of electrons.
Step 8. Initialize the model.
The model was initialized via random initialization [18]:
x i j ( 0 ) = x i , m i n j + R a n d ( x i , m a x j x i , m i n j ) ,
where i = 1 , 2 , , m , j = 1 , 2 , , d , x i j ( 0 ) is the initial position of the candidate solution, x i , m a x j and x i , m i n j are, respectively, the maximum and minimum bounds of the j-th decision variable of the i-th candidate solution, and Rand is a uniformly distributed random vector in the range of [0, 1].
Step 9. Calculate the fitness.
In AOS, the energy state of each electron is regarded as the objective function value. Therefore, the fitness value X k of all candidate solutions is given as follows [18]:
X k = X 1 k X i k X p k = x 1 1 x 1 j x 1 d x i 1 x i j x i d x p 1 x p j x p d ,
where i = 1 , 2 , , p , j = 1 , 2 , , d , k = 1 , 2 , , n , X i k is the i-th candidate solution in the k-th virtual layer, n is the maximum number of virtual layers created, p is the total number of candidate solutions in the k-th virtual layer, and d is the problem dimension.
Then, the objective function value is E k = [ ( E 1 k E i k E p k ) ] T , where E i k is the objective function value of the i-th candidate solution in the k-th virtual layer.
According to the law of electron transition, the electron with the lowest energy level ( L E k ) in each electron orbit is the best. Then, the binding state ( B S k ) of the candidate solutions and the binding energy of the atoms in each virtual layer are as follows [18]:
B S k = i = 1 p x i k p B E = i = 1 m E i m ,
where i = 1 , 2 , , p , k = 1 , 2 , , n , X i is the position of the i-th candidate solution in the atom and E i is the objective function value of the i-th candidate solution in the atom.
Step 10. Update the location.
The interaction with the electron nucleus is complicated and can be divided into three types.
(1) Emitting photons with β and γ energies. The mathematical equation of the position update process is as follows [18]:
X i + 1 k = X i k + α i ( β i L E γ i B S ) k ,
where i = 1 , 2 , , p , k = 1 , 2 , , n , X i k , and X i + 1 k are, respectively, the current and future positions of the i-th candidate solution in the k-th layer, L E is the candidate solution with the lowest energy level in the atom, and the elements in α i , β i , and γ i are random numbers of (0,1).
(2) Absorbing photons with β and γ energies. The mathematical equation of the position update process is as follows [18]:
X i + 1 k = X i k + α i ( β i L E k γ i B S k ) ,
where L E k is the candidate solution of the lowest energy level in the k-th layer and B S k is the binding state of the k-th layer.
(3) There is almost no strong interaction between electrons and nuclei. The mathematical equation of the position update process is as follows [18]:
X i + 1 k = X i k + r i ,
where each element of r i is a random number of (0, 1).
Step 11. Determine whether AOS meets the convergence condition.
We judge whether the current iterative calculation could meet the conditions (according to the preset convergence conditions). If the convergence condition of the minimum calculation error is met, it indicates that the AOS algorithm has found the optimal solution for the PPM, and can terminate the iterative update and enter Step 12. If the preset convergence condition is not met, Step 19 is repeated to calculate the fitness function value of each particle.
Step 12. Output the optimal solution.
The output optimal solution includes the optimal projection direction C and the optimal projection value Z ( i ) of the calculation set.
Each element in the best projection direction C is squared, which is the objective weight of the corresponding secondary index.

4.4. Developing a Mathematical Evaluation Model via the Interpolation Method

Step 13. Develop the interpolation model.
The function mapping relationship between the projected value Z 1 ( i ) of the standard sample set and its preset evaluation grade Y 1 ( i ) can be constructed by interpolation [16].
Y = f ( Z 1 ) ,
Step 14. Determine the evaluation level.
By introducing the projection value Z 2 ( i ) of the evaluation object into Equation (25), the evaluation grade can be quantitatively obtained.

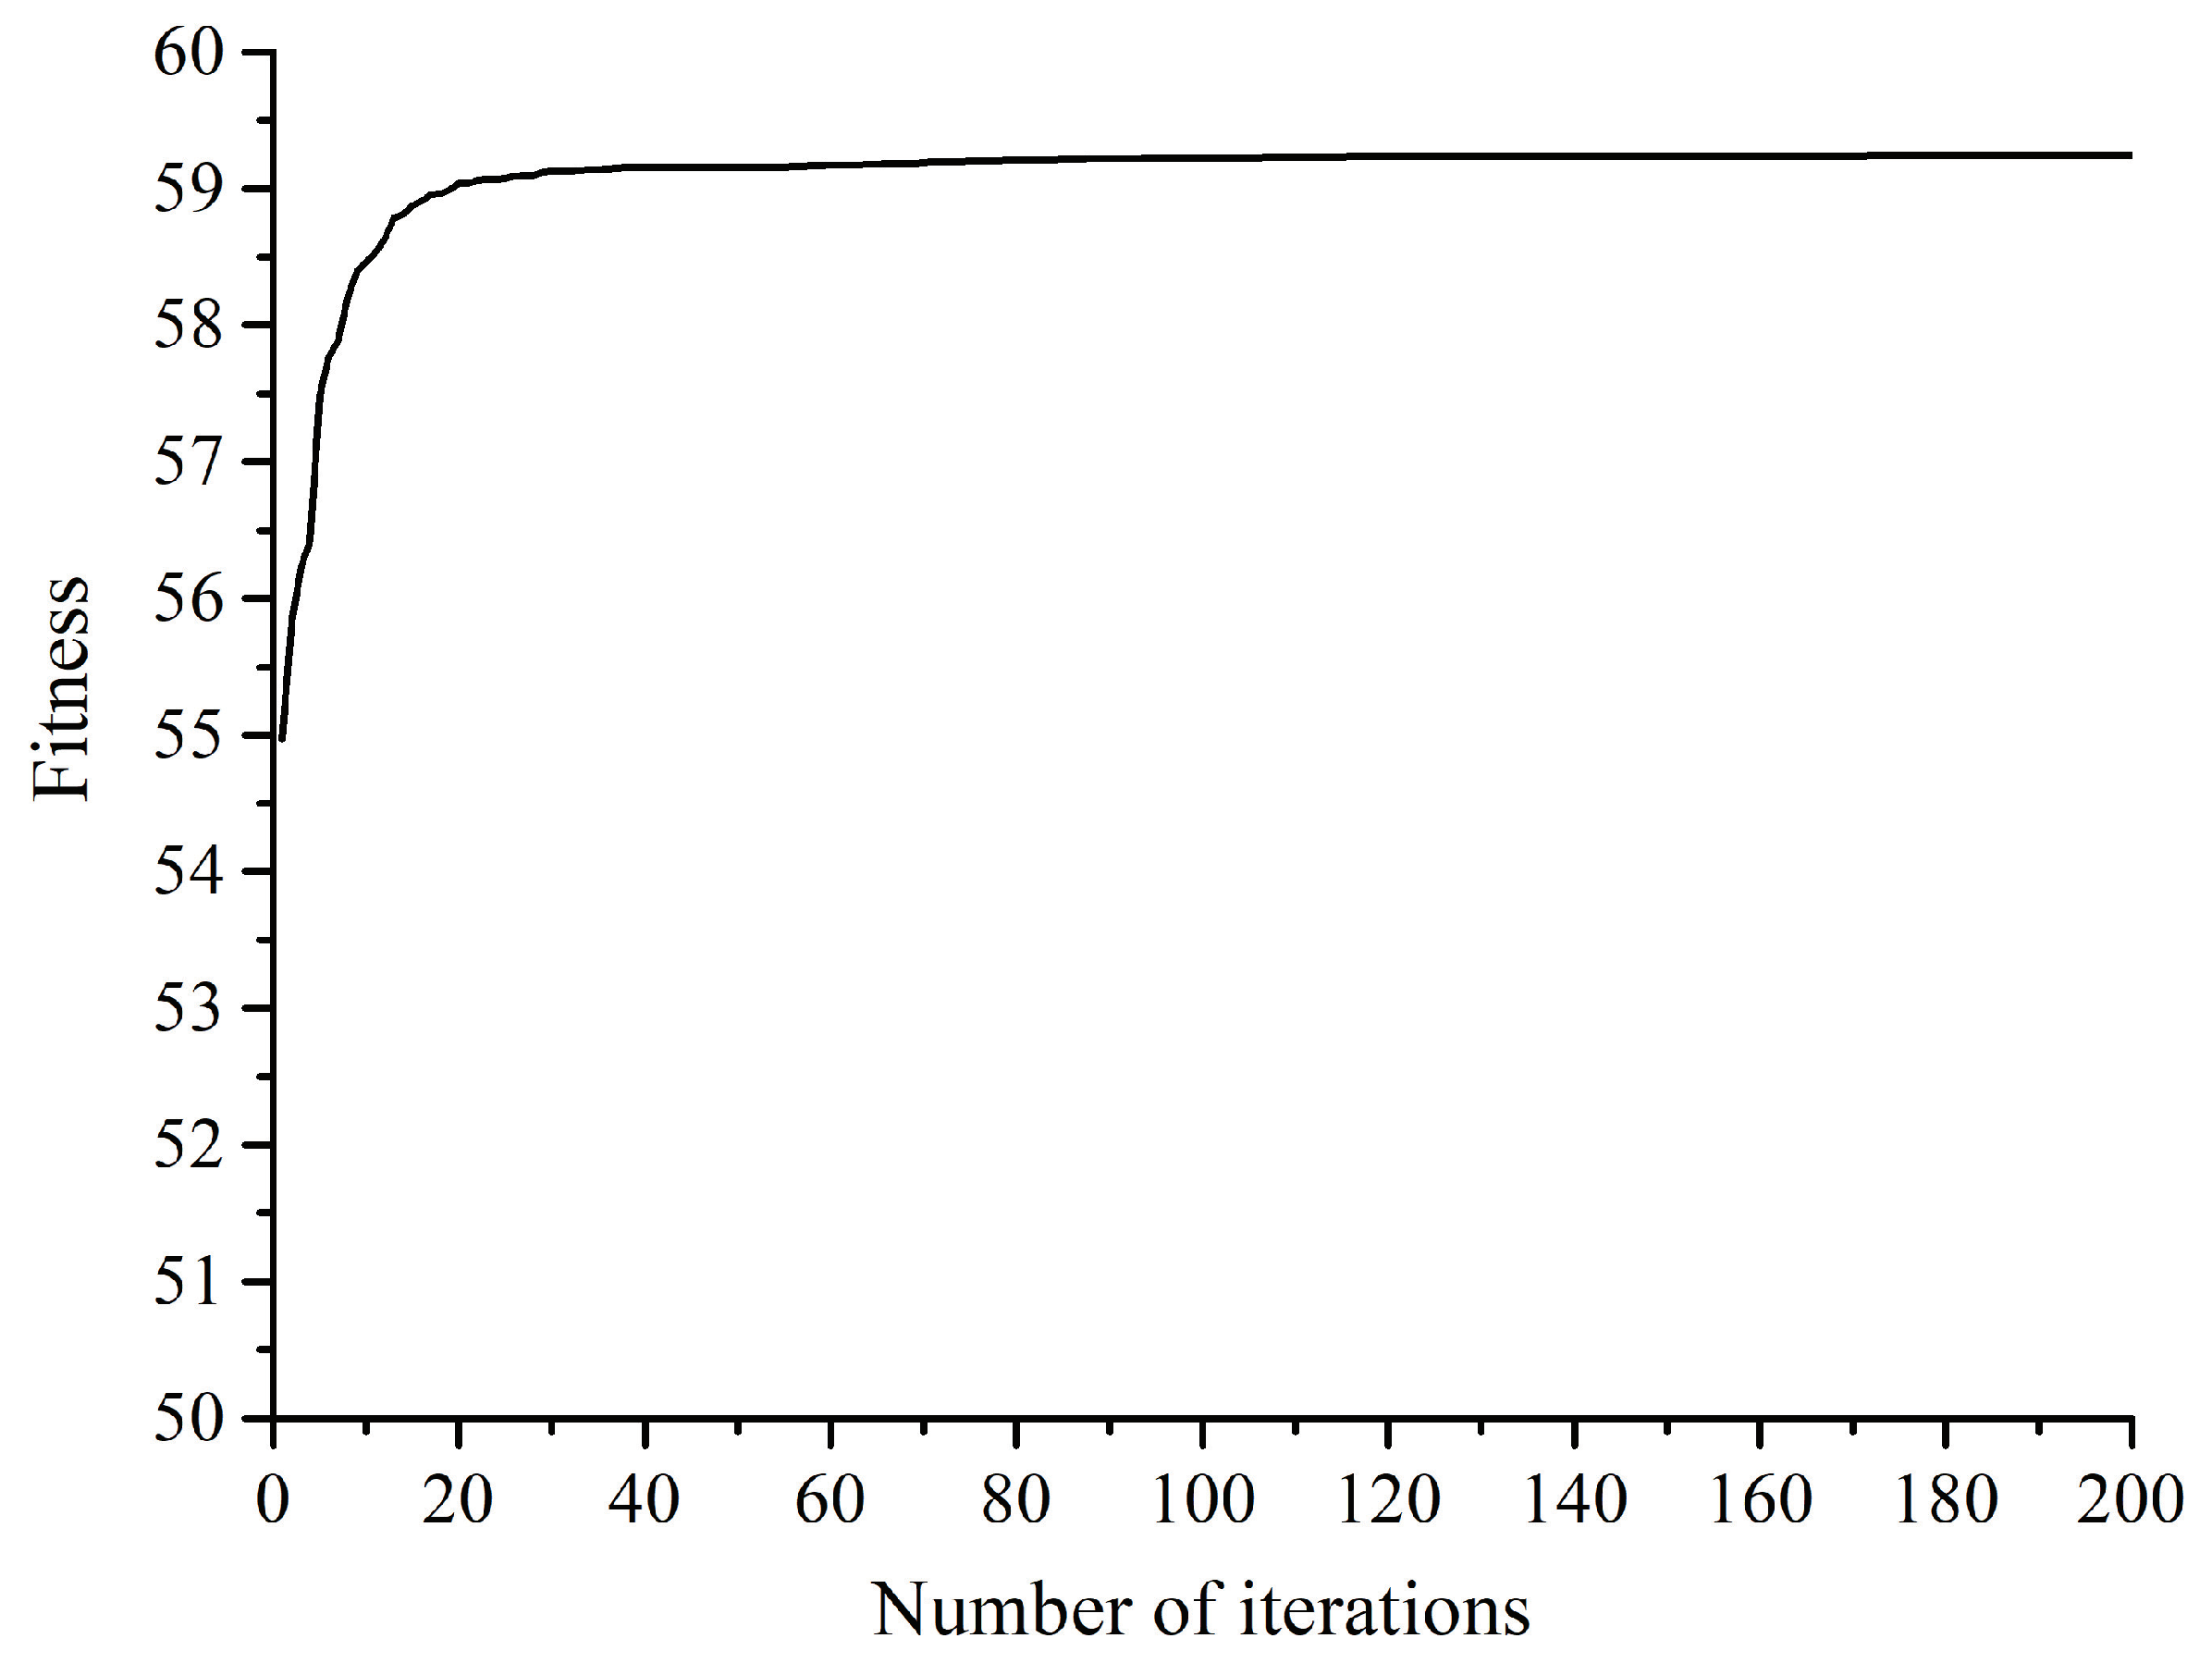
4.5. The Implementation of the Proposed Model

The proposed model is shown in Figure 1.

5. Case Study

5.1. Engineering Background

The Nanchang Hengda Project is located in Nanchang, Jiangxi Province, China. The land area of this project is 85,644.00 m 2 , the total construction area is 297,106.02 m 2 , and the green space rate is 30%. The project was established on 30 June 2017 and completed on 30 June 2020.
The investment in green buildings was 128 million CNY, and the incremental cost of green buildings was 21 CNY/ m 2 . The dynamic payback period of green building investment is about 10 years.
In the green building design scheme of this project, hollow glass with a heat transfer coefficient of 2.7 W / m 2 K was selected for external insulation design, and a split air-conditioning design was adopted. The thermal performance of the envelope was improved by about 15%, the energy consumption of air-conditioning was reduced by about 5%, and tricolor, high-efficiency, straight-tube fluorescent lamps, and energy-saving downlights were selected for lighting. The ‘sanitary’ adopted a water-saving design, and the water efficiency reached level 2. The landscaping design in the residential area adopted a sponge city construction concept, and measures (such as low-potential green space and an ecological retention system) were adopted to reduce the runoff coefficient from 0.9 to about 0.3. The evaluation result based on the code for the planning and design of urban residential areas (GB 50180) was grade II.
According to the evaluation model of green building design schemes put forward in Section 4, a step-by-step empirical analysis of this project was subsequently conducted.

5.2. Data Collection and Preprocessing

Step 1. Formulate the evaluation grading standards of all secondary indicators.
According to the definition of each secondary index of green building design scheme evaluation, the practical requirements of the green building design scheme evaluation management, and the assessment standard for green building (GB/T 50378-2019), the grading standards of all secondary indexes were formulated, as shown in Table 2.
As the case in this paper came from China, the Chinese standard was used instead of the international standard when evaluating the standard division. The case study in this paper does not have global scalability, while the evaluation index system for the green building and the evaluation model based on the projection pursuit had global scalability.
In Table 1, ‘I’ means that the index reaches the basic level in the assessment standard for green building (GB/T 50378-2019), which means that this project only meets the minimum requirements of green building evaluation. ‘II’ indicates one star in the assessment standard for green building (GB/T 50378-2019), ‘III’ indicates two stars in the assessment standard for green building (GB/T 50378-2019), and ‘IV’ indicates three stars in the assessment standard for green building (GB/T 50378-2019).
Step 2. Obtain the evaluation standard sample set X 1 .
According to the evaluation grading standards of all secondary indicators in Table 2, 250 standard evaluation objects in the grade intervals of I, II, III, and IV were randomly sampled, and the standard sample set X 1 = [ x i j ] 100019 was obtained.
The evaluation grade Y 1 = ( y 1 , y 2 , , y 1 000 ) T of each standard evaluation object in the standard sample set is known.
Step 3. Obtain the evaluation sample set X 2 of the Nanchang Hengda Project.
According to the data acquisition methods of all secondary indicators presented in Section 3.3, the evaluation data X 2 = [ x i j ] 1 × 19 of the empirical research object were obtained, as shown in Table 3. The qualitative indicators were obtained by inviting 20 experts to score. The questionnaire results of 20 experts all passed the reliability and validity tests [58].
The technical difference in construction ( X 41 ) was used as an example to illustrate the data acquisition process of qualitative indicators. Because of the complexity and novelty of green building construction technology, a comprehensive qualitative index was selected to describe the influence of construction difficulty of green building construction technology on the green building design schemes. Generally speaking, green building construction technology included the new technology of foundation pit support ( X 41 1 ), the concrete technology ( X 41 2 ), the steel bar and connection technology ( X 41 3 ), the formwork and scaffold technology ( X 41 4 ), the building energy savings and new wall application technology ( X 41 5 ), the building waterproofing technology ( X 41 6 ), the technology of steel structure ( X 41 7 ), the integral installation technology of large components and equipment ( X 41 8 ), and the computer application and management technology ( X 41 9 ).
Twenty experts scored the technical difficulties of green building constructions adopted in certain projects. The scoring table is shown in Table 4. Columns 2–5 of the Table 4 are language descriptions of different evaluation levels of various construction technologies, and the data in column 6 is the scoring result of the first green building project by the first expert.
Averaging the nine scores in column 6 of Table 4 is the scoring result of the first green building project by the first expert of X 41 .
Step 4. Normalize the data.
Equations (13) and (14) were used to normalize the original evaluation data in Table 3, and the calculation results are reported in Table 3.

5.3. Building the PPM for the Evaluation of Green Building Design Schemes

The normalized 1000 standard sample sets and the evaluation data of empirical research objects obtained in Section 5.2 were substituted into a self-compiled program for calculation.
According to previous research results, the parameters of the AOS algorithm were set as follows: the maximum number of generations was 150,000, the maximum number of initial candidates was 25, the maximum number of layers around the nucleus was 5, and the photon rate for the position determination of electrons was 0.1. In this study, the population size and the upper limit of the number of iterative optimization calculations were larger to ensure that the optimal solution could be found.
The convergence curve of the AOS algorithm after program calculation is shown in Figure 2.
As can be seen from Figure 2, according to the optimization calculation process of AOS, the best projection vector was quickly found within about the 130th iteration. The calculation process of AOS was tracked in detail, as presented in Table 5.
As can be seen from Figure 2 and Table 5, the AOS algorithm reached the minimum calculation error requirement in the 127th optimization and found the best projection vector. Recalculation was carried out 100 times, and the AOS algorithm found the best projection vector after 131.54 rounds of optimization, on average. Among these 100 repeated calculations, the best result of AOS was that it successfully found the best projection vector in 103 generations.
The optimal projection direction was a * , and the 19 elements in a * correspond to the 19 secondary indicators. Squaring the values of the 19 elements in a * provides the weight calculation results of the 19 secondary indicators, as reported in Table 6.
The weights of the first-level indexes can be obtained by summing the weights of the second-level indexes under each first-level index. After calculation, the weights of the five first-level indicators are as follows 0.2183, 0.3502, 0.1362, 0.1771, and 0.1183.
Among the secondary indexes, X 12 , X 22 , and X 32 had the largest weights. Connecting with the green design practice of architectural engineering, this result had good interpretability.
Green building design is considered as adding a green building design to traditional building design. This part often increases the initial total investment of the construction project but reduces the use cost of the building in the operation stage. From the research field of microeconomics, the incremental NPV of investment ( X 12 ) could well characterize this imbalance. In engineering practices, the incremental NPV of investment, which shows the economic rationality of the green building design scheme, is the most important factor for the owner to decide on the green building design scheme. Therefore, it can be explained that the weight of X 12 ranked first.
Energy consumption of the lighting system and air conditioning system ( X 22 ) are the main types of energy consumption in the building operation stage. The air conditioning system uses more power, accounting for about 65% of the total energy consumption [59], which is also the main operating cost of the building. X 22 also reflects the thermal insulation performance of walls, the design of the thermal insulation performance of buildings, and other factors. Therefore, it is reasonable that the index weight of X 22 is very large.
The ratio of the window area to the indoor area ( X 32 ) is a contradictory indicator. The larger the value of X 32 , the more the area of windows in this design. In the operation stage of a building, the energy consumption lost through windows is about 50% of the total energy consumption of the building [60,61]. Therefore, with the increase of X 32 , the cost of the building construction and the energy consumption of the air conditioning system would obviously increase. Meanwhile, the larger the window area, the better the living experience of building users. Therefore, the unbiased ratio of the window area to the interior area is the key point of the design scheme decision and evaluation.

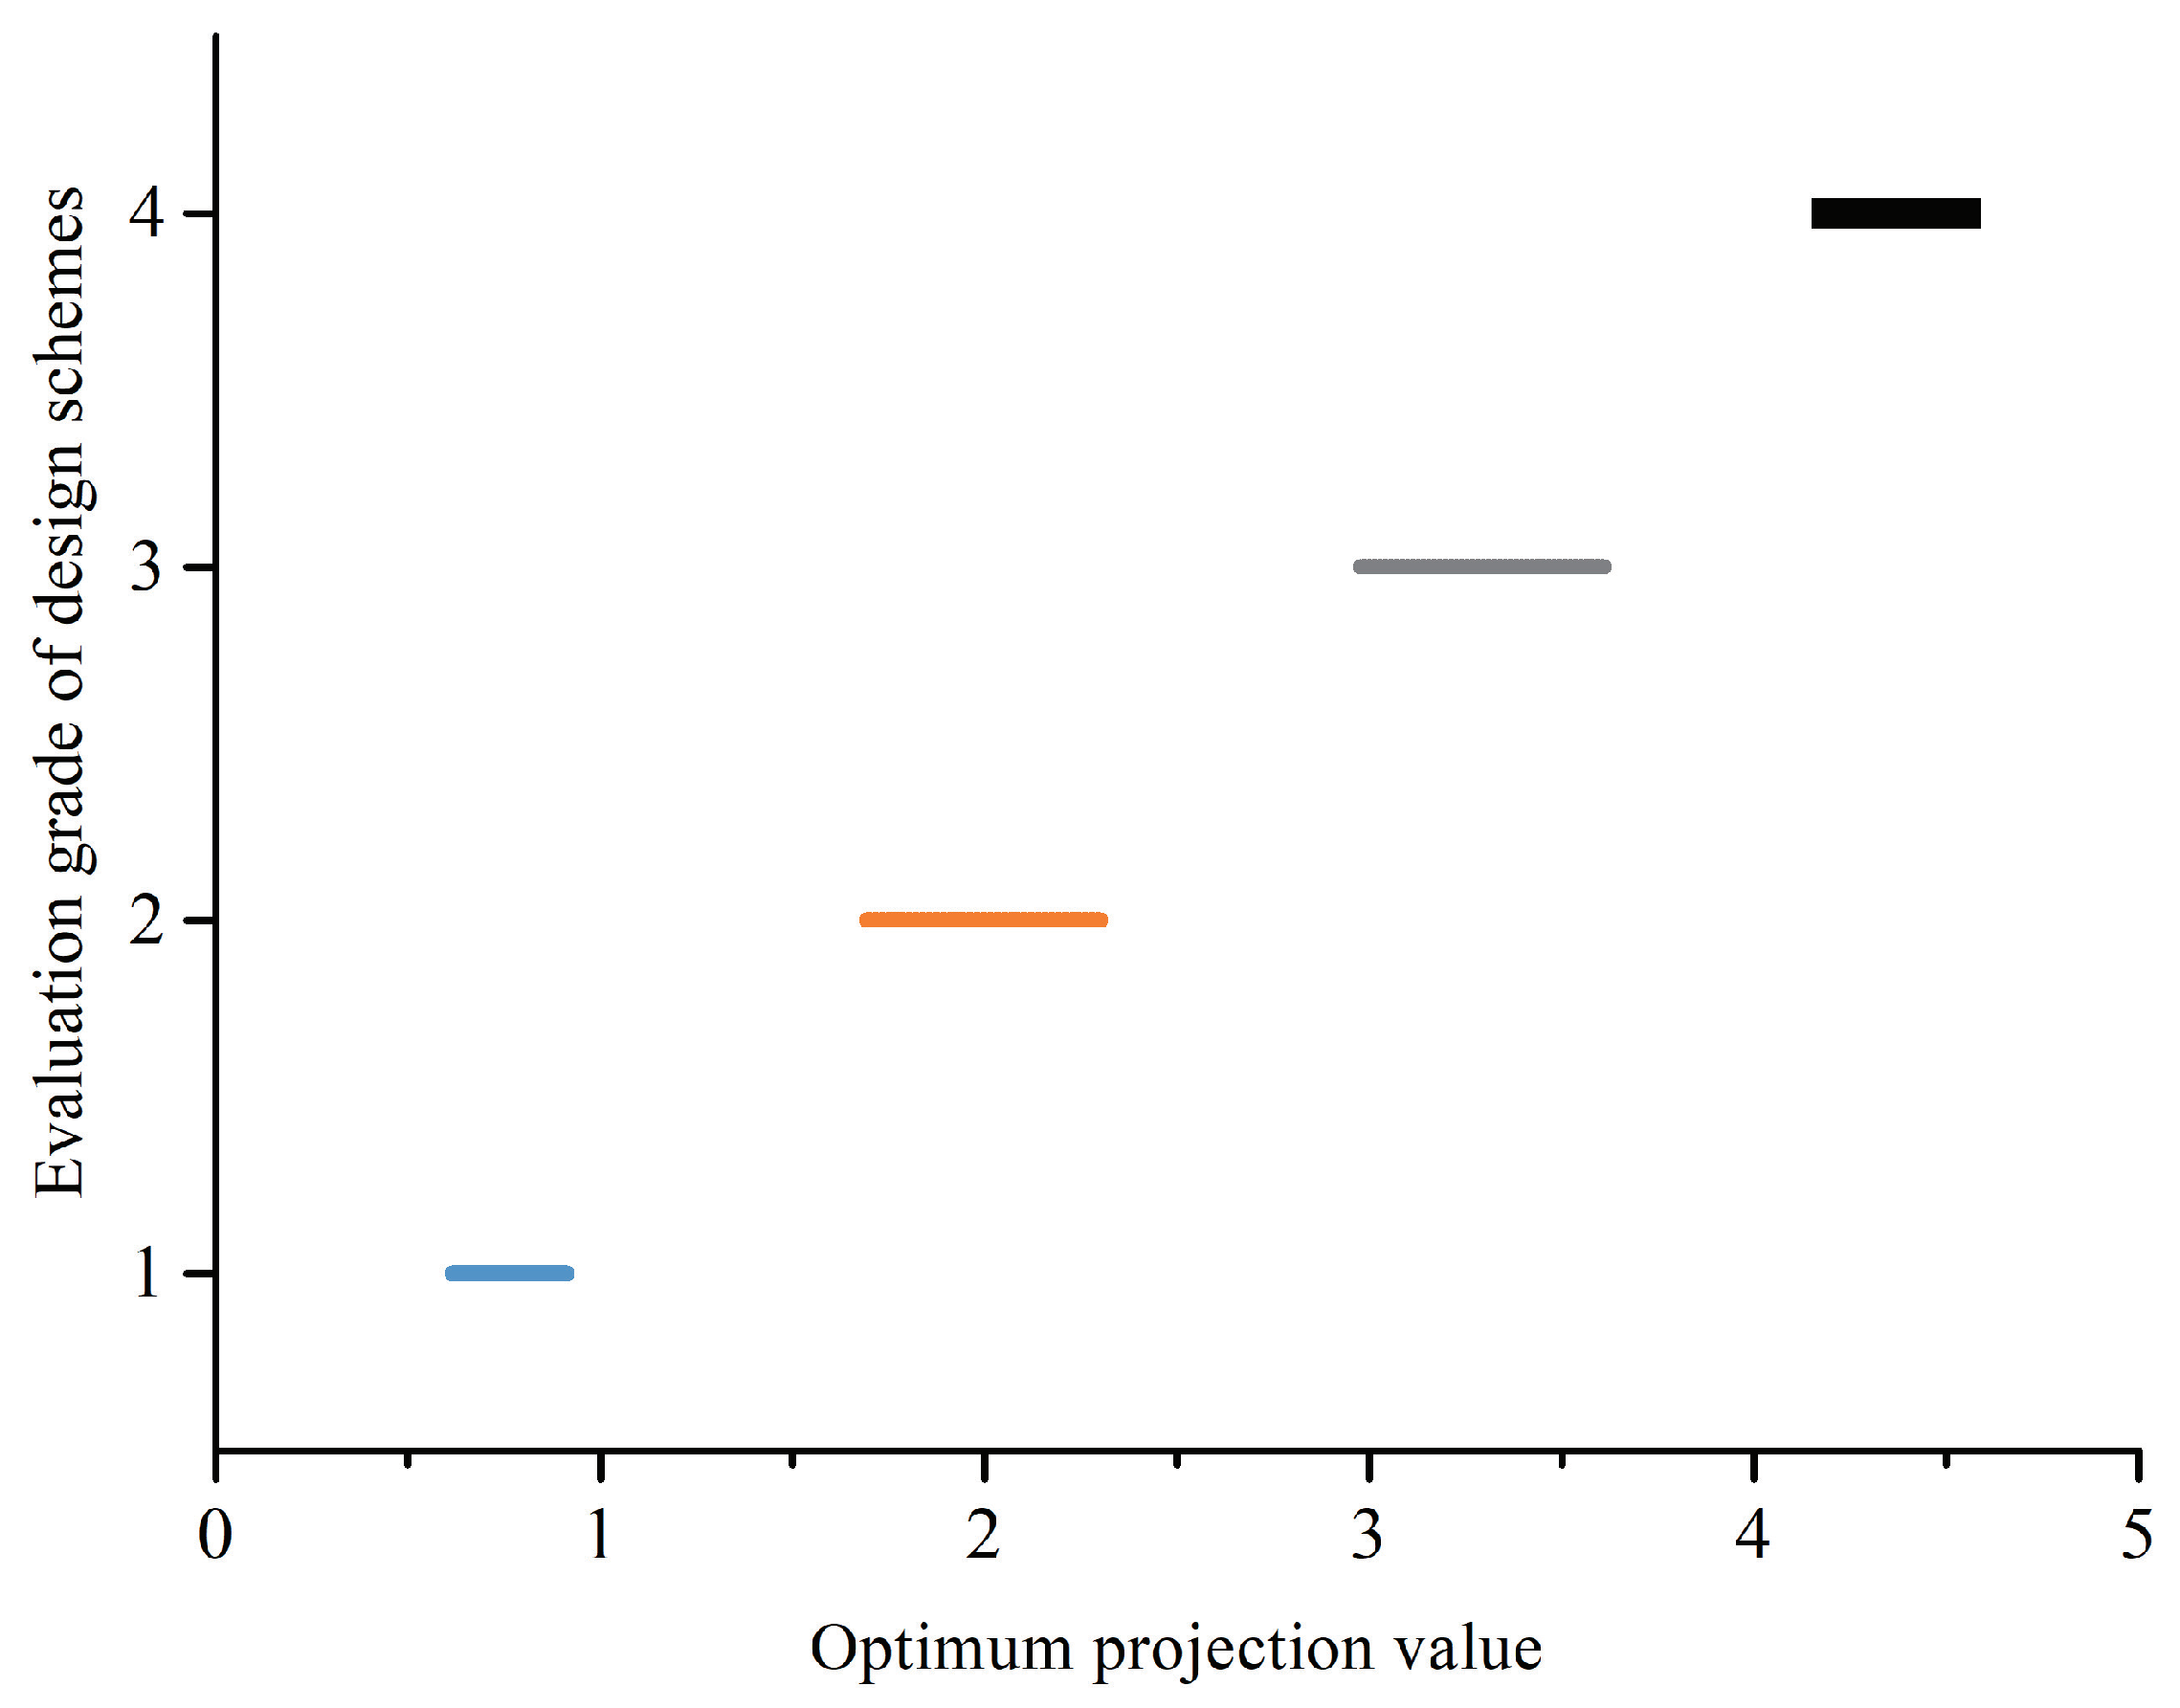
5.4. Developing a Mathematical Evaluation Model via the Interpolation Method

The best projection value of 1000 sample sets calculated in Section 5.2 was taken as the independent variable, and the preset evaluation level of 1000 sample sets was taken as the dependent variable. The function image was drawn and is presented in Figure 3.
Using the piecewise linear interpolation algorithm, the mathematical evaluation model of the empirical research object is constructed as follows.
Y = 1 z 0.915 1 + z 0.915 1.693 0.915 0.9147 < z < 1.693 2 1.693 z 2.303 2 + z 2.303 2.979 2.303 2.303 < z < 2.979 3 2.979 z 3.611 3 + z 3.611 4.192 3.611 3.611 < z < 4.192 4 z 4.192 ,
The best projection value of the empirical research object was found to be 4.4571. By introducing 2.451 into Equation (26), the Y of the case in this paper was 2.219. So the evaluation grade of this project was found to be between grade II and grade III. The evaluation results of the proposed model were basically consistent with those based on national standards. However, the model proposed in this paper had better resolution, and could clearly and accurately define the evaluation grade of the design scheme.

6. Discussion

6.1. Computational Performance of Different Optimization Algorithms

To verify the computational performance of the AOS algorithm selected in this paper, two classical meta-heuristic optimization algorithms, PSO and GA, were selected for comparison and verification. See [15,62] for calculation parameters of the PSO and the GA. All three algorithms have been repeatedly calculated 100 times in the same running environment. The calculation results of the three algorithms are shown in Table 7.
In Table 7, in terms of computational performance, AOS found the best projection value of the case study object in 131.54 generations on average, while PSO and GA found the best projection values at 197.39 and 284.08, respectively. In terms of computational stability, the three variances of AOS were smaller than those of PSO and GA.
Therefore, AOS had better computing performance than PSO and GA. This was similar to the previous research results [18]. However, these research results proved the superiority of this method by solving classic simulation examples. In this paper, the method was applied to specific engineering data, and the analysis of engineering data proved that the method had better computational performance than the PSO and the GA.
In addition, in this case study, the computational performance of PSO is slightly better than that of GA. This is similar to the previous research results [63,64,65], which proved the correctness of the calculation results in this section.

6.2. Computational Performance of Different Evaluation Methods

To verify the advancement of the evaluation method proposed in this paper, three classical methods (the AHP [9], the TOPSIS [12], and the FCE [13]) were used for comparative analysis.
The 20 experts who determined the scores of qualitative indicators in Section 5.2 were randomly divided into four groups, and the four groups of experts scored the importance of each indicator. The weight calculation results based on the AHP were shown in Table 8.
It could be seen from the calculation results in Table 8 that the calculation results of the AHP—based on the different four groups of experts—were quite different, in particular, the weight of AHP based on Group 2 was quite different from that of other groups. According to the investigation of the calculation process of the AHP, it was found that an expert in Group 2 thought that the X 31 was very important, which led to a big deviation in the calculation results of the AHP in this group. In addition, in the process of the AHP weight calculations of Group 2 and Group 4, the consistency test was not passed once, and the consistency test was passed only after re-conducting the questionnaire survey. The calculation of the index weight based on the AHP method had the disadvantage of a large research workload.
When the proposed model was used to calculate the index weight, the index weight could be obtained directly through the structural characteristics of the evaluation data of the green design scheme. The calculation results were stable, and there was no need to conduct the consistency test and questionnaire survey many times.
Both the FCE and TOPSIS need to determine the index weight by the weight calculation method. To avoid the influence of the weight calculation results, FCE and TOPSIS adopted the index weights calculated in Section 5.3.
After calculation, the memberships of the green design scheme of Nanchang Hengda Project to the four evaluation grades based on the FCE were 0.178, 0.343, 0.274, 0.151, and 0.054, respectively. According to the principle of the maximum membership degree, the evaluation grade of the green design scheme of this project was II, which was consistent with the evaluation result based on the proposed model. However, the index system constructed in this paper was complicated, including 19 third-level indexes, and the calculation process was complicated when using the fuzzy comprehensive evaluation method. Moreover, the fuzzy comprehensive evaluation method needed to preset the membership function in advance, and different membership functions or multiplication operators had significant influences on the calculation results of the fuzzy comprehensive evaluation method. The evaluation method based on the PPM directly obtained the evaluation results of the green design scheme from the data structure. As long as the evaluation data were determined, the best projection vector and value were unique.
The calculation principle of the TOPSIS method was to sort multiple schemes by the distance between them and the optimal solution (the worst solution). This method had the advantage of sorting several schemes at the same time without the preset evaluation grade. There was only one empirical research object in this paper, so the upper limit of the evaluation set of level IV was taken as the worst solution. The green design scheme level of the empirical research object was determined by calculating the distances between levels I, II, III, and the worst solution. The calculation results showed that the distance between the empirical research object and the worst solution was 0.5418, which was in the comment interval from the second grade comment set to the worst solution [0.4741, 0.6118]. So the calculation result based on TOPSIS was grade II, which was consistent with the calculation result based on the projection pursuit model in this paper. However, using the TOPSIS method to sort and analyze an empirical research object and various evaluation grades lost its computational advantage.

6.3. Impact of the Evaluation Index System on the Evaluation Results

The rationality of the evaluation index system has an important influence on the system evaluation results [66,67]. However, at present, there is no universal and unified evaluation index system for the green building design scheme. Moreover, the case project selected in this paper was located in China, so it was difficult to directly adopt the green building evaluation standards of other countries. Therefore. This section mainly studied the evaluation index system proposed in this paper and attempted to find the minimum index system.
The minimum index system should meet the following two conditions. (1) All secondary indicators should be the key indicators that affected the evaluation results. (2) The evaluation result of the minimum index system should be the same as the original evaluation result. For this reason, this section continuously deleted the indicators with the smallest impact weights until the evaluation results were biased.
According to the research results in Table 6, the weight of X 24 was the smallest. Firstly, X 24 was deleted and the calculation was made again. The calculation results are shown in row 2 of Table 9.
After calculation, it was found that after deleting X 24 , the index weight of X 31 was the smallest, and the evaluation result remained unchanged. Therefore, this article continued to delete X 31 , and the evaluation results are shown in row 3 of Table 9. It should be emphasized that the proposed model was data-driven. When the evaluation index system changed, the evaluation data would also change. Therefore, the best projection values based on different evaluation index systems and the projection value intervals corresponding to different evaluation levels in Table 9 might be different.
After several rounds of analysis, the index system after deleting X 24 , X 31 , and X 33 was the minimum index system. It should be emphasized that the minimum system of indicators found in this section was only applicable to case objects.

7. Conclusions

As the world faces resource shortages and environmental deterioration, green buildings are important measures that could be used to achieve energy conservation and emission reduction in the construction industry, as well as socially sustainable development. Accurate evaluation of green building designs provides an important foundation for the normal construction and efficient operation of green buildings. After analyzing the characteristics of the comprehensive evaluation system for the green building design scheme, a set of comprehensive evaluation index systems (of green building design schemes) was established. The index system includes 5 first-level indexes and 19 second-level indexes. The data acquisition methods of all secondary indexes were given in detail. A novel evaluation model based on the PPM optimized by the AOS was constructed. In this paper, the Nanchang Hengda Project was selected to conduct a detailed empirical study, the most important first-level indicators and second-level indicators were found, and the evaluation grade of the green building design scheme of the project was determined. Compared with the PSO, the GA, the AHP, the FCE, and the TOPSIS, the proposed model proved to be effective.
The main limitations are as follows. (1) This paper only selected the green building project from China as the case study object; projects from other countries should be selected to carry out case studies in the future. The evaluation rules of green buildings in other countries should be selected for case analyses. (2) The evaluation index system constructed was not universal, so developing a more universal evaluation index system is a future research direction. (3) In future research, more multivariate heuristic optimization algorithms will be applied to the optimization calculation of the projection pursuit model.

Author Contributions

Conceptualization, G.L. and T.Z.; methodology, H.W. and T.Z.; software, H.W. and H.Y.; formal analysis, G.L. and T.Z.; investigation, G.L. and T.Z.; data curation, H.W. and H.Y.; writing—original draft preparation, G.L. and F.W.; writing—review and editing, H.W. and T.Z.; project administration, G.L.; funding acquisition, G.L. All authors have read and agreed to the published version of the manuscript.

Funding

The APC was funded by the Jiangxi graduate education and teaching reform research project (JXYJG-2021-057).

Institutional Review Board Statement

Not applicable.

Informed Consent Statement

Not applicable.

Data Availability Statement

The data of this study are available from the corresponding author upon request.

Conflicts of Interest

The authors declare no conflict of interest.

References

  1. He, W.; Li, W.; Xu, S.; Wang, W.; An, X. Time, Cost, and Energy Consumption Analysis on Construction Optimization in High-Rise Buildings. J. Constr. Eng. Manag. 2021, 147, 04021128. [Google Scholar] [CrossRef]
  2. Jiang, T.; Li, S.; Yu, Y.; Peng, Y. Energy-related carbon emissions and structural emissions reduction of China’s construction industry: Tthe perspective of input-output analysis. Environ. Sci. Pollut. Res. 2022, 29, 39515–39527. [Google Scholar] [CrossRef] [PubMed]
  3. Chen, H.; Sui, Y.; Zhao, J. Research on sustainable development of green building. J. Environ. Prot. Ecol. 2020, 21, 561–570. [Google Scholar]
  4. Chen, L.; Chan, A.P.; Darko, A.; Gao, X. Spatial-temporal investigation of green building promotion efficiency: The case of China. J. Clean. Prod. 2022, 362, 132299. [Google Scholar] [CrossRef]
  5. Qian, Q.K.; Chan, E.H.W.; Visscher, H.; Lehmann, S. Modeling the green building (GB) investment decisions of developers and end-users with transaction costs (TCs) considerations. J. Clean. Prod. 2015, 109, 315–325. [Google Scholar] [CrossRef]
  6. Chen, X.; Yang, H.X.; Wang, T. Developing a robust assessment system for the passive design approach in the green building rating scheme of Hong Kong. J. Clean. Prod. 2017, 153, 176–194. [Google Scholar] [CrossRef]
  7. Bo, L.; Cheng, S.; Li, D. Establishment and application of fuzzy comprehensive evaluation of green building design based on data mining. J. Intell. Fuzzy Syst. 2020, 38, 6815–6823. [Google Scholar] [CrossRef]
  8. Chen, X.; Yang, H.; Lu, L. A comprehensive review on passive design approaches in green building rating tools. Renew. Sustain. Energy Rev. 2015, 50, 1425–1436. [Google Scholar] [CrossRef]
  9. Xu, S.; Sun, Y. Research on Evaluation of Green Smart Building Based on Improved AHP-FCE Method. Comput. Intell. Neurosci. 2021, 2021, 5485671. [Google Scholar] [CrossRef] [PubMed]
  10. Yuan, Z.; Zhou, J.; Qiao, Y.; Zhang, Y.; Liu, D.; Zhu, H. BIM-VE-Based Optimization of Green Building Envelope from the Perspective of both Energy Saving and Life Cycle Cost. Sustainability 2020, 12, 7862. [Google Scholar] [CrossRef]
  11. Li, M.; Xu, K.; Huang, S. Evaluation of green and sustainable building project based on extension matter-element theory in smart city application. Comput. Intell. 2020, 12286, 1–19. [Google Scholar] [CrossRef]
  12. Celikbilek, Y.; Tuysuz, F. An in-depth review of theory of the TOPSIS method: An experimental analysis. J. Manag. Anal. 2020, 7, 281–300. [Google Scholar] [CrossRef]
  13. Kuo, C.F.J.; Lin, C.H.; Hsu, M.-W.; Li, M.-H. Evaluation of of intelligent green building policies in Taiwan-Using fuzzy analytic hierarchical process and fuzzy transformation matrix. Energy Build. 2017, 139, 146–159. [Google Scholar] [CrossRef]
  14. Zhang, X.L.; Yu, Y.; He, W.T.; Chen, Y. Bidding Decision-Support Model for Construction Projects Based on Projection Pursuit Learning Method. J. Constr. Eng. Manag. 2021, 147, 04021054. [Google Scholar] [CrossRef]
  15. Yu, X.; Xie, J.C.; Jiang, R.G.; Zuo, G.G.; Liang, J. Assessment of water resource carrying capacity based on the chicken swarm optimization-projection pursuit model. Arab. J. Geosci. 2020, 13, 39. [Google Scholar] [CrossRef]
  16. Wu, H.; Wang, J.W. Assessment of Waterlogging Risk in the Deep Foundation Pit Projects Based on Projection Pursuit Model. Adv. Civ. Eng. 2020, 2020, 2569531. [Google Scholar] [CrossRef]
  17. Lan, Z.G.; Huang, M. Safety assessment for seawall based on constrained maximum entropy projection pursuit model. Nat. Hazards 2018, 91, 1165–1178. [Google Scholar] [CrossRef]
  18. Azizi, M. Atomic orbital search: A novel metaheuristic algorithm. Appl. Math. Model. 2021, 93, 657–683. [Google Scholar] [CrossRef]
  19. Meng, C.; Wang, Q.; Li, B.; Guo, C.; Zhao, N. Development and Application of Evaluation Index System and Model for Existing Building Green-Retrofitting. J. Therm. Sci. 2019, 28, 1252–1261. [Google Scholar] [CrossRef]
  20. Omar, M.S.; Quinn, M.M.; Buchholz, B.; Geiser, K. Are green building features safe for preventive maintenance workers? Examining the evidence. Am. J. Ind. Med. 2013, 56, 410–423. [Google Scholar] [CrossRef]
  21. Akomea-Frimpong, I.; Kukah, A.S.; Jin, X.H.; Osei-Kyei, R.; Pariafsai, F. Green finance for green buildings: A systematic review and conceptual foundation. J. Clean. Prod. 2022, 356, 131869. [Google Scholar] [CrossRef]
  22. Huang, M.; Wang, B. Evaluating Green Performance of Building Products Based on Gray Relational Analysis and Analytic Hierarchy Process. Environ. Prog. Sustain. Energy 2014, 33, 1389–1395. [Google Scholar] [CrossRef]
  23. Shao, Q.G.; Liou, J.J.H.; Weng, S.S.; Chuang, Y.C. Improving the Green Building Evaluation System in China Based on the DANP Method. Sustainability 2018, 10, 1173. [Google Scholar] [CrossRef]
  24. Celadyn, M. Integrative Design Classes for Environmental Sustainability of Interior Architectural Design. Sustainability 2020, 12, 7383. [Google Scholar] [CrossRef]
  25. Wu, Z.; Ma, G. Incremental cost-benefit quantitative assessment of green building: A case study in China. Energy Build. 2022, 269, 112251. [Google Scholar] [CrossRef]
  26. Huo, X.; Yu, A.T.W.; Wu, Z. A comparative analysis of site planning and design among green building rating tools. J. Clean. Prod. 2017, 47, 352–359. [Google Scholar] [CrossRef]
  27. Mirkatouli, J.; Samadi, R. An analysis on the role of urban land market in spatial development of cities: A case study of mashhad, iran. Int. J. Strateg. Prop. Manag. 2017, 21, 371–383. [Google Scholar] [CrossRef]
  28. Saharkhiz, M.A.; Pradhan, B.; Rizeei, H.M.; Jung, H.-S. Land Use Feature Extraction and Sprawl Development Prediction from Quickbird Satellite Imagery Using Dempster-Shafer and Land Transformation Model. Korean J. Remote Sens. 2020, 36, 15–27. [Google Scholar] [CrossRef]
  29. Lin, Y.-H.; Lin, M.-D.; Tsai, K.-T.; Deng, M.-J.; Ishii, H. Multi-objective optimization design of green building envelopes and air conditioning systems for energy conservation and CO2 emission reduction. Sustain. Cities Soc. 2021, 64, 102555. [Google Scholar] [CrossRef]
  30. Niu, R.; Fan, Y.; Geng, L. Adaptability of a temperature and humidity independent control air- conditioning system in green office buildings. J. Build. Eng. 2021, 42, 102432. [Google Scholar] [CrossRef]
  31. Spacek, A.D.; Neto, J.M.; Bilessimo, L.D.; Ando Junior, O.H.; De Freitas Neto, G.P.; Giansella, R.D.S.; Ferreira De Santana, M.V.; Malfatti, C.D.F. Proposal for an Experimental Methodology for Evaluation of Natural Lighting Systems Applied in Buildings. Energies 2017, 10, 1014. [Google Scholar] [CrossRef] [Green Version]
  32. He, Q.; Zhang, C.; Chai, H.-X.; Fan, M.-Y. Orthogonal experiment on reclaimed water treatment and economic optimization model in green building. J. Cent. South Univ. Technol. 2009, 16, 322–328. [Google Scholar] [CrossRef]
  33. Wang, H.-C.; Cui, D.; Han, J.-L.; Cheng, H.-Y.; Liu, W.-Z.; Peng, Y.-Z.; Chen, Z.-B.; Wang, A.-J. A(2)O-MBR as an efficient and profitable unconventional water treatment and reuse technology: A practical study in a green building residential community. Resour. Conserv. Recycl. 2019, 150, 104418. [Google Scholar] [CrossRef]
  34. Stratigea, D.; Makropoulos, C. Balancing water demand reduction and rainfall runoff minimisation: Modelling green roofs, rainwater harvesting and greywater reuse systems. Water Sci. -Technol.-Water Supply 2015, 15, 248–255. [Google Scholar] [CrossRef]
  35. Chang, Y.-H.; Huang, P.-H.; Chuang, T.-F.; Chang, S.-W. A pilot study of the color performance of recycling green building materials. J. Build. Eng. 2016, 7, 114–120. [Google Scholar] [CrossRef]
  36. Ottele, M.; Perini, K. Comparative experimental approach to investigate the thermal behaviour of vertical greened facades of buildings. Ecol. Eng. 2017, 108, 152–161. [Google Scholar] [CrossRef]
  37. Ibrahim, M.I.M. Estimating the sustainability returns of recycling construction waste from building projects. Sustain. Cities Soc. 2016, 23, 78–93. [Google Scholar] [CrossRef]
  38. Vilventhan, A.; Ram, V.G.; Sugumaran, S. Value stream mapping for identification and assessment of material waste in construction: A case study. Waste Manag. Res. 2019, 37, 815–825. [Google Scholar] [CrossRef]
  39. Yu, A.T.W.; Wong, I.; Wu, Z.; Poon, C.-S. Strategies for Effective Waste Reduction and Management of Building Construction Projects in Highly Urbanized Cities-A Case Study of Hong Kong. Buildings 2021, 11, 214. [Google Scholar] [CrossRef]
  40. Guo, H.-f.; Ge, J.; Yue, M.; Zhou, X.; Jin, W. Landscape design method for a green community based on green building design theory. J. Zhejiang-Univ.-Sci. 2010, 11, 691–700. [Google Scholar] [CrossRef]
  41. Wu, I.C.; Chang, S. Visual Req calculation tool for green building evaluation in Taiwan. Autom. Constr. 2013, 35, 608–617. [Google Scholar] [CrossRef]
  42. Hassouneh, K.; Al-Salaymeh, A.; Qoussous, J. Energy audit, an approach to apply the concept of green building for a building in Jordan. Sustain. Cities Soc. 2015, 14, 456–462. [Google Scholar] [CrossRef]
  43. Li, C.; Tang, H. Evaluation on year-round performance of double-circulation waterflow window. Renew. Energy 2020, 150, 176–190. [Google Scholar] [CrossRef]
  44. Azkorra, Z.; Perez, G.; Coma, J.; Cabeza, L.F.; Bures, S.; Alvaro, J.E.; Erkoreka, A.; Urrestarazu, M. Evaluation of green walls as a passive acoustic insulation system for buildings. Appl. Acoust. 2015, 89, 46–56. [Google Scholar] [CrossRef]
  45. Tang, V.T.; Rene, E.R.; Hu, L.; Behera, S.K.; Phong, N.T.; Thi Da, C. Vertical green walls for noise and temperature reduction - An experimental investigation. Sci. Technol. Built Environ. 2021, 27, 806–818. [Google Scholar] [CrossRef]
  46. Chang, A.S.; Tsai, C.Y. Difficulty and reasons for sustainable roadway design-the case from Taiwan. J. Civ. Eng. Manag. 2015, 21, 395–406. [Google Scholar] [CrossRef]
  47. Simion, C.-P.; Nicolescu, C.; Vrincut, M. Green Procurement in Romanian Construction Projects. A Cluster Analysis of the Barriers and Enablers to Green Procurement in Construction Projects from the Bucharest-Ilfov Region of Romania. Sustainability 2019, 11, 6231. [Google Scholar] [CrossRef]
  48. Li, L.; Chen, K. Quantitative assessment of carbon dioxide emissions in construction projects: A case study in Shenzhen. J. Clean. Prod. 2017, 141, 394–408. [Google Scholar] [CrossRef]
  49. Liu, H.; Lin, B. Ecological indicators for green building construction. Ecol. Indic. 2016, 67, 68–77. [Google Scholar] [CrossRef]
  50. Ahuja, R.; Sawhney, A.; Arif, M. Developing organizational capabilities to deliver lean and green project outcomes using BIM. Eng. Constr. Archit. Manag. 2018, 25, 1255–1276. [Google Scholar] [CrossRef]
  51. Sang, P.; Liu, J.; Zhang, L.; Zheng, L.; Yao, H.; Wang, Y. Effects of Project Manager Competency on Green Construction Performance: The Chinese Context. Sustainability 2018, 10, 3406. [Google Scholar] [CrossRef] [Green Version]
  52. Zhang, X.; Wu, Y.; Shen, L. Embedding “green” in project-based organizations: The way ahead in the construction industry? J. Clean. Prod. 2015, 107, 420–427. [Google Scholar] [CrossRef]
  53. He, H.; Jim, C.Y. Coupling model of energy consumption with changes in environmental utility. Energy Policy 2012, 43, 235–243. [Google Scholar] [CrossRef]
  54. Pak, W.; Kim, I.; Choi, J. Proposal of the energy consumption analysis process for the residential houses using big data analytics technique. J. Comput. Des. Eng. 2021, 8, 1591–1604. [Google Scholar] [CrossRef]
  55. Wu, S.R.; Fan, P.; Chen, J. Incorporating Culture Into Sustainable Development: A Cultural Sustainability Index Framework for Green Buildings. Sustain. Dev. 2016, 24, 64–76. [Google Scholar] [CrossRef]
  56. Cui, Y.; Jiang, S.M.; Jin, J.L.; Feng, P.; Ning, S.W. Decision-Making of Irrigation Scheme for Soybeans in the Huaibei Plain Based on Grey Entropy Weight and Grey Relation-Projection Pursuit. Entropy 2019, 21, 877. [Google Scholar] [CrossRef]
  57. Wang, S.; Zhang, X.; Yang, Z.; Ding, J.; Shen, Z. Projection pursuit cluster model based on genetic algorithm and its application in Karstic water pollution evaluation. Int. J. Environ. Pollut. 2006, 28, 253–260. [Google Scholar] [CrossRef]
  58. Onuoha, I.J.; Aliagha, G.U.; Rahman, M.S.A. Modelling the effects of green building incentives and green building skills on supply factors affecting green commercial property investment. Renew. Sustain. Energy Rev. 2018, 90, 814–823. [Google Scholar] [CrossRef]
  59. Peng, B.; Zou, H.M.; Bai, P.F.; Feng, Y.Y. Building energy consumption prediction and energy control of large-scale shopping malls based on a noncentralized self-adaptive energy management control system. Energy Explor. Exploit. 2021, 39, 1381–1393. [Google Scholar] [CrossRef]
  60. Alghoul, S.K.; Rijabo, H.G.; Mashena, M.E. Energy consumption in buildings: A correlation for the influence of window to wall ratio and window orientation in Tripoli, Libya. J. Build. Eng. 2017, 11, 82–86. [Google Scholar] [CrossRef]
  61. Fathi, S.; Kavoosi, A. Effect of electrochromic windows on energy consumption of high-rise office buildings in different climate regions of Iran. Sol. Energy 2021, 223, 132–149. [Google Scholar] [CrossRef]
  62. Katoch, S.; Chauhan, S.S.; Kumar, V. A review on genetic algorithm: Past, present, and future. Multimed. Tools Appl. 2021, 80, 8091–8126. [Google Scholar] [CrossRef] [PubMed]
  63. Chen, W.N.; Tan, D.Z. Set-based discrete particle swarm optimization and its applications: A survey. Front. Comput. Sci. 2018, 12, 203–216. [Google Scholar] [CrossRef]
  64. Engelbrecht, A.P. Particle swarm optimization with crossover: A review and empirical analysis. Artif. Intell. Rev. 2016, 45, 131–165. [Google Scholar] [CrossRef]
  65. Zhang, Y.; Wang, S.; Ji, G. A Comprehensive Survey on Particle Swarm Optimization Algorithm and Its Applications. Math. Probl. Eng. 2015, 2015, 931256. [Google Scholar] [CrossRef] [Green Version]
  66. Jiao, R.; Shang, Q.; Hu, R.; Yin, X.; Zhao, L.; Gong, L.; Jiang, Z. Evaluation Model for Layout Rationality of Power Grid Business Halls Based on Analytic Hierarchy Process. In Proceedings of the 5th IEEE International Conference on Cloud Computing and Intelligence Systems (CCIS), Nanjing, China, 23–25 November 2018; pp. 1008–1012. [Google Scholar]
  67. Xu, W.; Cheng, Y. Study on the method and index of rationality evaluation for energy utilization process. In Proceedings of the International Conference on Green Building, Materials and Civil Engineering (GBMCE 2011), Shangri La, China, 22–23 August 2011; pp. 2509–2512. [Google Scholar]
Figure 1. The flow chart of the proposed model.
Sustainability 14 11007 g001
Figure 2. The convergence curve of the AOS algorithm.
Sustainability 14 11007 g002
Figure 3. The map of the evaluation grade and the best projection value.
Sustainability 14 11007 g003
Table 1. The comprehensive evaluation index system of green building design schemes.
Primary IndicatorSecondary IndicatorTypeRefs
X 1 : Economic Index X 11 : Project costCost [5]
X 12 : Incremental NPV of investmentBenefit [5,6]
X 13 : Incremental payback periodCost [6,25]
X 2 : Resource Utilization Index X 21 : Rate of land useBenefit [26,27,28]
X 22 : Energy consumption of the air conditioning systemCost [29,30]
X 23 : Energy consumption of the lighting systemCost [31]
X 24 : Utilization rate of reclaimed waterBenefit [32,33]
X 25 : Utilization rate of rainwaterBenefit [32,34]
X 26 : Utilization rate of new wall materialsBenefit [35,36]
X 27 : Recovery rate of construction wasteBenefit [37,38,39]
X 3 : Environmental Impact Index X 31 : Indoor sunshineBenefit [40,41]
X 32 : Ratio of the window area to the indoor areaBenefit [42,43]
X 33 : Effect of sound insulation and noise reductionBenefit [44,45]
X 4 : Technical Management Index X 41 : Technical difficulty of constructionBenefit [46,47]
X 42 : Reduction of the construction periodBenefit [48,49]
X 43 : Difficulty of project management organizationBenefit [50,51,52]
X 5 : Social Impact Index X 51 : Ratio of the energy consumption of the building area to the GDPCost [53,54]
X 52 : Coordination between architectural modeling and regional planningBenefit [55]
X 53 : Effect of protecting the human environmentBenefit [55]
Table 2. The evaluation grade division of the empirical research objects.
Secondary IndicatorUnitIIIIIIIV
X 11 Million CNY[100, 200][75, 100)[50, 75)[0, 50)
X 12 Million CNY[0, 5)[5, 10)[10, 20)[20, 50]
X 13 Year[20, 50][10, 20)[5, 10)[0, 5)
X 21 %[75, 100][50, 75)[25, 50)[0, 25)
X 22 kWh / m 2 [65, 85][45, 65)[25, 45)[0, 25)
X 23 W / m 2 [8, 10][5, 8)[3, 5)[0, 3)
X 24 %[0, 10)[10, 20)[20, 30)[30, 50]
X 25 %[0, 10)[10, 20)[20, 30)[30, 50]
X 26 %[0, 5)[5, 10)[10, 20)[20, 30]
X 27 %[0, 10)[10, 20)[20, 30)[30, 50]
X 31 -[0, 5)[5, 10)[10, 15)[15, 20]
X 32 %[0, 25)[25, 50)[50, 75)[75, 100]
X 41 -Difficult [0, 25)Simple [25, 50)Very simple [50, 75)Simplest [75, 100]
X 42 %[0, 10)[10, 15)[15, 20)[20, 30]
X 43 -Difficult [0, 25)Simple [25, 50)Very simple [50, 75)Simplest [75, 100]
X 51 Ton of standard coal/ten thousand CNY[1, 1.5][0.75, 1)[0.5, 0.75)[0, 0.5)
X 52 -Average [0, 25)Harmonious [25, 50)Very harmonious [50, 75)Most harmonious [75, 100]
X 53 -Partially effective [0, 25)Effective [25, 50)Very effective [50, 75)Most effective [75, 100]
Table 3. The evaluation data and normalized results of the empirical research objects.
Secondary IndicatorOriginal DataNormalized DataSecondary IndicatorOriginal DataNormalized Data
X 11 1280.640 X 31 80.400
X 12 7.250.145 X 32 30.430.304
X 13 9.330.187 X 33 45.50.455
X 21 700.700 X 41 720.720
X 22 57.50.676 X 42 120.400
X 23 4.120.412 X 43 650.650
X 24 18.760.375 X 51 0.6610.441
X 25 12.570.251 X 52 450.450
X 26 28.020.934 X 53 55.50.555
X 27 13.470.269---
Table 4. Difficulty coefficient table of green building construction technology.
Typical TechnologyIIIIIIIVScore
Difficult [0, 25)Simple [25, 50)Very Simple [50, 75)Simplest [75, 100]
X 41 1 The supporting system is very complicated, construction amount is very large.Supporting system is complex, construction amount is large.Supporting system is simple, construction amount is general.The supporting system is very simple, construction amount is small.30
X 41 2 Concrete pouring and curing are very difficult, quality is difficult to control.Concrete pouring and curing are difficult, quality is difficult to control.Concrete pouring and curing are not difficult, quality is easy to control.Concrete pouring and curing are easy, there are almost no quality problems.75
X 41 3 Many kinds of steel bars and complicated connections.Many kinds of steel bars, connections are not too complicated.A few kinds of steel bars, connections are simpleFew kinds of steel bars, connections are very simple.85
X 41 4 The template system is too large and the security risk is high.The template system is huge and the security risk is high.The template system is simple and the security risks are controllable.The template is very simple and the security risks are completely controllable.75
X 41 5 The construction is very difficult, quality is very difficult to control.The construction is difficult, quality is difficult to control.The construction is simple, quality is simple to control.The construction is very simple, quality is very simple to control.60
X 41 6 Waterproof and pipe network structures are very complex.Waterproof and pipe network structures are complex.Waterproof and pipe network structures are simple.Waterproof and pipe network structures are very simple.20
X 41 7 Many kinds of steel members, and the connection is very complicated.Many kinds of steel members, and the connection is complicated.A few kinds of steel members, and the connection is simple.Few kinds of steel members, and the connection is very simple.25
X 41 8 Too many high-altitude hoisting operations.High-altitude hoisting operations.High-altitude hoisting operations.Few high-altitude hoisting operations.45
X 41 9 Building information modeling (BIM) is not applied.BIM technology is initially applied.BIM technology is acceptably applied.BIM technology is deeply applied.80
Table 5. The partial iterative calculation process of AOS.
Iteration (n)Fitness (n − 1)Fitness (n)Fitness (n)–Fitness (n − 1)Result
12659.2378787159.237878710 < 0.00001Continue
12759.2378787159.238002140.00012343 > 0.0001Continue
12859.2380021459.238002140 < 0.0001Continue
100059.2380021459.238002140 < 0.0001Stop
Table 6. The weight calculation results of the secondary indicators.
Secondary IndicatorCorresponding ElementWeightRankingSecondary IndicatorCorresponding ElementWeightRanking
X 11 0.26100.06816 X 31 0.17470.030517
X 12 0.32070.10291 X 32 0.27640.07643
X 13 0.21750.047311 X 33 0.17130.029318
X 21 0.21380.045712 X 41 0.26520.07035
X 22 0.28000.07842 X 42 0.22040.04869
X 23 0.27020.07304 X 43 0.24110.05817
X 24 0.13720.018819 X 51 0.19310.037315
X 25 0.23460.05508 X 52 0.19900.039614
X 26 0.17780.031616 X 53 0.20340.041413
X 27 0.21810.047610----
Table 7. Computational performance of different optimization algorithms.
Computational PerformanceAOSPSOGA
Computation speedBest result107th132th174th
Average result131.54th197.39th284.08th
Worst result154th274th402th
StabilityVariance of the fitness0.00000740.00006840.0001974
Variance of maximum projection value0.00001200.00007690.0001026
Variance of optimal projection vector0.00000320.00001070.0000184
Table 8. The weight calculation results of the four groups of experts are based on AHP.
Secondary IndicatorGroup 1Group 2Group 3Group 4
WeightsRankingsWeightsRankingsWeightsRankingsWeightsRankings
X 11 0.052290.058090.0193160.040711
X 12 0.082130.110010.085230.12222
X 13 0.0431130.085440.0338130.08324
X 21 0.0364160.0530110.0449110.031713
X 22 0.091910.104020.108010.12791
X 23 0.0372140.0547100.0470100.09253
X 24 0.054180.0505120.0285150.034212
X 25 0.089920.064360.0323140.027915
X 26 0.074540.0324130.056290.031114
X 27 0.066560.070650.087020.022817
X 31 0.0498100.099230.062580.04489
X 32 0.065970.0151170.0175170.020018
X 33 0.0258180.0180150.070570.043910
X 41 0.0445120.058880.0375120.05747
X 42 0.067150.059270.075460.027616
X 43 0.0490110.0173160.079450.015819
X 51 0.0283170.0261140.081740.05976
X 52 0.0367150.0133180.0167190.06865
X 53 0.0049190.0100190.0168180.04808
Table 9. Influences of the different evaluation index systems on the evaluation results.
Deleted IndicatorsOptimum Projection ValueEvaluation GradeThe Minimum Index Set or Not?
X 24 3.4712.104No
X 24 , X 31 3.8322.433No
X 24 , X 31 , X 33 4.5412.680No
X 24 , X 31 , X 33 , X 51 5.0483.157Yes
Publisher’s Note: MDPI stays neutral with regard to jurisdictional claims in published maps and institutional affiliations.

