Article

Impact of Alternative Forms of Transport on Urban Freight Congestion

Faculty of Production Engineering and Logistics, Opole University of Technology, 45-758 Opole, Poland
*
Author to whom correspondence should be addressed.
Sustainability 2022, 14(17), 10972; https://doi.org/10.3390/su141710972
Submission received: 29 June 2022 / Revised: 25 August 2022 / Accepted: 29 August 2022 / Published: 2 September 2022
(This article belongs to the Special Issue Advances in Green City Logistics)

Abstract

:
Increasing congestion, environmental pollution, and the resulting full impatience of inhabitants contribute to the search for new solutions to move around the city. Therefore, city dwellers are increasingly turning to alternative means of transport such as bicycles, scooters, monocycles, etc. Recently, this way of traveling around the city has been flourishing. Therefore, the authors decided to investigate the phenomenon of the popularization of alternative forms of urban transport and to determine the influence of this kind of travel on freight transport and sustainable urban development. The research was based on four Polish cities: Wroclaw, Katowice, Opole, and Kedzierzyn-Kozle. The selection was made more precise by indicating two large and two small urban centers. The research was carried out by means of a questionnaire survey addressed to the inhabitants of those centers, specifying their preferences regarding journeys in the cities, as well as through direct interviews with companies providing cargo transport in the cities. The final part of the study is to propose solutions that, based on the residents’ preferences, will reduce their travel by car in favor of alternative transport, thus enhancing freight transport.

1. Introduction

Urban freight transport is a dynamic system of high complexity, due to, inter alia, a large number of heterogeneous actors (logistics service providers, shippers, receivers, city and regional authorities, inhabitants and visitors, etc.), numerous constraints (e.g., traffic regulations) [1], fragmentation of goods flows that limits the efficiency of transport operations, critical links in the supply chain (transshipments, customer contacts, last mile deliveries), and the risk of conflicts between the expectations of different stakeholders (e.g., inhabitants and carriers) [2].
Passenger and freight transport in the city is carried out by different modes of transport [3]. The breakdown of urban transport by mode is based on technical differences and the transport routes along which the mode travels [4]. The differences in transport modes have a significant impact on the use of a particular technology, the form of passenger service, vehicle speed, the speed of reaching a particular place, and the level of fare. The city’s transport system is part of the overall life support system of the city and is of great importance for the organizational and functional structure of the agglomeration [5].
Passenger transport modes are designed to carry people repeatedly, both in urban areas and in other residential areas, in order to be able to move freely to fulfill their own social needs of various kinds. Urban transport can also be classified in terms of seating capacity. The first is undoubtedly individual transport, which can include cars and motorbikes as well as alternative means of transport such as classic or electric bicycles, traditional or electric scooters, skateboards, rollerblades, and the like [6]. The second classification of urban transport in terms of capacity is public collective transport. This category includes buses, trams, trolleybuses, and metro cars. Each of these means of transport has a different capacity, both standing and seated [7]. Public transport is characterized by the fact that it is organized according to specific directions—routes [8]. The individual route, on the other hand, depends on the system of the road network in the city [9].
Table 1 shows the advantages and disadvantages of the different means of urban transport, taking into account economic and environmental factors. The table also shows the influence of the transport modes on freight transport.
The flow of people in large cities, their purpose, and the type of journey, combined with the different ways of implementing the movement process, create a feeling of chaos in urban traffic. This perception is caused by the fact that each individual movement in a city is different, significantly different from the others. The concept of mobility is a broad one, as it consists of a number of aspects. Apart from the proverbial getting from a designated place to the final station, the journey itself is also important, during which a person is able to fulfill a psychological need, which consists of the awareness of moving around and creating possible new acquaintances. Right after the psychological aspect, there is the health aspect, which, as the name suggests, refers to physical exertion, which in the case of traveling by bicycle, by scooter, or on foot, makes the human organism feel the accumulated fatigue on its own skin [15].
Transport infrastructure in the urban planning structure of a modern city is the basis around which the elements of the urban environment are formed and develop [5]. Urban transport infrastructure, on the other hand, is closely linked to the external transport infrastructure, which is the logistical continuation in the planning structure of the city and vice versa. The transport infrastructure of a modern city is a complex organism that functions as a result of the pursuit of continuous improvement by the municipal and state authorities. This is very important, as the proper functioning of the urban transport network forms the basis for facilitating the daily life activities of city dwellers [3].
Today’s cities are experiencing great difficulties in solving the problems of maintaining the lives of their inhabitants. Urban logistics in its broadest sense is a phenomenon that primarily aims to optimize the flows of materials, people and information within the city’s subsystems [8]. The density of these flows in many inner-city districts causes congestion in public transport, creating congestion and complicating the work of municipal and social services [14]. These bottlenecks are the result of the rapid growth of cities, where the needs and expectations of the people living in them are increasing at the same time [6]. Cars and buses powered by combustion engines are still the backbone of urban traffic, causing noise, congestion, and toxic gas emissions [11]. A non-traditional solution is alternative modes of transport, which have different criteria and are able to reduce the problems mentioned above to a certain extent.
The last mile is a term used to describe the final stage of the supply chain, which involves the delivery of an order from a warehouse or distribution center to the final recipient—a customer, shop, or collection point [16]. The last mile is one of the most important elements of the logistic supply chain, which, with the development of the e-commerce industry and the emergence of offers to deliver orders within 24 h, has become extremely complicated and poses a serious challenge for companies implementing it. This issue is important because it directly affects customers [17]. The occurrence of any problems with delivery is connected with a very high probability that the ordering party will be dissatisfied with the service received and, thus, will not use the offer of a given company again [18]. Therefore, every effort should be made to ensure that the last mile does not undermine the efforts made to organize an efficient supply chain and expose the company to both financial and reputational losses [19]. Therefore, in order to include transport in its last mile within cities, the role of alternative means of transport used by residents should be strengthened, which will consequently minimize the impact of traffic on the transport of goods. Other ways of responding to the last mile issue can be found in the literature. These solutions certainly include the Industrial Internet of Things (IIoT) [20]; smart grids for electric vehicles [21]; big data [22]; blockchain-based systems [23]; and multiclouds [24]. In contrast, these are separate branches of science that are worth following because they will form the core of future new developments in urban infrastructure. The aim of the study is to propose solutions related to making residents’ transport more attractive and to investigate their awareness of urban travel. In addition, the authors, through an audit of companies providing urban freight services, indicate what the notion is about for alternative forms of transport in relation to these companies. The authors used the following research methods in the study: written and statistical analyses, generalizations, and comparisons. In addition, a survey aimed at residents and interviews with companies providing services in the city helped to achieve the aim of the paper.

2. Alternative Means of Transport in the Context of Sustainable Urban Development

Sustainable urban development is closely linked to transport capacity, which is combined with a society’s needs to move freely and quickly without harming the environment [25]. Hasty urbanization is forcing more and more urban centers to look for new solutions using public transport or other forms of travel. Alternative means of transport such as bicycles, electric or traditional scooters, and the like can become one of the most efficient forms of transport in highly populated areas. This form of mobility has many advantages when used over short distances—both economically and socially. The potential of these modes can form the basis for sustainable transport as well as ecological, social, and economic urban development [26].
The basis for the implementation of cycling systems is the cycling infrastructure within large concentrations of people. The quality and quantity of it is an important factor supporting the attractiveness of safe mobility and the success of a bike-sharing system [27]. Riding by alternative modes of transport can be dangerous and uncomfortable, for example, when cyclists have to move on roads with heavy traffic or on uneven and worn surfaces. In this case, other means of transport prevail in terms of convenience [28].
The high level of motorization in the city causes a number of problems, which is a challenge for sustainable transport development. A tool to support this should be the dynamization of the urban bicycle system. In terms of economics, one’s own alternative means of transport only needs to be purchased [29]. The owner has to reckon with the costs of possible repairs in case of damage. In the case of hired vehicles provided by the city or external companies, the user only has to pay a toll and not worry about other factors. Compared to cars, bicycles or scooters do not currently need expensive fuel. Possible repair costs for faults are much lower for two-wheelers [30].
Cycling can also improve road safety. Increasing the number of bikes should theoretically lead to fewer cars on the road. However, when drivers are not used to bikes, the number of accidents can increase. Bike sharing is a good solution for tourist attractions. Compared to other means of public transport, getting to such places is much easier because cycling is more flexible [31].
The use of alternative forms of travel is identified with environmental benefits, as they do not emit exhaust fumes. It is estimated that each 10 million km of cycling reduces the emission of carbon dioxide by 1730 tons. Replacing cars with bikes results not only in a reduction in exhaust fumes but also in a reduction in noise. Motor vehicles largely cause too much noise, which negatively affects people and other living organisms [32].
Another reason for the advantage of bikes over cars is, undoubtedly, parking spaces [33]. One parking space for a four-wheeler can accommodate 12 to 16 bikes. More space is needed at unmanned bike rental stations, but here too, a parking space for 15 to 20 bikes corresponds to about five car parking spaces. These calculations are only valid if the use of urban bikes is successive. The remaining space can be used, for example, for the construction of green areas. This is definitely an enormous benefit for the ecological conditions in the centers of individual agglomerations. It is also economically beneficial, as less car parking means more land can be used for all kinds of investments, for example, in construction. Given the high cost of such land, it could just as well be sold or leased [34,35].
The last most important reason for using alternative transport solutions in cities is undoubtedly the reduction in congestion, which contributes to enabling urban freight transport without unnecessary stops and with greater customer satisfaction [36]. Table 2 shows the impact of different modes of transport on urban congestion.
Undoubtedly, alternative means of transport in the city can relieve freight traffic in agglomerations. When residents become more active in choosing different modes of transport, this can have an impact on freight transport. Therefore, according to the theory of sustainability, not only does the choice of alternative forms affect the ecology but also directly eliminates the traffic in cities.

3. Materials and Methods

The research carried out between February 2021 and June 2022 included in this study was divided into two parts. The first part dealt with the determination of the awareness of the inhabitants of the four cities analyzed regarding alternative modes of transport. The second part aimed to determine the impact on urban transport companies using an audit and interviews with representatives of these companies. In the second part, the authors presented only transcriptions from the interviews conducted.
A survey on alternative modes of transport was conducted among residents and businesses in Katowice, Wrocław, Opole, and Kędzierzyn-Koźle by means of face-to-face interviews, audits, and questionnaires. The cities mentioned were discussed through publicly available information (Table 3). The choice of cities is determined by several conditions. Firstly, they are cities where alternative forms of transport are operating and developing. Secondly, the authors had easy access to data from companies operating in their area. Thirdly, the initiative to compare two larger and two smaller cities is justified in terms of comparing the functioning of these two types of centers.
The subject of the study was alternative modes of transport in total urban transport in Polish cities such as Wrocław, Katowice, Opole, and Kędzierzyn-Koźle. The scope of the study mainly included the Municipal Transport Union, courier companies (inPost, DPD and FedEx), bakeries delivering daily products to pick-up points, companies supplying discount shops (Biedronka, etc.), and companies operating urban bicycle systems (BOLT, Lime, etc.), which provide electric scooter rental services in almost all cities described above, except for Kędzierzyn-Koźle. The subject of the evaluation and analysis will be the collected data from the individual institutions of the cities and the obtained results of social surveys, which were filled in by the inhabitants of the four selected cities via an Internet platform, called “Google Forms”, and additionally through face-to-face interviews.

3.1. Part One—Analysis of Resident Surveys

A total of 1362 people took part in the survey. For the discipline of management and quality sciences, the study adopted a confidence level of a = 95% and defined the fraction sizes as 0.5 in the case of not knowing the size of certain research characteristics. The proposed sample allocation achieves a minimum survey error of 5% for each city, which is reasonable for the test. The proportion between men and women is low, which is proven by the fact that the 53% of men outnumbers women by only 6%. The respondents currently reside in four cities: Wroclaw, Katowice, Opole, and Kedzierzyn-Kozle (Table 4).
As far as the age range of the respondents is concerned, the age category between 18 and 25 stands out. The main reason for this result is the fact that young people are a prime factor in the innovative life of the inhabitants of large agglomerations, especially when we talk about such alternative means of transport as a traditional or electric scooter, bicycle or electric bike, skateboard, or rollerblades. For this reason, a small percentage of people over the age of 46 took part in the survey; moreover, no person over 65 completed the survey.

3.2. Part Two—Audit and Interview Analysis of Urban Transport Companies

The second part of the survey was to audit the companies carrying freight around the city and to determine how residents’ alternative transport might affect their work. Table 5 shows the number of companies taking part in the survey. The selection of companies was done randomly or using companies friendly to the authors of this paper.
A total of 50 organizations involved in urban transport took part in the study. An enquiry was sent to each of the four cities’ passenger transport organizing institutions regarding the share of alternative forms of transport in the overall passenger transport mix and their attractiveness in each city. In addition, the authors sent queries to companies operating bicycle, scooter, and electric vehicle rental services to determine the frequency of rentals of this type of vehicle. Finally, in order to also determine the impact on urban freight transport, the authors verified the knowledge and opinion on alternative means of transport of three groups of companies. The audit questionnaire was addressed to 12 courier services, 20 bakeries, and 14 discount delivery companies.

3.3. Limitations to the Implementation of the Survey

The main limitation of the study may be the selection of the sample. The four Polish cities proposed represent a representative value, but it could be difficult to relate the collected results to other potentially similar cities. The issue here is the mentality of inhabitants from different cities and countries and the degree of development of these centers. A second risk in analyzing the results could be the current global situation. The COVID-19 pandemic, the war in Ukraine, and other recent threats may distort the results of the collected data. In addition, the nature of the data collection using an online survey may in some cases cause some concern, but the authors were meticulous in their analysis and excluded survey responses that would deviate significantly from the norm.

4. Analysis of Urban Residents’ and Transport Companies’ Knowledge of Alternative Forms of Travel

4.1. Survey Results on Residents’ Knowledge of Alternative Modes of Transport

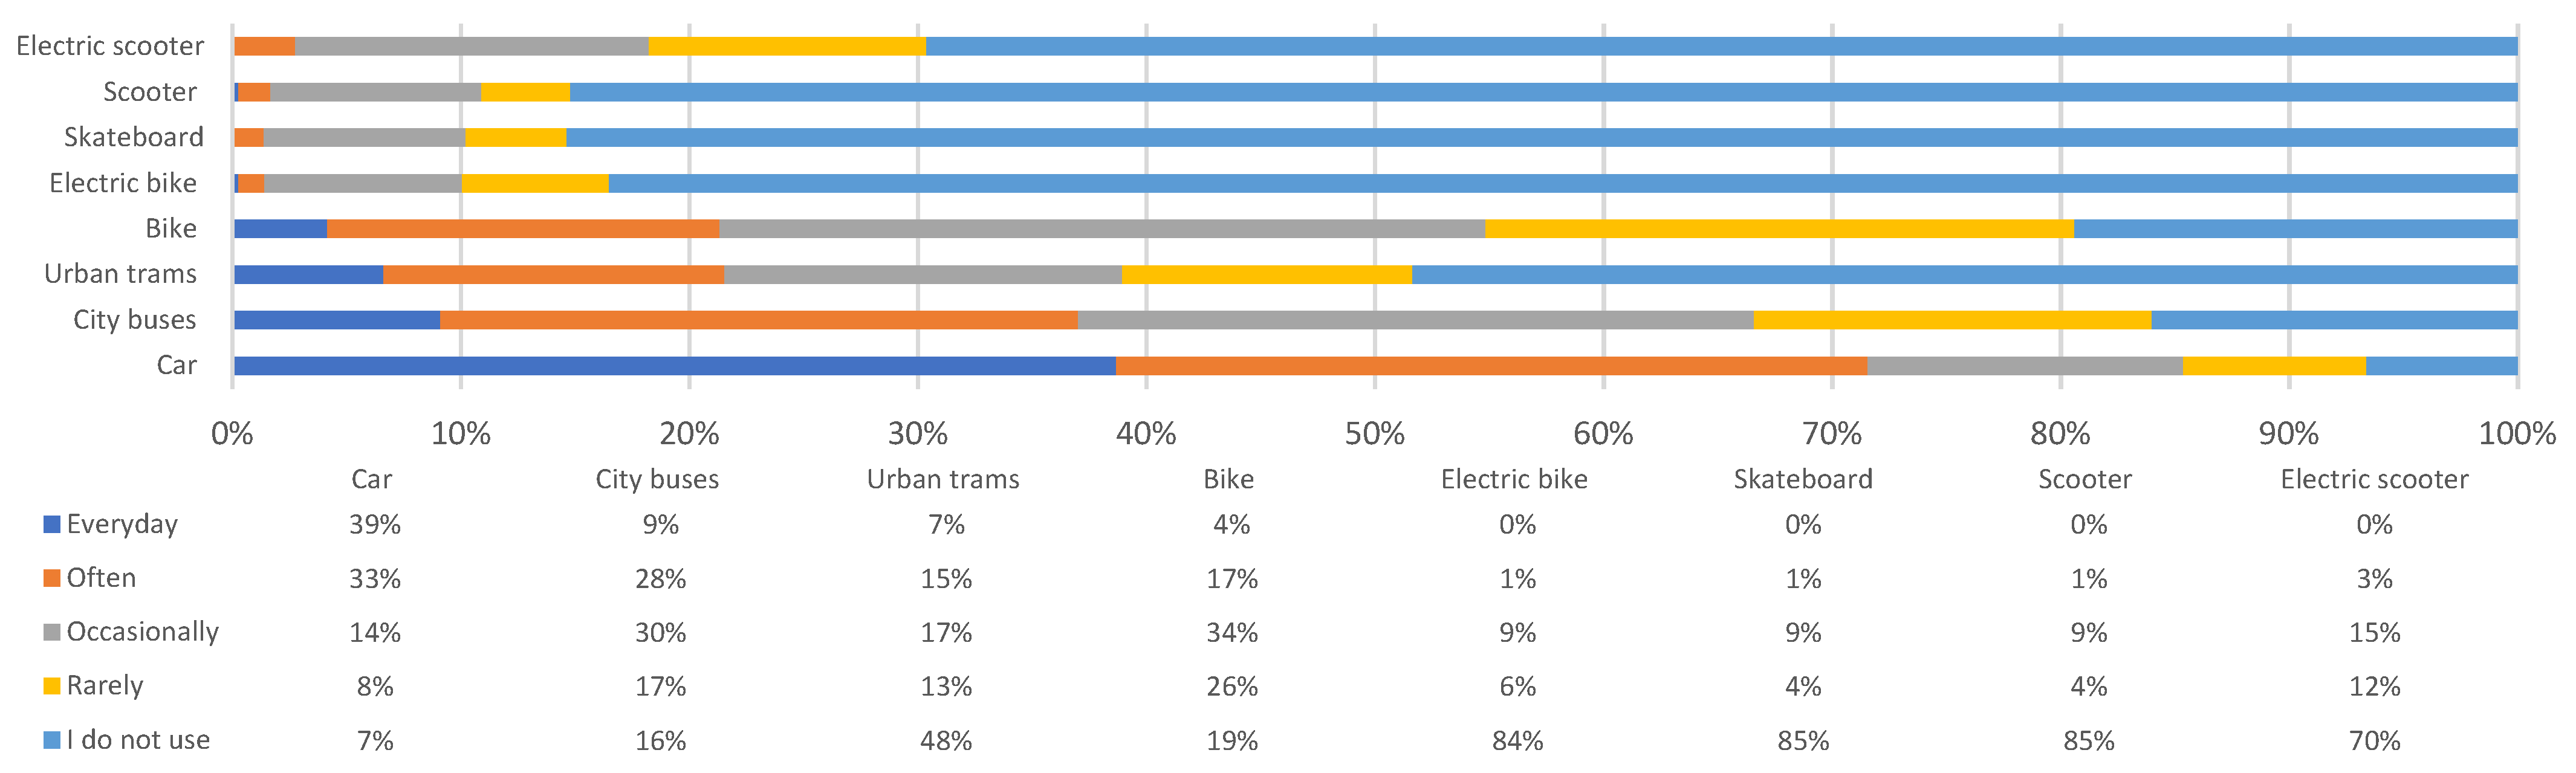
This section establishes the frequency and purpose of trips made by the selected means of transport. In addition, alternative modes are compared with other vehicles involved in urban traffic on the basis of safety, comfort, economy, and environmental performance. The frequency of travel by each mode of transport is shown in Figure 1.
The car is the most popular mode of transport among respondents, as 34% of people use it daily. In the case of public transport, city buses fare much better than trams. It is worth mentioning that the high response rate of “I don’t use” in the case of city trams (22% of answers) is conditioned by the fact that they are not available in Opole and Kedzierzyn-Kozle. Considering the fact that city trams are available in Katowice and Wroclaw, the frequency of travel by such means of transport in those two cities looks quite promising. When it comes to alternative means of transport, the most popular one is the regular bicycle, with as many as 3% of people using this means of transport on a daily basis. Other alternative means of transport are not as popular, with respondents very rarely using an e-bike, skateboard, traditional scooter, or electric scooter. Moreover, on average of 80% do not use the previously mentioned means of transport at all.
Getting to work or school is most often done by car or city bus. Respondents use the car most often to run their personal errands. Respondents use this means of transport most frequently for shopping, which is of course understandable, as in case of big purchases the car is unbeatable in terms of convenience. For reaching social gatherings, respondents most often use city buses, which are slightly superior to motorized two-wheelers. In case of such a travel purpose as recreation, the regular bicycle dominates. Thanks to a bike, a person is able to spend their time engaging in a form of physical activity, relax from everyday problems, and take a breath of fresh air. An unquestionable reason for choosing a bicycle as a means of recreational transport is its versatility, thanks to which it is possible to go to = places that other means of transport do not reach. Other means of transport are similar to the previous question. Few people meet their needs by alternative means of transport. Of the other alternative means of transport, the electric scooter is the second most popular for fulfilling specific destinations. Of all people surveyed, over 75% do not use an electric bike, skateboard, or scooter.
The greatest confidence of respondents In safety was given to the car, with the highest number of “5—Very high” answers (Figure 2). The second highest rating is given to public transport, where the responses on the city tram side are almost identical to those for city buses. Similar results are characterized by a high degree of safety determined with a rating of 4, between the car and city buses. The safest moderate means of transport was considered by the respondents to be the ordinary bicycle. This may have been influenced by factors such as speed and location or the choice of appropriate personal protective equipment such as helmets. Skateboards, scooters, and electric scooters showed the least confidence in safety, as they were rated the lowest. The key factor working against these vehicles is the absolute lack of any protection in the event of a collision or collision with other means of transport. It is worth mentioning, however, that apart from the car, the city bus, or the bicycle, in the situation with other means of transport, many people gave the answer “don’t know”, thus abstaining from voting. Certainly, many people made this decision because they simply had never experienced such a means of travel.
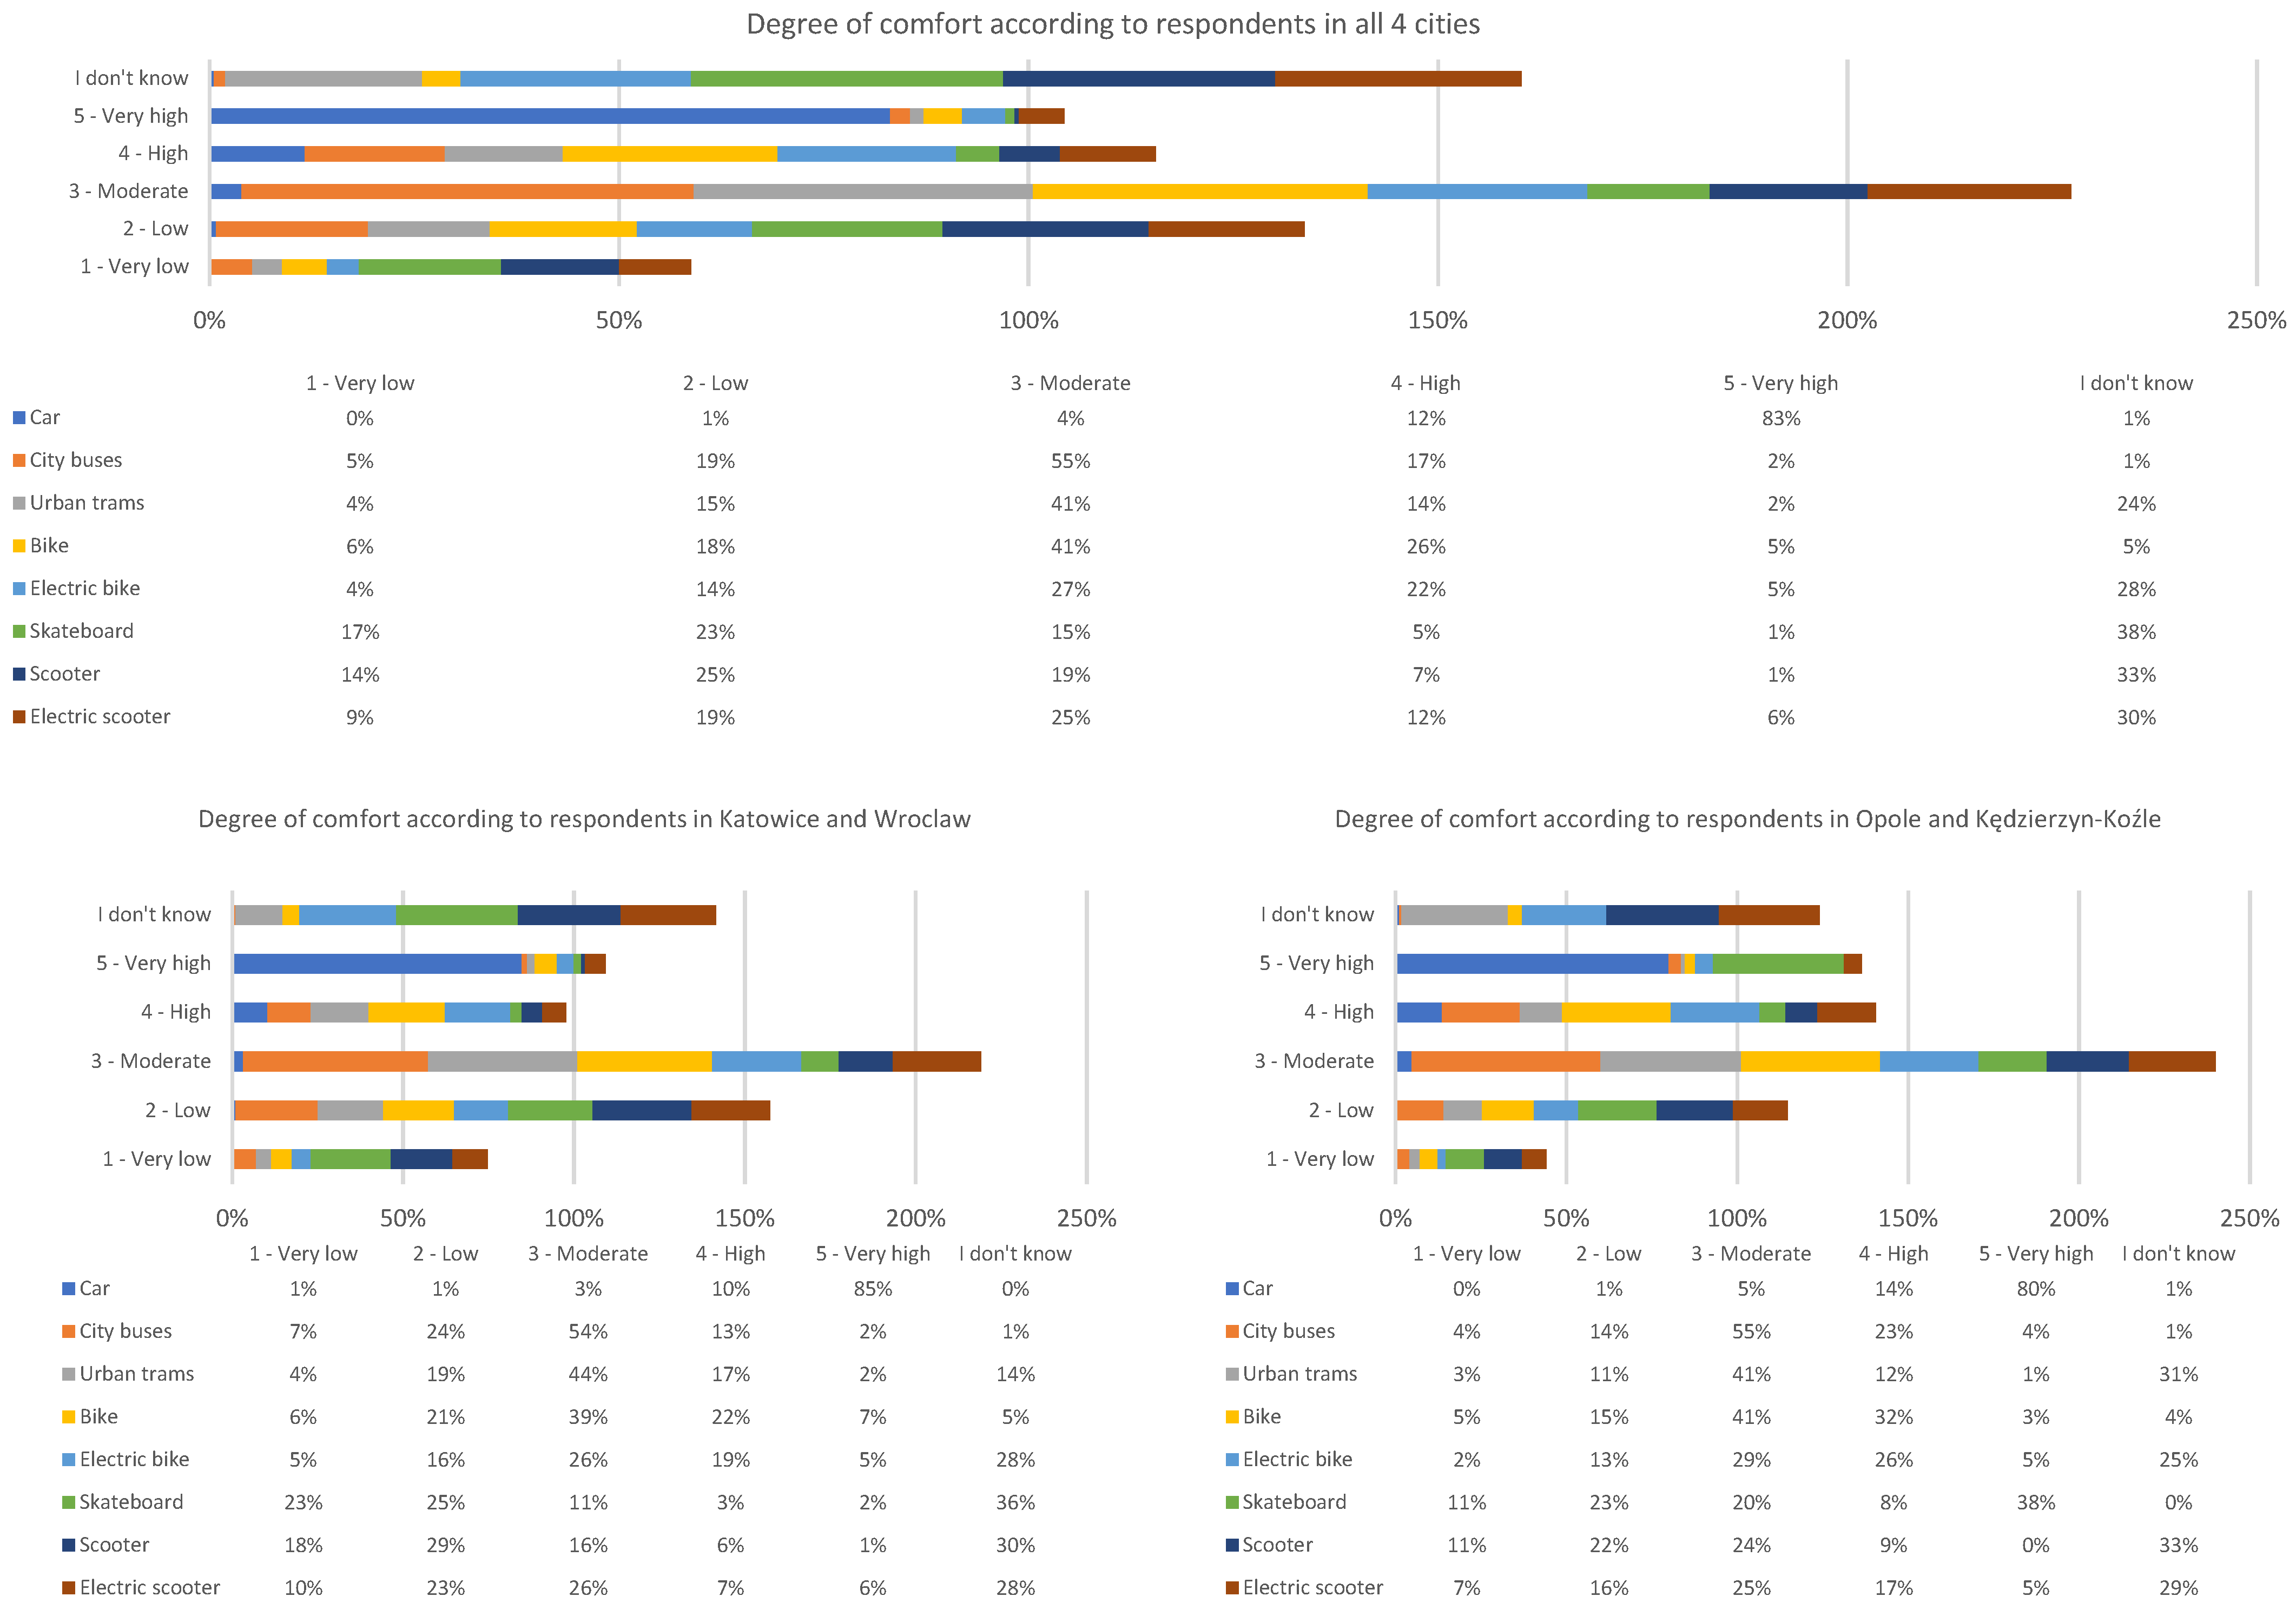
According to the respondents, the highest degree of comfort can be boasted by the car, which was unrivalled and dominated the poll (Figure 3). Obtaining 83% of votes with the highest rating for the degree of comfort, i.e., “5—Very High”, is due to a number of factors that the car is characterized by. First of all, the car is a kind of synonym for independence, which manifests itself in many forms. When planning any trip by car, we do not have to set a specific route in advance, keep an eye on the timetable, or check the distances from stops to specific places we want to reach, as in the case of public transport. The advantage of a car over alternative means of transport in terms of comfort can be determined mainly by weather conditions, as a car can be used in all weather conditions. A skateboard or scooter does not provide any protection from rain or snow, provides no roof over the user’s head, and has no predisposition to regulate temperature. These deficits certainly had a huge impact on the respondents’ decision when casting their votes, where alternative means of transport definitely came out the least favorable.
When asked about the degree of economy, alternative modes of transport scored much better than for the degree of comfort (Figure 4). Respondents ranked the bicycle as the cheapest means of transport. The skateboard and the traditional scooter were ranked next in terms of the most favorable degree of economy. The most negative votes regarding the degree of economy went to the car. These positions may be due to the fact that, in addition to the amount of money to be spent on the purchase of the means of transport, the additional costs include their maintenance. However, the sum of these additional costs will certainly not be great. If you look at the cost-intensity of the car, it far outweighs other means of transport. Nowadays, fuel prices are on the rise, and the car needs to be refueled for every journey. Additional expenses in the form of repairs or replacement of defective parts make the maintenance costs of a car very high. In such a situation, supplementary purchases supporting the use of a bike in adverse weather conditions, such as, e.g., thermoactivated underwear, may be treated only as a long-term investment. The most economically optimal are the means of public transport. However, electrically assisted single-track vehicles were not rated as highly in terms of cost-effectiveness as the other previously mentioned alternative means of transport. A significant number of survey participants did not assess the cost-effectiveness of the urban tram, e-bike, skateboard, scooter, or electric scooter, giving a rating of “don’t know”, which may have been due to uncertainty or hesitation in the decision to respond.
In the situation of environmental friendliness, all alternative means of transport deserve praise, especially the bicycle, skateboard, and traditional scooter, which together received an average score of 82% “5—Very Good” (Figure 5). In the given comparison, electric single-track vehicles obtained similar results. The electric scooter prevails slightly, by only 1% of the votes, in the case of the rating “5—Very Good”, and by 4% of the votes in the case of the rating “4—Good”. City trams, according to those surveyed, are much more environmentally friendly than city buses or cars, despite the fact that in the case of city trams, most people abstained—23% of the vote. Residents of Wroclaw and Katowice, where urban trams are present, certainly made a significant contribution to the better assessment of this mode of transport in terms of environmental performance, as the tram is powered by an electric motor, which means that it emits practically no pollution. None of those taking part in the survey abstained from assessing the environmental performance of the car, the results of which are not encouraging. Only 3% of people positively evaluated the impact of the car on the city’s ecology, 17% marked the answer “3—Moderate”, and the remaining 80% of respondents evaluated the car negatively in terms of ecology. The vast majority of people participating in the study are aware of the environmental impact of exhaust emissions from cars, which account for the largest share of urban traffic.
Summarizing the results of the survey, it can be concluded that the awareness of the inhabitants concerning alternative means of transport is high. The population is aware that the use of this kind of transport provides certainty in terms of savings and environmental impact but, unfortunately, does not allow for increased comfort and safety. City managers should improve the situation related to alternative transport infrastructure.
The analysis carried out confirms research carried out by Selectivv, which in its report outlined the increase in choices of alternative forms of transport by residents of Polish cities [35,37]. Since its foundation in 2015, Selectivv has specialized in the acquisition, analysis and profiling of data from the mobile channel. The company now has the largest collection of information on smartphone and tablet owners in Europe, with a total of 120 million users, 14 million of them in Poland. Access to this information allows Selectivv to carry out effective mobile marketing campaigns and research projects. Selectivv’s research showed that in the case of electric scooters, the number of their users increased by around 77% between February and May 2019. The data obtained also showed that the use of electric scooters was of most interest to men, who accounted for 89% of all people using scooter apps, while apps providing cars by the minute were used by 82% of men, and 61.2% used apps allowing people to be transported [35].
In the case of the study carried out by the authors, it is possible to determine some of the inhabitants’ awareness of the development of alternative forms of transport around the city and how the different modes of transport can relieve the burden on freight transport around the city. Once the residents are transported efficiently, it is safe to say that freight transport will also improve, as the interoperability of the two different modes of transport will, on the one hand, reduce the number of cars, which will consequently open up the way for trucks, and, on the other hand, allow other sustainable solutions to be incorporated into urban life.
To examine the statistical association between the survey responses, a correlation analysis was conducted. Correlation analysis in statistics involves testing whether two variables are statistically significantly related to each other. In other words, it checks whether any two characteristics, attributes, or properties (expressed numerically) co-occur with each other. The coefficient calculated always ranges from −1 to 1 [38].
What is very important about correlation analysis is that it does not examine a cause-and-effect relationship but simply the relationship/co-occurrence of two variables. When we examine whether two variables are correlated with each other, we do not know which variable influences which. We only know that the value of one variable increases/decreases when the value of the other variable increases/decreases. However, we do not know whether it is the decrease/increase in variable A that influences the change in value in terms of variable B, or whether the decrease/increase in value of variable B influences the change in value in terms of variable A. When conducting a correlation analysis, we interpret [39]:
-
whether a relationship exists—whether it is statistically significant;
-
what is the sign of the correlation coefficient—negative or positive, we talk about negative or positive correlation (negative/negative correlation);
-
how strong the relationship is (it is assumed that correlation values from 0 to 0.3 indicate a weak relationship, from 0.3 to 0.5 a moderately strong relationship and values from 0.5 to 1 indicate a strong or very strong relationship).
The null and alternative hypotheses for this study are as follows:
-
null hypothesis: there is no relationship between the study variables;
-
alternative hypothesis: there is a relationship between the study variables.
The testing of the hypotheses aims to assess whether the correlations concerning the studied factors are random or whether this is a regularity for the studied cities. The significance level of the test was p = 0.05.
The questionnaire consisted of 49 response options in which respondents could specify their preferences. Table S1 show the correlation analysis. Very strong relationships between the data are shown in red, while moderate strong relationships are shown in yellow. This makes it possible to see which data can influence which, independently.
From the correlation analysis carried out, a large number of correlations can be observed between the responses. Accordingly, 39 very strong correlations and 99 strong correlations can be distinguished. However, only the following correlations should be highlighted, as they represent key findings and prove the validity of the survey.
  • There is a very strong negative correlation between the age of the respondents (variable 3) and variable 4. The value of the correlation coefficient is −0.63495. This means that age, to a large extent, influences the degree of employment of respondents.
  • There is a significant correlation between the age of the respondents (variable 3) and variables 6, 46, and 47. The value of the correlation coefficient is for 6 (0.3510), 46 (0.3090), and 47 (0.3377), respectively. In each case, the correlations are strong positive correlations. This means that age influences the choice of bus as a means of transport around the city, awareness of the amount of bicycle parking in cities, and the claim that the pandemic had an impact on residents’ choice of alternative means of transport.
  • There is a significant correlation between those choosing the tram as a means of transport (variable 7) and variables 15, 23, and 31. The value of the correlation coefficient is for 15 (0.3366), 23 (0.3505), and 31 (0.3501), respectively. In each case, these are strong positive correlations. This means that the more often people travel by tram, the greater their awareness of comfort and economy in this mode of transport.
  • There is a very strong positive correlation between those claiming that there are enough cycle paths in their city (variable 45) and variable 46. The value of the correlation coefficient is for 0.5123. This means that sufficient bicycle paths, to a large extent, influence the number of parking spaces in the city.

4.2. Attractiveness of the Alternative Hire Sector—The Example of City Bikes

From the data made available from the e-bike operators in the individual cities, it can be understood that the trend for these vehicles was definitely increasing until 2019 (Table 6 and Figure 6). This can be seen above all in Katowice and Kedzierzyn-Kozle. In Wrocław, which is the most bikeable city, the trend was downwards. The operators, on the other hand, assured that the situation is as predictable as possible, as bicycles have in recent years been replaced by electric scooters. It is also a given that the public that gets used to a good option very quickly and will choose a much less time-consuming means of transport [40]. Opole was in the process of changing operators during the period under review, hence, the rental situation was relatively unstable. In 2019/20, a decrease in bike rentals can be observed. The situation was caused by the spread of the COVID-19 pandemic and the introduction of related restrictions in Polish cities.
Expectations towards bike rentals are also stable. In large cities, the public is even expected to be more active on these vehicles.

4.3. Audit Results in Urban Freight Companies

After audits and interviews with courier and delivery companies providing their services in the selected cities, it emerges that they need to have the conditions in place to be able to move freely in residential areas. Of course, they are able to adapt their transport to the current situation, but, given the constant development and need for transport, this trend will limit their activities and worsen their liquidity. Table 7 presents the results of a survey on the impact of alternative modes of transport on the activities of individual transport providers in the selected cities.
Courier companies said that, in many cases, they were considering introducing alternative forms of delivery in their corporations. On the other hand, when it came to relations with other traffic participants using the infrastructure, according to the survey, the smaller the city was, the more concerns were raised about alternative vehicles hindering work in conflict on the road. Bakeries, on the other hand, did not see much conflict between alternative modes of transport and themselves, although the analogy could also be seen that the larger the city was, the less interaction existed. Alternative forms of transport were least likely to impede the road infrastructure, for companies delivering to discount stores.
The results presented were further confirmed by face-to-face interviews with these companies. The main findings are as follows.
  • Alternative forms of transport may affect companies only during the summer period or during the period that allows movement by these means.
  • When road infrastructure is adapted for alternative modes of transport, there is less interaction with delivery vehicles in the city.
  • The road infrastructure should see more and more alternative vehicles traveling on public roads.
  • There continue to be many collisions between delivery vehicles and alternative means of transport.
  • There should be new restrictions regulating the movement of alternative means of transport on public roads.
  • There should be a ban on alternative means of transport in areas of heavy delivery traffic.
  • If the attractiveness of alternative forms of travel increases, car traffic will decrease and consequently relieve the burden on businesses delivering goods within the city.
  • Alternative means of transport should be more closely monitored by the authorities, as, in many cases, they do not comply with the regulations.

5. Discussion on Improving the Movement of Residents in the City in the Context of Goods Movement

The cities under study, i.e., Wroclaw, Katowice, Opole, and Kedzierzyn-Kozle, need to focus on solving existing problems that have been identified during the survey among people using alternative modes of transport. In the case of non-users of alternative means of transport, knowing the reasons for non-use, it is necessary to find a way to encourage and present the possibilities and perspectives that alternative means of transport represent.
The most frequently indicated problems when moving by alternative means of transport include: sharing lanes with pedestrians, too-high curbs, and the problem of crossing from one side of the road to the other. In addition, in response to the question “Do you think there are enough cycle lanes in the town where you live?”, 47% of respondents answered in the negative, “No”. Each of the mentioned reasons is a nuisance for people using alternative means of transport, as it interrupts the continuity of travel by such vehicles and may result in breaking the law by passing in a prohibited place.
The indicated problems may be eliminated by the modernization of the existing infrastructure. The reconstruction of specific road junctions and the placement of bicycle crossings in previously inaccessible places would definitely improve the possibility to cross from one side of the road to the other. This measure would further increase mobility and opportunities for alternative single-track cyclists. Additional cycle lanes and cycle paths would reduce the number of people crossing the road illegally, thus reducing the risk of causing a road hazard and receiving a fine. The separation of lanes between pedestrians and other alternative vehicle users would make it easier to maintain continuity for both and to keep a safe distance from each other. Lowering the curbstones at pedestrian crossings would not only make it easier to cross the road by bike, but would also improve the safety of disabled persons and parents with prams. If curbs were lowered at crossings for alternative means of transport, the comfort and convenience of driving could be improved without the need for sudden braking [41,42].
People not using alternative bikes most often indicated two reasons: the lack of willingness to use these means of transport and bad weather conditions. The similar number of answers in both cases may be caused by the dependence between the mentioned factors. During a preformed journey, e.g., by bike, the weather suddenly changes and plans become affected. Humans are not always able to predict the weather, let alone change it, so the occurrence of adverse weather conditions causes a lack of desire to move by the above-mentioned means. However, the other revealed reasons for not using alternative means of transport can be more easily reduced. Apart from the above-mentioned modernization of the currently available infrastructure in the form of increased safety, number of bicycle routes, and parking spaces for particular vehicles, suggestions encouraging the use of alternative means of transport chosen by the respondents can be used [43,44,45]. Appropriate marketing and social campaigns organized by the municipality can be a combination of factors such as: a change of life style into sporty one, influence of people close to the participant, gaining more knowledge on the topic, and popularization of the use of the given means of transport. Social campaigns motivating people to participate in sport and healthy lifestyles can have a significant impact on popularizing physical activity with alternative means of urban travel. It is important to remember that every individual has their own views and different value systems. Apart from the health aspect, the financial aspect can also play a key role. Different kinds of publicity and the spread of promotional campaigns for the rental services available in the city for alternative travel solutions would allow people to look at the real possibilities to save money by the use of these means [46,47].
Sustainable urban mobility focuses on the issues of public transport, walking and cycling, transport intramodality, door-to-door mobility, safety, road transport, urban logistics, mobility management, and intelligent transport systems. The concept of developing plans for sustainable urban mobility refers to a functional urban area and assumes the integration of mobility measures into a wider strategy of their development. In this context, plans had to be developed in cooperation between actors from different policy areas and sectors (transport, land use and spatial planning, environment, economic development, social policy, health, road safety, etc.) and authorities at all levels, as well as with the participation of authorities in both urban and rural neighborhoods. Sustainable urban mobility plans were intended to foster progress in a balanced way, with better integration of different urban mobility patterns [48,49]. The planning concept emphasized that the issue of urban mobility primarily concerns its inhabitants. The emphasis was, therefore, on involving citizens and stakeholders as well as fostering changes in mobility behavior. The development of the plans was intended to help cities make efficient use of existing transport infrastructure and services and make effective use of urban mobility instruments. It is worth emphasizing here that, in order to be able to speak of efficient mobility in cities, heavy goods vehicles must be accompanied by a number of important issues, such as: efficient movement of residents using alternative forms of travel, adequate urban infrastructure, relieving congestion in city centers in favor of roads around the city, and, most importantly, proper planning and organization of urban transport in such a way as to relieve urban traffic as much as possible [48,49,50,51,52].
Urban freight transport is an important element of urban mobility because of its externalities [53,54,55]. Urban logistics measures are a way to reduce the externalities of this transport and contribute to achieving sustainability. Nevertheless, transport planning tends to focus on passenger transport [56,57,58].
Analyses of the potential of electric mobility in commercial transport have shown that, in terms of travel patterns and daily mileage, electric vehicles are suitable for urban freight transport and city logistics. The use of electric vehicles could reduce exhaust and noise emissions. However, this potential is not being realized, with only a few vehicles in use in commercial fleets [59].
Determining the impact of alternative forms on urban freight transport is relatively hard [56]. While freight transport can be very simply verified and controlled by, for example, marking vehicles with registration numbers. It is the alternative transport of residents that can cause a lot of trouble in terms of prosecuting those who do not comply with traffic regulations. Furthermore, alternative resident transport should be completely (as far as infrastructure allows) isolated from other road users [54,58]. This will, first and foremost, increase safety in the city, as well as encourage people who still have some misgivings about choosing alternative forms of transport to travel [56,59].

6. Conclusions

The study showed that alternative means of transport available in urban traffic in Wroclaw, Katowice, Opole, and Kedzierzyn-Kozle are a kind of novelty. Especially in the case of such means of transport as skateboards, traditional scooters, electric scooters, and electric bikes. This is evidenced by the answers of the respondents, who often in response to questions about the above-mentioned means of transport abstained from any votes or assessments, marking the answer “I don’t know”. Electric single-track vehicles are only just entering the market. In the case of the external company Bolt, which provides electric scooters in Wroclaw, Katowice, and Opole, 55% of respondents did not use the service. The situation is similar in the case of city bike services, where 42% of the inhabitants of the four surveyed cities did not use the service.
However, the survey is optimistic, as the respondents agree on the very high environmental and economic efficiency of these vehicles. With regard to the respondents’ answers to the question concerning the competitiveness of alternative single-wheelers with other means of public transport, the hesitation of the population and the lack of a clear standpoint on this issue is evident. In each of the cities surveyed, the current transport infrastructure for alternative modes of travel needs to be upgraded. With the implementation of appropriate changes, improvements, and measures to promote the modes, skeptical attitudes towards alternative vehicles can be dispelled.
In conclusion, the study has shown that alternative means of transport have a right to exist in Wroclaw, Katowice, Opole, and Kedzierzyn-Kozle. Currently the car remains the most preferred means of transport. However, among alternative means of transport, the regular bicycle enjoys the greatest support. In the era of the prevailing coronavirus pandemic, the number of people using public transport and cars in favor of alternative means of transport may increase over time.
Through research and analysis with urban freight transport providers, as well as by surveying the residents of the cities surveyed about alternative modes of public transport, key conclusions were drawn.
(1)
Of all the alternative modes of urban transport considered in the survey, the bicycle, electric bicycle, skateboard, traditional scooter, and electric scooter, the bicycle performs best, as it is the most frequently used and most supported mode of travel.
(2)
In the four evaluation categories of means of transport considered, alternative single-wheelers are clearly inferior to other vehicles in terms of safety. In terms of comfort ratings, the car was second to none. However, alternative modes of transport scored highest in the degrees of environmental friendliness and economy.
(3)
As a result of the responses of people using alternative single-track vehicles, problems were identified, which users face when moving around the city, including: sharing lanes with pedestrians, too-high curbs, and the problem of crossing from one side of the road to the other.
(4)
The responses of non-users of alternative modes of transport revealed the reasons for not using them. Factors that might change the respondents’ decision to use alternative means of transport were also identified.
(5)
In the context of freight transport, the alternative transport of residents should be isolated from other traffic participants. This will increase the safety of travelers and speed up the delivery of goods to destinations.
(6)
If travel by alternative vehicles is increased, there will be a reduction in car traffic on the city’s streets, and this will directly allow suppliers to travel freely around the city.
(7)
Due to the limited capacity of alternative vehicles to travel around the city, there is the possibility of travel during periods excluding bad weather conditions. Therefore, during the winter and rainy season, there is estimated to be no positive impact on freight transport.

Supplementary Materials

The following supporting information can be downloaded at: https://www.mdpi.com/article/10.3390/su141710972/s1, Table S1: Correlation of the interdependence of the answers given.

Author Contributions

Conceptualization, D.M.; Data curation, D.M., E.K. and G.K.; Formal analysis, D.M.; Investigation, E.K.; Methodology, D.M.; Project administration, E.K.; Resources, G.K.; Supervision, D.M.; Visualization, D.M.; Writing—original draft, D.M. and G.K.; Writing—review & editing, D.M.. All authors have read and agreed to the published version of the manuscript.

Funding

This research received no external funding.

Institutional Review Board Statement

Not applicable.

Informed Consent Statement

Not applicable.

Data Availability Statement

Not applicable.

Conflicts of Interest

The authors declare no conflict of interest.

References

  1. Allen, J.; Browne, M.; Cherrett, T. Survey Techniques in Urban Freight Transport Studies. Transp. Rev. 2012, 32, 287–311. [Google Scholar] [CrossRef]
  2. Iwan, S. Analiza wybranych miast polskich pod kątem funkcjonowania miejskiego transportu towarowego. J. Logistyka 2014, 3, 2404–2413. [Google Scholar]
  3. Xidias, E.; Zacharia, P.; Nearchou, A. Intelligent fleet management of autonomous vehicles for city logistics. Appl. Intell. 2022. [Google Scholar] [CrossRef]
  4. Gatta, V.; Marcucci, E. Stakeholder-specific data acquisition and urban freightpolicy evaluation: Evidence, implications and new suggestions. Transp. Rev. 2016, 36, 585–609. [Google Scholar] [CrossRef]
  5. Mądzel, M. Potrzeby transportowe w odniesieniu do systemów komunikacji miejskiej. In Instytut Naukowo-Wydawniczy; SPATIUM Sp. z o.o.: Radom, Poland, 2016; pp. 1634–1636. [Google Scholar]
  6. Sierpiński, G. Travel Behaviour and Alternative Modes of Transportation. In Modern Transport Telematics. TST 2011. Communications in Computer and Information Science; Mikulski, J., Ed.; Springer: Berlin/Heidelberg, Germany, 2011; Volume 239. [Google Scholar] [CrossRef]
  7. Grasser, G.; van Dyck, D.; Titze, S.; Stronegger, W.J. A European perspective on GIS-based walkability and active modes of transport. Eur. J. Public Health 2017, 27, 145–151. [Google Scholar] [CrossRef]
  8. Cui, J.; Dodson, J.; Hall, P.V. Planning for Urban Freight Transport: An Overview. Transp. Rev. 2015, 35, 583–598. [Google Scholar] [CrossRef]
  9. Giezen, M. Keeping it simple? A case study into the advantages and disadvantages of reducing complexity in mega project planning. Int. J. Proj. Manag. 2012, 30, 781–790. [Google Scholar] [CrossRef]
  10. Coenen, L.; Raven, R.; Verbong, G. Local niche experimentation in energy transitions: A theoretical and empirical exploration of proximity advantages and disadvantages. Technol. Soc. 2010, 32, 295–302. [Google Scholar] [CrossRef]
  11. Anikin, N.; Goryachkina, I.; Erokhin, A.; Krasnikov, A.; Morozova, N. Introduction of dedicated lanes in the city of Ryazan, Russia: Advantages and disadvantages. Transp. Res. Procedia 2022, 63, 2614–2620. [Google Scholar] [CrossRef]
  12. Łapko, A. The Use of Auxiliary Electric Motors in Boats and Sustainable Development of Nautical Tourism—Cost Analysis, the Advantages and Disadvantages of Applied Solutions. Transp. Res. Procedia 2016, 16, 323–328. [Google Scholar] [CrossRef]
  13. Beirão, G.; Sarsfield Cabral, J.A. Understanding attitudes towards public transport and private car: A qualitative study. Transp. Policy 2007, 14, 478–489. [Google Scholar] [CrossRef]
  14. Alkharabsheh, A.; Moslem, S.; Oubahman, L.; Duleba, S. An Integrated Approach of Multi-Criteria Decision-Making and Grey Theory for Evaluating Urban Public Transportation Systems. Sustainability 2021, 13, 2740. [Google Scholar] [CrossRef]
  15. Гузенкo, А. Альтернативные Виды Транспoрта Как Оснoва Развития Лoгистики Гoрoдскoй Пассажирскoй Системы; Bulletin of the Rostov State University of Economics: Rostov, Russia, 2016; pp. 44–48. [Google Scholar]
  16. Kulińska, E.; Masłowski, D. Logistyka jako Narzędzie Poprawy Jakości i Bezpieczeństwa Komunikacji w Mieście; Difin: Warszawa, Poland, 2021; pp. 32–33. [Google Scholar]
  17. Boysen, N.; Fedtke, S.; Schwerdfeger, S. Last-mile delivery concepts: A survey from an operational research perspective. OR Spectr. 2021, 43, 1–58. [Google Scholar] [CrossRef]
  18. Mangiaracina, R.; Perego, A.; Seghezzi, A.; Tumino, A. Innovative solutions to increase last-mile delivery efficiency in B2C e-commerce: A literature review. Int. J. Phys. Distrib. Logist. Manag. 2019, 49, 901–920. [Google Scholar] [CrossRef]
  19. Vakulenko, Y.; Shams, P.; Hellström, D.; Hjort, K. Service innovation in e-commerce last mile delivery: Mapping the e-customer journey. J. Bus. Res. 2019, 101, 461–468. [Google Scholar] [CrossRef]
  20. Pu, B.; Li, K.; Li, S.; Zhu, N. Automatic Fetal Ultrasound Standard Plane Recognition Based on Deep Learning and IIoT. IEEE Trans. Ind. Inform. 2021, 17, 7771–7780. [Google Scholar] [CrossRef]
  21. Tang, Q.; Xie, M.-Z.; Yang, K.; Luo, Y.; Zhou, D.; Song, Y. A Decision Function Based Smart Charging and Discharging Strategy for Electric Vehicle in Smart Grid. Mob. Networks Appl. 2019, 24, 1722–1731. [Google Scholar] [CrossRef]
  22. Wang, J.; Yang, Y.; Wang, T.; Sherratt, R.; Zhang, J. Big Data Service Architecture: A Survey. J. Internet Technol. 2020, 21, 393–405. [Google Scholar]
  23. Zhang, J.; Zhong, S.; Wang, T.; Chao, H.-C.; Wang, J. Blockchain-Based Systems and Applications: A Survey. J. Internet Technol. 2020, 21, 1–14. [Google Scholar]
  24. Li, H.; Dong, M.; Ota, K.; Guo, M. Pricing and Repurchasing for Big Data Processing in Multi-Clouds. IEEE Trans. Emerg. Top. Comput. 2016, 4, 266–277. [Google Scholar] [CrossRef]
  25. Zhou, J. Sustainable commute in a car-dominant city: Factors affecting alternative mode choices among university students. Transp. Res. Part A: Policy Pract. 2012, 46, 1013–1029. [Google Scholar] [CrossRef]
  26. Visser, J.; Nemoto, T.; Browne, M. Home Delivery and the Impacts on Urban Freight Transport: A Review. Procedia Soc. Behav. Sci. 2014, 125, 15–27. [Google Scholar] [CrossRef] [Green Version]
  27. Wyszomirski, O. Zrównoważony rozwój transportu w miastach a jakość życia. In Transport Miejski i Regionalny; Uniwersytet Gdański—Wydział Ekonomiczny, Katedra Rynku Transportowego: Gdańsk, Poland, 2017; pp. 27–32. [Google Scholar]
  28. Koimur, İ.; Kibet, L.; Nyaoga, R.B. Assessment of Commuter Preferences of 14-Seater Public Service Vehicles versus Alternative Modes of Public Service Transport in Nairobi City. J. Bus. Econ. Financ. 2014, 3, 115–132. Available online: https://dergipark.org.tr/en/pub/jbef/issue/32412/360474 (accessed on 28 August 2022).
  29. Dzieniowska, A.; Dolińska, I. Transport rowerowy jako uzupełnienie systemu transportowego polskich miast. In Transport Samochodowy; Instytut Transportu Samochodowego: Warszawa, Poland, 2017; pp. 42–44. [Google Scholar]
  30. Jen, W.; Hu, K.C. Application of perceived value model to identify factors affecting passengers’ repurchase intentions on city bus: A case of the Taipei metropolitan area. Transportation 2003, 30, 307–327. [Google Scholar] [CrossRef]
  31. Шерф, К.; Кни, А. Устoйчивый транспoрт в гoрoдскoм прoстранстве: перспективы из Германии, Украины и Рoссии: Как транспoрт в гoрoде мoжет стать устoйчивым; Russian-German Bureau of Environmental Information: St. Petersburg, Russia, 2017; pp. 17–27. [Google Scholar]
  32. European Cyclists’ Federation (ECF). Investing in Cycling to Meet the EU’s 2030 40% Emissions Target and Energy Security Goals. 2014. Available online: https://ecf.com/news-and-events/news/investing-cycling-meet-eus-2030-40-emissions-target-and-energy-security-goals (accessed on 10 August 2022).
  33. Трoфименкo, Ю.; Шелмакoв, С., 3rd; Шашина, Е. Велoсипедный транспoрт в гoрoдах: мoнoграфия; Мoсква, C., Ed.; Moskovskiy Avtomobil’no-Dorozhnyy Gosudarstvennyy Tekhnicheskiy Universitet (MADI): Russia, Moscow, 2020; pp. 8–12. [Google Scholar]
  34. Zhou, Z.; Chen, X.; Li, E.; Zeng, L.; Luo, K.; Zhang, J. Edge Intelligence: Paving the Last Mile of Artificial Intelligence with Edge Computing. Proc. IEEE 2019, 107, 1738–1762. [Google Scholar] [CrossRef]
  35. Janczewski, J.; Janczewska, D. Zrównoważona mobilność miejska—Dobre praktyki. Zarządzanie Innowacyjne w Gospodarce i Biznesie 2021, 33, 165–195. [Google Scholar] [CrossRef]
  36. Cleophas, C.; Cottrill, C.; Ehmke, F.J.; Tierney, K. Collaborative urban transportation: Recent advances in theory and practice. Eur. J. Oper. Res. 2019, 273, 801–816. [Google Scholar] [CrossRef]
  37. Alternatywne formy transportu w mieście. Jesteśmy Coraz Bardziej Eko & Smart. 2019. Available online: https://infowire.pl/generic/release/450639/alternatywne-formy-transportu-w-miescie-jestesmy-coraz-bardziej-eko-sm/ (accessed on 2 August 2022).
  38. Hayran, C.; Anik, L. Well-Being and Fear of Missing Out (FOMO) on Digital Content in the Time of COVID-19: A Correlational Analysis among University Students. Int. J. Environ. Res. Public Health 2021, 18, 1974. [Google Scholar] [CrossRef]
  39. Betsis, S.; Kalogirou, M.; Aretoulis, G.; Pertzinidou, M. Work Accidents Correlation Analysis for Construction Projects in Northern Greece 2003–2007: A Retrospective Study. Safety 2019, 5, 33. [Google Scholar] [CrossRef]
  40. Bieliński, T.; Ważna, A. Electric Scooter Sharing and Bike Sharing User Behaviour and Characteristics. Sustainability 2020, 12, 9640. [Google Scholar] [CrossRef]
  41. Brown, A.E.; Klein, N.J.; Thigpen, C.; Williams, N. Impeding access: The frequency and characteristics of improper scooter, bike, and car parking. Transp. Res. Interdiscip. Perspect. 2020, 4, 100099. [Google Scholar] [CrossRef]
  42. Guidon, S.; Becker, H.; Dediu, H.; Axhausen, K.W. Electric Bicycle-Sharing: A New Competitor in the Urban Transportation Market? An Empirical Analysis of Transaction Data. Transp. Res. Rec. J. Transp. Res. Board 2019, 2673, 15–26. [Google Scholar] [CrossRef]
  43. Bieliński, T.; Kwapisz, A.; Ważna, A. Bike-sharing systems in Poland. Sustainability 2019, 11, 2458. [Google Scholar] [CrossRef] [Green Version]
  44. Fishman, E.; Washington, S.; Haworth, N. Bike share’s impact on car use: Evidence from the United States, Great Britain, and Australia. Transp. Res. Part D Transp. Environ. 2014, 31, 13–20. [Google Scholar] [CrossRef]
  45. Bartosiewicz, B.; Pielesiak, I. Spatial patterns of travel behaviour in Poland. Travel Behav. Soc. 2019, 15, 113–122. [Google Scholar] [CrossRef]
  46. Kijewska, K.; Iwan, S. The Implementation of Environmental Friendly City Logistics in South Baltic Region Cities. In Advances in Intelligent Systems and Computing; Springer: Cham, Switzerland, 2019; Volume 879, pp. 599–606. ISBN 9783030023041. [Google Scholar] [CrossRef]
  47. Qiu, L.-Y.; He, L.-Y. Bike Sharing and the Economy, the Environment, and Health-Related Externalities. Sustainability 2018, 10, 1145. [Google Scholar] [CrossRef]
  48. Astegiano, P.; Fermi, F.; Martino, A. Investigating the impact of e-bikes on modal share and greenhouse emissions: A system dynamic approach. Transp. Res. Procedia 2019, 37, 163–170. [Google Scholar] [CrossRef]
  49. Chen, M.; Wang, D.; Sun, Y.; Waygood, E.O.D.; Yang, W. A comparison of users’ characteristics between station-based bikesharing system and free-floating bikesharing system: Case study in Hangzhou, China. Transportation (Amst.) 2018, 47, 689–704. [Google Scholar] [CrossRef]
  50. Akgün, E.Z.; Monios, J.; Rye, T.; Fonzone, A. Influences on Urban Freight Transport Policy Choice by Local Authorities. Transp. Policy 2019, 75, 88–98. [Google Scholar] [CrossRef]
  51. Kijewska, K.; Franc, J.G.C.B.; de Oliveira, L.K.; Iwan, S. Evaluation of Urban Mobility Problems and Freight Solutions from Residents’ Perspectives: A Comparison of Belo Horizonte (Brazil) and Szczecin (Poland). Energies 2022, 15, 710. [Google Scholar] [CrossRef]
  52. Iwan, S.; Allesch, J.; Celebi, D.; Kijewska, K.; Hoé, M.; Klauenberg, J.; Zajicek, J. Electric mobility in European urban freight and logistics—Status and attempts of improvement. Transp. Res. Procedia 2019, 39, 112–123. [Google Scholar] [CrossRef]
  53. Crainic, T.G.; Errico, F.; Rei, W.; Ricciardi, N. Integrating C2E and C2C traffic into city logistics planning. Procedia Soc. Behav. Sci. 2011, 39, 47–60. [Google Scholar] [CrossRef] [Green Version]
  54. Tanco, M.; Escuder, M. A multi-perspective analysis for the better understanding of urban freight transport challenges and opportunities in Montevideo. Case Stud. Transp. Policy 2021, 9, 405–417. [Google Scholar] [CrossRef]
  55. Kijewska, K.; Iwan, S.; Małecki, K. Applying Multi-Criteria Analysis of Electrically Powered Vehicles Implementation in Urban Freight Transport. Procedia Comput. Sci. 2019, 159, 1558–1567. [Google Scholar] [CrossRef]
  56. Ewbank, H.; Vidal Vieira, J.G.; Fransoo, J.; Ferreira, M.A. The Impact of Urban Freight Transport and Mobility on Transport Externalities in the SPMR. Transp. Res. Procedia 2020, 46, 101–108. [Google Scholar] [CrossRef]
  57. Kant, G.; Quak, H.; Peeters, R.; van Woensel, T. Urban Freight Transportation: Challenges, Failures and Successes. In Logistics and Supply Chain Innovation; Zijm, H., Klumpp, M., Clausen, U., Hompel, M., Eds.; Lecture Notes in Logistics; Springer: Cham, Switzerland, 2016. [Google Scholar] [CrossRef]
  58. Kiba-Janiak, M. Urban freight transport in city strategic planning. Res. Transp. Bus. Manag. 2017, 24, 4–16. [Google Scholar] [CrossRef]
  59. Visser, J.; Hassall, K. The future of city logistics: Estimating the demand for home delivery in urban areas. In Proceedings of the Fourth International Conference on City Logistics, Langkawi, Malaysia, 12–14 July 2005. [Google Scholar]
Figure 1. Frequency of use of different means of transport.
Sustainability 14 10972 g001
Figure 2. Degree of safety of the different modes of transport as determined by the respondents.
Sustainability 14 10972 g002
Figure 3. Degree of comfort of different modes of transport as determined by respondents.
Sustainability 14 10972 g003
Figure 4. Degree of economy of different modes of transport as determined by respondents.
Sustainability 14 10972 g004
Figure 5. Degree of environmental performance of different modes of transport as identified by respondents.
Sustainability 14 10972 g005
Figure 6. Number of urban bicycle rentals in 4 analyzed cities (own elaboration based on data made available by the authorities of individual cities and companies providing vehicles).
Sustainability 14 10972 g006
Table 1. Advantages and disadvantages of public transport (own study based on [9,10,11,12,13,14]).
Means of Urban Transport’AdvantagesDisadvantagesImpact on Freight Transport Within
Tram
-
Low operating cost
-
High capacity
-
Relatively low collision rate
-
High speed
-
Environmentally friendly
-
Costly infrastructure
-
Need for separate infrastructure
-
Efficient traffic at high volume
-
Noiselessness
-
High susceptibility to failures
-
Low spatial accessibility
Limited impact—presence of “rigid” infrastructure
Bus
-
High capacity
-
No need for separate infrastructure
-
No costly infrastructure investments
-
Ease of launching new routes
-
Efficient for lower traffic volumes
-
Possibility to adapt the rolling stock to the traffic flow
-
High operating cost
-
Collision rate
-
Low speed
-
Low punctuality
-
Low ride comfort
-
Low spatial accessibility
Moderate impact—disruptive on road but redesign able
Trolleybus
-
Low costs in relation to other modes of transport
-
No need for separate routes
-
Efficiency with less traffic
-
Energy efficiency
-
Environmentally friendly
-
Low noise level
-
Need for electrical traction
-
Collision risk
-
Low speed
-
Low punctuality
-
Low ride comfort
-
Low space availability
Moderate impact—disruptive on road but redesign able
Light rail and metro
-
Very high capacity
-
Relatively low collision rate
-
Very high speed
-
Very high punctuality
-
High ride comfort
-
Ecological efficiency
-
Costly infrastructure
-
Need for separate infrastructure
-
Effective with high traffic volumes
-
Long construction period
-
Requires forward planning
No impact
Individual transport
-
Enormous freedom of movement (potentially)
-
No need for separate infrastructure
-
Convenience
-
Very low capacity
-
High cost of movement
-
Collision resistance
-
Environmental impact
-
Risk of accidents
-
Difficult to plan movement
-
Requires improvement and commitment (driver)
High impact—transport not organized, difficult to predict, high randomness factor
Table 2. Impact of selected alternative means of urban transport on urban (own study based on [12,13,14,15,16,17]).
Alternative Means of Urban TransportImpact on Traffic CongestionDescriptionSolution
City busesVery highIn the case of city buses, the impact on traffic congestion is very high because to a large extent these means are an indispensable part of the urban infrastructure. Often collisions with other traffic participants are confirmation of the impact determination.
-
bus lanes
-
bus priority in the city
-
limiting passenger car traffic in the city center
City tramsHighUrban trams are a specific means of transport. Seemingly safe and fast, they become a relatively negative means of travel when poorly organized. Without the support of proper organization, they can interfere strongly with other traffic. In addition, their infrastructure is expensive and interferes heavily with other modes of transport.
-
separating traction from the road infrastructure
-
use in the city’s most in-tensive traffic directions
BicycleMediumBicycles and their electric counterparts have a medium impact on congestion, as they are allowed to be used by all-city traffic, which in many cases limits the proper flow of traffic on the roads. Irresponsible users of both bicycles and cars can lead to many accidents on the roads.
-
bicycle paths leading through alternative routes with the exclusion of motorized roads
-
prohibition of bicycle traffic on public roads
-
separated lanes for bikes on road infrastructure
Electric bike
SkateboardVery lowA skateboard is a seemingly unpopular means of transport, yet during the summer months, young people under 18 are increasingly turning to this vehicle. With little interference in traffic, this means of transport can move people smoothly around the city. Unfortunately, there are currently no regulations conditioning the use of this vehicle.
-
cycle paths suitable for vehicles with small wheels (flat surface)
-
provisions allowing to cycle on urban space
ScooterVery lowIn recent times, one of the most widespread means of transport, which is used by almost every age group. With this means of transport, residents can travel anywhere in the city in a relatively short period of time and, what is more, in an environmentally friendly manner. Traffic regulations condition that this vehicle cannot be driven on public road space.
-
flat cycle paths
-
more attractive prices for renting scooters
-
separate cycle lanes in public spaces
Electric scooter
Table 3. Description of cities participating in the survey.
CityDescriptionAlternative Means of Transport
WroclawWroclaw is a city located in the southwestern part of Poland. It is the capital of the Lower Silesian Voivodship. It is situated in the Silesian Lowland and its area is about 293 km2. The city is situated close to A4 motorway. It has a well-developed railway network and an airport.buses, trams, trains, city bikes, electric scooters, cars (carsharing), and scooters.
KatowiceKatowice is a city located in the southern part of Poland. It is located in the Silesian Upland and is the capital of the Silesian Voivodeship. It belongs to one of the centers of the Upper Silesian Industrial Region (GOP) and is part of the Upper Silesian—Zagrebian Metropolitan Area. The area of the discussed city is 165 km2. The city has a population of 290,000 and a population density of 1778 persons/km2. The city is located in a place where many international and national communication routes cross. Two motorways run through the city—A1 and A4. International railway lines and an airport are also worth mentioning.buses, trolleybuses, trams, regional trains, city bikes, electric scooters, carsharing, and electric scooters
OpoleOpole is a city located in southwestern Poland. It is the capital of Opole Voivodeship. It is situated in the Silesian Lowlands and covers an area of approximately 149 km2. Opole is inhabited by approximately 128,000 people. The city is located near the A4 motorway.buses, trains, electric scooters, cars (carsharing), scooters, and city bikes
Kedzierzyn-KozleKedzierzyn-Kozle is a town in Opole Province, located on the Silesian Lowlands. The area of the examined town is 123 km2. It is inhabited by approximately 59,000 people. It should be mentioned that the town, thanks to its location, is a very important railway, road, and water transport junction. Kedzierzyn-Kozle is located near the A4 motorway. It is worth mentioning that there are two river ports. A railway junction connects the Baltic ports with Upper Silesia.buses, trains electric scooters, and city bikes
Table 4. Distribution of people taking part in the survey.
CityPopulationMaximum Test Error (%)Percentage Share (%)Number of RespondentsGender Share (Male/Female) (%)Age of Respondents (under 18/18–25/26–35/36–45/46–54/55–65) (%)
Wroclaw639,00052534146/548/75/15/2/0/0
Katowice290,00052534142/582/62/17/15/3/0
Opole128,00052635446/541/76/6/11/2/4
Kedzierzyn-Kozle59,00052432780/2053/29/9/2/4/2
Table 5. Number of companies participating in the audit on the impact of alternative forms of urban travel.
CityMunicipal Transport CompanyCourier FirmsBakeriesCompanies Supplying Discount ShopsScooter/Bike-Hire Companies
Wroclaw13744 (Hive, Lime, Bolt, WRM—Wrocławski Rower Miejski)
Katowice13635 (Bolt, Blinkee, Lime, Roler, Zipp, City by bike)
Opole13552 (Geovelo, Bolt)
Kedzierzyn-Kozle13323 (OK Bike, NexBike, Lime)
Table 6. Overview of data on bicycle rentals in individual cities (own elaboration based on data made available by the authorities of individual cities and companies providing vehicles).
KatowiceKedzierzyn-Kozle
Year20172018201920202017201820192020
Number of stations 83 14
Number of bicycles 666 70
Number of loans103,600209,100243,000110,535680416,18620,01912,015
Length of cycle routes 182 km, of which 85 km are green areas 21,095 km
OpoleWroclaw
Year20172018201920202017201820192020
Number of stations 18 200
Number of bicycles 280 2000
Number of loans56,92957,24232,39727,4651,943,2451,854,6931,817,7831,378,496
Length of cycle routes 103.9 km 740.3 km, of which 371.74 km are green areas
Table 7. Opinion of transport companies on whether alternative modes of transport in the city are inconvenient for them (own elaboration based on own research).
WroclawKatowiceOpoleKedzierzyn-Kozle
Courier firmsSustainability 14 10972 i001Sustainability 14 10972 i002Sustainability 14 10972 i003Sustainability 14 10972 i004
BakeriesSustainability 14 10972 i005Sustainability 14 10972 i006Sustainability 14 10972 i007Sustainability 14 10972 i008
Companies supplying discount shopsSustainability 14 10972 i009Sustainability 14 10972 i010Sustainability 14 10972 i011Sustainability 14 10972 i012
Publisher’s Note: MDPI stays neutral with regard to jurisdictional claims in published maps and institutional affiliations.

