Article

A Reflection on the Response to Sudden-Onset Disasters in the Post-Pandemic Era: A Graded Assessment of Urban Transportation Resilience Taking Wuhan, China as an Example

1
School of Civil Engineering and Architecture, Wuhan Institute of Technology, Wuhan 430074, China
2
School of Architectural Engineering and Mechanics, Yanshan University, Qinhuangdao 066004, China
3
Faculty of Humanities and Arts, Macau University of Science and Technology, Macao 999078, China
4
School of Transportation and Logistics Engineering, Wuhan University of Technology, Wuhan 430063, China
5
State Key Laboratory of Green Building in Western China, Xi’an University of Architecture & Technology, Xi’an 710055, China
*
Author to whom correspondence should be addressed.
Sustainability 2022, 14(17), 10957; https://doi.org/10.3390/su141710957
Submission received: 11 July 2022 / Revised: 23 August 2022 / Accepted: 29 August 2022 / Published: 2 September 2022
(This article belongs to the Section Sustainable Transportation)

Abstract

:
The COVID-19 pandemic has led to thinking about the response to sudden-onset disasters, for which the transportation resilience of urban areas is crucial. The purpose of paper is to provide a graded assessment of urban transportation resilience to help city managers target policies and plans. Wuhan, the first city in China to be severely hit by COVID-19, was selected as the case study for this research. Based on an extensive survey of the travel characteristics of residents in central urban areas, the concept of “travel mode shift” was combined to classify residents into four modes, including non-motorized conventional travel, non-motorized over-distance travel, motorized adaptable travel and motorized non-substitutable travel. The potential transportation stoppages in different levels of epidemic impact were then divided into three scenarios, corresponding to each of the city’s three levels of transportation resilience. The concept of MWD (Maximum Willingness Distance) in active travel mode was further developed, which was divided into WMWD (Walking Maximum Willingness Distance) and RMWD (Riding Maximum Willingness Distance). Finally, a hierarchical assessment model of urban transportation resilience is developed based on the MWD distance threshold. Besides, the average income level of urban residents was also included in the assessment system. The following research conclusions were drawn: (1) The degree of transportation resilience in Wuhan showed an “S-curve” relationship with RMWD, with thresholds at RMWD = 2.5 km, 11 km and 23 km respectively. (2) The resilience of transportation in the suburbs of the city was weaker than in the city center, and the gap between the two increases as the RMWD increases, but the share of motorized transportation in short distance trips in the city center was still higher than desirable. (3) The upper-income groups in the city had more flexible travel options, while the lower income groups were less resilient to travel. Based on the results of the study, it is recommended that city managers can identify areas of low resilience and critical distance thresholds that may lead to sudden changes in transportation resilience in the event of a sudden disaster. This will lead to the development of improved policies. The special needs of socially disadvantaged groups should also be taken more into account in this process.

1. Introduction

The COVID-19 epidemic, which began in 2019, poses a significant threat to human health and its highly contagious nature has led to the adoption of more stringent control measures in many parts of the world, in which most commonly transportation controls aimed at restricting the movement of people, with varying degrees of impact on the mobility of urban dwellers. The negative effects of the COVID-19 epidemic will eventually disappear. Indeed, the post-epidemic era has arrived, but the reflections left by the epidemic will persist for a long time. In the peacetime times, the vast majority of the population has probably never experienced such massive transportation shutdowns and travel restrictions if not for the COVID-19 outbreak. So, have city managers prepared and deployed well for this? Will the lack of appropriate preventive measures lead to further secondary disasters? More importantly, transportation shutdowns and travel restrictions in cities are not necessarily limited to times of respiratory pandemics. Other events (such as earthquakes, floods, tsunamis, extreme weather, terrorist attacks and even energy crises) can all have an impact on the normal functioning of transportation. This endogenous urban resilience to disaster shocks will thus be crucial [1,2]. A sound assessment of the classification will allow for targeted measures to be taken in the event of a sudden disaster, rather than just allow no flexibility.
The keyword Resilience is central to our research work and its academic concept first originated in the field of materials science [3]. In 1818, Tredgold used the term resilience to describe the properties of wood to explain why some types of wood are able to adapt to sudden and violent loads without breaking [4]. In addition, the studies by Fairbairn, Mallet, Merriman, Gere and Goodno [5,6,7,8] all emphasized the ability of an object to resist an external impact without breaking. In 1973, Holling introduced the concept of Resilience to social ecology [9]. His academic definition of Resilience is the ability of a system to resist disturbances and maintain the same relationships between state variables when subjected to shocks. In contrast to the emphasis on adaptability and stability, Tilman et al. defined resilience as the speed with which a system returns to an equilibrium point after an interruption, focusing on its recovery ability [10]. Folke summarized three definitions of resilience [11], namely engineering resilience, ecological (ecosystem) resilience/social resilience and socio-ecological resilience, where engineering resilience focuses on recovery and stability, ecological (ecosystem) resilience/social resilience on persistence and robustness, and socio-ecological resilience on variable adaptive capacity, learning, and innovation. As an important part of resilient urban planning, urban transportation is vital to the proper functioning of cities. The concept of urban transportation resilience was developed by Folke [12] and Fernandes [13], who argue that the ability to sustain transportation resilience is directly related to the potential for people to maintain their daily transportation flows while lives unaffected by disasters. Murray-Tuite et al. [14] proposed 10 dimensions for resilient transport systems, which were then refined by many scholars, extending the application of resilience theory to passenger and freight transport, transportation energy efficiency and natural disaster response [15,16,17,18,19]. Among these, passenger and freight transportation are more vulnerable to environmental, economic and social factors, thus directly affecting urban development, and has therefore received more scholarly attention. In addition, Raymond et al. [20] defined resilience in transportation as the ability of a transportation system to return to normal operating conditions within an acceptable time after a disruption.
The global impact caused by the COVID-19 pandemic can be classified as a natural disaster with social, economic and political implications [21]. In the studies of urban issues related to the COVID-19 pandemic, Xin Li [22] and Feiyang Liu [23] identified urban risk factors in Wuhan, taking into account data on the distribution of the epidemic. Based on the above urban risk factor identification results, Ran Peng [24] further extracted typical transportation factors for geographical weighting analysis to study their influence on the spread of COVID-19. In the early years of the COVID-19 pandemic, measures such as radical changes to conventional travel patterns, social distancing, movement restrictions and blockades were often used [25], but some studies have shown that complete restrictions on urban transport, while slowing the spread of the epidemic, increased energy consumption and travel inconvenience [26], and socially vulnerable groups may have lost their travel options during this period. Transportation resilience has also been the focus of some scholars in the face of COVID-19. SERDAR’s review of existing research has identified differences between the various types of transportation resilience assessment due to the nature [27], scale and impact of disturbances, and identifying reference indicators will help to address the respective shortcomings of the different approaches. Therefore, more sophisticated statistical models are used in the urban resilience assessment framework represented by ARUP [28], but the scarcity of data and the lack of targeting of populations will be more prominent in the face of unexpected natural disasters. Caprì [29], Stamos [30] and Krumdieck [31], in their assessment of urban transportation resilience, all proposed to classify the travel characteristics of the population according to the necessity and the degree of impact, and this idea has some reference value for the development of various types of transportation shutdown measures in response to sudden disasters.
This study defines the level of urban transportation resilience as the adaptability and stability of the daily travel behavior of urban residents in the face of changing natural and social environments, which can be enhanced by the optimization of the urban road network structure, traffic management measures and related supporting facilities. Stemming from a reflection on the problems of shocks to urban transportation during the COVID-19 pandemic, the study constructed a hierarchical approach to assessing urban transportation resilience based on the concept of travel mode shift through an extensive OD survey and applies it to Wuhan, China. The method firstly classified residents’ travel patterns in a dynamic way and corresponds to different levels of resilience for the different types of travel restrictions that may result from sudden disaster shocks in the city. The concept of Maximum Willingness Distance (MWD) was then proposed for residents to travel. By simulating various scenarios with changes in MWD thresholds at different levels of resilience, the proportion of people who can travel by non-motorized modes in each scenario was calculated and defined as a key indicator for evaluating the transportation resilience of the city. The relationship between the level of urban transport resilience and the MWD value was thus fitted and the key nodes were identified. The final assessment of the urban integrated transportation resilience and the transportation resilience of each TAZs were graded, and the impact of various factors on the urban transportation resilience was analyzed.
The resilience of urban transportation is currently a hot topic of research, with the majority of studies using complex models to assess the extent to which different types of shocks affect urban traffic order and the resilience of urban transportation. This type of research requires a large amount of data and there is a lot of data that is inaccessible or even confidential. In addition to the fact that some less developed regions may also have incomplete specialist data and limited research conditions. The aim of the study is therefore to develop a simple, quick and efficient method for assessing the resilience of urban transportation in the face of different constraints on how people travel during sudden disaster shocks, and to inform the development of targeted strategies. We consider that this assessment method can be replicated and implemented inexpensively and easily, especially in areas where there is a lack of specialist data as well as specialist research staff.

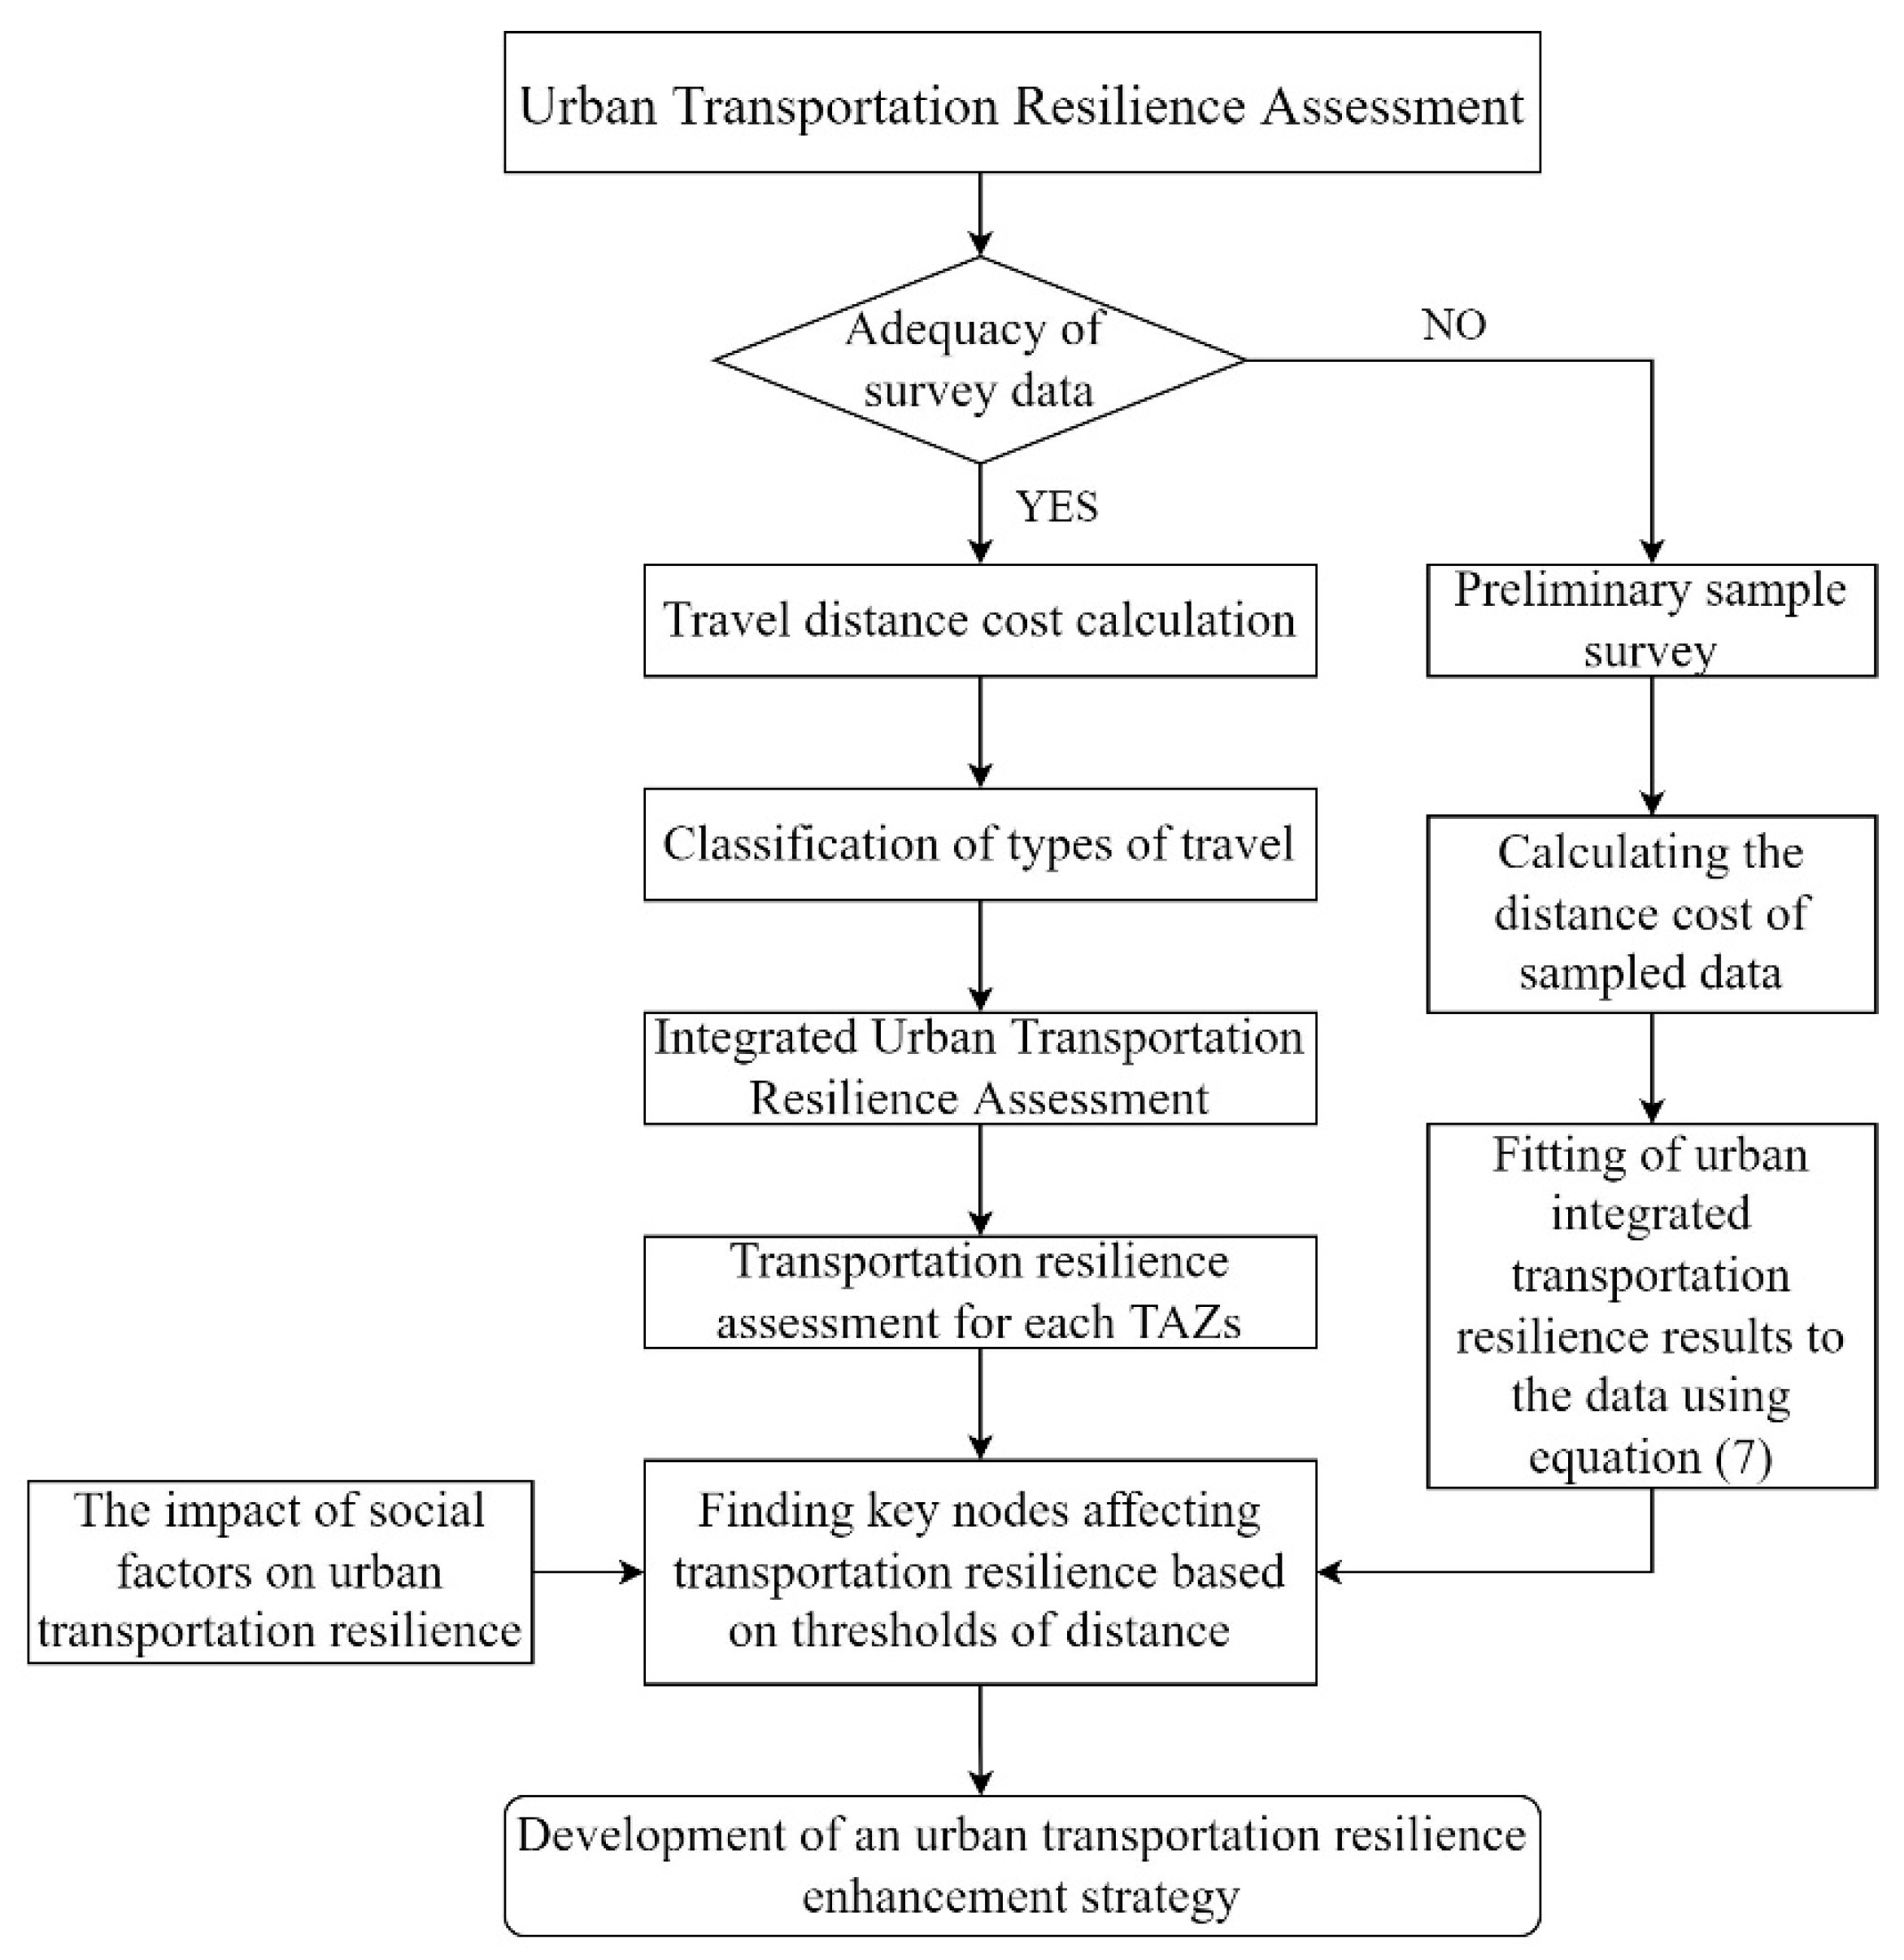
2. Materials and Methods

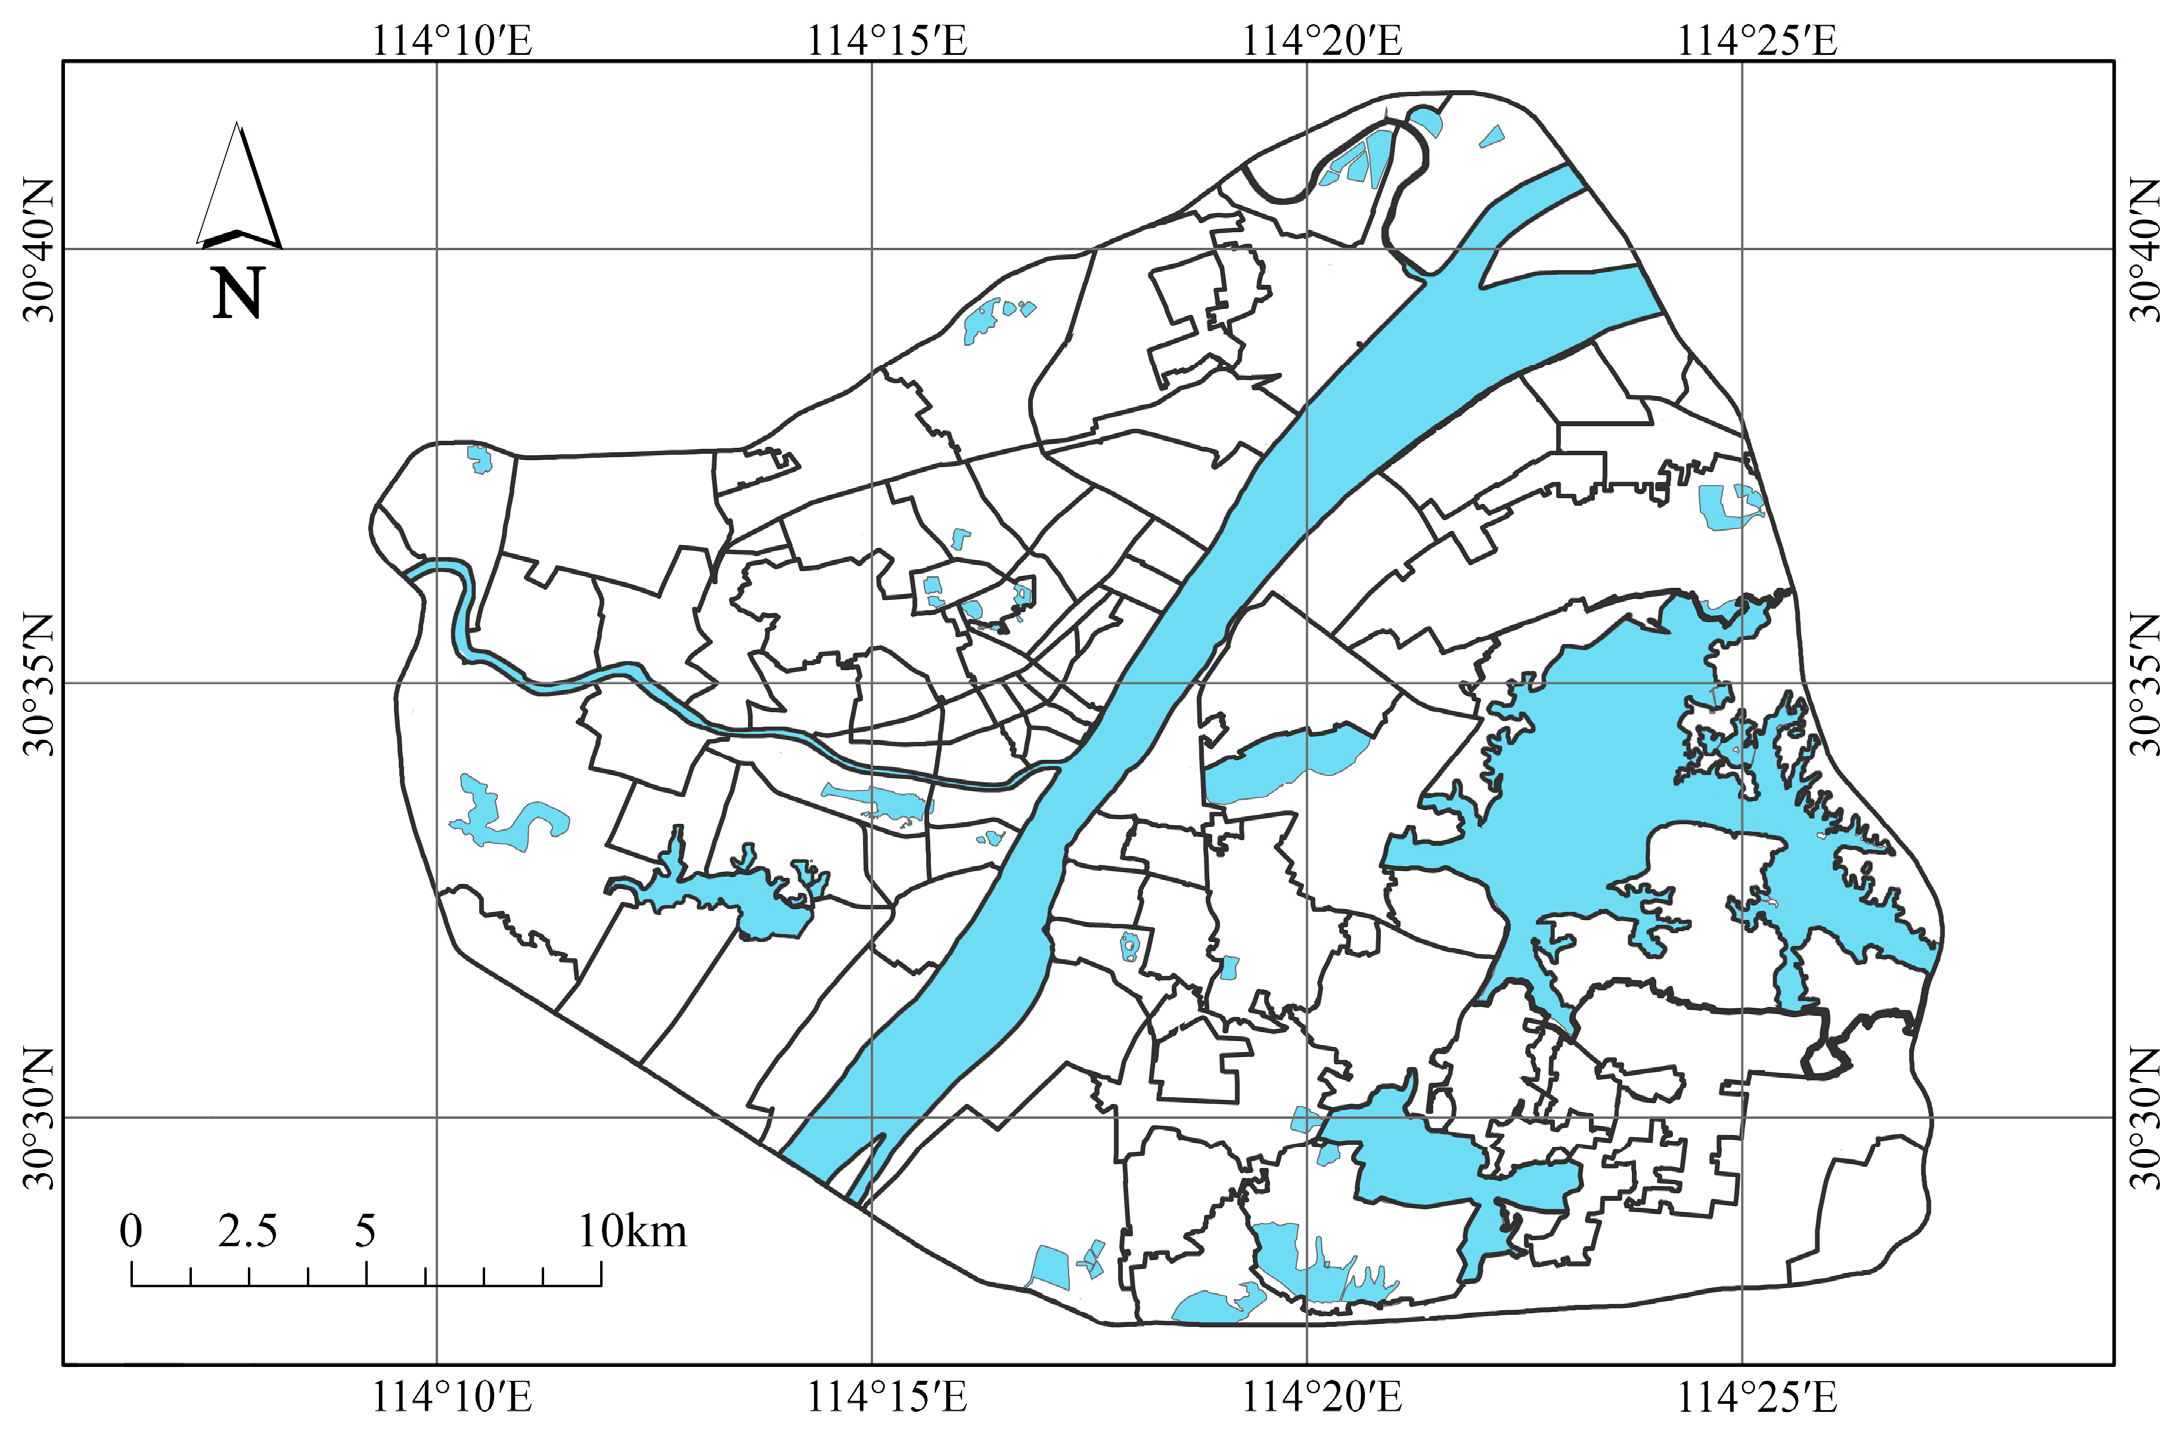
2.1. Sources of Data

COVID-19 was first identified in Wuhan, which was hit hard by the epidemic in early 2020 and led to a 76-day closure of the city. Two years after the outbreak, Wuhan’s public transport traffic is still far from the levels in 2019, and it is clearly recovering slower than other cities in China that have not experienced the severe impact of the epidemic. The epidemic has changed the travel attitudes of Wuhan residents, which is of great value in investigating the travel characteristics of urban residents in the post-epidemic era. Therefore, this paper took Wuhan as the research object. Seven central urban areas, including Jiang’an District, Jianghan District, Qiaokou District, Hanyang District, Wuchang District, Qingshan District and Hongshan District, were selected as the study area, with an area of about 860 km2 and involving a resident population of about 6.4 million.
As the basic administrative unit of Chinese cities, subdistricts have certain functional integrity and transportation integration [24]. So, there are 86 subdistricts in the study used as TAZs (Traffic Analysis Zones) for resilience assessment (Figure 1) [32].
In order to obtain sample data on the travel characteristics of Wuhan residents, the sampling method used was mainly in the form of a questionnaire. The work started in March 2021 and lasted for one year. A research team of more than ten people conducted a large number of investigations through a combination of online network push and offline field distribution. A total of 9010 valid questionnaires were collected, including respondents’ OD (Origin-Destination) data on their daily travels after the outbreak, the main mode of transportation for daily travels and household financial income. The online questionnaire was distributed based on the Credamo platform, a questionnaire distribution system with more specialized functions, which grids the respondents by restricting their IP addresses, and embedded the option of geographic coordinates in the questionnaire, so that the daily OD data of the respondents could be extracted directly. This compensates for the inefficiency of offline questionnaire distribution and the tendency to concentrate respondents in different areas. In addition, the geographic data such as administrative divisions and road networks in this manuscript are sourced from the Gaode open platform, a system of open map data services, and vectorized based on ARCGIS 10.7. According to the survey results, for the residents’ daily mode of transportation, the number of people who chose to walk is 883, the number of people who rode is 1165 (including bicycles, electric vehicles and motorcycles), the number of people who took the bus is 1268, the number of people who took the subway is 3973, the number of people who travelled by car is 1649, and the number of people who traveled by other means was 72. In Rastogi R’s research on non-motorized mode as a sustainable transportation option, it is believed that controlling the travel distance within 5 km will be more conducive to achieving sustainable and healthy travel modes [33]. From the distribution of the daily OD distance of all respondents, it was seen that 49.56% of the respondents had a daily OD distance of less than 5 km, indicating that the residents had a high potential for non-motorized travel in Wuhan (Figure 2).

2.2. Research Methods

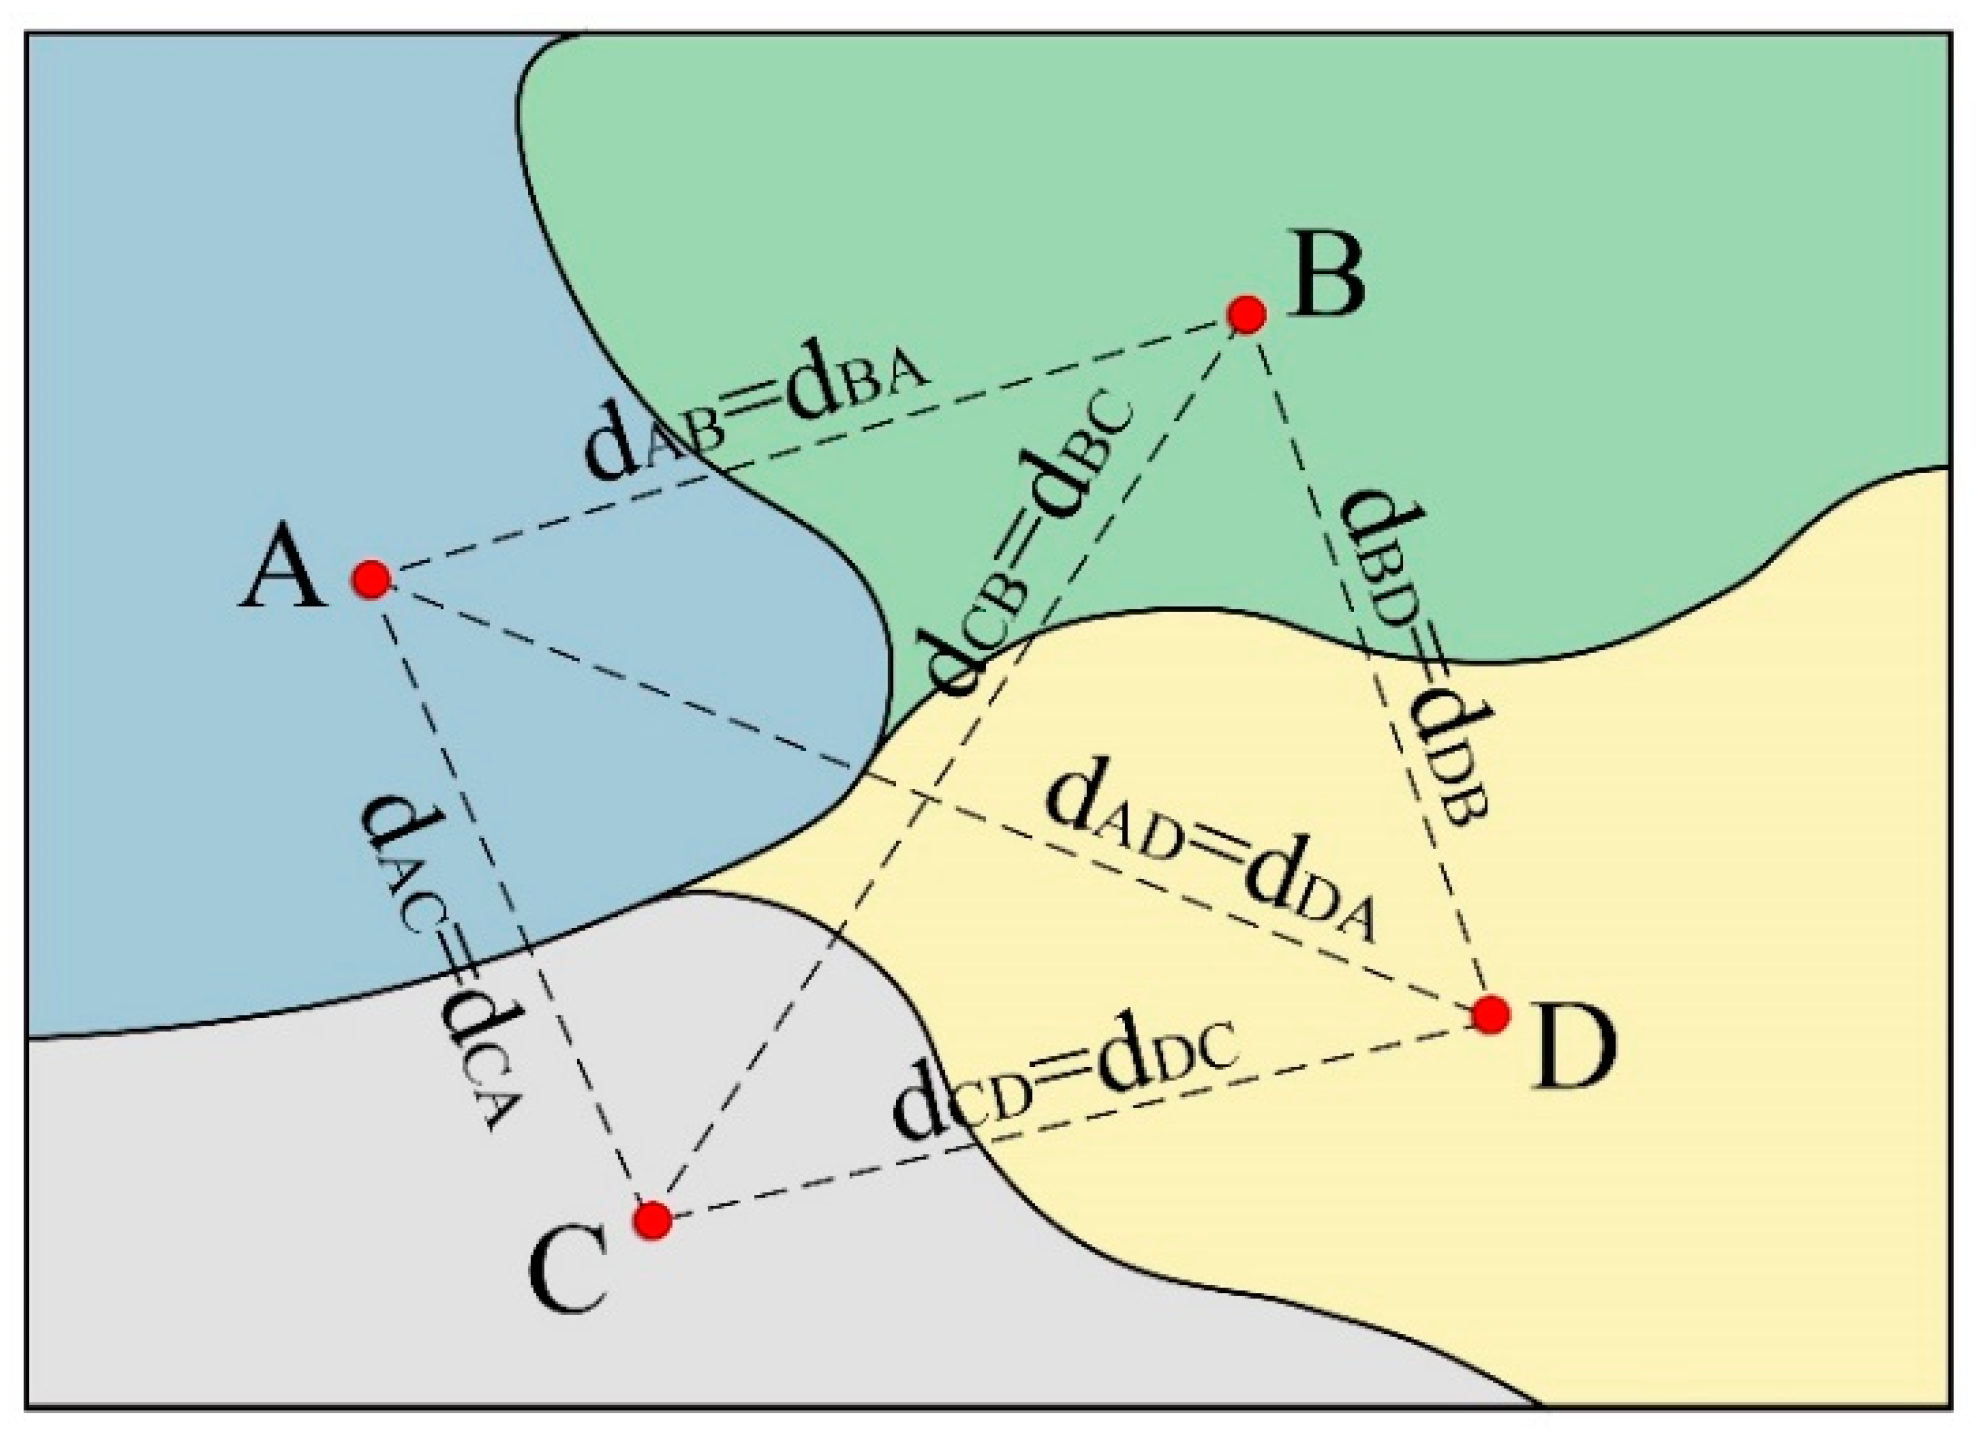
2.2.1. Definition of Travel Distance

Caprì S., Stamos I. and Krumdieck S. [29,30,31] classified urban residents travel by necessity and degree of impact, on the basis of which this paper analyzed the feasibility of non-motorized alternatives and the maximum distance travelled in such situations, assuming that motorized travel may be restricted to varying degrees during sudden disasters [34]. The concept of MWD (Maximum Willing Distance) for residential non-motorized mode travel was proposed to represent the maximum distance that urban residents would ideally be willing to walk or cycle, where WMWD and RMWD can be used to represent the maximum willing distance for walking and cycling respectively.
The network analysis function in ARCGIS 10.7 enabled the processing of residents’ daily OD data to measure the actual distance travelled by residents on a daily basis. In order to facilitate the analysis of the regional distribution of transportation resilience, the geometric center of the TAZ in which each OD data was located was used as the origin or destination of the respective region in the calculation and extraction of the actual travel distance. For example, A, B, C and D represented the four TAZs in Figure 3, with each trip taking the geometric center of the TAZ in which it was located as the origin or destination, and the distance between them all being the shortest path distance in the urban road network (e.g., dAB, dAC, etc.). When both the origin and destination were within the same TAZ, the OD distance was generally short and can usually be travelled directly non-motorized, and the actual distance travelled was taken as 0 for simplicity of calculation.
A further comparison of the actual daily travel distances of urban residents with the WMWD and RMWD values resulted in a preliminary classification of transportation trips (Table 1).

2.2.2. Travel Mode Division

The resident travel mode segmentation was based on the concept of travel mode shift [35,36,37] and accordingly a model to assess the level of transportation resilience with a MWD threshold was proposed. This series of thresholds provided a good indication of the scope of control within which urban transportation systems can be optimized and problems solved in the event of a sudden disaster, thus minimizing the impact of all types of transport stoppages on the travelling public.
As a result, Wuhan residents’ travel was divided into four modes, including non-motorized conventional travel, non-motorized over-distance travel, motorized adaptable travel and motorized non-substitutable travel (Figure 4). Non-motorized conventional travel indicated that residents’ daily travel distances were within their respective MWD, i.e., daily travel distances were less than both WMWD and RMWD. Non-motorized over-distance travel referred to a specific group of people who, due to individual factors, chose to walk for distances outside their WMWD, and walk or cycle for distances outside their RMWD. This group of people were less likely to be affected by the suspension of urban motorized transportation, despite the fact that their non-motorized travel distances were further than the general population. Motorized adaptable travel indicated that residents chose to travel by motorized means despite their daily travel distance being within the MWD, and therefore can also switch from motorized to non-motorized travel when motorized transportation was out of service due to the short travel distance. In contrast, motorized non-substitutable travel meant that the distance travelled exceeded the corresponding MWD and cannot be replaced by non-motorized means such as walking or cycling, so that travel cannot be completed when motorized transportation was shut down due to sudden disaster shocks.

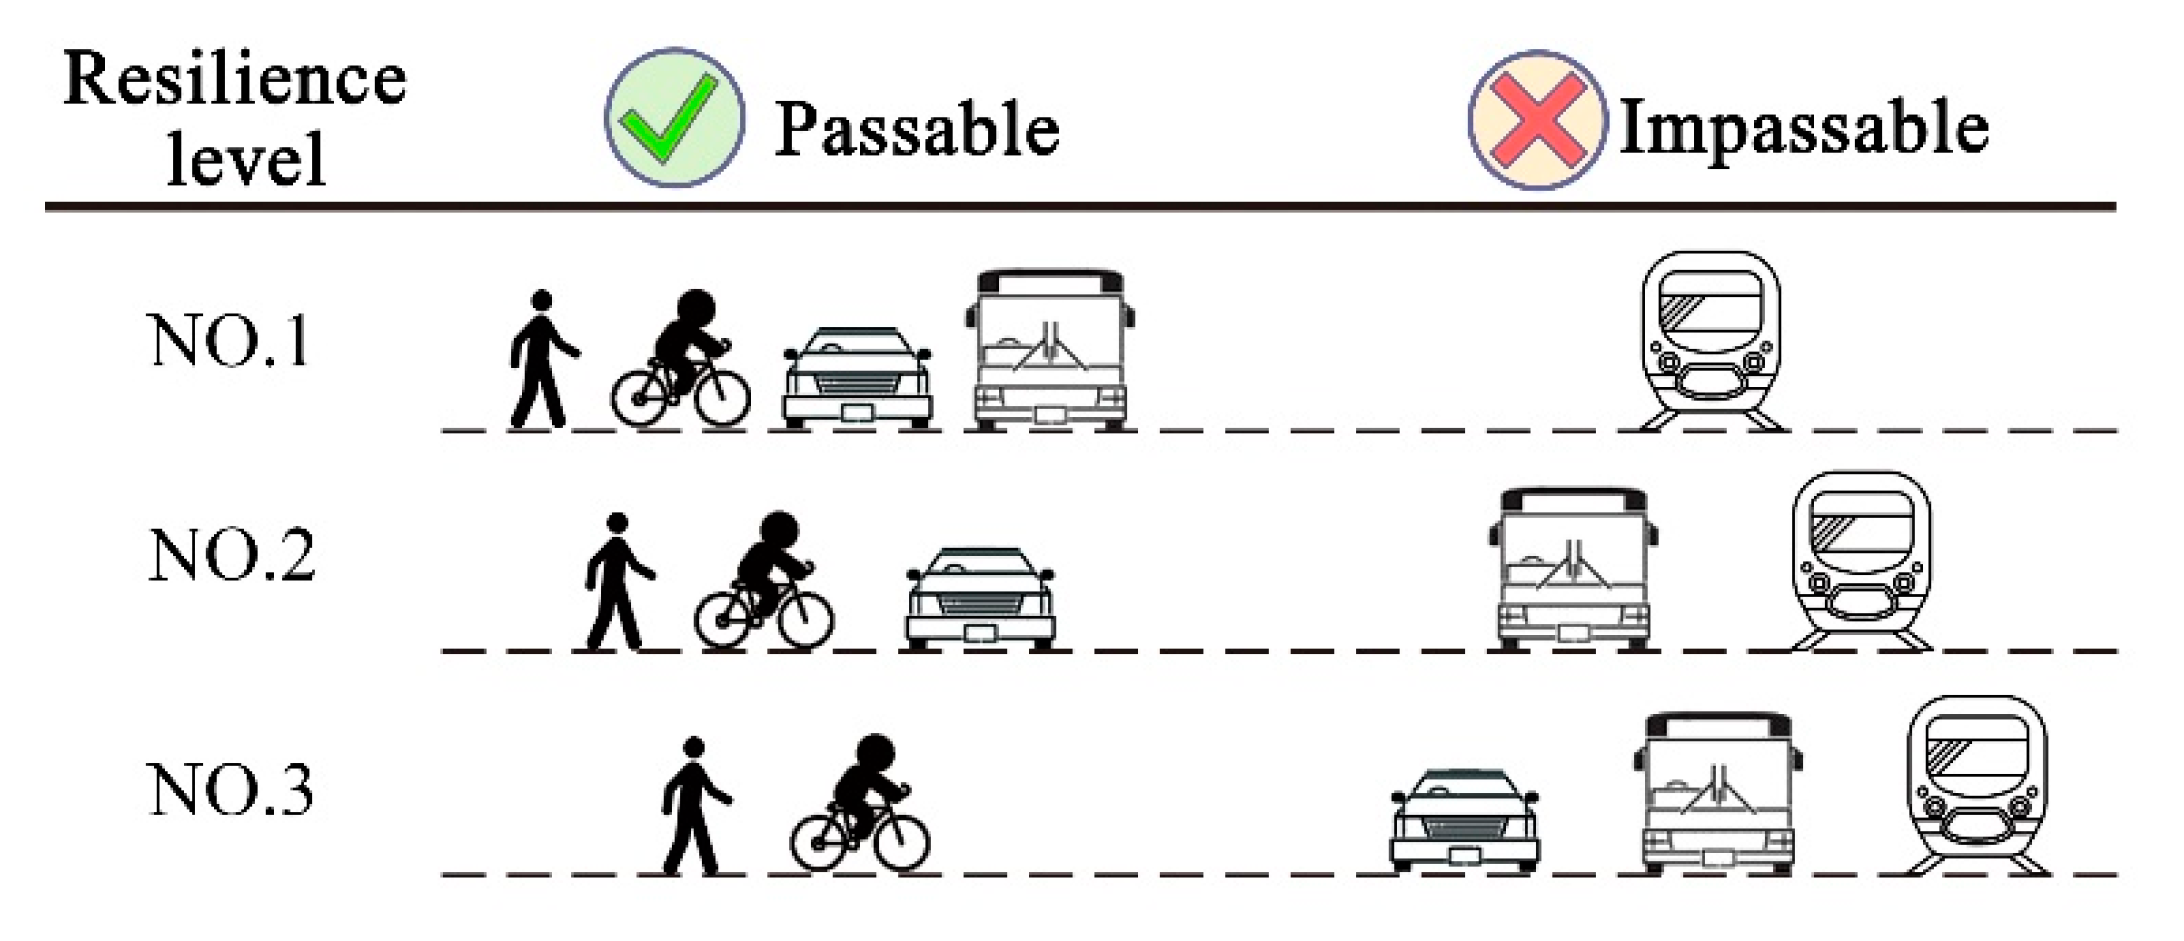
2.2.3. Transportation Resilience Grading

In Nélson’s 2019 study [34], he argued that external shocks may lead to urban motorized transportation shutdowns. Based on this, Nélson analyzed the transportation resilience of two typical Brazilian cities. At the time, the study was based on a scenario of possible external shocks, but only a year later the hypothetical urban transportation shutdown due to the COVID-19 epidemic was actually occurring in many parts of the world. Transportation closures around the COVID-19 outbreak were often graded, ranging from vehicle closures at some stations to a mobility ban for the entire population. But there were three types of transportation travel restrictions that were most common in general, which were stepped up in descending order of restriction level. The first level was a single operating restriction for the metro. The second level was a public transportation travel restriction that included all public transportation modes such as buses and ferries. The third level was a motorized transportation travel restriction that included all motor vehicles except emergency vehicles. It was reasonable to stop the metro first in times of pandemics because the metro, which carried a large number of passengers in populated cities, was the most significant contributor to the spread of infectious diseases. Some metro lines might even become “high speed corridors” for the spread of epidemics in the city. Compared to the metro, other public transportation in the city was a close second in terms of its contribution to the spread of the epidemic, while the correlation between self-driving or non-motorized travel and the spread of the epidemic was significantly weaker than for public transportation [24].
For example, on 22 April 2022, there was a more serious epidemic backlash in Beijing, as a result of which some metro stations were closed and the government encouraged residents to travel by car. This is a typical case of restricted metro travel. Restrictions on public transportation had also been issued in some areas. For example, on 21 October 2020, the Spanish government reopened a six-week home-based order to reduce the number of public transportation operations and restrict non-essential travel in response to the resurgence of the epidemic. Among the total motorized transportation travel restrictions, for example, Wuhu, Anhui Province, China, adopted temporary transportation controls in response to the epidemic on 17 April 2022, suspending travel for all vehicles and people in the city except emergency vehicles. On 30 October 2021, all roads in Yanshan County, Jiangxi Province, China, were continuously illuminated in red following the epidemic. Although motorized transportation has not been banned in the form of a ban, motorized transportation has been completely restricted in fact, while non-motorized travel has not been affected for the time being. In addition, there were areas where almost all people were banned from going outside for a period of time, such as California, where the strictest home restrictions in the United States were implemented on 7 December 2020, during which residents were not allowed to go outside except for essential activities. This was also the case for Wuhan, China in early 2020 and Shanghai, China in the second quarter of 2022, where all travel stopped and the cities’ resilient transportation system was essentially defunct, and was therefore outside the scope of this paper (Table 2).
The three types of travel restrictions mentioned above are not limited to times of epidemics; other sudden disasters are just as likely to result in the suspension of motorized transportation. When a disaster strikes it is clear that Metro transportation is the most vulnerable and therefore most susceptible to shutdowns, followed by other public transportation such as buses and then private cars, while non-motorized travel is the most flexible. In fact, people will naturally tend to make various preparations for non-motorized travel because of their low expectations for the sustainability of motorized transportation in the face of sudden disasters. For example, in May 2022, due to the long-term epidemic control in Beijing, a large number of citizens began to use bicycles as a new means of travel, resulting in a general increase of about 30% in bicycle sales, and some manufacturers even have orders in place until 2024, which shows that cycling has a strong substitution in urban transportation. As a result, the paper assumed and analyzed urban transportation resilience when the above three types of travel restrictions occur. The three types of travel restrictions were assigned to three levels of resilience, with first-level resilience being when metro operations were restricted, second-level resilience being when public transportation travel was restricted, and third-level resilience being when all motorized transportation was restricted (Figure 5). Based on the above, the level of urban transportation resilience was determined by the relative share of non-motorized conventional travel, non-motorized over-distance travel and motorized adaptable travel in the total travel category, while motorized non-substitutable travel was able to represent the level of vulnerability of the urban transportation system [34].

2.3. Calculation of Resilience Indicators

As non-motorized conventional travel and non-motorized over-distance travel were not affected by the three levels of transportation travel restrictions described above. The calculation is as follows.
P u = 1 S ( i = 0 , i > M W D n W i + j = 0 , j > M W D n C j ) × 100 %
P r = 1 S ( i = 0 , i M W D n W i + j = 0 , j M W D n C j ) × 100 %
P u represented the proportion of non-motorized over-distance travel in the corresponding MWD scenario. P r represented the proportion of non-motorized conventional travel in the corresponding MWD scenario. i and j represented the distance cost of walking and the distance cost of cycling respectively. W i represented the number of people who chose to walk for travel distance i. C j represented the number of people who chose to ride for travel distance j. S represented the total number of people who travelled.
The types of restricted motor vehicles in the three resilience levels for motorized adaptable travel were different and therefore have different resilience values. The calculation process for this resilience indicator is as follows.
P a 1 = 1 S [ j = 0 n ( A j + B j ) + j = 0 , j M W D n M j ] × 100 %
P a 2 = 1 S [ j = 0 n A j + j = 0 , j M W D n ( B j + M j ) ] × 100 %
P a 3 = 1 S j = 0 , j M W D n ( A j + B j + M j ) × 100 %
where P a 1 , P a 2 , and P a 3 represent the percentage of motorized adaptable travel patterns in the MWD scenarios corresponding to Level 1 resilience, Level 2 resilience and Level 3 resilience, respectively. A j indicated the number of people travelling by car when the travel distance was j. B j indicated the number of people travelling by public transportation other than metro when the travel distance was j. M j indicated the number of people travelling by metro when the travel distance was j.
By accumulating the relative share of non-motorized conventional travel, non-motorized over-distance travel and motorized adaptable travel in the total travel category, the above three levels of resilience indicators were obtained. The calculation process is as follows.
R = P u + P r + P a
where R denoted the level of resilience of urban transportation. P a indicated the proportion of motorized adaptable travel in the corresponding MWD scenario, with the values of P a corresponding to the values of P a 1 ,   P a 2 and P a 3 in Equations (3), (4) and (5) for the Level 1, Level 2 and Level 3 resilience scenarios respectively. Based on these indicators, a series of scenarios with different MWD values were arranged to analyze the changes in the overall transportation resilience level for the city, thus identifying scenario nodes of significance. The same method was used to calculate the resilience level of each TAZ in these scenarios.

3. Results

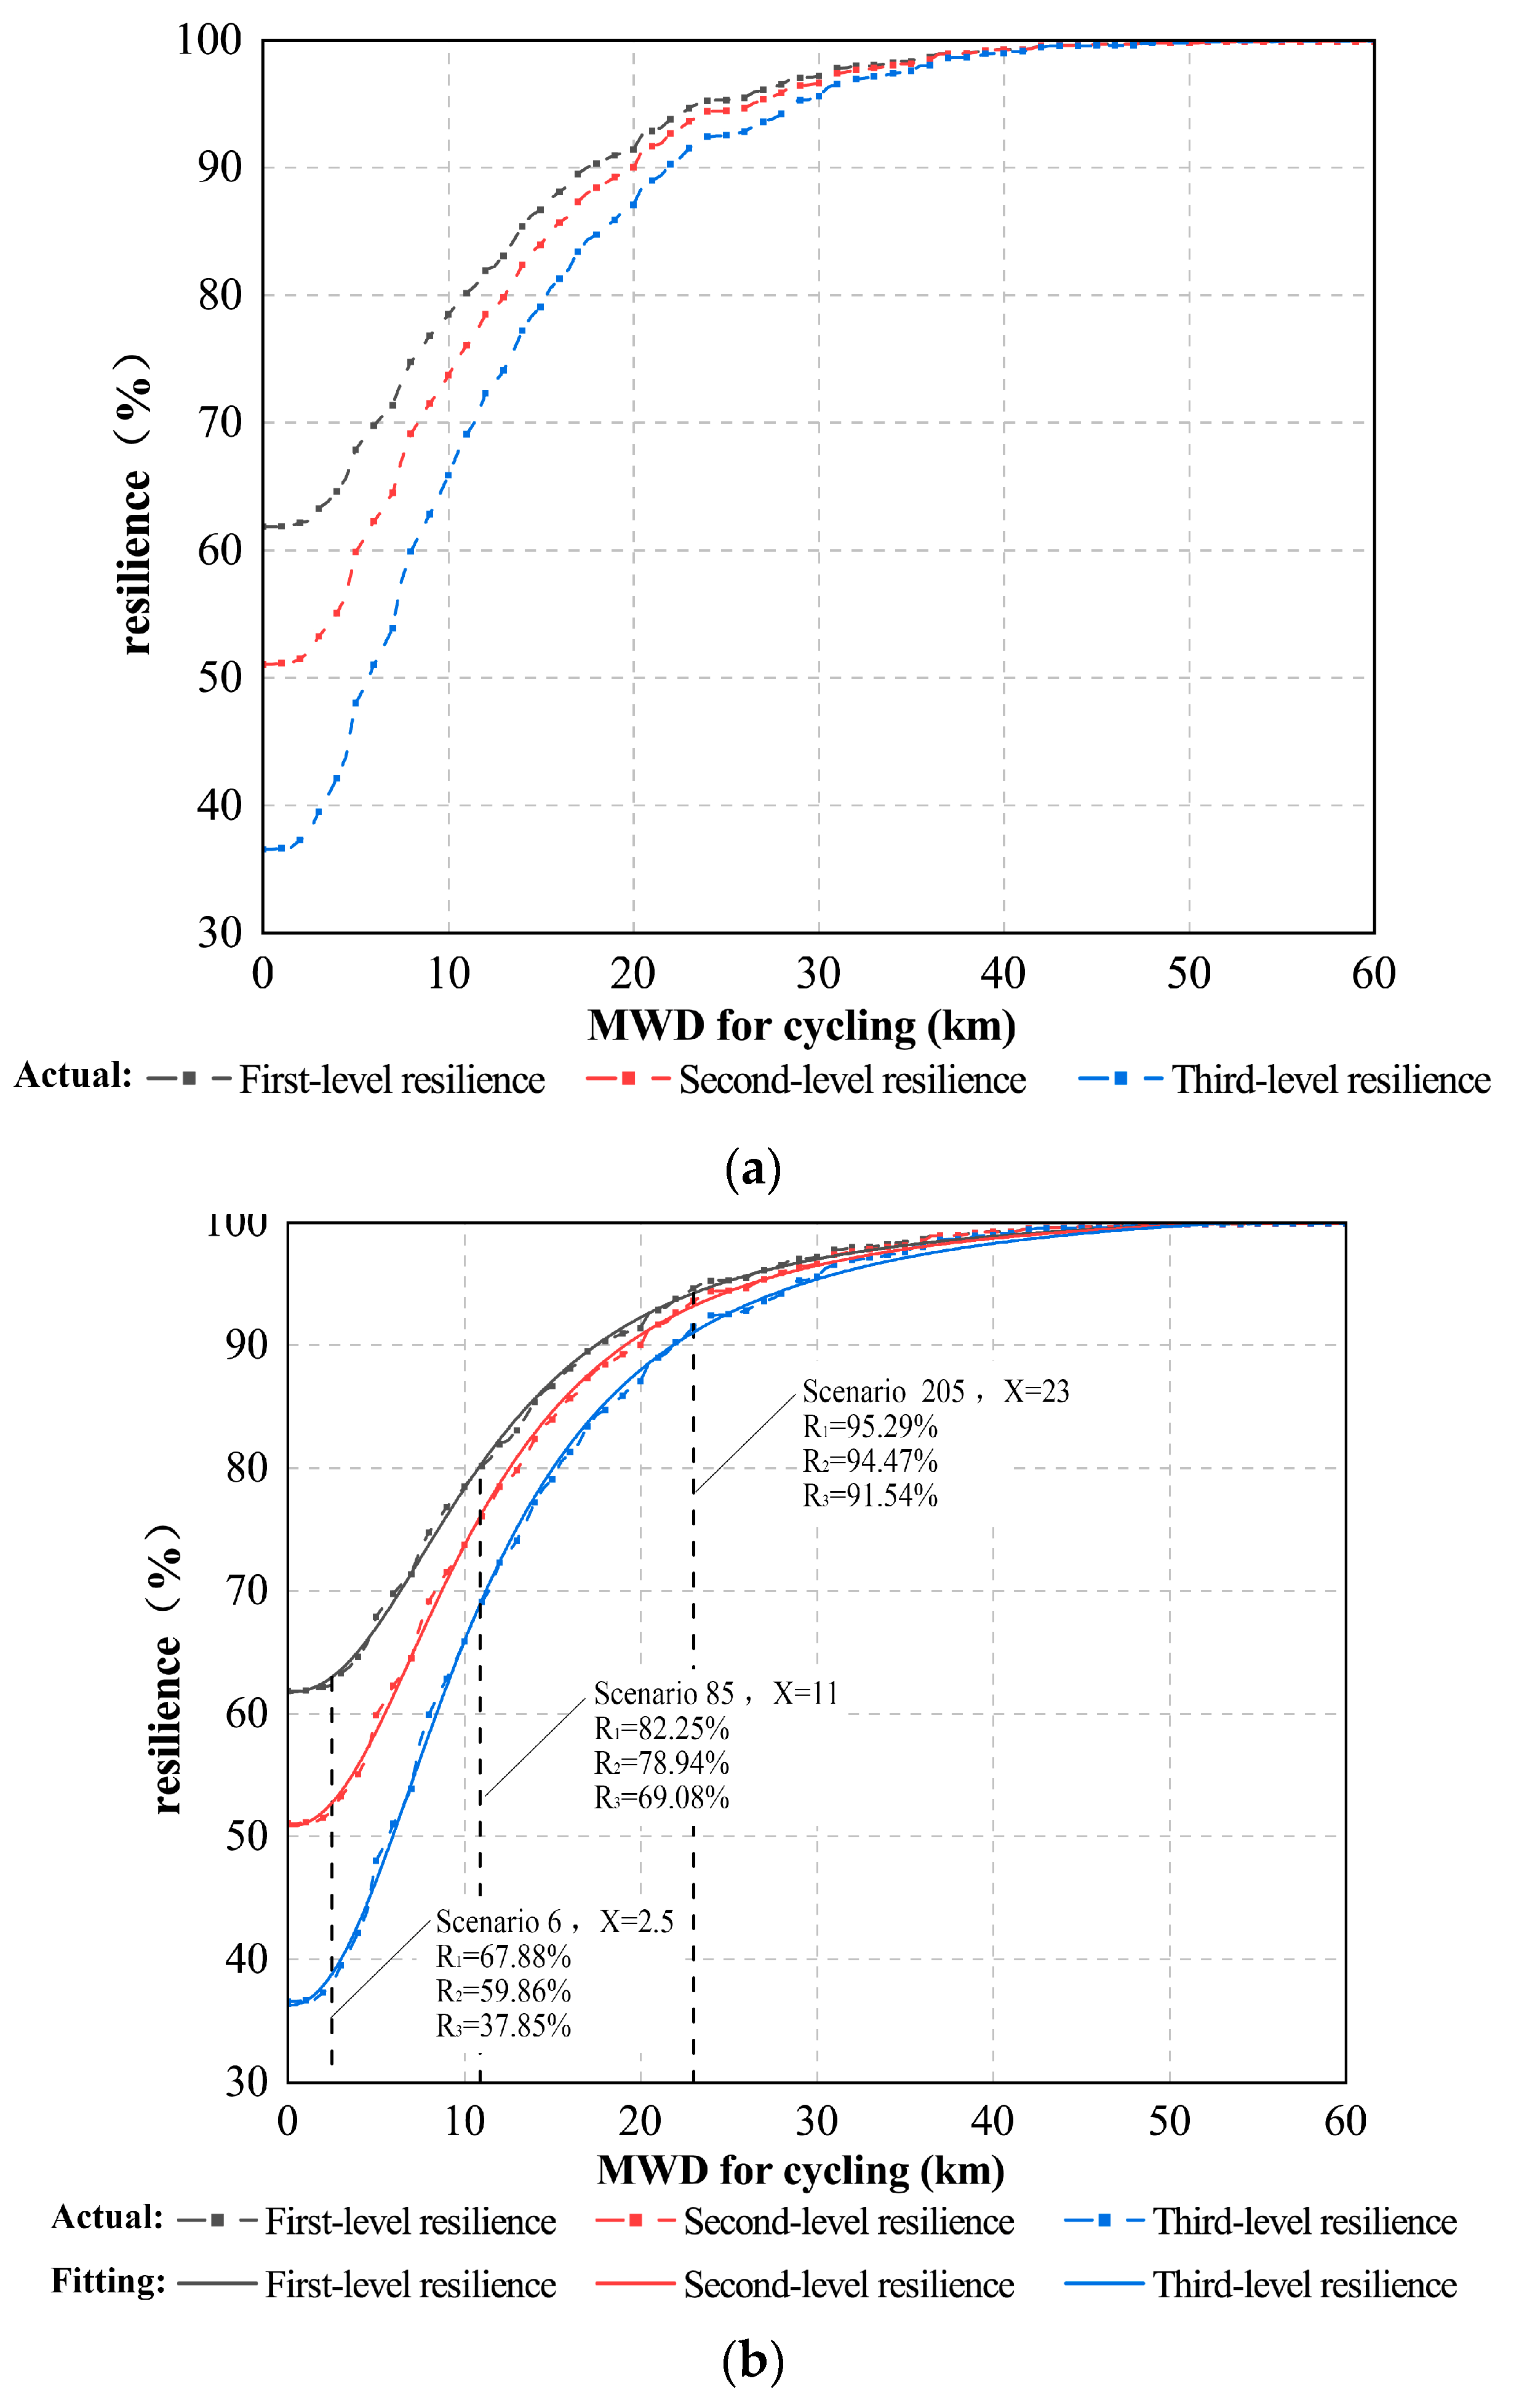
3.1. Integrated Urban Transportation Resilience Assessment

Due to individual differences in each respondent, their MWD for walking and cycling differed from each other. In this paper, the level of integrated urban transportation resilience at different distance costs in multiple scenarios was simulated and analyzed by continuously increasing the MWD for walking and cycling from 0 km. The survey data within the study was then imported into different scenarios to calculate the respective share of each of the four travel modes within them, which in turn fitted the relationship between the MWD and the overall level of integrated transportation resilience in the city. Table 3 showed the simulated 479 scenarios for Wuhan’s integrated transportation resilience assessment.
In the simulations of 479 scenarios, the three levels of resilience corresponding to each scenario were obtained according to the calculation method of resilience described previously (Table 4). If Wuhan’s integrated transportation resilience levels reached 100%, it meant that all transportation travel in the city could be shifted to non-motorized modes, at which point the RMWD in Level 1, Level 2 and Level 3 resilience would be 45.5 km, 48 km and 50 km respectively. In addition, the integrated transportation resilience levels for the three levels were 65.65%, 56.42% and 36.58% respectively when both WMWD and RMWD were at 0 km. The reason for this difference was due to the different transportation travel restrictions in the three resilience levels.
The WMWD was set at an upper limit of 4 km, and the entire range of values was included in the range of RMWD. The paper therefore plotted the change in resilience levels from 0 km, taking RMWD as the independent variable, to visualize the change in resilience levels with MWD for the city’s integrated transportation. The curves were shown in Figure 6a and it could be seen that the curves for the three resilience levels differed in their initial resilience values at an RMWD of 0 km, but the trend of the curves and the location of the inflection points were basically the same. A 4-parameter logistic model was fitted to the actual variation curves shown in Figure 6a, resulting in the “S-shaped” fitted curves shown in Figure 6b. The R2 of these fitted curves were all greater than 0.998, so the fit was very well done. The results of the fit are shown in Table 5.
The results of the fitted curves are in accordance with Equation (7).
R = A 2 + A 1 A 2 1 + ( x x 0 ) p
where A 1 was the resilience value when the independent variable tends to infinity, A 2 was the resilience value when the independent variable tends to zero, x 0 was the RMWD, the inflection points of the curve, when the fitted curve was increasing at the fastest rate. p was the slope of the curve at x 0 .
Based on the fitted curve of Wuhan’s integrated transportation resilience levels shown in Figure 6b, the changing characteristics of Wuhan residents’ travel patterns were further analyzed when the MWD gradually increased. The “S-shaped” curve had three inflection points at which the slope changed abruptly, corresponding to the three possible shifts in travel patterns of Wuhan residents. These points of inflection were also three important points of change in the city’s integrated transportation resilience levels. When the first inflection point occurred at an RMWD of 2.5 km, corresponding to scenario 6, the resilience values for the three resilience levels were 67.88%, 59.86% and 37.85% respectively. At this inflection point the resilience value changed abruptly from a slow increase with increasing RMWD values in the previous period to a rapid increase. The second inflection point occurred when the RMWD was 11 km, corresponding to scenario 85, where the rate of increase in resilience values began to slow down, at which point the three resilience levels reached 82.25%, 78.94% and 69.08% respectively. The third inflection point occurred at an RMWD of 23 km, corresponding to scenario 205, after which the resilience values did not increase significantly. At this point the resilience values for all three resilience levels were more than 90% and the difference in values was minimal. The above analysis of the shift in travel patterns and the identification of nodes of change in transportation resilience levels will contribute to the specialized prevention and deployment of urban transportation managers for critical scenarios during sudden disasters.

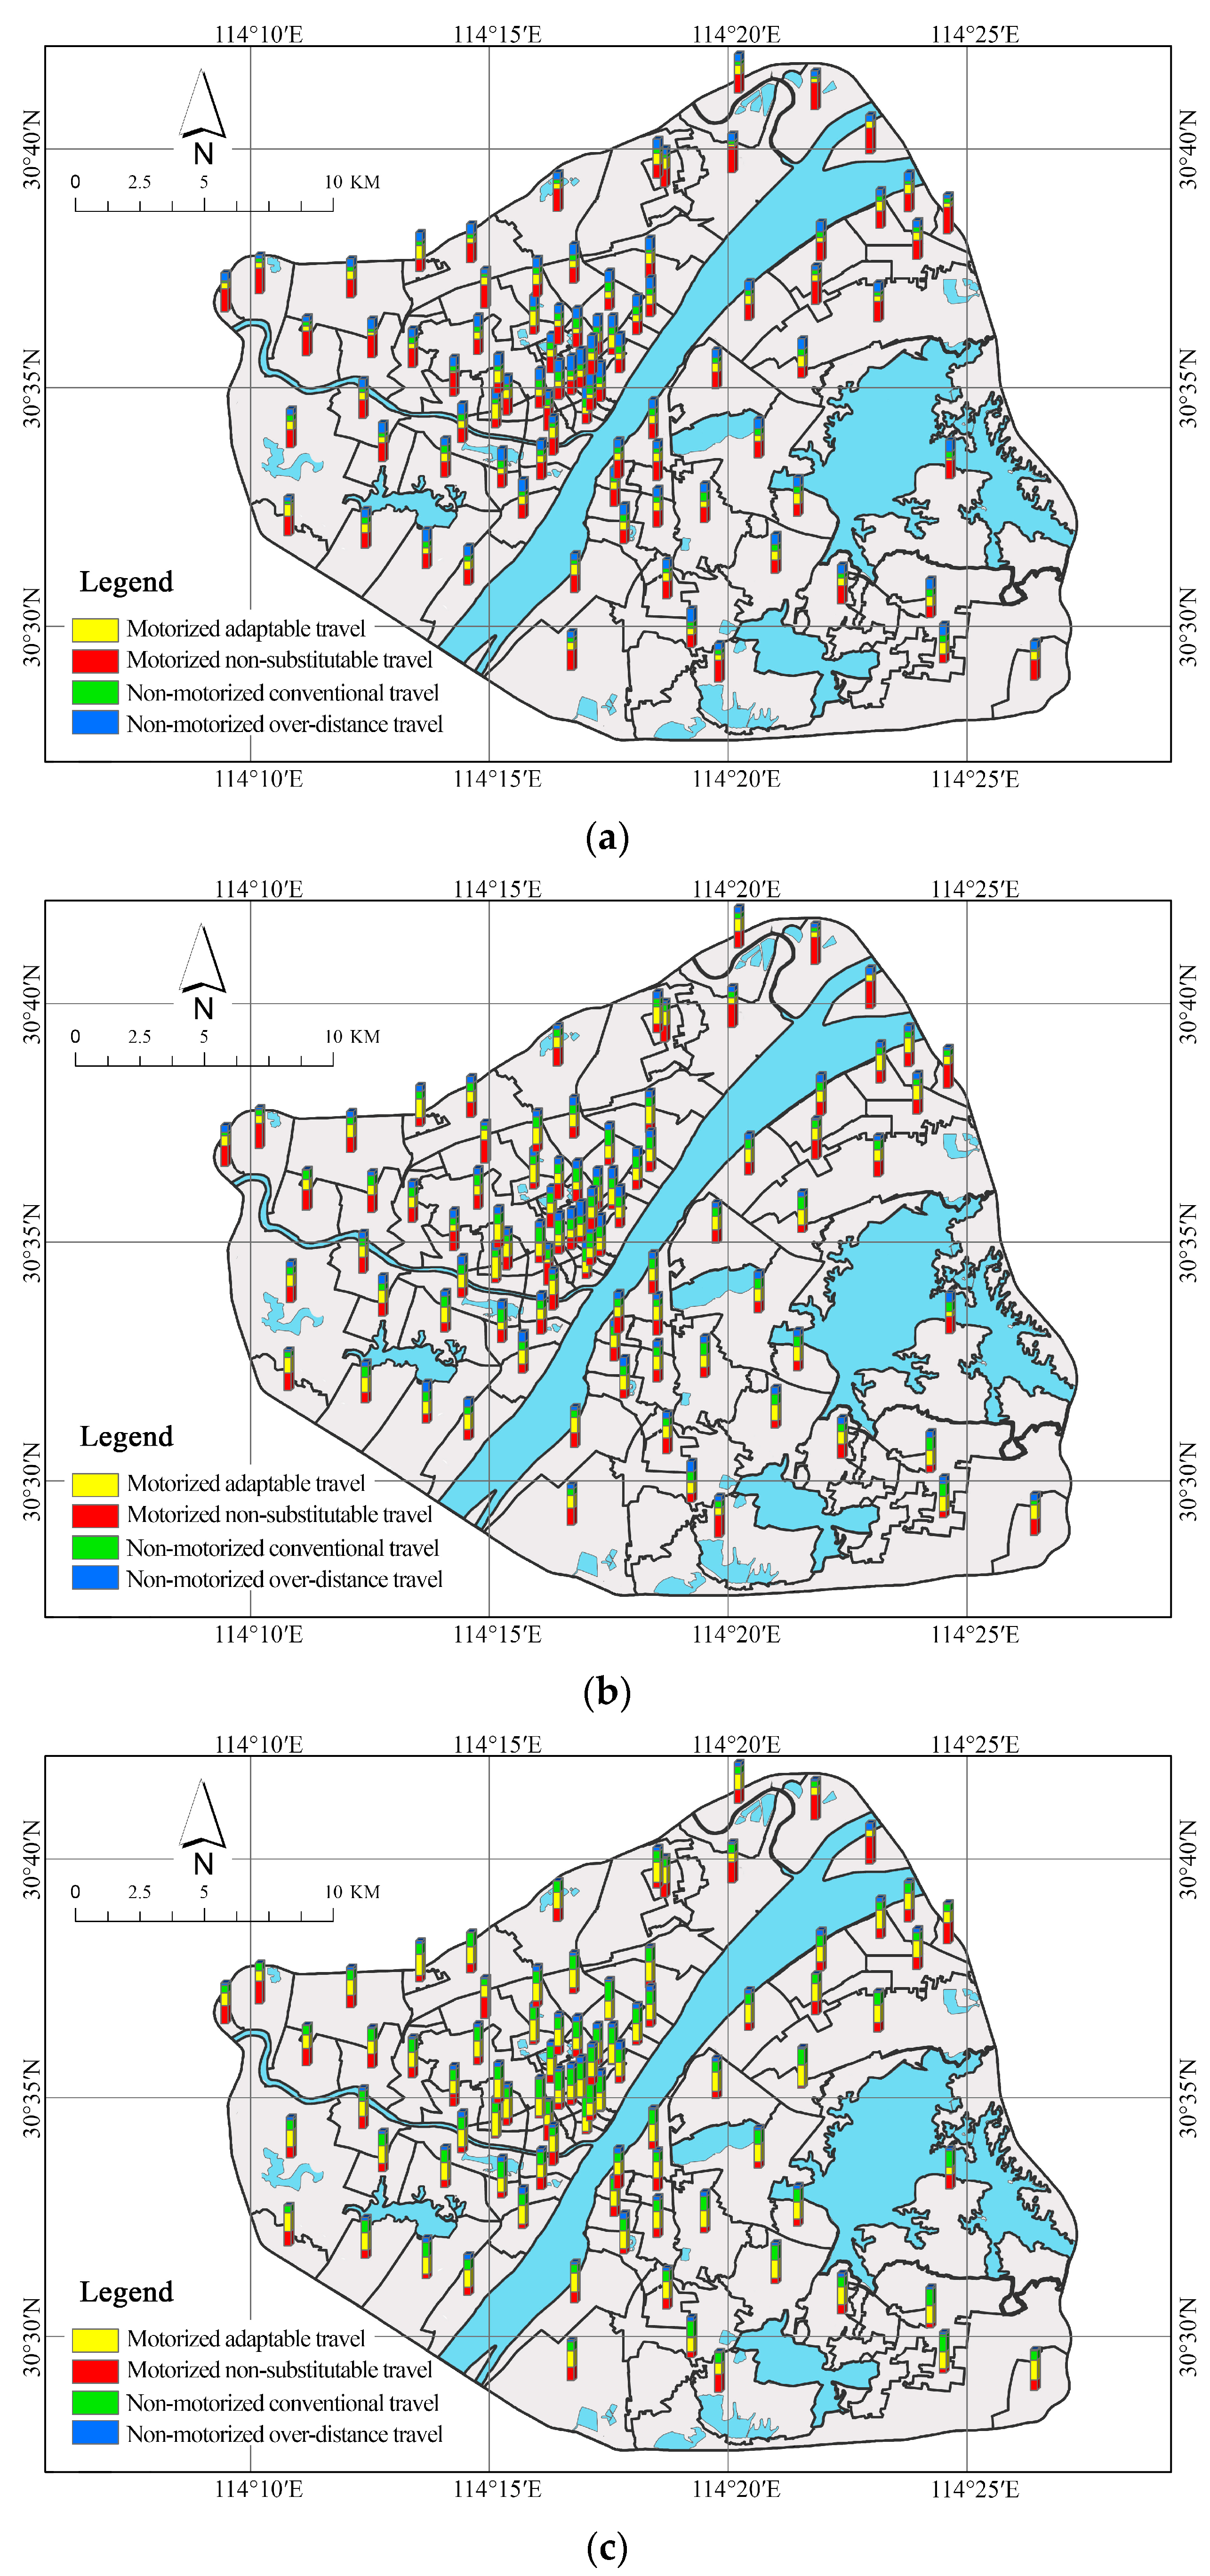
3.2. Distribution of Transportation Resilience Levels across TAZs in Wuhan

Among the three transportation resilience levels described above, third-level resilience corresponded to the full motorized travel restriction and reflected the most extreme case of urban transportation resilience. The results of the calculations were highly representative. Therefore, the distribution of transportation resilience levels for each TAZs in third-level resilience was further analyzed in Wuhan. Figure 7 showed the distribution of each of the four residential travel modes in each TAZ at the three inflection points (i.e., at RMWD values of 2.5 km, 11 km and 23 km respectively) of the fitted curve of the city’s integrated transportation resilience level. The distribution chart reflected the transportation resilience level and its changing trend in different regions of Wuhan.
As shown in Figure 7, the proportion of motorized non-substitutable travel modes was greater overall in urban periphery regions of Wuhan than in the downtown, regardless of whether the RMWD value is 2.5 km, 11 km or 23 km. The regions from Chenjiaji to Wuhu in the north of Hankou and the Gutian in the west of Hankou were particularly significant, while the Optical Valley in the southeast of Wuchang was relatively insignificant. The regions from Chenjiaji to Wuhu and Gutian had in common that they were densely populated, but the lack of industrial support and the sparse road network in the region often led to long commuting distances for residents. The Chenjiaji to Wuhu region is currently planned for the construction of the Yangtze River Demonstration District, where both industry and transportation are not yet complete. While the Gutian is an old urban region of Hankou and the construction of the metro within the region is seriously delayed. Both of these regions have problems with being blocked by the railway, which makes it further difficult for residents to travel non-motorized. In contrast, the Optical Valley region is a gathering area for Wuhan’s high-tech industries, where various transportation facilities are well established, attracting the majority of residents to work and live in the district. This indicated that the distribution of industries had a significant impact on the resilience of urban transportation.
In addition, when the RMWD was low, at 2.5 km, the proportion of motorized non-substitutable travel in the downtown was close to the proportion in urban periphery regions, both at the similarly high level. When the RMWD was increased to 11 km and 23 km, the proportion of motorized non-substitutable travel in the downtown decreased significantly compared to the urban periphery regions. This suggested that residents of the downtown were more likely to shift to non-motorized travel as the RMWD increased, while there was more resistance to shift in urban periphery regions. It also meant that a relatively large number of residents in the downtown of Wuhan still travelled more than 2.5 km daily and chose to travel by motor vehicle. Further analysis of the OD data for this type of resident showed that most of them had traffic detours, which were mainly caused by the vast area of Wuhan’s waters. A large proportion of residents were bound to have more detours due to cross-river travel and were therefore unsuitable for non-motorized transportation options (Figure 8). The three towns of Wuhan, formed by the division of the Yangtze and Han rivers, boast a scattering of lakes of all sizes, so the city’s road network is not laid out in the usual circular radial pattern. The geographic center of Wuhan is located along the river, forming a cluster layout with multiple banks along the river, which made it less accessible than the cities with a centralized layout. Even parts of the city center had become “End of traffic” in a sense due to the more obvious problem of bypassing transportation along the river [38]. The geographical characteristics described above led to an inherently weak foundation for transportation resilience in the downtown of Wuhan. In addition, urban centers are generally old urban areas where buildings are dense, vehicles are congested and roads are narrow. The lack of a good slow-moving transport system will inevitably make it difficult to support residents to actively choose non-motorized modes of travel such as walking or cycling, which is also a problem of resilience in the downtown of Wuhan. Generally speaking, walking within 3 km and cycling within 5 km are ideal for human habits. It is therefore necessary to optimize urban transport facilities as much as possible to make them pedestrian-friendly and cycling-friendly. This will promote the conversion of some motorized non-substitutable travel to non-motorized travel, ultimately increasing the resilience of urban transportation in the event of a sudden disaster.

3.3. Impact of the Average Income Level of the Residents

The income level of urban residents often has an important influence on the mode of transport and thus indirectly on the resilience of cities. The level of income of residents was therefore included as an indicator of individual characteristics in the hierarchical assessment of urban transportation resilience. By surveying the total annual household income of the respondents and the number of household members, the average monthly disposable income of the household members was calculated. Then based on the Hubei Provincial Statistical Yearbook for 2021, the average monthly income level of residents in Wuhan was assigned to four groups (Low income group: RMB 0–1038, lower-middle income group: RMB 1038–2766, upper-middle income group: RMB 2766–6729, high income group: greater than RMB 6729).
Figure 9 showed the relationship between the number of residents’ average monthly income and the distance travelled in three important nodes where the fitted curves emerged as inflection points, namely Scenario 6, Scenario 85 and Scenario 205. Its travel patterns were the four modes described above, which were non-motorized conventional travel, non-motorized over-distance travel, motorized adaptable travel and motorized non-substitutable travel. The results of the study showed that the upper-middle income groups in Wuhan had relatively short daily travel distances, mostly within 20 km. The increase in MWD also allowed for more non-motorized conventional travel and motorized adaptable travel, which indicated a greater flexibility in their travel patterns. In Scenario 6, the proportion of motorized non-substitutable travel dominated. In comparison, its proportion decreased significantly as the MWD increases and its distribution was more dispersed outside the low-income group (Figure 9c). It was also clear that there were two clusters of travel for the low-income groups: Some of these groups concentrated on non-motorized conventional travel when distances were short, while others concentrate on motorized non-substitutable travel when distances were long. The travel patterns of the high-income groups were more dispersed. For short distance travel, people on low incomes were less likely to choose motorized travel due to financial constraints. While for long distance travel the number of people on low incomes was significantly higher, indicating that the separation of employment and residence was more prominent among people on low incomes. Based on the above analysis, it was concluded that the vulnerability of low-income people to travel was significantly higher in sudden-onset disasters, and therefore more consideration should be given to the transportation substitutability of low-income people for long-distance travel in the response measures, while it was important that the enforceability of short distance travel for people on low incomes was also ensured. The simultaneous implementation of these two measures was likely to achieve twice the result with half the effort.

4. Conclusions

In this paper, the three types of travel restrictions potentially caused by a city suffering from a sudden disaster were corresponded to three levels of transportation resilience, and then the MWD threshold was used as the core variable in the urban transportation resilience grading assessment model. Thereby, a fitted curve describing the change in the level of integrated urban transportation resilience had been constructed, and the fitted formula had been further developed. The results of this fitting can be used as a reference for the formulation of relevant transportation countermeasures in sudden-onset disasters when survey data are insufficient due to restricted conditions.
These are the innovations of this paper. In addition, three key conclusions can be drawn from this paper as follows.
(1) When assessing Wuhan’s integrated transportation resilience level, the trend of the curves at the three levels of transportation resilience was almost the similar, all appearing to be “S-shaped”, with the three key inflection points of the curves corresponding to the RMWD of 2.5 km, 11 km and 23 km respectively.
(2) For the level of transportation resilience in Wuhan’s TAZs, the proportion of motorized non-substitutable travel modes among all travel modes was an important indicator, and this proportion was generally greater in the peripheral regions of the city than in the downtown. When the RMWD was low, the difference was not significant, but as the RMWD became larger, the proportion in peripheral urban regions increased significantly. The main reasons for this phenomenon were the more pronounced separation of jobs and dwellings in some peripheral areas of the city and the inadequate planning of the road network, which made the region even less resilient to transportation. On the other hand, the city center was characterized by significant traffic bypasses due to the large amount of water and mostly old urban areas, resulting in an inadequate slow-moving transportation system. As a result, motorized transportation accounted for a large proportion of short-distance trips, and the transportation resilience also needed to be further improved.
(3) Wuhan’s higher income groups travelled relatively shorter distances daily and had more flexibility regarding their travel patterns than lower and middle income groups. For the lower income groups, there are two concentrations of travel. There is a concentration of non-motorized conventional trips when travel distances are short and motorized irreplaceable trips when travel distances are long. The vulnerability of low-income people to travel in sudden-onset disasters is therefore higher.
It is clear that different types of transport stoppages in the event of a sudden disaster will result in some urban residents being restricted from travelling and having no alternative means of transport. The proportion of this part of the population will affect the stability of production and life in the city, as well as the probability of various secondary disasters. Therefore, city managers can carry out effective prevention and comprehensive deployment. Early construction of an evaluation model through surveys of residents’ travel characteristics can identify key thresholds for sudden changes in urban transportation resilience. From this point of view, relevant optimization measures can be taken for areas with low traffic resilience, and strive to quickly change the travel mode of residents in an emergency. The hierarchical approach to assessing urban transportation resilience proposed in this study allows for a rapid determination of the proportion of residents, based on limited data, who may be restricted from travelling during sudden disasters such as epidemics, earthquakes, floods, tsunamis, extreme weather, terrorist attacks and energy crises, and thus a preliminary identification of the above-mentioned urban vulnerable areas with a high proportion of inhabitants. It is therefore suitable for replication in less developed regions where there is a lack of specialist data and researchers to help target transport policy in these areas. Furthermore, the analysis of this paper also suggested that urban managers should take into account the special needs of socially disadvantaged groups when responding to sudden-onset disasters and formulating relevant transportation policies.
As an essential part of the urban system, urban transportation is key to the proper functioning of cities. Shocks from sudden disasters such as COVID-19 could lead to changes in the city’s transportation demand and supply. For example, the growth of passenger and freight demand is slowing down and the constraints of the newly invested resource elements are increasing, etc. Therefore, it is very important to establish the integration of urban transportation, which presupposes the integration of infrastructure, passenger transport services, and the integration of the transport communication and information support guarantee system of heaven and earth. The urban transport resilience assessment methodology presented in this manuscript can lead to improved urban transportation integration in areas such as infrastructure and passenger services, and can help to address problems in transportation supply and demand. The use of the urban transportation resilience assessment method in this study can refer to the process of Figure 10. This method can help managers quickly and accurately explore the key nodes that affect the improvement of transportation resilience.
In this study, the distance threshold was used as the core variable in the graded assessment of urban transportation resilience. We consider that other factors may also lead to a shift in the travel patterns of urban residents. For example, the willingness to choose walking and cycling for non-motorized travel may be related to the friendliness of the city’s slow-moving system, the adequacy of urban transportation facilities and the safety of the urban transportation space. The choice of car, bus and metro travel is not only related to the level of income, but also to the distance of public transportation connections, the extent of public transportation detours and the speed of each mode of transportation. The current weakness of this study is that our analysis of the above factors is still lacking. It is therefore the next step in our work to identify the factors that influence the willingness of urban residents to choose their travel mode and to establish a more disaggregated system of thresholds, so as to achieve a more accurate assessment of urban transportation resilience in the face of sudden disaster shocks.

Author Contributions

Conceptualization, J.W. and R.P.; methodology, J.W. and R.P.; software, J.W. and J.Y.; validation, J.W., J.Y. and Q.L.; formal analysis, J.W.; investigation, Y.L. and X.L.; resources, R.P.; data curation, K.D.; writing—original draft preparation, J.W.; writing—review and editing, J.W. and R.P.; visualization, J.Y. and K.D.; supervision, R.P.; project administration, Q.L.; funding acquisition, R.P. All authors have read and agreed to the published version of the manuscript.

Funding

This research was funded by “the Science and Technology Project of the Ministry of Housing and Urban-Rural Development of the People’s Republic of China, grant numbers 2021-K-137”; “the Opening Fund of State Key Laboratory of Green Building in Western China, grant number LSKF202110”; “the Hubei Province Transportation Technology Project, grant number 2020-186-3-1” and the Graduate Innovative Fund of Wuhan Institute of Technology, grant number CX2020090.

Informed Consent Statement

Not applicable.

Data Availability Statement

Not applicable.

Conflicts of Interest

The authors declare no conflict of interest.

References

  1. Capolongo, S.; Buffoli, M.; D’Alessandro, D.; Fara, G.M.; Signorelli, C. How to Foster Cities Resilient to the COVID-19 Pandemic through Urban Health Strategies. Eur. J. Public Health 2020, 30, 165–173. [Google Scholar] [CrossRef]
  2. Sharifi, A.; Khavarian-Garmsir, A.R. The COVID-19 Pandemic: Impacts on Cities and Major Lessons for Urban Planning, Design, and Management. Sci. Total Environ. 2020, 749, 142391. [Google Scholar] [CrossRef] [PubMed]
  3. McAslan, A. The Concept of Resilience: Understanding Its Origins, Meaning and Utility. Adelaide Torrens Resil. Inst. 2010, 4, 1–13. [Google Scholar]
  4. Thomas, T. On the Transverse Strength and Resilience of Timber. Philos. Mag. Ser. 1818, 51, 214–216. [Google Scholar]
  5. Fairbairn, W. Treaties on Iron Ship Building: Its History and Progress; Longmans, Green: London, UK; Spottiswooe and CO.: London, UK, 1865. [Google Scholar]
  6. Mallet, R. On the Physical Conditions Involved in the Construction of Artillery: With an Investigation of the Relative and Absolute Values of the Materials Principally Employed, and of Some Hitherto Unexplained Causes of the Destruction of Cannon in Service. Trans. R. Ir. Acad. 1856, 23, 141–436. [Google Scholar]
  7. Merriman, M. A Text-Book on the Mechanics of Materials, and of Beams, Columns, and Shafts; Wiley: New York, NY, USA, 1897. [Google Scholar]
  8. Gere, J.M.; Timoshenko, S.P. Mechanics of Materials; Hilda, G., Ed.; RPK Editorial Services, Inc.: New Windsor, NY, USA; Quebecor: Montreal, QC, Canada, 1997. [Google Scholar]
  9. Holling, C.S. Resilience and Stability of Ecological Systems. Annu. Rev. Ecol. Syst. 1973, 4, 1–23. [Google Scholar] [CrossRef]
  10. Tilman, D.; Downing, J.A. Biodiversity and Stability in Grasslands. Nature 1994, 367, 363–365. [Google Scholar] [CrossRef]
  11. Carl, F. Resilience: The Emergence of a Perspective for Social–Ecological Systems Analyses. Glob. Environ. Chang. 2006, 16, 253–267. [Google Scholar]
  12. Folke, C.; Carpenter, S.R.; Walker, B.; Scheffer, M.; Chapin, T.; Rockstrm, J. Resilience Thinking: Integrating Resilience, Adaptability and Transformability. Ecol. Soc. 2010, 15, 299–305. [Google Scholar] [CrossRef]
  13. Fernandes, V.A.; Rothfuss, R.; Hochschild, V.; Silva, W.; Peixoto, M.; Santos, S.; Souza, C. Pitombo Resiliência Da Mobilidade Urbana: Uma Proposta Conceitual e de Sistema Zao. Transportes 2017, 25, 112–121. [Google Scholar] [CrossRef]
  14. Chen, C.K.; He, F.; Zhao, D.Y.; Xie, M.F. Urban Public Transport System Resilience Evaluation Based on a System Function Curve. J. Tsinghua Univ. Technol. 2022, 62, 1016–1022. [Google Scholar]
  15. Saunders, M.J.; Kuhnimhof, T.; Chlond, B.; Silva, A. Incorporating Transport Energy into Urban Planning. Transp. Res. Part A Policy Pract. 2008, 42, 874–882. [Google Scholar] [CrossRef]
  16. Newman, P.; Kenworthy, J. “Peak Car Use”: Understanding the Demise of Automobile Dependence. World Transp. Policy Pract. 2011, 17, 31–42. [Google Scholar]
  17. Saunders, M.J.; Silva, A.N.R.D. Reducing Urban Transport Energy Dependence: A New Urban Development Framework and GIS-Based Tool. Int. J. Sustain. Transp. 2009, 3, 71–87. [Google Scholar] [CrossRef]
  18. Koetse, M.J.; Rietveld, P. The Impact of Climate Change and Weather on Transport: An Overview of Empirical Findings. Transp. Res. Part D Transp. Environ. 2009, 14, 205–221. [Google Scholar] [CrossRef]
  19. Yang, L.X.; Hu, K.Y. China’s Smart Elderly Care Policy Based on Content Analysis. J. Shanghai Univ. Sci. Ed. 2021, 38, 10. [Google Scholar]
  20. Chan, R.; Schofer, J.L. Measuring Transportation System Resilience: Response of Rail Transit to Weather Disruptions. Nat. Hazards Rev. 2016, 17, 5015004. [Google Scholar] [CrossRef]
  21. Seddighi, H. COVID-19 as a Natural Disaster: Focusing on Exposure and Vulnerability for Response. Disaster Med. Public Health Prep. 2020, 14, e42–e43. [Google Scholar] [CrossRef]
  22. Li, X.; Zhou, L.; Jia, T.; Peng, R.; Zou, Y. Associating the COVID-19 Severity with Urban Factors: A Case Study of Wuhan. Int. J. Environ. Res. Public Health 2020, 17, 6712. [Google Scholar] [CrossRef]
  23. Liu, F.Y.; Peng, R.; Huang, J.W.; Peng, Y.L. Discussion on Planning Issues Related to Urban Response to the Emergent Events of Public Health: A Case Study of Wuhan. Planners 2020, 36, 6. [Google Scholar]
  24. Peng, R.; Wang, J.Z.; Liu, Y.H.; Liu, X.L. A Study of the Influence of Typical Urban Transportation Factors on the Spread of COVID-19 in Wuhan. South Archit. 2022, 4, 78–87. [Google Scholar]
  25. Murano, Y.; Ueno, R.; Shi, S.; Kawashima, T.; Yoneoka, D. Impact of Domestic Travel Restrictions on Transmission of COVID-19 Infection Using Public Transportation Network Approach. Sci. Rep. 2021, 11, 3109. [Google Scholar] [CrossRef]
  26. Arellana, J.; Márquez, L.; Cantillo, V. COVID-19 Outbreak in Colombia: An Analysis of Its Impacts on Transport Systems. J. Adv. Transp. 2020, 2020, 8867316. [Google Scholar] [CrossRef]
  27. Serdar, M.Z.; Ko, M.; Al-Ghamdi, S.G. Urban Transportation Networks Resilience: Indicators, Disturbances, and Assessment Methods. Sustain. Cities Soc. 2022, 76, 103452. [Google Scholar] [CrossRef]
  28. The Rockefeller Foundation. City Resilience Index; Arup: London, UK, 2013; pp. 1–45. [Google Scholar]
  29. Caprì, S.; Ignaccolo, M.; Inturri, G.; Pira, M.L. Green Walking Networks for Climate Change Adaptation. Transp. Res. Part D Transp. Environ. 2016, 45, 84–95. [Google Scholar] [CrossRef]
  30. Stamos, I.; Mitsakis, E.; Salanova, J.M.; Aifadopoulou, G. Impact Assessment of Extreme Weather Events on Transport Networks: A Data-Driven Approach. Transp. Res. Part D 2015, 34, 168–178. [Google Scholar] [CrossRef]
  31. Krumdieck, S.; Page, S.; Dantas, A. Urban Form and Long-Term Fuel Supply Decline: A Method to Investigate the Peak Oil Risks to Essential Activities. Transp. Res. Part A Policy Pract. 2010, 44, 306–322. [Google Scholar] [CrossRef]
  32. Wang, S.W.; Sun, L.S.; Rong, J.; Yang, Z.F. Transit Traffic Analysis Zone Delineating Method Based on Thiessen Polygon. Sustainability 2014, 6, 1821–1832. [Google Scholar] [CrossRef]
  33. Rastogi, R. Promotion of Non-Motorized Modes as a Sustainable Transportation Option: Policy and Planning Issues. Curr. Sci. 2011, 100, 1340–1348. [Google Scholar]
  34. Martins, M.C.D.M.; Rodrigues da Silva, A.N.; Pinto, N. An Indicator-Based Methodology for Assessing Resilience in Urban Mobility. Transp. Res. Part D Transp. Environ. 2019, 77, 352–363. [Google Scholar] [CrossRef]
  35. Li, S.G.; Zhou, Q.H. Dynamic Combined-Mode Traffic Network Model Considering Transfer Behaviors. J. Adv. Transp. 2020, 2020, 2010875. [Google Scholar] [CrossRef]
  36. Fuller, D.; Gauvin, L.; Yan, K. The Potential Modal Shift and Health Benefits of Implementing a Public Bicycle Share Program in Montreal, Canada. Int. J. Behav. Nutr. Phys. Act. 2013, 10, 66. [Google Scholar] [CrossRef] [PubMed]
  37. Liu, X.; Gao, L.; Ni, A.; Ye, N. Understanding Better the Influential Factors of Commuters’ Multi-Day Travel Behavior: Evidence from Shanghai, China. Sustainability 2020, 12, 376. [Google Scholar] [CrossRef] [Green Version]
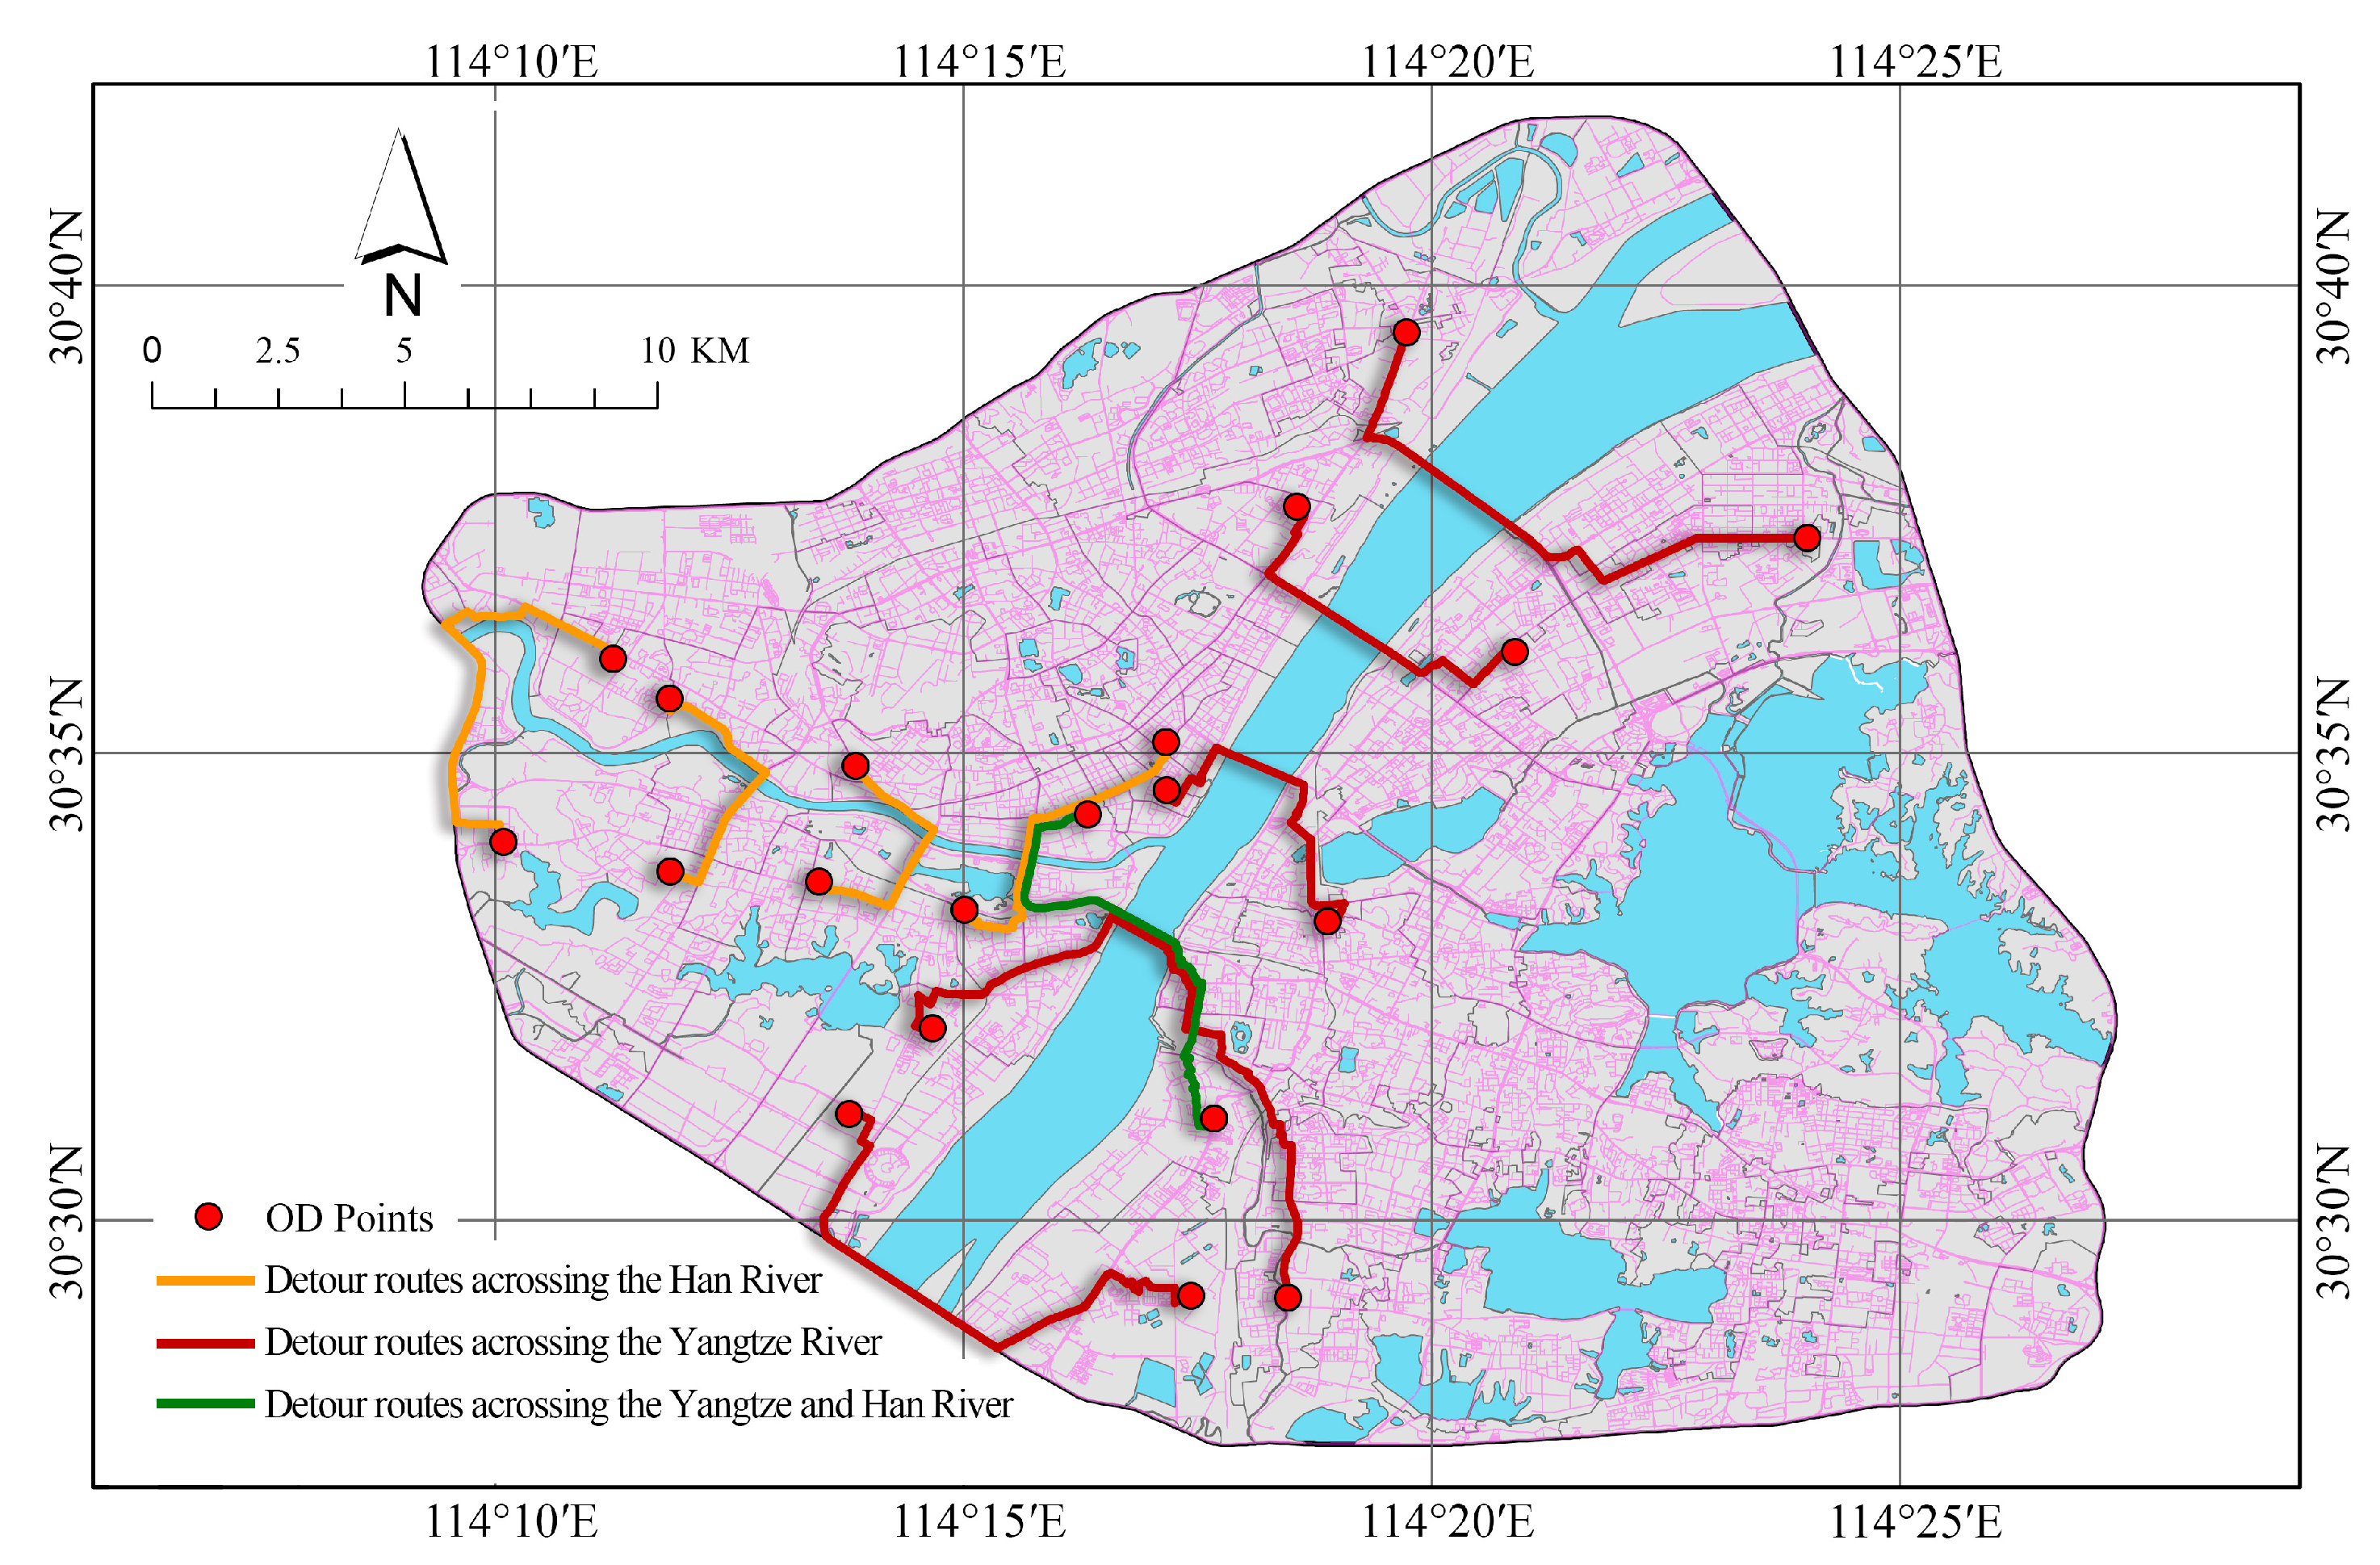
  38. Ran, P.; Liu, F.Y.; Huang, Y.C.; Duan, D. Study on the Impact of Rivers on Urban Transportation: A Case Study of Chinas’ Typical Riverside Cities. Mod. Urban Res. 2022, 4, 122–130. [Google Scholar]
Figure 1. Distribution of TAZs in the central city of Wuhan.
Sustainability 14 10957 g001
Figure 2. Distribution of daily OD travel distances for respondents in Wuhan.
Sustainability 14 10957 g002
Figure 3. Schematic representation of the shortest path distance calculation for TAZs.
Sustainability 14 10957 g003
Figure 4. Schematic representation of the four modes of travel according to MWD characteristics.
Sustainability 14 10957 g004
Figure 5. The three transportation restrictions corresponding to the three levels of resilience.
Sustainability 14 10957 g005
Figure 6. Curve of change in citywide integrated transportation resilience levels for different RMWD values. (a) is the curve of the actual result; (b) is the fitted curve.
Sustainability 14 10957 g006
Figure 7. Distribution of residential travel mode share by TAZs. (a). RMWD = 2.5 km; (b). RMWD = 11 km; (c). RMWD = 23 km.
Sustainability 14 10957 g007
Figure 8. Illustration of a typical cross-river bypass OD in Wuhan.
Sustainability 14 10957 g008
Figure 9. Plot of average monthly income of residents versus distance travelled. (a) is the result in scenario 6; (b) is the result in scenario 85; (c) is the result in scenario 205.
Sustainability 14 10957 g009
Figure 10. Flowchart of the use of the transport resilience assessment method.
Sustainability 14 10957 g010
Table 1. Classification of transportation travel distances.
Range of DistancesClassification
d WMWD Fully non-motorized mode: shorter distances, suitable for trips completed on foot or by bike.
WMWD < d RMWD Cycling mode: longer distances, not suitable for walking, but suitable for riding to completion.
d > RMWD Motorized mode: long distances, trips can only be completed by motorized vehicle.
Table 2. Relevant cases of different restricted measures.
Type of RestrictionRegionTiming of the MeasuresMeasures of Restriction
Restrictions on metro travelBeijing, China22 April 2022Some metro stations were closed and the government encouraged residents to travel by car
Restrictions on public transportationSpain21 October 2020A six-week stay-at-home order was reopened to deal with the backlash by reducing the number of public transports runs and restricting non-essential outings
total motorized transportation travel restrictionsWuhu, Anhui Province, China17 April 2022All vehicles and personnel were suspended from travel except for emergency vehicles
total motorized transportation travel restrictionsYanshan County, Jiangxi Province, China30 October 2021All roads were continuously illuminated in red following an outbreak
Restrictions on travel for all personsCalifornia, USA7 December 2020The nation’s strictest home restrictions had been imposed, during which residents were not allowed to go outside except for essential activities
Restrictions on travel for all personsShanghai, ChinaMarch–May 2022All non-emergency travel was restricted
Restrictions on travel for all personsWuhan, ChinaJanuary–March 2020All non-emergency travel was restricted
Table 3. Scenarios for the citywide integrated transportation resilience assessment in Wuhan.
RMWD (km)WMWD (km)
00.51.01.52.02.53.03.54.0
01
0.5 2
1.0 3
1.5 4
2.0 5
2.5 67
3.0 8910
3.5 11121314
4.0 1516171819
4.5 2021222324
⋯⋯
49.5 470471472473474
50.0 475476477478479
Note: 1. The numbers 1–479 in the table correspond to each of the 479 hypothetical scenario serial numbers, which are matched to the scenarios in Table 4. 2. The assumed precondition is WMWD ≤ RMWD. when walking distance ≥ 2 km, put each RMWD corresponding to each of the five WMWDs from 2 km–4 km, and the increment of both RMWD and WMWD was 500 m.
Table 4. Citywide integrated transportation resilience levels for each scenario in Wuhan.
ScenarioMWD (km)Integrated Transportation Resilience Levels
WMWDRMWDFirst-Level ResilienceSecond-Level ResilienceThird-Level Resilience
10.00.065.65%56.42%36.58%
20.50.565.65%56.42%36.58%
31.01.065.65%56.42%36.64%
⋯⋯
4302.045.5100.00%99.41%98.61%
⋯⋯
4544.047.5100.00%99.94%99.94%
4552.048.0100.00%100.00%99.94%
⋯⋯
4783.550.0100.00%100.00%99.98%
4794.050.0100.00%100.00%100.00%
Table 5. Fitting results of the “S-shaped” curve.
First-Level ResilienceSecond-Level ResilienceThird-Level Resilience
A 1 0.61736 ± 0.001540.5082 ± 0.002030.36234 ± 0.00255
A 2 1.01172 ± 8.2639E−4 1.01489 ± 0.001041.02027 ± 0.00132
x 0 11.53613 ± 0.0659110.93474 ± 0.0647710.95639 ± 0.063
p 2.2406 ± 0.026072.19466 ± 0.025612.17033 ± 0.02444
R 2 (COD)0.998860.998830.99891
Adjusted   R 2 0.998830.99880.99889
Publisher’s Note: MDPI stays neutral with regard to jurisdictional claims in published maps and institutional affiliations.

