
Risk Control in Optimization of Cascade Hydropower: Considering Water Abandonment Risk Probability

Abstract
:1. Introduction
2. Methodology
2.1. Description of WARP
2.2. TEM of WARP Based on Runoff Forecasting Error
2.2.1. WARP of the Head Hydropower Station
2.2.2. WARP of the Downstream Hydropower Station
- (1)
- The expected release of each cascade reservoir
- (2)
- WARP calculation based on the expected release of the upstream reservoir
2.3. Cascade Hydropower Optimal Operation Model under WARP
2.3.1. Objective Function
2.3.2. Constraints
- (1)
- General constraints
- (2)
- WARP water level constraints
2.3.3. Solution
2.4. Entire Solution Process
3. Case Study
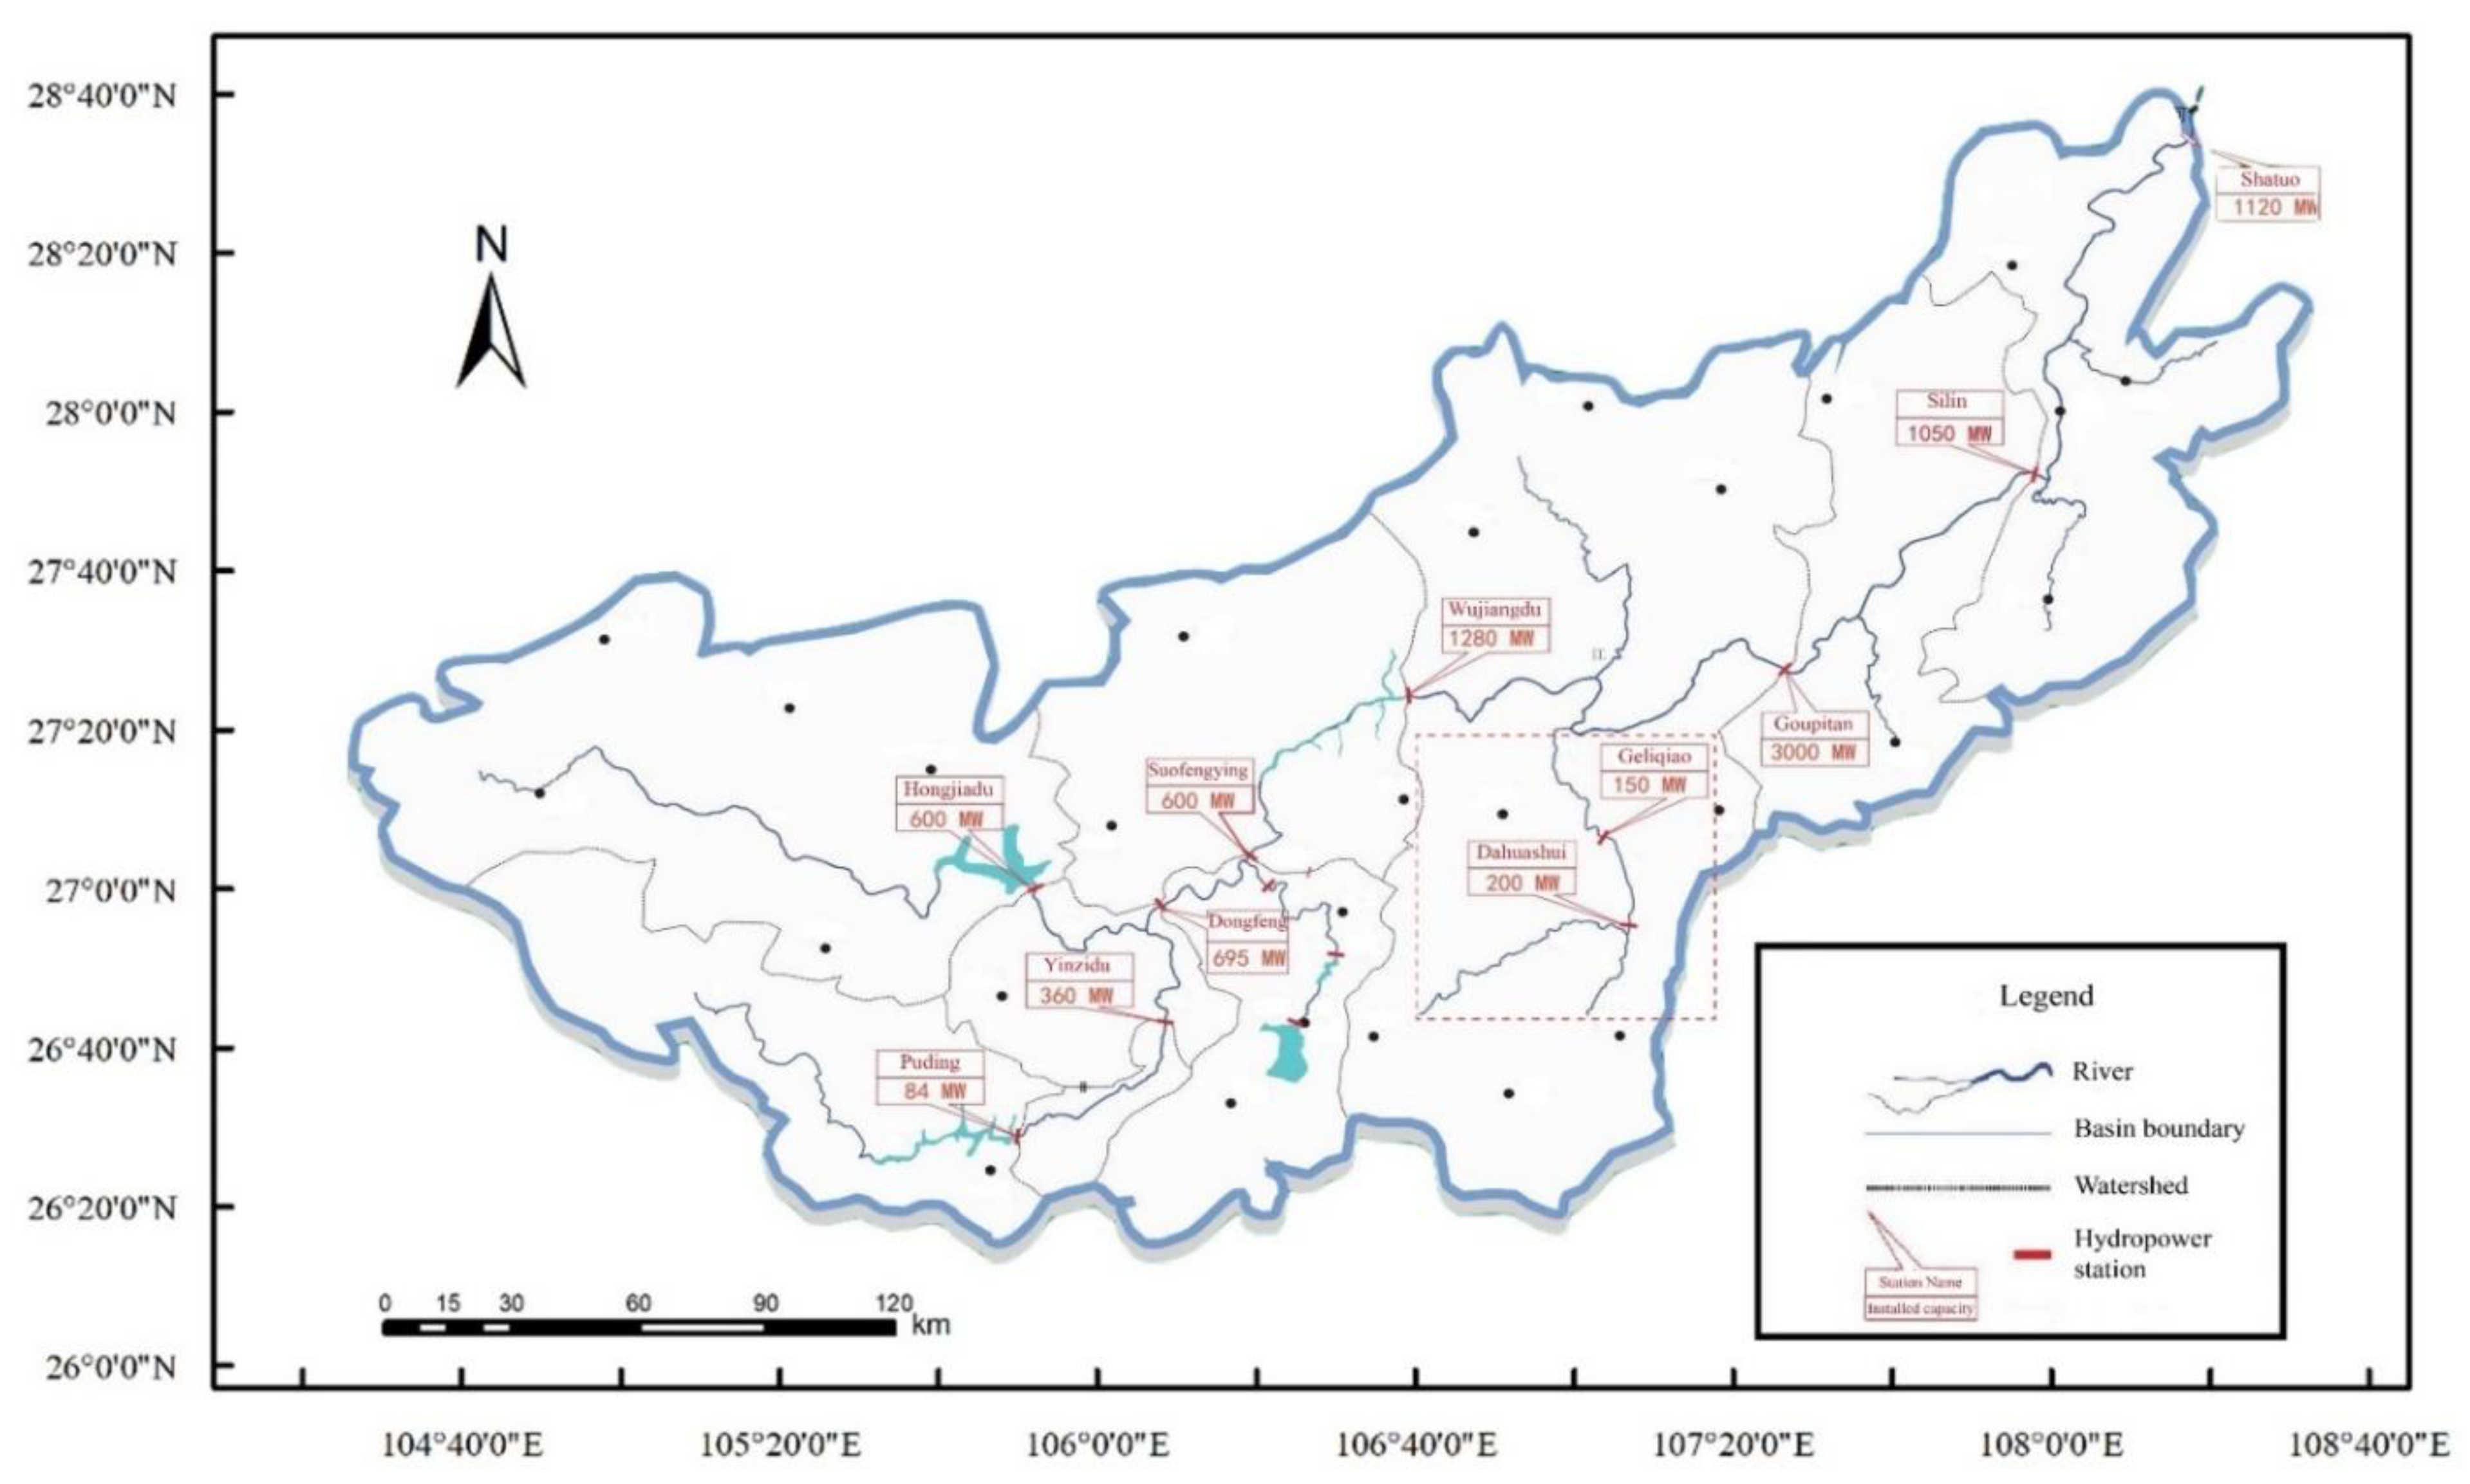
3.1. Study Area and Data
3.2. Results and Discussion
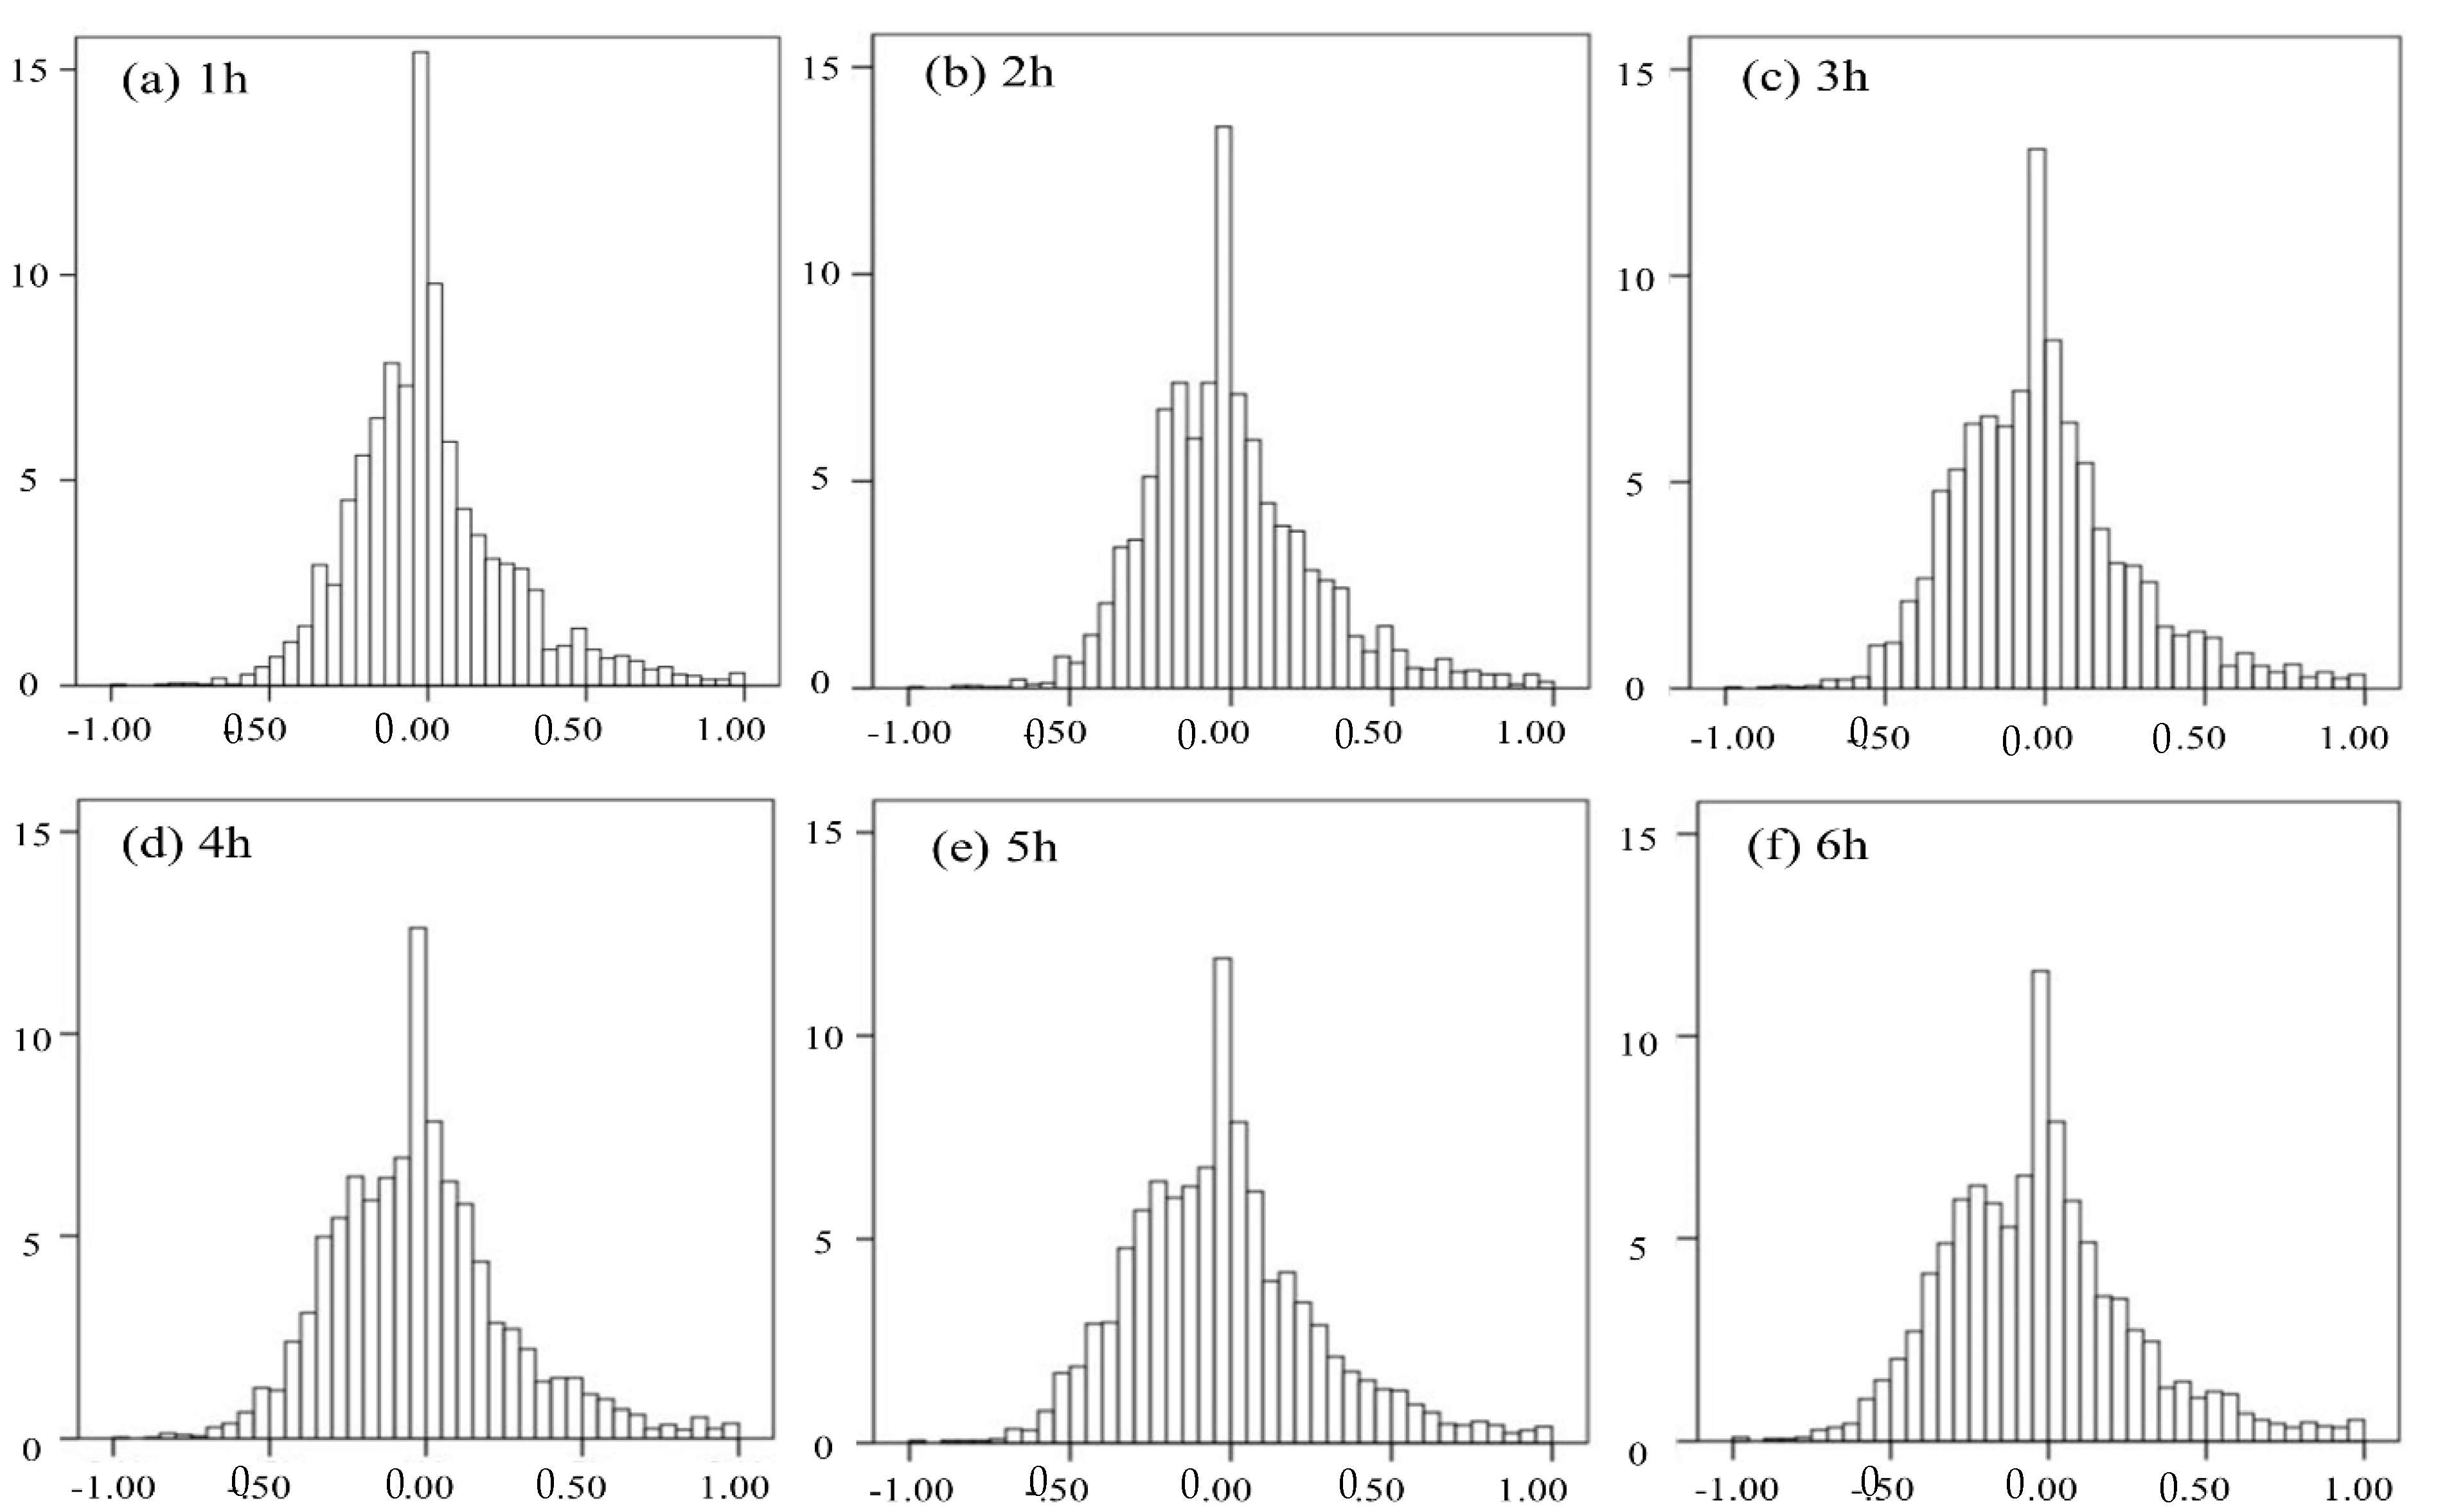
3.2.1. The Probability Distribution of Runoff Forecast Errors
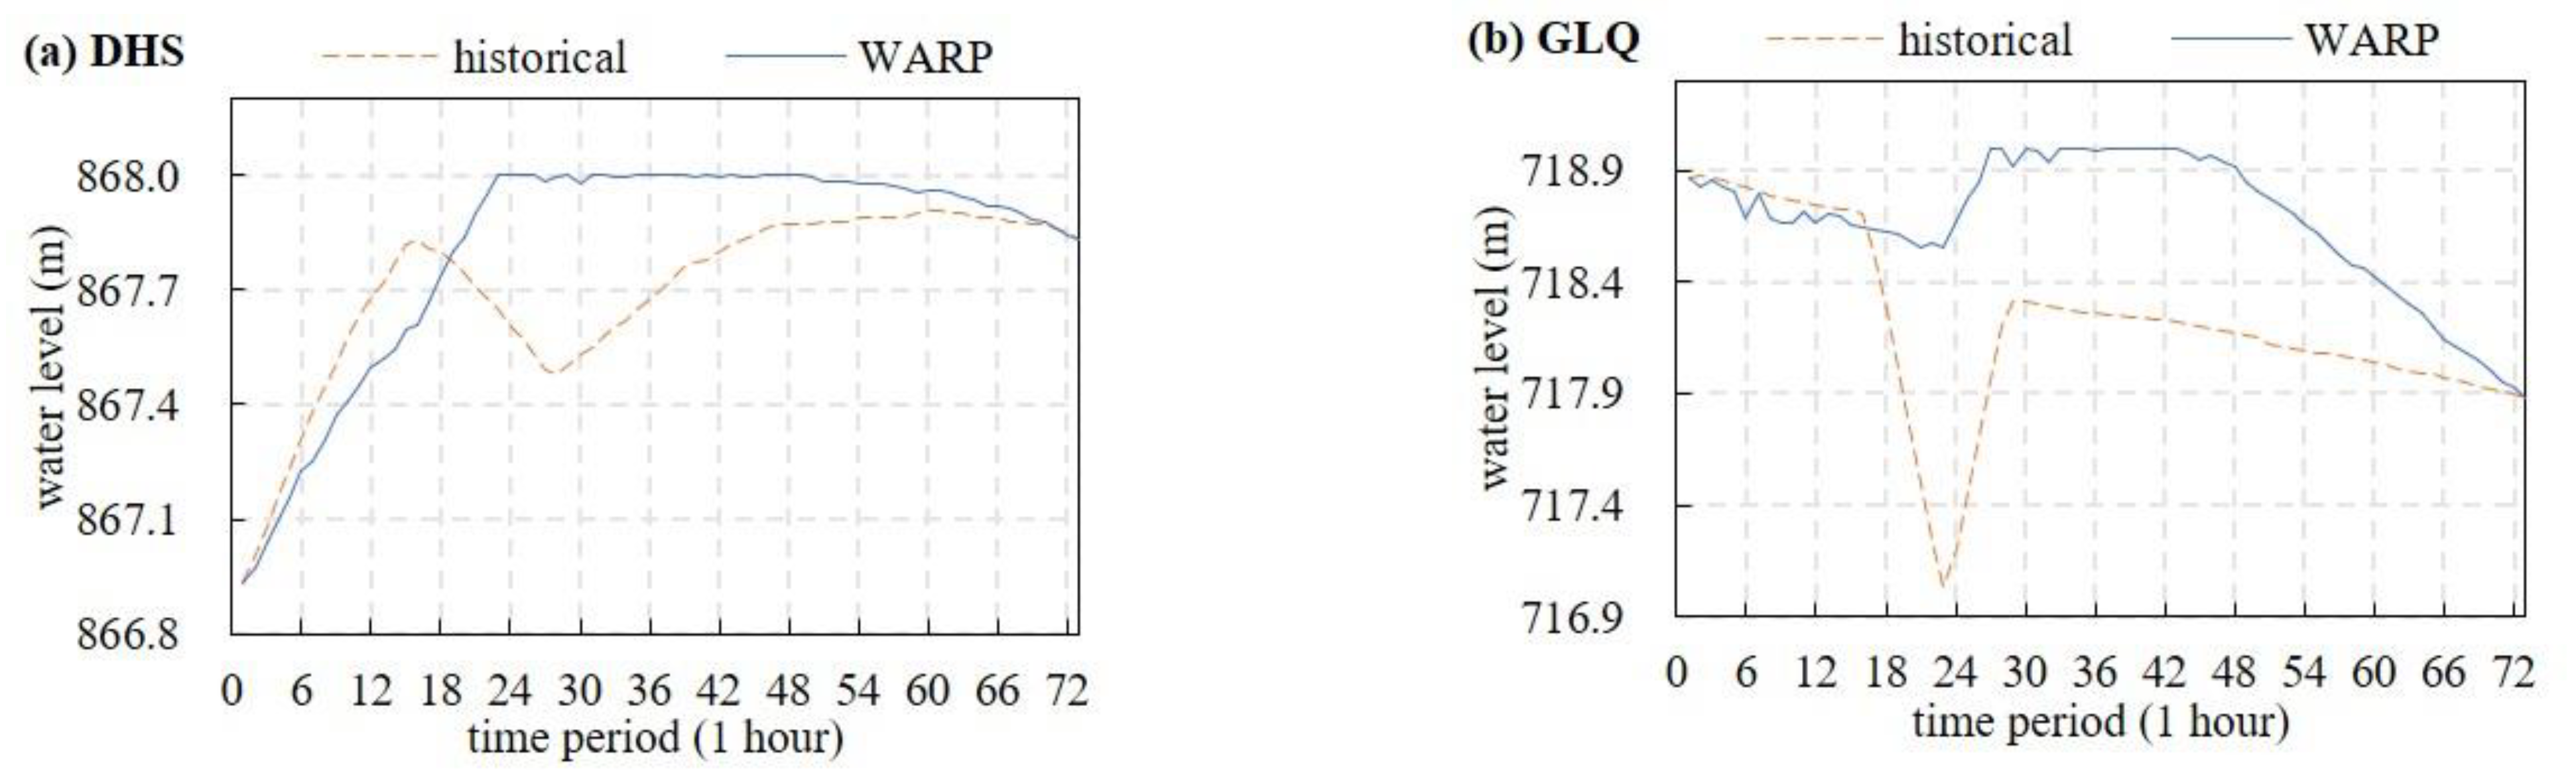
3.2.2. Hydropower Optimal Operation Strategy
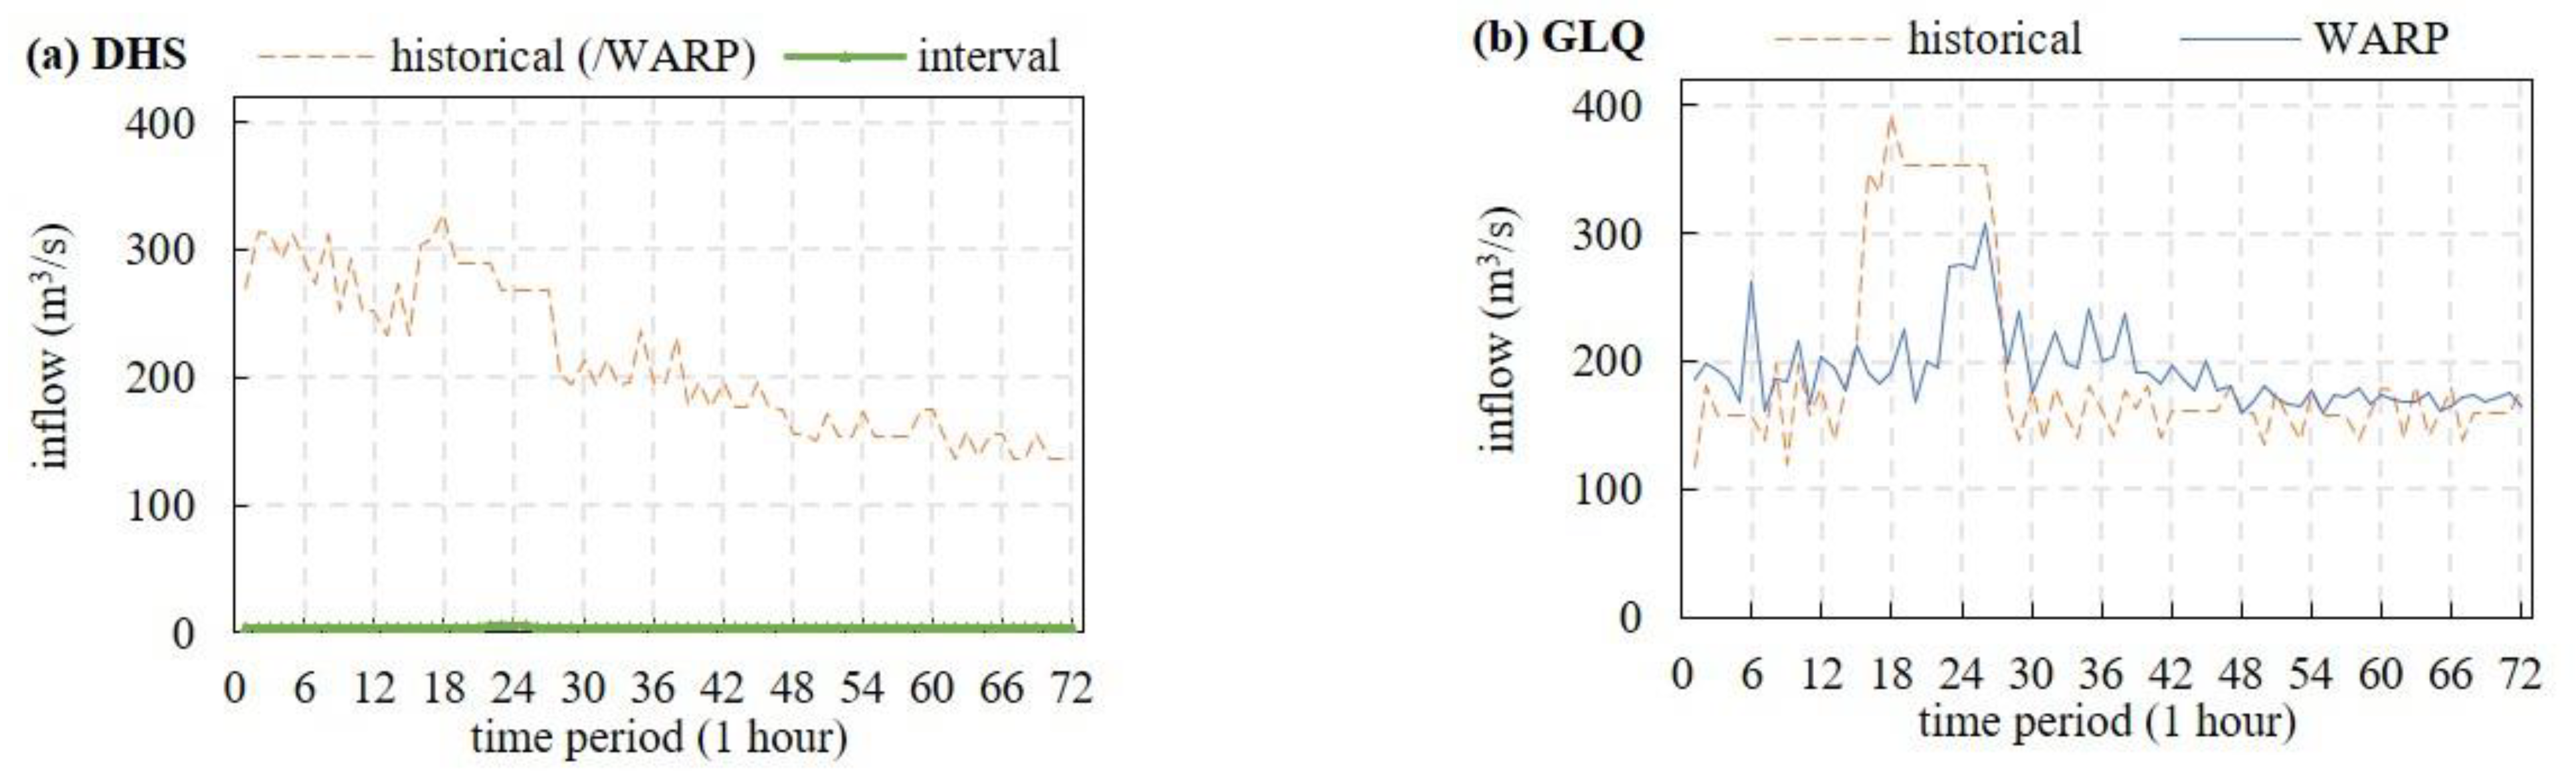
3.2.3. Water Abandonment
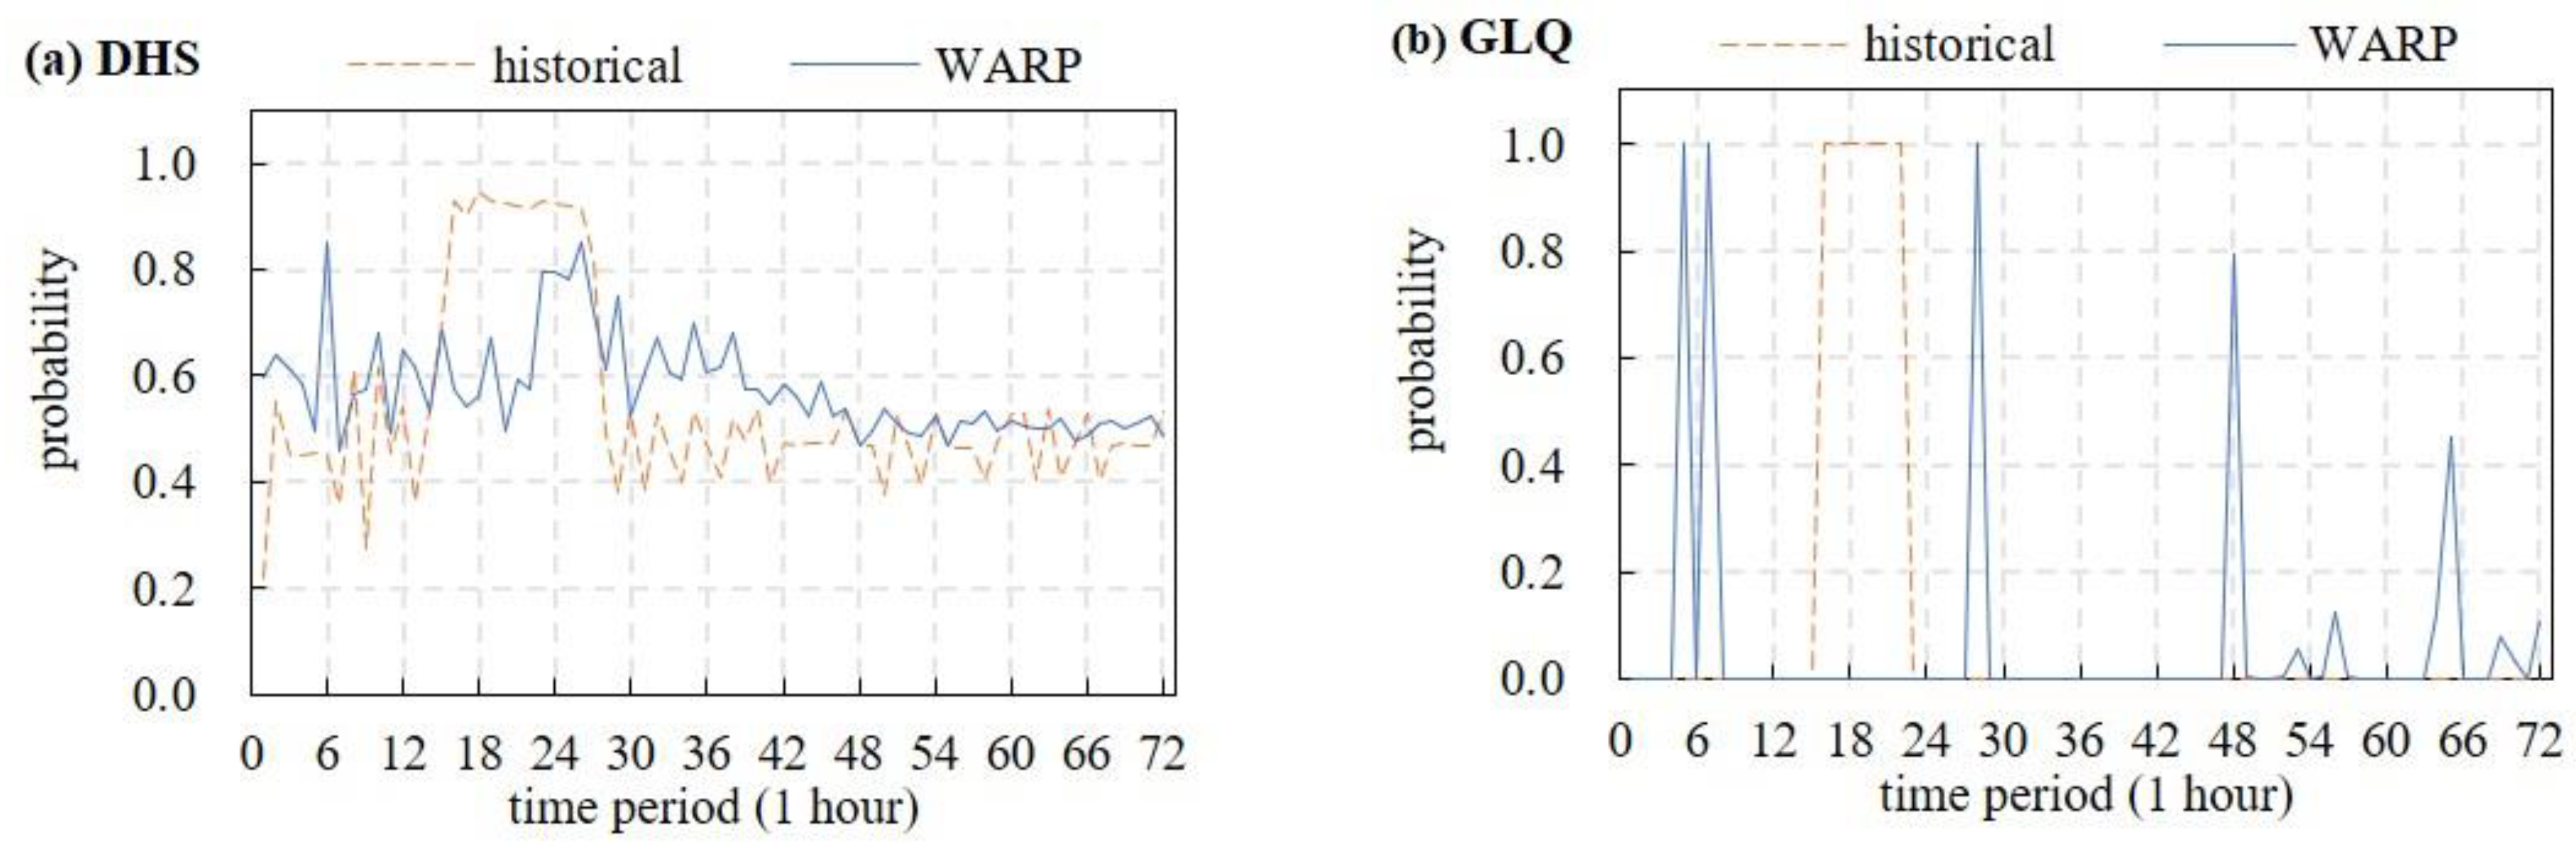
3.2.4. WARP
3.2.5. Efficient Utilization of Medium and Small Flood Resources
4. Conclusions
- (1)
- The optimal scheme ensures an invariable water level at the beginning and end of the operation period, while the water level is higher than the historical scheme during most of the operation period due to the addition of WARP water level constraints (water climbing constraints for a certain period);
- (2)
- Water abandonment, especially in the downstream hydropower stations with small reservoir capacity caused by runoff uncertainties and forecast errors, can be flexibly alleviated and controlled to efficiently utilize flood resources. In the case study, compared with the historical scheme, the total amount of water abandonment in DHS, GLQ and DHS-GLQ decreases by 11.69%, 47.69% and 28.27%, respectively;
- (3)
- Adopting the appropriate WARP water level constraints can effectively guide the head hydropower station with a large reservoir capacity to function as a flood storage at the early stage to stagger the downstream flood peak. In the case study, the flood peak in the GLQ optimal scheme is reduced by 21.6% compared with that in the historical scheme;
- (4)
- The output may be reduced appropriately to meet the requirement to increase the water level at the early stage but improved with greater head efficiency at the later stage, and thereby the system generation profits of the whole operation period can be improved.
Author Contributions
Funding
Institutional Review Board Statement
Informed Consent Statement
Data Availability Statement
Conflicts of Interest
References
- Ren, D. Outlook for renewable energy development of 13th Five Year Plan. Sci. Technol. Rev. 2016, 34, 133–138. [Google Scholar]
- China Renewable Energy Engineering Institute. China Renewable Energy Development Report; China Renewable Energy Engineering Institute: Beijing, China, 2021. [Google Scholar]
- Hall, W.A.; Butcher, W.S.; Esogbue, A. Optimization of the operation of a multiple-purpose reservoir by dynamic programming. Water Resour. Res. 1968, 4, 471–477. [Google Scholar] [CrossRef]
- Keckler, W.G.; Larson, R.E. Dynamic programming applications to water resource system operation and planning. J. Math. Anal. Appl. 1968, 24, 80–109. [Google Scholar] [CrossRef]
- Mizyed, N.R.; Loftis, J.C.; Fontane, D.G. Operation of large multireservoir systems using optimal-control theory. J. Water Resour. Plan. Manag. 1992, 118, 371–387. [Google Scholar] [CrossRef]
- Russell, S.O.; Campbell, P.F. Reservoir operating rules with fuzzy programming. J. Water Resour. Plan. Manag. 1996, 122, 165–170. [Google Scholar] [CrossRef]
- Alcamo, J.; Flörke, M.; Märker, M. Future long-term changes in global water resources driven by socio-economic and climatic changes. Hydrol. Sci. J. 2007, 52, 247–275. [Google Scholar] [CrossRef]
- Simonovic, S.P.; Burn, D.H. An improved methodology for short-term operation of a single multipurpose reservoir. Water Resour. Res. 1989, 25, 1–8. [Google Scholar] [CrossRef]
- Xie, M.; Zhou, J.; Li, C.; Zhu, S. Long-term generation scheduling of Xiluodu and Xiangjiaba cascade hydro plants considering monthly streamflow forecasting error. Energy Convers. Manag. 2015, 105, 368–376. [Google Scholar] [CrossRef]
- Zhao, T.; Yang, D.; Cai, X.; Zhao, J.; Wang, H. Identifying effective forecast horizon for real-time reservoir operation under a limited inflow forecast. Water Resour. Res. 2012, 48, 1–15. [Google Scholar] [CrossRef]
- Tan, Q.; Fang, G.; Wen, X.; Lei, X.; Wang, X.; Wang, C.; Ji, Y. Bayesian stochastic dynamic programming for hydropower generation operation based on copula functions. Water Resour. Manag. 2020, 34, 1589–1607. [Google Scholar] [CrossRef]
- Yuan, L.; Zhou, J. Self-optimization system dynamics simulation of real-time short term cascade hydropower system considering uncertainties. Water Resour. Manag. 2017, 31, 2127–2140. [Google Scholar] [CrossRef]
- Schultz, G.A.; Plate, E.J. Developing optimal operating rules for flood protection reservoirs. J. Hydrol. 1976, 28, 245–264. [Google Scholar] [CrossRef]
- Sigvaldson, O. A simulation model for operating a multipurpose multireservoir system. Water Resour. Res. 1976, 12, 263–278. [Google Scholar] [CrossRef]
- Karamouz, M.; Vasiliadis, H.V. Bayesian stochastic optimization of reservoir operation using uncertain forecasts. Water Resour. Res. 1992, 28, 1221–1232. [Google Scholar] [CrossRef]
- Ahmed, I. On the Determination of Multi-Reservoir Operating Policy under Uncertainty. Ph.D. Thesis, The University of Arizona, Tucson, AZ, USA, 2001. [Google Scholar]
- Yamout, G.M.; Hatfield, K.; Romeijn, H.E. Comparison of new conditional value-at-risk-based management models for optimal allocation of uncertain water supplies. Water Resour. Res. 2007, 43, 1–13. [Google Scholar] [CrossRef]
- You, J.; Cai, X. Hedging rule for reservoir operations: 1. A theoretical analysis. Water Resour. Res. 2008, 44, 1–9. [Google Scholar] [CrossRef]
- You, J.; Cai, X. Hedging rule for reservoir operations: 2. A numerical model. Water Resour. Res. 2008, 44, 1–11. [Google Scholar] [CrossRef]
- Piantadosi, J.; Metcalfe, A.; Howlett, P. Stochastic dynamic programming (SDP) with a conditional value-at-risk (CVaR) criterion for management of storm-water. J. Hydrol. 2008, 348, 320–329. [Google Scholar] [CrossRef]
- Xu, W.; Zhang, C.; Peng, Y.; Fu, G.; Zhou, H. A two stage Bayesian stochastic optimization model for cascaded hydropower systems considering varying uncertainty of flow forecasts. Water Resour. Res. 2014, 50, 9267–9286. [Google Scholar] [CrossRef]
- Datta, B.; Houck, M.H. A stochastic optimization model for real-time operation of reservoirs using uncertain forecasts. Water Resour. Res. 1984, 20, 1039–1046. [Google Scholar] [CrossRef]
- Ji, C.; Li, R.; Tian, K.; Zhang, Y.; Li, C. A coupling model of load adjustment for cascade hydropower stations based on inflow uncertainty: A case study of Jinping-guandi cascade hydropower stations. J. Hydraul. Eng. 2017, 48, 1–12. [Google Scholar]
- Wen, Q.; Xue, N. Study on the spill electricity price of central china power net. Autom. Electr. Power Syst. 2001, 25, 48–51. [Google Scholar]
- Shuai, W. The problems and countermeasures about abandoned water in China southwest hydropower station. Electr. Power 2017, 50, 171–175. [Google Scholar]
- Tan, Q.; Wen, X.; Sun, Y.; Lei, X.; Wang, Z.; Qin, G. Evaluation of the risk and benefit of the complementary operation of the large wind-photovoltaic-hydropower system considering forecast uncertainty. Appl. Energy 2021, 285, 116442. [Google Scholar] [CrossRef]
- Windsor, J.S. Optimization model for the operation of flood control systems. Water Resour. Res. 1973, 9, 1219–1226. [Google Scholar] [CrossRef]
- Wu, Z.; Hu, C.; Wang, B.; Liu, H. Risk analysis on limited water level of reservoirs in flood season and flood control system in midstream and downstream of Yellow River. J. Hydraul Eng. 2006, 37, 641–648. [Google Scholar]
- Xiao, Y. Research on optimal scheduling based on abandoned water probability. Express Water Resour. Hydropower 2015, 36, 22–24. [Google Scholar]
- Zhang, C. Research on Risk Analysis and Control method of Spillage for Cascade Reservoirs in Wujiang River Basin. Master’s Thesis, Dalian University of Technology, Dalian, China, 2019. [Google Scholar]
- Sun, X.; Dong, S.; Xu, X. The Minimum Abandoned Water Optimization Model of Reservoir and Its Application. In Proceedings of the 2009 Fifth International Conference on Natural Computation, Tianjin, China, 14–16 August 2009; pp. 131–135. [Google Scholar]
- He, Y. Research on the cascade reservoirs surplus water risk control methods for frequent flood. China Rural. Water Hydropower 2019, 9, 162–170, 180. [Google Scholar]
- Yang, X.S. Cuckoo search and firefly algorithm: Overview and analysis. In Cuckoo Search and Firefly Algorithm; Springer: Berlin/Heidelberg, Germany, 2014; pp. 1–26. [Google Scholar]


| Name | DHS | GLQ | Location Diagram of the Two Reservoirs |
|---|---|---|---|
| Watershed flow concentration area (km2) | 4328 | 4735 | 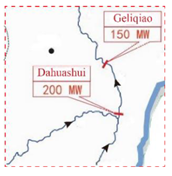 |
| Annual average runoff (m3/s) | 75 | 82 | |
| Reservoir regulation capacity | incomplete annual | daily | |
| Unit maximum overflow (m3/s) | 165 | 202.6 | |
| Normal water level (m) | 868.00 | 719.00 | |
| Flood control level (m) | 868.00 | 719.00 | |
| Dead water level (m) | 845.00 | 709.00 | |
| Installed capacity (MW) | 2 × 100 | 2 × 75 |
Publisher’s Note: MDPI stays neutral with regard to jurisdictional claims in published maps and institutional affiliations. |
© 2022 by the authors. Licensee MDPI, Basel, Switzerland. This article is an open access article distributed under the terms and conditions of the Creative Commons Attribution (CC BY) license (https://creativecommons.org/licenses/by/4.0/).
Share and Cite
Zhang, X.; Fang, G.; Ye, J.; Liu, J.; Wen, X.; Wu, C. Risk Control in Optimization of Cascade Hydropower: Considering Water Abandonment Risk Probability. Sustainability 2022, 14, 10911. https://doi.org/10.3390/su141710911
Zhang X, Fang G, Ye J, Liu J, Wen X, Wu C. Risk Control in Optimization of Cascade Hydropower: Considering Water Abandonment Risk Probability. Sustainability. 2022; 14(17):10911. https://doi.org/10.3390/su141710911
Chicago/Turabian StyleZhang, Xinyi, Guohua Fang, Jian Ye, Jin Liu, Xin Wen, and Chengjun Wu. 2022. "Risk Control in Optimization of Cascade Hydropower: Considering Water Abandonment Risk Probability" Sustainability 14, no. 17: 10911. https://doi.org/10.3390/su141710911
APA StyleZhang, X., Fang, G., Ye, J., Liu, J., Wen, X., & Wu, C. (2022). Risk Control in Optimization of Cascade Hydropower: Considering Water Abandonment Risk Probability. Sustainability, 14(17), 10911. https://doi.org/10.3390/su141710911