Article

Exploring the Role of Heterogeneous Environmental Regulations in Industrial Agglomeration: A Fresh Evidence from China

1
Business School, Nanjing Xiaozhuang University, Nanjing 211171, China
2
School of Economics and Management, Nanjing University of Science and Technology, Nanjing 210094, China
3
National Demonstration Center for Experimental Economics and Management Education, Guangxi University of Finance and Economics, Nanning 530007, China
*
Author to whom correspondence should be addressed.
Sustainability 2022, 14(17), 10902; https://doi.org/10.3390/su141710902
Submission received: 20 July 2022 / Revised: 23 August 2022 / Accepted: 28 August 2022 / Published: 31 August 2022
(This article belongs to the Special Issue Economic Growth and the Environment)

Abstract

:
This paper attempts to analyze the effect of different types of environmental regulations on industrial agglomeration in China. By employing the panel data of 30 provinces in China from 2005 to 2015, this study empirically investigates the effect of the beforehand, intermediate, and afterward environmental regulations on industrial agglomeration and examines the spatial heterogeneity feature in this relationship. The results show that at the provincial level, the beforehand regulations, acting as an entry barrier for potential firms, negatively affect the level of industrial agglomeration, while the intermediate regulations significantly promote industrial agglomeration. As for the regional level, the mechanisms become more complicated and a spatial heterogeneity feature is found. The beforehand and afterward regulations generate opposite effects on regions with increasing and decreasing concentration of pollution-intensive industries, respectively, while the intermediate regulations have no significant effect on either of the two regions.

1. Introduction

How common is agglomeration? In 1994, economists stated that “even the newest industries are obeying an old rule of geographical concentration. From the start of the industrial age, the companies in a fast-growing new field have tended to cluster in a small region” [1]. So did China’s economy. Since the Reform and Opening-up policy was implemented in 1978, China has enforced an unbalanced development strategy in regional industrial development, where production factors and other resources are reallocated from regions with low-efficiency to the most effective regions, that is, from the inland areas to the southeastern coastal areas. As a result, the level of China’s industrial agglomeration has improved continuously. By 2012, more than 64.58% of the industrial enterprises were located in the southeastern coastal areas, which is much higher than the proportion of 44.39% in 1978. The rapid expansion of industrial agglomeration has significantly contributed to China’s phenomenal growth, as well as the status of the world factory over the last three decades. At present, the strategy of industrial agglomeration is still one of the important strategies for regional economic development in China [2].
However, along with the rapid expansion of the agglomeration economy, China has suffered serious environmental pollution and environmental damages. The industrial sectors have cumulatively consumed 67.9% of China’s energy and emitted 83.1% of the carbon dioxide [3]. In order to inhibit pollution and improve environmental quality, China has spared no efforts to implement a series of environmental regulations. Especially after 2006, the first year of China’s Eleventh Five-year Plan, the Chinese government has drawn great attention to environmental protection and dedicated great efforts to achieve coordinated development of the economy and environment. Consequently, the environmental regulations have been strengthened year by year, and several new instruments have been taken out of the toolbox in recent years, such as the new environmental law regarded as the strictest in China’s history enacted in 2015 and the environmental tax levied in 2018.
It is generally accepted that stricter environmental regulations will compel firms to carry out pollution control activities, which directly increases firms’ environmental costs and affects their location choice, and thereby, the industrial agglomeration in a certain region [4]. So far, despite the growing concern about the relationship between environmental regulations and the agglomeration economy, the existing literature mainly focuses on the impact of environmental regulations on the location choice of firms [5,6,7], while the literature which directly examines the effect of environmental regulations on industrial agglomeration is relatively scant. In addition, few studies explore the different impacts of the beforehand, intermediate, and afterward environmental regulations on industrial agglomeration. Moreover, most empirical research in this line focus on developed countries, especially the US and Europe [8,9,10,11] but fail to explore evidence from developing countries. Given this, this paper employs a province-level panel dataset between 2005 and 2015 to empirically investigate the mechanism of industrial agglomeration or decentralization under the constraints of environmental regulations in the case of China and attempts to compare the diverse impacts of different types of environmental regulations.
We contribute to the previous literature in several ways. First, in most previous literature [12,13,14], environmental regulations are usually divided into three types, that is, the command-and-control, market-based, and informal regulation. Unlike the existing literature, we take the stages of the production process in which the environmental regulations work into consideration and divide them into the beforehand environmental regulations (BER), which can prevent pollution before the production starts, the intermediate environmental regulations (IER), which can reduce pollution during the production process, and the afterward environmental regulations (AER), which can control pollution emissions after production [4,15]. This classification considers the policy effect from both the environmental and industrial aspects, which enables us to address a more practical research conclusion regarding the impact of environmental regulations on industrial agglomeration and facilitates a more scientific policy design tailored to local industrial development. Second, unlike previous studies that divide China into Eastern, Middle, and Western regions based on geographic location and economic development level [16], this study divides the 30 provinces of China into two regions according to the concentration of pollution-intensive industries, that is, the region with an increasing concentration of pollution-intensive industries (PIIR) and the region with a decreasing concentration of pollution-intensive industries (PIDR). This allows governments to adjust the implementation of environmental regulations more effectively according to local industrial development status. Third, unlike existing articles that apply the Herfindahl–Hirschman Index or the Location Quotient index to measure industrial agglomeration [17,18], this study, from a more micro perspective, considers the ratio of the number of newly enlarged firms to the total number of firms. This measurement directly reflects firms’ decisions (on whether to agglomerate) in response to environmental regulations, which provides fresh evidence for the spatial concentration of firms. It not only enriches the studies on the influencing factors for firms’ location preferences but also allows us to directly examine how local attractiveness may be affected by environmental regulations.
The structure of this paper is organized as follows. Section 2 provides an overview of the literature regarding the effects of environmental regulations on industrial agglomeration and constructs the theoretical framework. Section 3 builds the empirical model and introduces the variables and data source. The empirical results and discussions are presented in Section 4. The last section concludes the study by outlining the implications of the findings.

2. Literature Review and Theoretical Framework

2.1. Literature Review

The role environmental regulations played in the development of industrial agglomeration has stimulated extensive academic research and policy debates. Research on the relationship between environmental regulations and the agglomeration economy can be divided into two strands. The theoretical studies are mainly based on the theories of New Economic Geography (NEG), and the empirical research is based on the Pollution Haven Hypothesis (PHH).
In the first strand of literature, by embedding pollution standards or taxes in models of NEG, many scholars theoretically study the correlation and interaction between environmental regulations and the agglomeration economy and reveal the motive force of firms’ location and relocation choice, which provides a theoretical basis for empirical studies [19,20]. Incorporating cross-sectoral and transboundary pollution, Zeng and Zhao construct a spatial-economy model to prove that while the cost-reducing effect of environmental regulations encourages polluting firms to move to a country with lax regulations, the demand-reducing effect discourages such movements [21]. Liang et al. establish a Core–Periphery model and conclude that compared to developed regions, stringent environmental regulations are more beneficial to less developed regions as they attract more capital and industrial agglomeration [22]. Kheder and Zugravu apply an economic geography model and identify the existence of a strong Pollution Haven effect, implying that developing countries with less stringent regulations would attract more firms to move in from developed countries [23].
Another strand of the literature has examined the impact of environmental regulations on industrial agglomeration empirically based on the Pollution Haven Hypothesis (PHH), while no consensus has been reached [24]. Some scholars claim that regions with laxer environmental regulations attract more firms to locate and relocate, indicating a negative effect of environmental regulation stringency on industrial agglomeration [25,26,27,28,29]. By employing the data on 13,663 newly established FDI firms between 2000 and 2010 in China, Lin and Sun claim that environmental regulation is one of the most important factors in determining firms’ location patterns and that few FDI firms locate in provinces with more stringent environmental regulations [30]. Shen et al. evaluate the role of environmental regulations in the location and relocation patterns of pollution-intensive industries in Guangdong province of China [7]. They find that stringent environmental regulations imposed in developed Pearl River Delta areas have driven the pollution-intensive industries out and to relocate to the less developed Non-Pearl River Delta areas. Yuan et al. examine the spatial behavior of pollution-intensive firms across the Taihu Lake Watershed and demonstrate that the PHH works efficiently in the short term [28]. Using Chinese provincial-level data from 2000 to 2015, Dou and Han find that strongly mobile pollution industries tend to transfer directly to the areas with loose regulations [31].
Conversely, other scholars find evidence of a positive relationship between environmental regulations and industrial agglomeration and point out that more stringent environmental regulations encourage industrial location and promote agglomeration [32]. For instance, Wang et al. explore how environmental regulations may affect the location choices of firms with different ownerships, and the results show that private-owned, foreign-owned, and collective-owned enterprises were no more likely to agglomerate in the regions with less stringent environmental regulations during 2006 and 2008 [33]. Wang et al. study the optimal scale of manufacturing agglomeration under environmental regulations for 28 manufacturing subsectors of China [15]. Their empirical results show that more stringent environmental regulations can spur manufacturing subsectors to be more agglomerative. The study by Shao et al. indicates that the PHH does not stand in the BRICS and MINT countries [34]. Wang et al. empirically examine the impact of environmental regulation on the location choices of pollution-intensive firms [35]. Instead of supporting the Pollution Haven effect, the results consistently confirm the Porter effect at the whole country level.
Moreover, other studies also claim that the relationship between environmental regulation and the location of firms is still uncertain [36,37] or nonlinear [38]. Mani et al. imply that the costs imposed by environmental regulations are not large enough to overpower other costs of doing business in India; thus, they are not critical determinants of firms’ location choice [39]. Manderson and Kneller indicate that the pollution-intensive investments from the UK have been attracted by free-trade policies rather than lax environmental regulations [40]. The study by Wang et al. discovers a divergent effect of environmental regulations on the location choices of heterogeneous firms [35]. Similarly, Zhang et al. demonstrate that the agglomerative effects of stringent environmental regulations are quite heterogeneous across different firm ownership, scale, and geographical location [41].
Various factors could lead to such controversial results, while we mainly focus on several aspects as follows. Firstly, there are no comparative data on environmental regulations across countries [34]. As Becker and Henderson point out, “In most studies, the proxies for environmental regulations are not based on the specific regulatory process but based on congressional voting records, the existence of environmental laws, and the like” [10]. Moreover, the proxies of environmental regulations are fragmented as they have been divided into several subcategories [42], and each measurement has distinct advantages and disadvantages [9]. Secondly, there are tremendous differences in methodological or measurement features. Lankoski and Cui et al. find that the diverse modeling specifications such as econometric techniques used, omitted variable bias, sample selection, and subsample grouping, short-time or long-time period, and different measurements of dependent variables make it difficult to draw consistent conclusions for previous studies [13,43]. Finally, different geographical sizes have been adopted in previous studies. Jeppesen et al. demonstrate that the results of the location-decision studies are particularly sensitive to the size of the geographical area studied [5]. When controlling other aspects, firms would be attracted to regions with larger market sizes to obtain efficient utilization of resources and returns to scale [44]. Javeed et al. suggest that product market competition plays a significant role [45].

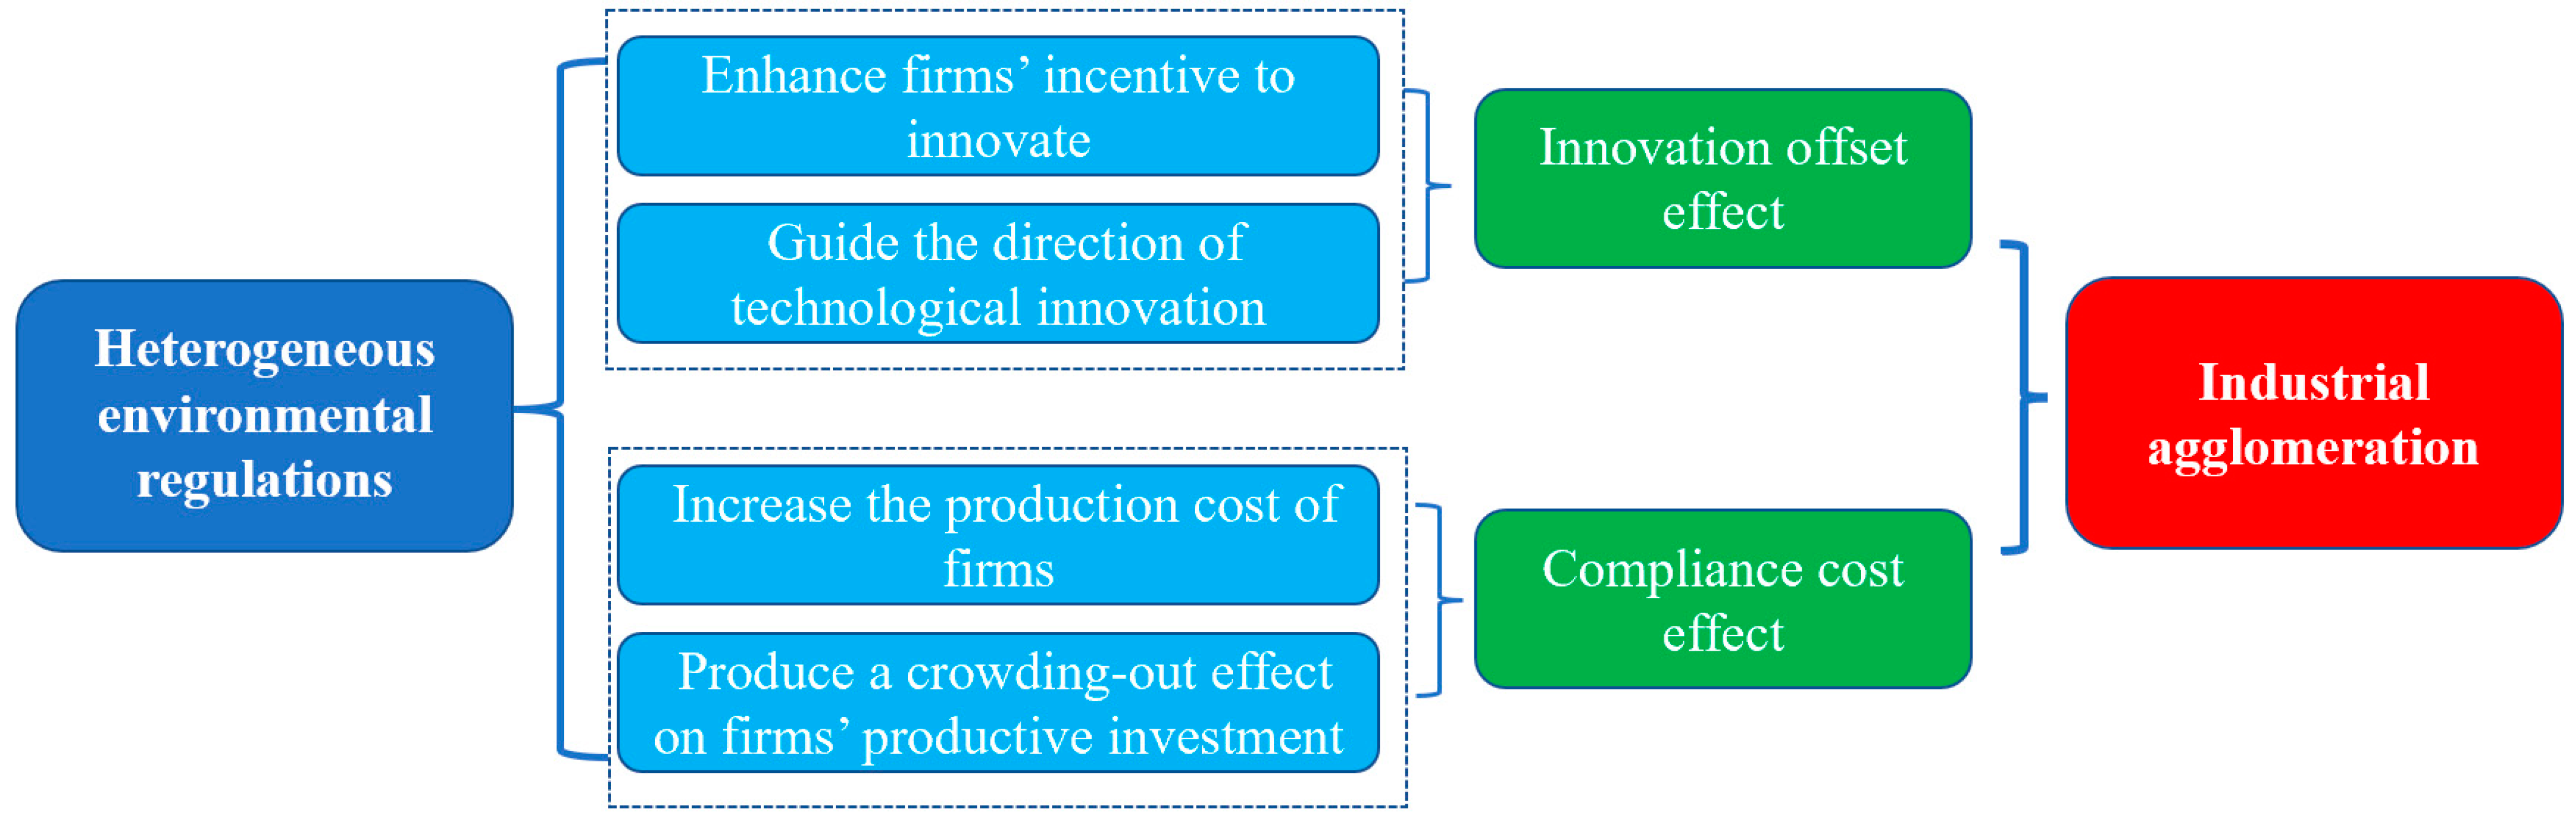
2.2. Theoretical Framework

According to the “Porter Hypothesis” [46], the impacts of environmental regulations are mainly divided into two aspects, that is, the compliance cost effect and the innovation offset effect [35,47]. Therefore, we explore the impact of heterogeneous environmental regulations on industrial agglomeration from the perspective of these two aspects.
On the one hand, many studies have identified that environmental regulations will encourage technological innovation, which makes up for the costs of pollution control. Porter and Van der Linde indicate that environmental regulations can encourage firms to conduct research activities, which will improve productivity and offset extra costs. Firstly, environmental regulations will enhance firms’ incentive to innovate [46]. When the government issues environmental regulation policies that restrict pollution emissions during production by charging fees on environmental resources, it inevitably raises production costs, which weakens companies’ market competitiveness. To maintain competitiveness, companies tend to engage in technological innovation [48]. Some companies manage the pollutants generated at the end through technological innovation in pollution control [47], such as promoting waste emission reduction, harmless waste treatment, and resourceful waste utilization. Other companies choose to reduce the level of environmental pollution through productive technological innovation [49], such as the adoption of low waste, less waste, waste-free techniques, the use of non-toxic and non-hazardous raw materials, and the development of new products or processes. The increase in the level of innovation caused by environmental regulation can significantly contribute to the improvement of production efficiency and profitability of firms while reducing the cost and speed of pollution control, which can significantly enhance the overall industrial performance and attract more companies to concentrate. Secondly, appropriate environmental regulatory tools can effectively guide the direction of technological innovation [50,51]. Many studies have found that environmental regulations can lead to biased technological progress [52,53]. If the innovation is environmentally biased, it can significantly reduce pollution. In contrast, if the innovation aims at improving efficiency, it might increase pollution by boosting production. Regions that attach greater importance to environmental protection may provide green subsidies to firms in environmental treatment, pollution emission reduction, and processing technology improvement, which can not only reduce the cost of using environmental resources but also improve the initiative of firms in R&D investment and accelerate the improvement of their technological levels.
On the other hand, some researches also demonstrate that environmental regulations will accelerate the environmental protection cost of firms, thus increasing the total cost [54,55]. Firstly, taking environmental resources as a kind of production factor, expenditures such as pollutant discharge fees, pollution permit purchase, and pollution control investment by firms can be regarded as the price paid for consuming environmental resources. Therefore, the existence of environmental regulations will substantially increase the production cost of firms. This includes the input of environmental pollution control equipment, the adjustment of the production process to meet regulatory standards, and the purchase of alternative input factors with a high price and low pollution. According to the PPH, the implementation of more stringent environmental regulations in a given area will bring a serious burden to some companies. In order to avoid the additional costs brought by environmental protection and maintain their competitive advantages in the market, firms tend to relocate their production and investment in areas with lower environmental regulations and carry out industrial relocation [56], which reduces industrial agglomeration. Secondly, environmental regulations produce a crowding-out effect on firms’ productive investment. Environmental regulations will inevitably result in additional expenditure on firms’ pollution control costs [49]. Under the premise of limited resources and certain investments, the productive investment of firms will be crowded out by environmental investment. For most firms, such environmental investment cannot directly bring in cash inflow, and the economic benefits are not obvious in the short term. This might reduce companies’ rate of return and in turn affect their location choice.
Based on the theoretical analysis, it is assumed that environmental regulations significantly affect industrial agglomeration, while the impacts of different types of regulations can be divergent. The mechanism through which environmental regulations affect industrial agglomeration is illustrated in Figure 1.

3. Material and Methods

3.1. Model Building

In essence, the development of the agglomeration economy is mainly determined by firms’ location choice. Similarly, environmental regulations affect industrial agglomeration by substantially influencing the location decision of firms. In order to identify the decision-making mechanism of firms’ location behavior, we apply the model developed by Kheder and Zugravu as our theoretical foundation [23]. On the one hand, the model claims that firms’ location decision is primarily determined by the comparison of market potentials and firms’ marginal costs of production in different locations. On the other hand, the model regards pollution as one of the production factors, together with labor and capital, and assumes that firms’ marginal costs of production have two components, the “internal” parts, and the “external” parts. Following Kheder and Zugravu [23], a latent (unobserved) profit function for firm i dependent on the characteristics of region j in which it locates can be written as:
π j = ln M P j + ( σ 1 ) ln A j α ( σ 1 ) ln w j β ( σ 1 ) ln r j θ ( σ 1 ) ln e j ( σ 1 ) ln Ω j
where π represents the latent profit of firm i located in region j; M P j denotes the Krugman Market Potential; σ > 1 is the elasticity of substitution between two different firms; ω , r and e are costs of labor, capital, and pollution, respectively. α + β + θ = 1 , whereas α , β , and θ denote the share of labor, capital, and pollution in the firm’s production process, respectively. A represents the total factor productivity. The positive parameter Ω 1 implies an “external” cost caused by market failures that affect the firm’s “internal” (theoretical) marginal cost; Ω = 1 signifies that the firm faces no external cost.
The firm’s location choice means that each firm will compare the profits related to different location alternatives and then select the location j that can maximize its profit. The profits for firm i in region j are given by:
π i j = γ X j + μ i j
where X j is a vector of regional characteristics that affect the firm’s costs and accrued revenues from product sales, γ is a vector of estimated parameters, and μ i j is the disturbance term. It is generally acknowledged that if μ i j in Equation (2) follows a Weibull distribution and is independently and identically distributed, the probability that region j maximizes profits for firm i can be represented by Equation (3).
P ( i j ) = exp ( γ X j ) k = 1 K exp ( γ X k )
where K represents the total number of alternative locations. In the empirical work that follows, the maximum likelihood method is employed to estimate parameter γ .
Based on the theoretical analysis above, we estimate the heterogeneous impact of regional environmental stringency on the number of new increased firms. Following Lin and Sun [30], the number of newly increased firms, which reflects the status of spatial agglomeration of firms (industrial agglomeration), in region j year t is given by:
N j t = ln M j t + ( σ 1 ) ln A j t α ( σ 1 ) ln w j t β ( σ 1 ) ln r j t θ ( σ 1 ) ln e j t ( σ 1 ) ln Ω j t + μ j t
where N j t is the number of newly increased firms of region j in year t.

3.2. Variables and Data Description

3.2.1. Dependent Variable

Unlike extant studies [30,57,58] who apply the absolute number of newly increased firms, we employ the ratio of the number of newly increased firms to the total number of firms in a certain province ( N I F R ) as the dependent variable, which enables us to capture the changes of industrial agglomeration better. The spatial concentration of firms and people in regions is considered one of the most popular organizations of economic activities in modern times [59]. Therefore, measuring industrial agglomeration using firm-related data can provide statistical references for the concentration of economic activities from a micro perspective, which enhances our understanding of how environmental regulations affects industrial agglomeration.

3.2.2. Key Independent Variables

As discussed above, environmental regulations are the key independent variables of our study. China has made great efforts to preserve the environment since the Human Environmental Conference in Stockholm in 1972. Since the first Environmental Protection Law of China was enacted in 1989, 29 laws and regulations have been promulgated by the central government and 84 local environmental laws stipulated. Meanwhile, a series of supporting administrative rules have been implemented by relevant departments [60]. So far, China has established a complete environmental regulation system based on three principles, that is, “Prevention first, combined with control”, “Polluter pays”, and “Strengthening environmental management”. This system includes eight major policy instruments [61] which can be divided into three types according to the production process, that is, beforehand, intermediate, and afterward environmental regulation. The classification is shown in Table 1.
Based on the classification above, the key independent variables are the stringency of the three types of environmental regulations.
The beforehand environmental regulation (BER) works before the production process starts, which contains three major regulatory instruments, namely, “Three-simultaneity”, environmental impact assessment, and total-amount control of pollutants. The “Three-simultaneity” policy serves as one of the earliest environmental policies launched in 1973, which holds that pollution control and other facilities for environmental protection must be designed, constructed, and utilized along with the new projects, reconstruction projects, and extension projects, and so on. The environmental impact assessment implemented in 2002 requires the project managers to analyze, predict, and evaluate the possible environmental impacts of new projects and then propose effective measures to prevent or mitigate the negative effects on the environment. The policy of pollution total-amount control enacted in 1986 was initially aimed at reducing SO2 emissions and controlling acid rain, whose target has been extended to reduce emissions of four major pollutants so far, that is, SO2, COD, ammonia–nitrogen, and nitrogen oxides.
The intermediate environmental regulation (IER) aims to control and reduce pollution emissions during the production process by setting environmental standards and issuing emission permits. Environmental standards, including environmental quality standards, emission standards, and technical standards, are the foundation of China’s environmental protection system. The environmental quality standards mainly intend to regulate the behaviors of local government, while the emission standards and technical standards affect firms’ production by compelling firms to employ certain types of cleaner techniques, pollution abatement techniques, and end-of-pipe equipment in order to meet certain emission standards. In 1973, China’s first statute of environmental standards, Standards for Industrial “Three Wastes” Emissions, came into effect. Heretofore, more than 1000 environmental standards have been implemented, covering almost all kinds of pollutants. Emission permits are also one of the fundamental instruments in China’s environmental regulation system. The polluting firms who acquire the license will be allowed to discharge a certain amount of pollutants legally. The first emission permits were issued in 1989 to control water pollution, and by 2008, the emission permits system had been gradually improved.
The afterward environmental regulation (AER) comes into effect after the production process ends. Three major instruments fall into this category, pollution discharge fees, environmental taxes, and deadline governance. Pollution discharge fees serve as the primary instruments based on market incentives and have become one of the main sources of funds for pollution treatment in China, experiencing a continuously sharp growth between 1996 and 2014 from CNY 7.43 billion to CNY 18.68 billion. However, the pollution discharge fees were repealed in 2017 and replaced by environmental taxes in 2018. The policy of deadline governance penalizes polluting firms who fail to meet the emission standards to achieve certain environmental objects within the given time. Failure to meet the standards can result in fines, and habitual offenders risk being shut down. A typical instrument of deadline governance named “guan-ting-bing-zhuan” is to force polluting firms that exceed certain environmental standards to close down, suspend operation, merge with others, or shift to a different line of production. The deadline governance went into effect in 2009 and mainly directs firms with serious pollution to deal with their problems in a limited time.
Since this classification is based on firms’ production process, it allows the government to design more tailored policies after considering the potential effect from both the environmental and industrial aspects, which facilitates policy effectiveness. Moreover, with a clearer and comprehensive understanding of the impact of heterogeneous environmental regulations on industrial agglomeration, new policies can be explored to target pollution treatment as well as industrial development. Following Zhong et al. and Zhang, we employ the investments of the “Three-simultaneity” as a proxy for the stringency of the BER, and the operating costs of the industrial pollution control equipment (The operating costs of the equipment in the current year are summed up by the operating costs of the waste water treatment facilities and the operating costs of the waste gas treatment facilities) as a proxy for the stringency of the IER [4,62]. In addition, we employ the pollution discharge fees as a proxy for the stringency of the AER, which follows the work of Dong et al. [63].

3.2.3. Control Variables

Moreover, to ensure the robustness of the estimated results, seven control variables are included in the empirical model: (1) Given that capital and labor are the most essential elements for firms’ production, we adopt the ratio of capital (the net value of the investment in fixed assets (Due to the limitation of data, as many scholars did [64], we use the net value of investment in fixed as-sets as a proxy of capital, instead of the capital stock estimated by using the perpetual inventory approach.) to labor (the number of industrial workers), (K/L), to represent the structure of factor endowment of a certain province, as well as to reflect the marginal-factor cost. (2) The total factor productivity growth rate (TFPG) estimated by the data envelopment analysis (DEA) method is employed to capture technological progress. (3) According to the assumption of our theoretical model above, the market failure index (MF) is included to measure the degree of marketization in developing countries (Yuan and Liu, 2013), which is represented by the share of the sales value of state-owned enterprises (SOEs). (4) As the theory of New Economic Geography (NEG) holds that industrial enterprises tend to be located in regions with larger market potential [65], we incorporate market potential (MP) as a control variable, which is measured by the total retail sales of consumer goods per capita. (5) We employ the index of Foreign Market Access (FMA) to indicate the geographical location of each province. Following the research of Ge [66], the FMA can be calculated as:
F M A i = { 100 / D i i ,   i C ; 100 / ( m i n D i j + D i i ) ,   i C ,   j C .
where C represents the set of coastal provinces (The coastal provinces in China include: Beijing, Tianjin, Hebei, Liaoning, Shandong, Shanghai, Jiangsu, Zhejiang, Fujian, Guangdong and Hainan. The rest of provinces are inland provinces.); D i j denotes the distance between province i and its closest coastal province j. (6) Average wage level (WAGE) of each province indicates the costs of human resources [67]. (7) An industrial structural variable (STRUC) is included, defined as the ratio of industrial added value to GDP.
In order to obtain continuous and accurate statistical data, the panel data of China’s 30 provinces is employed. Since some key variables, such as the investments of the “Three-simultaneity” and the pollution discharge fee, are no longer publicly available after 2015, the analyzing period in this study is set from 2005 to 2015 (According to Peking University Center for Legal Information (http://www.pkulaw.cn/, accessed on 16 August 2022), since 2015, little new central and local rules and regulations regarding environmental regulations and industrial agglomeration have been issued, so the cur-rent analyzing period is quite sufficient to demonstrate our study purpose and support our results). Tibet, Hong Kong, Macau, and Taiwan are excluded due to poor data availability. Data related to environmental regulations are derived from the China Environment Statistical Yearbook (2006–2016) and the China Environmental Yearbook (2006–2016), while data regarding the economic performance of industries comes from the China Industrial Economics Statistical Yearbook (2006–2016) and the China Statistical Yearbook (2006–2016). All nominal variables are deflated into real ones at 2005 prices. The descriptive statistics are presented in Table 2.

3.3. The Classification of Provinces

In order to examine the spatial heterogeneity of the impact, this study divides 30 provinces into two types of regions according to the increasing or decreasing trend of the concentration of pollution-intensive industries in each province, that is, a region with an increasing concentration of pollution-intensive industries (PIIR) and one with a decreasing concentration of pollution-intensive industries (PIDR). The specific classification method is as follows.
First, we identify the pollution-intensive industries. Following the method of Sun and Wang [68], we calculate the comprehensive index of pollutant emissions, S k , which includes industrial waste gas, wastewater, and solid waste. Define
S k = j = 1 3 W j × P k j
where W j = X k j / k X k j Q k / k Q k , and P k j = X k j min ( X k j ) max ( X k j ) min ( X k j ) . X k j represents the original value of pollutant emission j ( j = 1 , 2 , 3 ) in industry k; Q k is the sales value of industry k; P k j is the standardized value of each pollutant emission in industry k; W j is the weight factor for each pollutant j.
Setting a criterion of S k 2.0102 , we define 8 industrial sectors as the pollution-intensive sectors: mining and washing of coal, mining and processing of ferrous metal ores, mining and processing of non-ferrous metal ores, manufacture of textiles, manufacture of paper and paper products, manufacture of raw chemical materials and chemical products, manufacture of non-metallic mineral products, and smelting and pressing of ferrous metals.
Second, we calculate the location-entropy index of the pollution-intensive industries to characterize the degree of spatial concentration of the pollution-intensive industries for each province. The formula to calculate the index is as follows:
l o c k i = T v a k i / k T v a k i i T v a k i / i k T v a k i
where l o c k i represents the degree of spatial concentration of pollution-intensive industry k (k = 1, 2, …, 8) in province i; T v a k i represents the number of employees of industry k in province i.
According to the changes of the location-entropy of pollution-intensive industries, the results of the classification for 30 provinces are shown in Table 3.

4. Results and Discussion

Before constructing the econometric regression, we should first determine the proper regression techniques. In this paper, we prefer the fixed-effects rather than the random-effect approach, since the random-effect estimation requires that the missing variables must be uncorrelated with all other explanatory variables for the same country, while the fixed-effects approach is closer to reality in the context of our models. Furthermore, we undertake endogenous tests and introduce one period lag of the endogenous variables (TFPG and MP) as instrumental variables into the model to deal with the endogenous problems following the study of Ciccone and Hall [69]. Combining the two aspects above, we adopt the instrumental variable-fixed effect model (IV-FE) in the regression analysis.

4.1. The Aggregate Estimated Results

The aggregate estimated results are reported in Table 4 in which Model 1, 2, and 3 examine the impact of BER, IER, and AER separately, while Model 4 incorporates all these three variables to compare the heterogeneous effects of three types of environmental regulations on industrial agglomeration.
We mainly analyze the estimated results of Model 4 in Table 4. As revealed from the results, the coefficients of BER and IER are significant at the 10% and 5% level, respectively, suggesting significant impacts of these two types of environmental regulations on industrial agglomeration. But the coefficient of AER is insignificant. Meanwhile, the impacts of different types of environmental regulations are distinct. Stricter BER is associated with a lower level of industrial agglomeration with a coefficient of −0.023, while IER is positively related to industrial agglomeration with the coefficient being 0.031. These results indicate that BER impedes the entry of firms, and further harms the development of the agglomeration economy, while IER can effectively attract firms to move in and promote the expansion of industrial agglomeration. Moreover, comparing the effects of the three types of environmental regulations on industrial agglomeration, IER witnesses the greatest effect, followed by the BER, but being negative. Such results manifest remarkable heterogeneous effects of different regulatory instruments.

4.2. The Estimated Results of the PIIR and PIDR Region

The estimated results of two groups of regions, the region with an increasing concentration of pollution-intensive industries (PIIR) and the region with a decreasing concentration of pollution-intensive industries (PIDR), are presented in Table 5, which indicate significant spatial heterogeneity. Comparing the results of Model 4 of the two groups, it can be seen that BER has opposite effects on industrial agglomeration in different regions. For the PIDR region, BER adversely affects industrial agglomeration with a coefficient of −0.053 and significant at the 5% level, but for the PIIR region, the coefficient of BER is positive and fails to pass the significance test. As to AER, it can positively affect the level of industrial agglomeration in the PIDR region and is highly significant at the 1% level, whereas for the PIIR region, its coefficient is negative and fails to pass the significance test. For IER, the coefficients are not significant for the PIIR or for the PIDR.

4.3. Discussion

The empirical analysis demonstrates significant impacts of environmental regulations on industrial agglomeration, which corresponds with previous studies [34,70]. A healthy and clean environment can play a crucial role in achieving various Sustainable Development Goals (17-SDG) targets [71]. The report of the 19th National Congress pointed out that “China’s economy has shifted from a stage of high-speed growth to a stage of high-quality development”. Accordingly, firms are required to adhere to the “high efficiency, low pollution” development direction. Therefore, our results provide statistical evidence that environmental regulations can be regarded as an efficient policy tool to screen new entrants.
Moreover, the impacts of different types of environmental regulations are distinct. BER impedes the entry of firms, suggesting that new polluting firms are more likely to be driven by BER to the areas with low policy stringency [56]. In other words, for BER the compliance cost effect dominates. This result is consistent with the prediction of the “Pollution Haven Hypothesis”. A possible explanation is that BER requires firms to invest in pollution control even before the firms proceed into production, such as the purchase of sewage equipment and the treatment of pollutants. Such environmental investment can be treated as huge silent costs for firms, which will induce the crowding-out effect. Therefore, stricter BER plays the role of an entry barrier which would prevent polluting firms from locating [28,54] and eventually results in a significant inhibiting effect on industrial agglomeration.
Unlike BER, IER has a positive impact on industrial agglomeration, indicating that IER can attract firms to spatially concentrate. Such results provide evidence that provinces with proper environmental regulatory tools attract rather than repulse polluting firms to locate [72]. A possible reason is that IER can stimulate innovations and gradually lead to an innovation offset effect [46,48]. Another reason is that the pollution control facilities and equipment established by the government in a certain region can provide effective services for polluting firms, which not only reduces the marginal cost of pollution control for polluting firms but also enriches their pollution control experience. As a result, firms moving into regions with stricter IER can benefit from the spillover effect of new knowledge and technology, as well as the scale effect of pollution control [73], both of which are key advantages of industrial agglomeration. In other words, stringent IER serves as an important factor to attract new firms to move in, which promotes industrial agglomeration. The results indicate that the government should design environmental regulations properly in order to attract industrial agglomeration.
Divergent effects are also found in the PIIR region and the PIDR region, which is in accordance with existing studies [41]. BER significantly inhibits industrial agglomeration in the PIDR region, while its impact in the PIIR region is positive and subtle. A possible reason may be that the implementation of BER relies more on the enforcement and efficiency of local government, while it is difficult to be supervised by the public. The PIIR region mainly includes provinces with heavy industry, such as Shandong and Hebei, and typical resource-based provinces, such as Shanxi, Xinjiang, and Inner Mongolia. For these provinces, pollution-intensive industries contribute a large proportion to local economic growth. Given this, the enforcement of BER is more likely to become a “race to the bottom”, which eventually makes BER invalid, whereas in the PIDR region, the enforcement of BER is much more rigorous [74], and BER acts effectively as the entry barrier to polluting firms.
Meanwhile, AER facilitates industrial agglomeration in the PIDR region, while its impact in the PIIR region is negative and insignificant. A possible explanation is that the PIIR region, which is more likely to include the highly-developed provinces in China, provides a more preferable condition for polluting firms to strengthen innovation and reduce emissions [73], and the profit gained through technological innovation can offset the additional cost of compliance, which encourages firms to agglomerate. Moreover, more stringent AER suggests fewer emissions at the end, in other words, a better business environment and higher environmental quality, which attract investments and labor. Meanwhile, since many polluting firms in the PIIR region have lower innovation ability and incentive, the innovation offset effect is subtle. Therefore, AER cannot effectively attract agglomeration in the PIIR region. Such results suggest that environmental regulations should be accompanied by other supporting policies that encourage innovation.

5. Conclusions and Policy Implications

This study attempts to explore the relationship between environmental regulations and industrial agglomeration, considering both the heterogeneous effect of different types of regulations and spatial heterogeneity in different regions. By employing a panel dataset of China’s 30 provinces between 2005 and 2015, we conducted an empirical analysis and drew insightful findings. First, all three types of environmental regulations have significant impacts on industrial agglomeration both at the province level and region level, but with different mechanisms, specifically. Second, at the provincial level, BER has negative effects on industrial agglomeration, whereas IER has positive impacts on industrial agglomeration, indicating the heterogeneous impacts of different types of regulations. Third, at the regional level, we find evidence of spatial heterogeneity. BER exerts a significantly negative effect in the PIDR region, while its effect in the PIIR is subtle. AER exerts a significantly positive impact in the PIDR region, but insignificant effect on PIIR. IER fails to have any significant effect on either of the two regions.
Our policy implications derived from the above analysis are as follows. First, environmental regulations should be regarded as an effective incentive tool to promote industrial agglomeration. According to the empirical results, environmental regulations have a fundamental impact on industrial agglomeration. Therefore, in order to avoid policy conflicts, the role of environmental regulations should be taken into account when designing industrial agglomeration policies. Second, considering the heterogeneous impacts of environmental regulations on industrial agglomeration, the choice of environmental regulations and relevant supporting policies should be carefully designed. Since BER is regarded as a significant barrier to most firms, it should be strengthened step by step, with full consideration of the local industrial development level. IER can be used as an effective means to stimulate green innovation and promote industrial agglomeration. Meanwhile, the quality of agglomeration should not be neglected. Supporting policies should be implemented in order to attract the location of low-pollution and high-efficiency firms. Third, the significant spatial heterogeneity in the relationship between environmental regulations and industrial agglomeration indicates that the Chinese government should design and implement more tailored regulatory instruments for different regions. For example, for the PIIR region, the government should raise the environmental threshold and constantly improve the enforcement of BER, while for the PIDR region, IER should be strengthened and attempt to stimulate innovation effectively. Moreover, it is of great necessity to combine environmental regulations with other supporting policies, so as to encourage innovation and achieve the sustainable development of the agglomeration economy in China.
The current study may provide fresh evidence for emerging economies. However, there is still potential for improvement. Since the data of our key variables, heterogeneous environmental regulations, are only available at the province level, we employed panel data of 30 provinces in China in the empirical study. Meanwhile, city-level data can also unveil some useful insights into this topic. In the follow-up studies, we will try to improve our empirical analysis by constructing new variables and applying city-level data. In addition, considering limited data availability, we will enrich our study by combing case studies and deep qualitative approaches.

Author Contributions

Conceptualization, Y.Z.; methodology, N.W.; software, N.W.; validation, R.X., formal analysis, Y.Z.; investigation, N.W.; resources, N.W.; data curation, N.W.; writing—original draft preparation, N.W.; writing—review and editing, R.X.; visualization, N.W.; supervision, Y.Z.; project administration, Y.Z.; funding acquisition, Y.Z. All authors have read and agreed to the published version of the manuscript.

Funding

This work was supported by the General Program of National Social Science Foundation of China [20BJL106], National Social Science Foundation of China [21CJY075], Cultural Experts and “Four batch” Talents Independently Selected Topic Project [ZXGZ [2018]86], and the Fundamental Research Funds for the Central Universities [30918014110].

Institutional Review Board Statement

Not applicable.

Informed Consent Statement

Not applicable.

Data Availability Statement

The data used to support the findings of this study are available from the corresponding author upon request.

Conflicts of Interest

The authors declare no conflict of interest.

References

  1. Malmberg, A. Industrial geography: Agglomeration and local milieu. Prog. Hum. Geogr. 1996, 20, 392–403. [Google Scholar] [CrossRef]
  2. Zhu, Y.; Yang, L.; Lv, H.; Shen, X. Study of resource shortage, environmental damage and effect on industrial agglomeration: Based on empirical analysis of provincial level industries of China in 21st century. Manag. World 2012, 11, 28–44. (In Chinese) [Google Scholar]
  3. Chen, S.Y. Energy consumption, CO2 emission and sustainable development in Chinese industry. Econ. Res. J. 2009, 4, 41–55. (In Chinese) [Google Scholar]
  4. Zhong, M.; Li, M.; Du, W. Can environmental regulation force industrial structure adjustment: An empirical analysis based on provincial panel data. China Population. Resour. Environ. 2015, 25, 107–115. (In Chinese) [Google Scholar]
  5. Jeppesen, T.; List, J.A.; Folmer, H. Environmental Regulations and New Plant Location Decisions: Evidence from a Meta-Analysis. J. Reg. Sci. 2002, 42, 19–49. [Google Scholar] [CrossRef]
  6. Broner, F.; Bustos, P.; Carvalho, V. Sources of Comparative Advantage in Polluting Industries; NBER Working Paper; National Bureau of Economic Research: Cambridge, CA, USA, 2012. [Google Scholar] [CrossRef]
  7. Shen, J.; Wei, Y.D.; Yang, Z. The impact of environmental regulations on the location of pollution-intensive industries in China. J. Clean. Prod. 2017, 148, 785–794. [Google Scholar] [CrossRef]
  8. Bartik, T.J. Small Business Start-Ups in the United States: Estimates of the Effects of Characteristics of States. South. Econ. J. 1989, 55, 1004. [Google Scholar] [CrossRef]
  9. Levinson, A. Environmental regulations and manufacturers’ location choices: Evidence from the Census of Manufactures. J. Public Econ. 1996, 62, 5–29. [Google Scholar] [CrossRef]
  10. Becker, R.; Henderson, V. Effects of Air Quality Regulations on Polluting Industries. J. Politi Econ. 2000, 108, 379–421. [Google Scholar] [CrossRef]
  11. List, J.A.; Millimet, D.L.; Fredriksson, P.G.; McHone, W.W. Effects of Environmental Regulations on Manufacturing Plant Births: Evidence from a Propensity Score Matching Estimator. Rev. Econ. Stat. 2003, 85, 944–952. [Google Scholar] [CrossRef]
  12. Xie, R.-H.; Yuan, Y.-J.; Huang, J.-J. Different Types of Environmental Regulations and Heterogeneous Influence on “Green” Productivity: Evidence from China. Ecol. Econ. 2017, 132, 104–112. [Google Scholar] [CrossRef]
  13. Cui, S.; Wang, Y.; Zhu, Z.; Zhu, Z.; Yu, C. The impact of heterogeneous environmental regulation on the energy eco-efficiency of China’s energy-mineral cities. J. Clean. Prod. 2022, 350, 131553. [Google Scholar] [CrossRef]
  14. Song, W.; Han, X. Heterogeneous two-sided effects of different types of environmental regulations on carbon productivity in China. Sci. Total Environ. 2022, 841, 156769. [Google Scholar] [CrossRef] [PubMed]
  15. Wang, Y.; Yan, W.; Ma, D.; Zhang, C. Carbon emissions and optimal scale of China’s manufacturing agglomeration under heterogeneous environmental regulation. J. Clean. Prod. 2017, 176, 140–150. [Google Scholar] [CrossRef]
  16. Tang, K.; Qiu, Y.; Zhou, D. Does command-and-control regulation promote green innovation performance? Evidence from China’s industrial enterprises. Sci. Total Environ. 2020, 712, 136362. [Google Scholar] [CrossRef] [PubMed]
  17. Liu, X.; Zhang, X. Industrial agglomeration, technological innovation and carbon productivity: Evidence from China. Resour. Conserv. Recycl. 2020, 166, 105330. [Google Scholar] [CrossRef]
  18. Peng, H.; Shen, N.; Ying, H.; Wang, Q. Can environmental regulation directly promote green innovation behavior?—— based on situation of industrial agglomeration. J. Clean. Prod. 2021, 314, 128044. [Google Scholar] [CrossRef]
  19. Conrad, K. Locational competition under environmental regulation when input prices and productivity differ. Ann. Reg. Sci. 2005, 39, 273–295. [Google Scholar] [CrossRef]
  20. Xu, M.Y.; Zuo, H.P. Study on the relationship between environmental regulation and industrial competitiveness under ag-glomeration effect. China Ind. Econ. 2013, 3, 72–84. (In Chinese) [Google Scholar]
  21. Zeng, D.-Z.; Zhao, L. Pollution havens and industrial agglomeration. J. Environ. Econ. Manag. 2009, 58, 141–153. [Google Scholar] [CrossRef]
  22. Liang, Q.; Ding, S.; Wang, R.Y.; Chen, Q.Y. Analysis on the North-South investment share, consumption share and total pollution under environmental regulation. J. World Econ. 2011, 8, 44–65. (In Chinese) [Google Scholar]
  23. Ben Kheder, S.; Zugravu, N. Environmental regulation and French firms location abroad: An economic geography model in an international comparative study. Ecol. Econ. 2012, 77, 48–61. [Google Scholar] [CrossRef]
  24. Kyriakopoulou, E.; Xepapadeas, A. Environmental policy, first nature advantage and the emergence of economic clusters. Reg. Sci. Urban Econ. 2013, 43, 101–116. [Google Scholar] [CrossRef]
  25. Tang, J. Testing the Pollution Haven Effect: Does the Type of FDI Matter? Environ. Resour. Econ. 2014, 60, 549–578. [Google Scholar] [CrossRef]
  26. Lian, T.; Ma, T.; Cao, J.; Wu, Y. The effects of environmental regulation on the industrial location of China’s manufacturing. Nat. Hazards 2015, 80, 1381–1403. [Google Scholar] [CrossRef]
  27. Cheng, Z. The spatial correlation and interaction between manufacturing agglomeration and environmental pollution. Ecol. Indic. 2016, 61, 1024–1032. [Google Scholar] [CrossRef]
  28. Yuan, F.; Wei, Y.D.; Gao, J.; Chen, W. Water crisis, environmental regulations and location dynamics of pollution-intensive industries in China: A study of the Taihu Lake watershed. J. Clean. Prod. 2019, 216, 311–322. [Google Scholar] [CrossRef]
  29. Sarkodie, S.A.; Strezov, V. Effect of foreign direct investments, economic development and energy consumption on greenhouse gas emissions in developing countries. Sci. Total Environ. 2018, 646, 862–871. [Google Scholar] [CrossRef] [PubMed]
  30. Lin, L.; Sun, W. Location choice of FDI firms and environmental regulation reforms in China. J. Regul. Econ. 2016, 50, 207–232. [Google Scholar] [CrossRef]
  31. Dou, J.; Han, X. How does the industry mobility affect pollution industry transfer in China: Empirical test on Pollution Haven Hypothesis and Porter Hypothesis. J. Clean. Prod. 2019, 217, 105–115. [Google Scholar] [CrossRef]
  32. Zheng, D.; Shi, M. Multiple environmental policies and pollution haven hypothesis: Evidence from China’s polluting industries. J. Clean. Prod. 2017, 141, 295–304. [Google Scholar] [CrossRef]
  33. Wang, Q.; Xie, X.; Wang, M. Environmental regulation and firm location choice in China. China Econ. J. 2015, 8, 215–234. [Google Scholar] [CrossRef]
  34. Shao, Q.; Wang, X.; Zhou, Q.; Balogh, L. Pollution haven hypothesis revisited: A comparison of the BRICS and MINT countries based on VECM approach. J. Clean. Prod. 2019, 227, 724–738. [Google Scholar] [CrossRef]
  35. Wang, X.; Zhang, C.; Zhang, Z. Pollution haven or porter? The impact of environmental regulation on location choices of pollution-intensive firms in China. J. Environ. Manag. 2019, 248, 109248. [Google Scholar] [CrossRef] [PubMed]
  36. List, J.A.; McHone, W.W. Measuring the effects of air quality regulations on “dirty” firm births: Evidence from the neo- and mature-regulatory periods. Pap. Reg. Sci. 2000, 79, 177–190. [Google Scholar] [CrossRef]
  37. LaRue, S.; Abildtrup, J.; Schmitt, B. Positive and Negative Agglomeration Externalities: Arbitration in the Pig Sector. Spat. Econ. Anal. 2011, 6, 167–183. [Google Scholar] [CrossRef]
  38. Kyriakopoulou, E.; Xepapadeas, A. Atmospheric pollution in rapidly growing industrial cities: Spatial policies and land use patterns. J. Econ. Geogr. 2017, 17, 607–634. [Google Scholar] [CrossRef]
  39. Mani, M.; Pargal, S.; Huq, M. Does Environmental Regulation Matter? Determinants of the Location of New Manufacturing Plants in India in 1994; Policy Research Working Paper; SSRN: New York, NY, USA, 1997; Volume 62, pp. 27–37. Available online: https://ssrn.com/abstract=614970 (accessed on 18 May 2022).
  40. Manderson, E.; Kneller, R. Environmental Regulations, Outward FDI and Heterogeneous Firms: Are Countries Used as Pollution Havens? Environ. Resour. Econ. 2011, 51, 317–352. [Google Scholar] [CrossRef]
  41. Zhang, N.; Huang, X.; Qi, C. The effect of environmental regulation on the marginal abatement cost of industrial firms: Evidence from the 11th Five-Year Plan in China. Energy Econ. 2022, 112, 106147. [Google Scholar] [CrossRef]
  42. Rezza, A.A. A meta-analysis of FDI and environmental regulations. Environ. Dev. Econ. 2014, 20, 185–208. [Google Scholar] [CrossRef]
  43. Lankoski, L. Linkages between Environmental Policy and Competitiveness; OECD Environment Working Papers; OECD Publishing: Paris, France, 2010. [Google Scholar] [CrossRef]
  44. Brunnermeier, S.B.; Levinson, A. Examining the Evidence on Environmental Regulations and Industry Location. J. Environ. Dev. 2004, 13, 6–41. [Google Scholar] [CrossRef]
  45. Javeed, S.A.; Latief, R.; Lefen, L. An analysis of relationship between environmental regulations and firm performance with moderating effects of product market competition: Empirical evidence from Pakistan. J. Clean. Prod. 2020, 254, 120197. [Google Scholar] [CrossRef]
  46. Porter, M.E.; van der Linde, C. Toward a New Conception of the Environment-Competitiveness Relationship. J. Econ. Perspect. 1995, 9, 97–118. [Google Scholar] [CrossRef] [Green Version]
  47. Wang, X.; Zhang, T.; Nathwani, J.; Yang, F.; Shao, Q. Environmental regulation, technology innovation, and low carbon development: Revisiting the EKC Hypothesis, Porter Hypothesis, and Jevons’ Paradox in China’s iron & steel industry. Technol. Forecast. Soc. Chang. 2022, 176, 121471. [Google Scholar] [CrossRef]
  48. Pei, Y.; Zhu, Y.; Liu, S.; Wang, X.; Cao, J. Environmental regulation and carbon emission: The mediation effect of technical efficiency. J. Clean. Prod. 2019, 236, 117599. [Google Scholar] [CrossRef]
  49. Ouyang, X.; Li, Q.; Du, K. How does environmental regulation promote technological innovations in the industrial sector? Evidence from Chinese provincial panel data. Energy Policy 2020, 139, 111310. [Google Scholar] [CrossRef]
  50. Liu, M.; Li, Y. Environmental regulation and green innovation: Evidence from China’s carbon emissions trading policy. Finance Res. Lett. 2022, 48, 103051. [Google Scholar] [CrossRef]
  51. Zhong, Z.; Peng, B. Can environmental regulation promote green innovation in heavily polluting enterprises? Empirical evidence from a quasi-natural experiment in China. Sustain. Prod. Consum. 2022, 30, 815–828. [Google Scholar] [CrossRef]
  52. Zhou, X.; Du, J. Does environmental regulation induce improved financial development for green technological innovation in China? J. Environ. Manag. 2021, 300, 113685. [Google Scholar] [CrossRef]
  53. Li, Z.; Wu, B.; Wang, D.; Tang, M. Government mandatory energy-biased technological progress and enterprises’ environmental performance: Evidence from a quasi-natural experiment of cleaner production standards in China. Energy Policy 2022, 162, 112779. [Google Scholar] [CrossRef]
  54. Gray, W.B.; Shadbegian, R.J. Plant vintage, technology, and environmental regulation. J. Environ. Econ. Manag. 2003, 46, 384–402. [Google Scholar] [CrossRef]
  55. Wang, Y.; Chen, J.; Shi, M. Environmental regulation, local government competition and labor demand spillover. J. Environ. Econ. 2017, 2, 49–71. (In Chinese) [Google Scholar]
  56. Yang, J.; Guo, H.; Liu, B.; Shi, R.; Zhang, B.; Ye, W. Environmental regulation and the Pollution Haven Hypothesis: Do environmental regulation measures matter? J. Clean. Prod. 2018, 202, 993–1000. [Google Scholar] [CrossRef]
  57. Morgan, O.A.; Condliffe, S. Spatial Heterogeneity in Environmental Regulation Enforcement and the Firm Location Decision among U.S. Counties. Rev. Reg. Stud. 2009, 39, 239–252. [Google Scholar] [CrossRef]
  58. Tole, L.; Koop, G. Do environmental regulations affect the location decisions of multinational gold mining firms? J. Econ. Geogr. 2010, 11, 151–177. [Google Scholar] [CrossRef]
  59. Wu, Y.; Wei, Y.D.; Li, H.; Liu, M. Amenity, firm agglomeration, and local creativity of producer services in Shanghai. Cities 2021, 120, 103421. [Google Scholar] [CrossRef]
  60. Bao, Q.; Shao, M.; Yang, D.L. Does environmental regulation suppress pollutant emissions? Econ. Res. J. 2013, 12, 42–54. (In Chinese) [Google Scholar]
  61. Yuan, Y.J.; Liu, L. Environmental regulation and economic growth: A research based on different kinds of economic regulation. Econ. Rev. 2013, 1, 27–33. [Google Scholar] [CrossRef]
  62. Zhang, J. Study on economic growth effect and transmission mechanism of environmental regulation in resource. China Pop. Resour. Environ. 2017, 10, 39–46. (In Chinese) [Google Scholar]
  63. Dong, M.; Liang, Y.; Li, G. Impact of environmental regulation on China’s export competitiveness: Based on the input-output model. China Ind. Econ. 2011, 3, 57–67. (In Chinese) [Google Scholar]
  64. Dong, M.J.; Li, G.; Liang, Y.M. The sources of China’s environmental total factor productivity. J. Quant. Tech. Econ. 2012, 2, 3–20. (In Chinese) [Google Scholar]
  65. Krugman, P.; Venables, A. Globalization and the Inequality of Nations. Q. J. Econ. 1995, 110, 857–880. [Google Scholar] [CrossRef]
  66. Ge, Y. Regional Inequality, Industry Agglomeration and Foreign Trade: The case of China; Working Papers; University of International Business and Economics: Beijing, China, 2003. [Google Scholar]
  67. Nielsen, B.B.; Asmussen, C.; Weatherall, C.D. The location choice of foreign direct investments: Empirical evidence and methodological challenges. J. World Bus. 2017, 52, 62–82. [Google Scholar] [CrossRef]
  68. Sun, X.; Wang, J. Effects of environmental regulation on Chinese enterprises size distribution. China Ind. Econ. 2014, 12, 44–56. (In Chinese) [Google Scholar]
  69. Ciccone, A.; Hall, R. Productivity and the Density of Economic Activity. Am. Econ. Rev. 1996, 86, 54–70. [Google Scholar] [CrossRef]
  70. Wang, Y.; Sun, X.; Guo, X. Environmental regulation and green productivity growth: Empirical evidence on the Porter Hypothesis from OECD industrial sectors. Energy Policy 2019, 132, 611–619. [Google Scholar] [CrossRef]
  71. Balsalobre-Lorente, D.; Ibáñez-Luzón, L.; Usman, M.; Shahbaz, M. The environmental Kuznets curve, based on the economic complexity, and the pollution haven hypothesis in PIIGS countries. Renew. Energy 2021, 185, 1441–1455. [Google Scholar] [CrossRef]
  72. Wang, H.; Zhang, R. Effects of environmental regulation on CO2 emissions: An empirical analysis of 282 cities in China. Sustain. Prod. Consum. 2021, 29, 259–272. [Google Scholar] [CrossRef]
  73. Wang, N.; Zhu, Y.; Yang, T. The impact of transportation infrastructure and industrial agglomeration on energy efficiency: Evidence from China’s industrial sectors. J. Clean. Prod. 2019, 244, 118708. [Google Scholar] [CrossRef]
  74. Liu, S.; Zhu, Y.; Du, K. The impact of industrial agglomeration on industrial pollutant emission: Evidence from China under New Normal. Clean Technol. Environ. Policy 2017, 19, 2327–2334. [Google Scholar] [CrossRef]
Figure 1. The theoretical framework.
Sustainability 14 10902 g001
Table 1. Classification of major regulatory instruments.
Types of Environmental RegulationsRegulatory Instruments
Beforehand regulation“Three-simultaneity”
Environmental impact assessment
Total-amount control of pollutant
Intermediate regulationEnvironmental standards
Emission permits
Afterward regulationPollutant discharge fees
Environmental taxes
Deadline governance
Table 2. The descriptive statistics for key variables.
VariablesUnitMeanSDMinMax
Newly increased firm ratio (NIFR)%2.0016.00−86.0036.00
Beforehand environmental regulation (BER)RMB 100 million yuan14.9513.640.3679.48
Intermediate environmental regulation (IER)RMB 100 million yuan44.8840.871.33263.96
Afterward environmental regulation (AER)RMB one million yuan4.964.150.1725.43
The ratio K to L (K/L) RMB one million yuan/person33.0820.498.52165.97
Total factor productivity growth rate (TFPG)-1.730.790.695.02
Marketization (MARKET)-0.400.190.100.83
Market potential (MP) RMB one million yuan/person0.820.670.063.64
Foreign market access (FMA)-1.912.550.04210.20
Average wage level (WAGE)RMB 100 thousand yuan1.440.390.922.74
Industrial structure (STRUC)%38.148.3313.2057.38
Table 3. The classification of two types of regions.
The PIIR Region (15)The PIDR Region (15)
ProvincesBeijing, Hebei, Liaoning, Zhejiang, Fujian, Shandong, Guangdong, Shanxi, Jilin, Heilongjiang, Inner Mongolia, Yunnan, Gansu, Ningxia, XinjiangShanghai, Tianjin, Jiangsu, Hainan, Anhui, Jiangxi, Henan, Hubei, Hunan, Guangxi, Chongqing, Sichuan, Guizhou, Shannxi, Qinghai.
Table 4. The aggregate regression results of 30 provinces.
VariablesModel 1Model 2Model 3Model 4
l n B E R i t −0.001 *
(0.0005)
−0.023 *
(0.012)
l n I E R i t 0.009 *
(0.005)
0.031 **
(0.013)
l n A E R i t 0.012
(0.008)
0.002
(0.016)
l n K / L i t −0.034 **
(0.013)
−0.032 **
(0.012)
−0.031 **
(0.011)
−0.038 ***
(0.012)
l n T F P G i t 0.041 *
(0.021)
0.042 *
(0.021)
0.043 *
(0.021)
0.037
(0.021)
l n M A R K E T i t −0.019
(0.011)
−0.017
(0.011)
−0.016
(0.011)
−0.014
(0.012)
l n M P i t −0.0005
(0.015)
−0.003
(0.015)
−0.005
(0.016)
0.002
(0.012)
l n F M A i t −0.015 **
(0.006)
−0.015 **
(0.006)
−0.014 **
(0.006)
−0.014 **
(0.006)
l n W A G E i t −0.074
(0.044)
−0.071
(0.044)
−0.061
(0.038)
−0.074
(0.044)
l n S T R U C i t 0.019
(0.023)
0.003
(0.024)
−0.010
(0.021)
−0.002
(0.023)
_cons0.811 *
(0.431)
0.735
(0.426)
0.634
(0.352)
0.759
(0.448)
R20.3170.2420.2750.221
Econometric methodsIV-FEIV-FEIV-FEIV-FE
F-test33.10 ***61.54 ***41.89 ***30.54 ***
Note: (1) standard errors are shown in brackets; (2) ***, **, and * indicate that the levels of significance are 1%, 5% and 10%, respectively.
Table 5. The regression results of the PIIR and the PIDR.
VariablesThe PIIRThe PIDR
Model 1Model 2Model 3Model 4Model 1Model 2Model 3Model 4
l n B E R i t 0.005
(0.014)
0.032
(0.028)
−0.064 ***
(0.017)
−0.053 **
(0.014)
l n I E R i t 0.002
(0.015)
0.003
(0.019)
0.149 ***
(0.047)
0.031
(0.023)
l n A E R i t 0.0003
(0.015)
−0.001
(0.012)
0.042 ***
(0.011)
0.045 ***
(0.014)
l n K / L i t 0.053 *
(0.025)
0.053 *
(0.026)
0.054 *
(0.027)
0.028
(0.038)
−0.072 ***
(0.023)
−0.065 **
(0.026)
−0.057 *
(0.027)
−0.063
(0.039)
l n T F P G i t 0.153
(0.111)
0.149
(0.108)
0.148
(0.102)
0.067
(0.044)
−0.210 *
(0.101)
−0.230 *
(0.106)
0.026
(0.040)
0.034
(0.041)
l n M A R K E T i t −0.066 ***
(0.018)
−0.065 ***
(0.016)
−0.066 ***
(0.015)
−0.061 ***
(0.013)
0.034
(0.026)
0.034
(0.027)
0.019
(0.030)
0.031
(0.030)
l n M P i t −0.022
(0.014)
−0.021
(0.015)
−0.021
(0.015)
−0.028 *
(0.014)
0.030
(0.049)
0.017
(0.049)
0.042
(0.044)
0.048
(0.051)
l n F M A i t −0.006
(0.009)
−0.005
(0.009)
−0.005
(0.009)
−0.003
(0.009)
−0.011
(0.011)
−0.012
(0.011)
−0.017
(0.013)
−0.014
(0.013)
l n W A G E i t −0.064
(0.104)
−0.061
(0.100)
−0.060
(0.088)
−0.069
(0.095)
−0.152 ***
(0.039)
−0.140 ***
(0.039)
−0.114 **
(0.046)
−0.130 **
(0.053)
l n S T R U C i t 0.002
(0.048)
0.010
(0.048)
0.014
(0.054)
0.000
(0.060)
−0.043
(0.057)
−0.022
(0.054)
−0.063
(0.061)
−0.121
(0.095)
_cons0.347
(0.920)
0.331
(0.884)
0.328
(0.804)
0.371
(0.814)
1.939 ***
(0.336)
0.987 *
(0.497)
1.179 **
(0.422)
1.360 ***
(0.378)
R20.2640.2790.2820.1290.3160.3030.2850.312
Econometric methodsIV-FEIV-FEIV-FEIV-FEIV-FEIV-FEIV-FEIV-FE
F-test5.19 ***5.49 ***5.26 ***27.62 ***497.66 ***719.93 ***408.63 ***393.38 ***
Note: (1) standard errors are shown in brackets; (2) ***, **, and * indicate that the levels of significance are 1%, 5%, and 10%, respectively.
Publisher’s Note: MDPI stays neutral with regard to jurisdictional claims in published maps and institutional affiliations.

