Life-Cycle Assessment in the LEED-CI v4 Categories of Location and Transportation (LT) and Energy and Atmosphere (EA) in California: A Case Study of Two Strategies for LEED Projects
Abstract
:1. Introduction
1.1. Problem Statement
1.2. LEED Certification
1.3. Linking LEED Certification to LCA Outcomes
1.4. Goals of the Study
2. Materials and Methods
2.1. Design of the Study
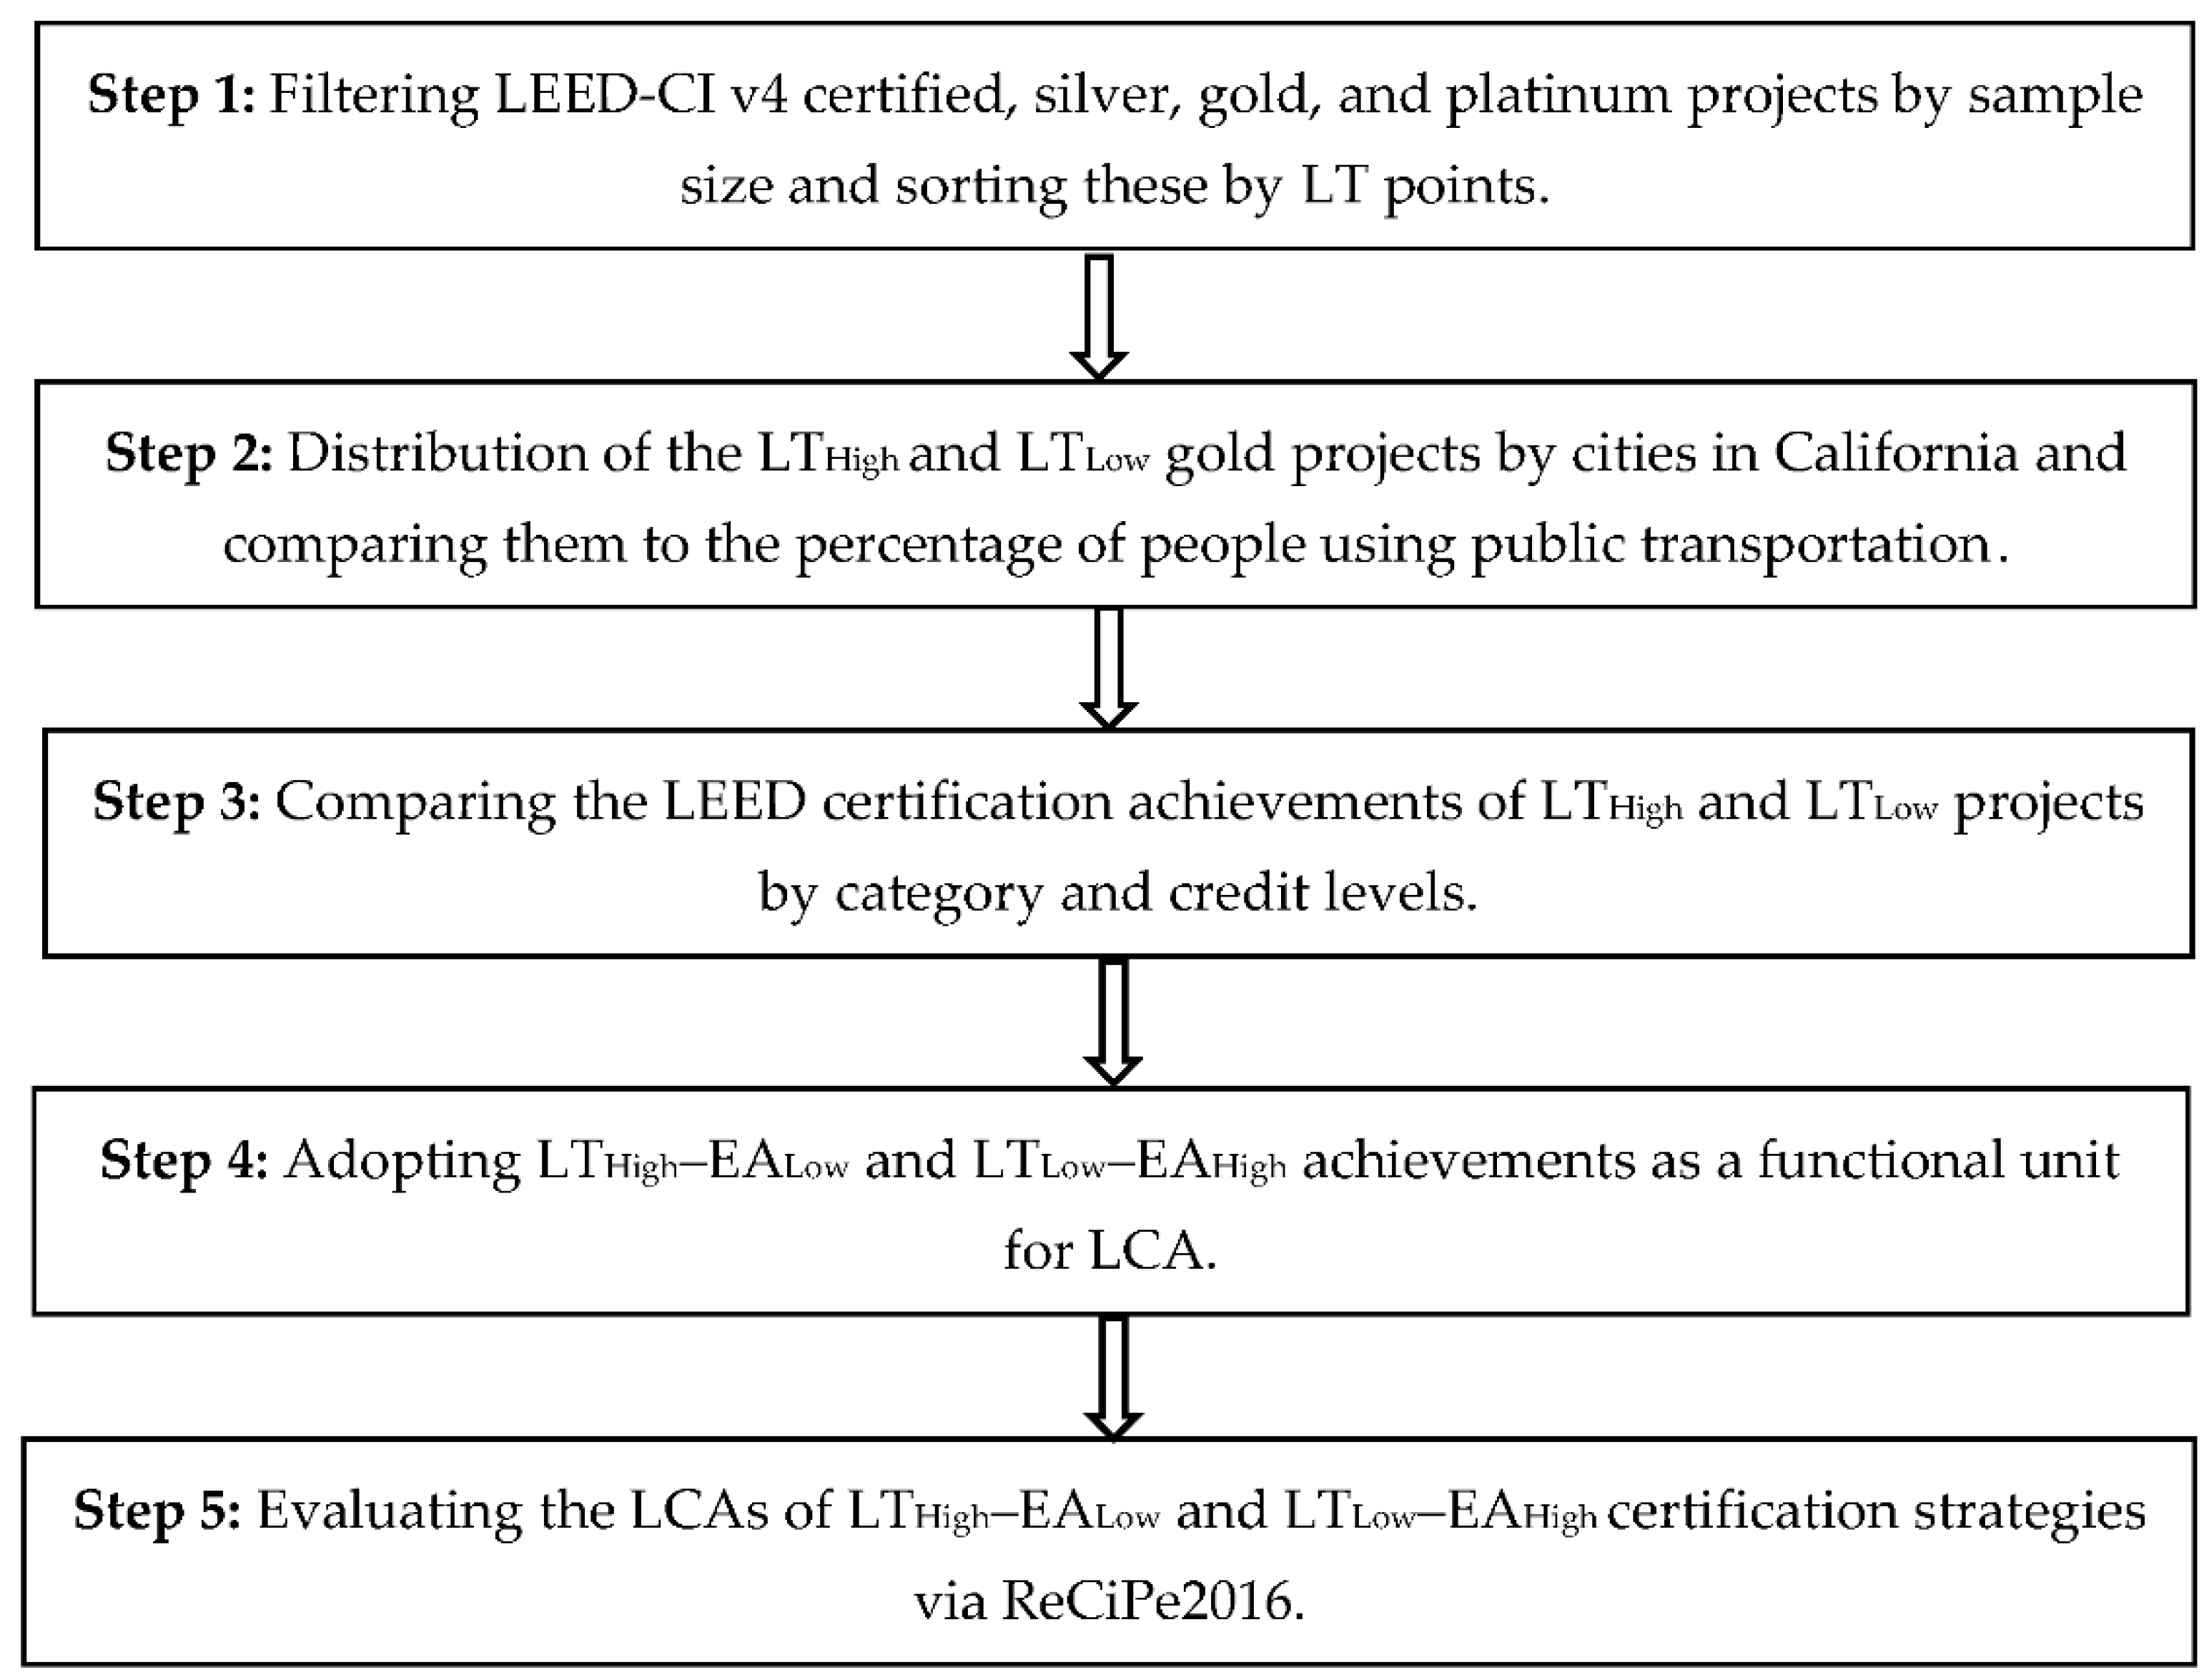
- (1)
- Filtering LEED-CI v4-certified, silver, gold, and platinum projects by sample size and sorting these by LT points resulted in the selection of the most appropriate gold project groups with high and low achievements in the LT category (i.e., LTHigh and LTLow) (Section 2.2.1);
- (2)
- Distribution of the LTHigh and LTLow gold projects by cities in California and comparing them to the percentage of people using public transportation in these cities (Section 2.2.2);
- (3)
- Comparing the LEED certification achievements of the LTHigh projects and the LTLow projects by category (IP, LT, WE, EA, MR, EQ, IN, and RP) and credit levels resulted in two different LT–EA certification strategies: LTHigh–EALow and LTLow–EAHigh (Section 3.1.1);
- (4)
- Adopting LTHigh–EALow and LTLow–EAHigh achievements as a functional unit (FU) for LCA evaluations by converting the LTHigh–EALow LEED points into bus (typical bus) transportation distance (km) and building operational energy (OE) for heating and cooling (kWh) and converting LTLow–EAHigh LEED points into car (typical car or eco-friendly car) transportation distance (km) and building OE for heating and cooling (kWh) (Section 2.3.1);
- (5)
- Evaluating the midpoint impact and endpoint single-score damage results of the LTHigh–EALow (LTHigh: typical bus, EALow: gas) and LTLow–EAHigh (LTLow: typical car, EAHigh: gas and LTLow: eco-friendly car, EAHigh: gas) certification strategies using ReCiPe2016 life-cycle impact assessment methodology (Section 3.2).
2.2. Data Collection
2.2.1. Filtering by Sample Size and Sorting by Location and Transportation (LT) Points
2.2.2. Distribution of LEED-CI v4 Gold-Certified Office Projects in Cities of California According to LTHigh and LTLow Achievement
2.3. Life-Cycle Assessment
2.3.1. Functional Unit
2.3.2. Life-Cycle Inventory
2.3.3. Life-Cycle Impact Assessment
2.4. Statistical Analysis
2.4.1. Choice of Statistical Procedures
2.4.2. Effect Size Interpretation
2.4.3. p-Value Interpretation
3. Results
3.1. Preliminary Results
3.1.1. LEED Certification Achievements of the LTHigh and the LTLow Projects
3.1.2. LCAs of LTHigh–EALow and LTLow–EAHigh
3.2. Evaluating Midpoint Impact and Endpoint Single-Score Damage Results of the LTHigh–EALow and LTLow–EAHigh Certification Strategies
3.2.1. Midpoint Impact Results
3.2.2. Endpoint Single-Score Damage Results
4. Limitations
5. Future Research
6. Conclusions
Funding
Data Availability Statement
Acknowledgments
Conflicts of Interest
Appendix A
References
- Suzer, O. A comparative review of environmental concern prioritization: LEED vs other major certification systems. J. Environ. Manag. 2015, 154, 266–283. [Google Scholar] [CrossRef] [PubMed]
- Greer, F.; Chittick, J.; Jackson, E.; Mack, J.; Shortlidge, M.; Grubert, E. Energy and water efficiency in LEED: How well are LEED points linked to climate outcomes? Energy Build. 2019, 195, 161–167. [Google Scholar] [CrossRef]
- ISO 14040; Environmental Management Life Cycle Assessment Principles and Framework. International Organization for Standardization: Geneva, Switzerland, 2006.
- Singh, R.K. Whole building life cycle assessment through LEED v4. 2017. Available online: https://www.gbci.org/whole-building-life-cycle-assessment-through-leed-v4 (accessed on 15 August 2022).
- Wu, P.; Song, Y.; Shou, W.; Chi, H.; Chong, H.Y.; Sutrisna, M. A comprehensive analysis of the credits obtained by LEED 2009 certified green buildings. Renew. Sustain. Energy Rev. 2017, 68, 370–379. [Google Scholar] [CrossRef]
- Building Codes Assistance Project. ASHRAE 90.1 Standard, Residential Code Status. Available online: https://bcapcodes.org/code-status/residential/ (accessed on 14 July 2022).
- Pushkar, S.; Verbitsky, O. LEED-NCv3 silver and gold certified projects in the US: An observational study. J. Green Build. 2018, 13, 67–83. [Google Scholar] [CrossRef]
- Pushkar, S.; Verbitsky, O. LEED-NC 2009 Silver to Gold Certified Projects in the US in 2012–2017: An Appropriate Statistical Analysis. J. Green Build. 2019, 14, 83–107. [Google Scholar] [CrossRef]
- Pushkar, S. LEED-CI V3 and V4 Gold Projects for Office Spaces: The Difference between Shanghai and California. J. Green Build. 2021, 16, 29–43. [Google Scholar] [CrossRef]
- Scheuer, C.; Keoleian, G. Evaluation of LEED Using Life Cycle Assessment Methods; U.S. Department of Commerce; National Institute of Standards and Technology: Gaithersburg, MD, USA, 2002.
- Humbert, S.; Abeck, H.; Bali, N.; Horvath, A. Leadership in Energy and Environmental Design (LEED). A critical evaluation by LCA and recommendations for improvement. Int. J. LCA 2007, 12, 46–57. [Google Scholar]
- Suh, S.; Tomar, S.; Leighton, M.; Kneifel, J. Environmental Performance of Green Building Code and Certification Systems. Environ. Sci. Technol. 2014, 48, 2551–2560. [Google Scholar] [CrossRef]
- Al-Ghamdi, S.G.; Bilec, M.M. Green Building Rating Systems and Whole-Building Life Cycle Assessment: Comparative Study of the Existing Assessment Tools. J. Archit. Eng. 2017, 23, 4016015. [Google Scholar] [CrossRef]
- Highest Public Transit Usage Cities in California. Available online: https://www.homearea.com/rankings/place-in-ca/percent_using_public_transportation/ (accessed on 14 July 2022).
- USGBC Projects Site. Available online: https://www.usgbc.org/projects (accessed on 14 July 2022).
- GBIG Green Building Data. Available online: http://www.gbig.org (accessed on 14 July 2022).
- Bergmann, R.; Ludbrook, J.; Spooren, W.P.J.M. Different outcomes of the Wilcoxon-Mann-Whitney test from different statistics packages. Am. Stat. 2000, 54, 72–77. [Google Scholar]
- Available online: https://www.homearea.com/place/san-francisco-city-california/0667000/ (accessed on 14 July 2022).
- Available online: https://www.flexas.com/blog/how-much-office-space-per-person (accessed on 14 July 2022).
- Turrentine, T. California: Beyond cars? Bull. At. Sci. 2014, 70, 54–61. [Google Scholar] [CrossRef]
- Dutton, S.M.; Fisk, W.J. Energy and indoor air quality implications of alternative minimum ventilation rates in California offices. Build Environ. 2014, 82, 121–127. [Google Scholar] [CrossRef] [Green Version]
- Burton, E. Effects of California’s Climate Policy in Facilitating CCUS. Energy Procedia 2014, 63, 6959–6972. [Google Scholar] [CrossRef]
- PRé Consultants. SimaPro; Version 9.1. 0.35; PRé Consultants: Amersfoort, The Netherlands, 2019. [Google Scholar]
- Huijbregts, M.A.J.; Steinmann, Z.J.N.; Elshout, P.M.F.; Stam, G.; Verones, F.; Vieira, M.; Zijp, M.; Hollander, A.; van Zelm, R. ReCiPe2016: A harmonised life cycle impact assessment method at midpoint and endpoint level. Int. J. Life Cycle Assess. 2017, 22, 138–147. [Google Scholar] [CrossRef]
- ReCiPe 2016 v1.1. A Harmonized Life Cycle Impact Assessment Method at Midpoint and Endpoint Level Report I: Characterization. Available online: file:///C:/Users/user/Documents/Grant%20ISF/Report_ReCiPe_2017.pdf (accessed on 10 February 2021).
- Pushkar, S. Relationship between Project Space Types, Optimize Energy Performance Credit, and Project Size in LEED-NC Version 4 (v4) Projects: A Case Study. Buildings 2022, 12, 862. [Google Scholar] [CrossRef]
- Cliff, N. Dominance statistics: Ordinal analyses to answer ordinal questions. Psychol. Bull. 1993, 114, 494–509. [Google Scholar] [CrossRef]
- Routledge, R.D. Resolving the conflict over Fisher’s exact test. Can. J. Statist. 1992, 20, 201–209. Available online: https://www.jstor.org/stable/3315468 (accessed on 14 July 2022). [CrossRef]
- Fleiss, J.L. Statistical Methods for Rates and Proportions, 2nd ed.; Wiley: New York, NY, USA, 1981. [Google Scholar]
- Bland, J.M.; Altman, D.G. The odds ratio. BMJ 2000, 320, 1468. [Google Scholar] [CrossRef]
- Romano, J.; Corragio, J.; Skowronek, J. Appropriate statistics for ordinal level data: Should we really be using t-test and Cohen’s d for evaluating group differences on the NSSE and other surveys? In Proceedings of the Annual Meeting of the Florida Association of Institutional Research, Cocoa Beach, FL, USA, 1–3 February 2006; Florida Association for Institutional Research: Cocoa Beach, FL, USA, 2006; pp. 1–33. [Google Scholar]
- Chen, H.; Cohen, P.; Chen, S. How big is a big odds ratio? How big is a big odds ratio? Interpreting the magnitudes of odds ratios in epidemiological studies. Commun. Stat. Simul. Comput. 2010, 39, 860–864. [Google Scholar] [CrossRef]
- Altomonte, S.; Schiavon, S.; Kent, M.G.; Brager, G. Indoor environmental quality and occupant satisfaction in green-certified buildings. Build. Res. Inform. 2017, 47, 255–274. [Google Scholar] [CrossRef]
- Vargha, A.; Delaney, H.D. A critique and improvement of the CL common language effect size statistics of McGraw and Wong. J. Educ. Behav. Stat. 2000, 25, 101–132. [Google Scholar]
- Hurlbert, S.H.; Lombardi, C.M. Final collapse of the Neyman-Pearson decision theoretic framework and rise of the neoFisherian. Ann. Zool. Fenn. 2009, 46, 311–349. Available online: https://www.jstor.org/stable/23736900 (accessed on 14 July 2022). [CrossRef]
- Ismaeel, W.S.E. Sustainable site selection using system dynamics; case study LEED-certified project. Archit. Eng. Des. Manag. 2022, 18, 368–386. [Google Scholar] [CrossRef]
- LEED-CIv4. LEED v4 for Interior Design and Construction. 2014. Available online: https://www.usgbc.org/education/sessions/leed-v4-interior-design-construction-4892445 (accessed on 10 June 2022).
- Pushkar, S. The LEED-commercial interiors (V4) projects in California. J. Green Build. 2021, 16, 57–72. [Google Scholar] [CrossRef]


| Certified group | Low performance in LTLow (2–3 points) | Intermediate performance in LT (4–12 points) | High performance in LTHigh (15–17 points) | |
| Number of projects | 5 | 6 | 9 | |
| Silver group | Low performance in LTLow (0–5 points) | Intermediate performance in LT (8–14 points) | High performance in LTHigh (15–18 points) | |
| Number of projects | 12 | 13 | 11 | |
| Gold group | Low performance in LTLow(1–3 points) | Intermediate-low performance in LT (4–8 points) | Intermediate-high performance in LT (14–15 points) | High performance in LTHigh (17–18 points) |
| Number of projects | 12 | 5 | 9 | 14 |
| Platinum group | Low performance in LTLow (9 points) | Intermediate performance in LT (15 points) | High performance in LTHigh (17–18 points) | |
| Number of projects | 1 | 1 | 3 | |
| City | Percent Using Public Transportation a | Number of LEED Projects | |
|---|---|---|---|
| LTLow (1–3 Points Achieved) b | LTHigh (17–18 Points Achieved) b | ||
| San Francisco | 34.7 | – | 13 |
| Los Angeles | 8.9 | – | 1 |
| Mountain View | 8.8 | 1 | – |
| Fremont | 8.1 | 1 | – |
| Sunnyvale | 7.6 | 5 | – |
| San Diego | 4.0 | 1 | – |
| Roseville | No data | 1 | – |
| Rancho Cordova | No data | 1 | – |
| Menlo Park | No data | 1 | – |
| Brisbane | No data | 1 | – |
| Total Number of LEED Projects | 12 | 14 | |
| Process | Data Source [23] |
|---|---|
| Transportation by a typical bus | Transport, regular bus/CH S |
| Transportation by a typical car | Transport, passenger car, natural gas/CH S |
| Transportation by an eco-friendly car | Transport, passenger car, diesel, EURO5, city car/CH S |
| Operational energy (OE) | Electricity by fuel, gas, electricity, natural gas, at power plant/US S |
| Process | GW (kg CO2 eq) | HCT (kg 1,4-DCB) | Hn-CT (kg 1,4-DCB) | TE (kg 1,4-DCB) |
|---|---|---|---|---|
| Typical bus (1 personkm) | 0.10500 | 0.00245 | 0.00232 | 0.14800 |
| Typical car (1 personkm) | 0.17000 | 0.00794 | 0.00895 | 0.20900 |
| Eco-friendly car (1 personkm) | 0.05390 | 0.00323 | 0.00471 | 0.10900 |
| OE: electricity (1 kWh) | 0.75100 | 0.00004 | 0.06210 | 0.00645 |
| Category | Possible Points | Median, 25–75th Percentiles | p-Value | ||
|---|---|---|---|---|---|
| LTLow | LTHigh | ||||
| Integrative process (IP) | 2 | 1.0 0.5–2.0 | 2.0 0.0–2.0 | −0.15 | 0.4797 |
| Location and transportation (LT) | 18 | 3.0 2.0–3.0 | 17.0 17.0–18.0 | −1.00 | 0.00001 |
| Water efficiency (WE) | 12 | 8.0 7.0–10.0 | 6.0 6.0–8.0 | 0.39 | 0.0991 |
| Energy and atmosphere (EA) | 38 | 27.5 24.5–30.5 | 16.0 14.0–22.0 | 0.82 | 0.0001 |
| Materials and resources (MR) | 13 | 5.5 5.0–6.5 | 5.0 5.0–6.0 | 0.26 | 0.2720 |
| Indoor environmental quality (EQ) | 17 | 9.0 8.0–9.5 | 7.0 6.0–8.0 | 0.49 | 0.0282 |
| Innovation (IN) | 6 | 6.0 5.5–6.0 | 5.0 4.0–6.0 | 0.54 | 0.0169 |
| Regional priority (RP) | 4 | 3.0 3.0–4.0 | 3.0 3.0–4.0 | −0.02 | 1.0000 |
| LEED total | 79 | 62.5 61.0–64.5 | 63.0 60.0–64.0 | 0.01 | 0.9687 |
| Credit | Possible Points | Median, 25–75th Percentiles | p-Value | ||
|---|---|---|---|---|---|
| LTLow | LTHigh | ||||
| Location and Transportation | |||||
| LTc2, surrounding density and diverse uses a | 8 | 2.0 1.0–2.0 | 8.0 8.0–8.0 | −1.00 | 0.00001 |
| LTc3, access to quality transit a | 7 | 0.0 0.0–0.0 | 7.0 7.0–7.0 | −1.00 | 0.00001 |
| LTc4, bicycle facilities b | 1 | 1.0 1.0–1.0 | 0.5 0.0–1.0 | 1.61 | 0.0738 |
| LTc5, reduced parking footprint a | 2 | 0.0 0.0–0.0 | 2.0 2.0–2.0 | −1.00 | 0.00001 |
| Energy and Atmosphere | |||||
| EAc1, enhanced commissioning a | 5 | 4.0 4.0–5.0 | 4.0 4.0–5.0 | 0.01 | 0.9414 |
| EAc2, advanced energy metering a | 2 | 1.0 1.0–2.0 | 0.0 0.0–1.0 | 0.47 | 0.0241 |
| EAc3, renewable energy production a | 3 | 0.0 0.0–0.5 | 0.0 0.0–0.0 | 0.25 | 0.1692 |
| EAc4 b, enhanced refrigerant management b | 1 | 1.0 0.5–1.0 | 0.0 0.0–0.0 | 2.40 | 0.0121 |
| EAc5, green power and carbon offsets a | 2 | 0.5 0.0–2.0 | 2.0 0.0–2.0 | −0.12 | 0.6951 |
| EAc6, optimize energy performance a | 25 | 20.0 19.5–21.5 | 9.0 7.0–17.0 | 0.80 | 0.0002 |
| Project Address | LTc3 a | EAc6 a | EAc6 b | EAc6 b |
|---|---|---|---|---|
| (7 Possible Points) | (25 Possible Points) | (%) | (kWh·Day·20 m2) | |
| 523 W 6th St., Los Angeles | 7 | 17 | 14 | 5.5 |
| 235 Pine St., San Francisco | 7 | 8 | 6 | 6.0 |
| 350 California St., San Francisco | 7 | 10 | 7 | 6.0 |
| 111 Sutter St., San Francisco | 7 | 6 | 5 | 6.1 |
| 4 Embarcadero Center, San Francisco | 7 | 8 | 6 | 6.0 |
| 350 Rhode Island St., San Francisco | 7 | 7 | 6 | 6.0 |
| 4 Embarcadero St., San Francisco | 7 | 4 | 4 | 6.1 |
| 440 Turk St., San Francisco | 7 | 18 | 15 | 5.4 |
| 333 Valencia St., San Francisco | 7 | 17 | 14 | 5.5 |
| 1 Front St., San Francisco | 7 | 25 | 28 | 4.6 |
| 945 Bryant St., San Francisco | 7 | 15 | 12 | 5.6 |
| 1088 Sansome St., San Francisco | 7 | 10 | 7 | 6.0 |
| 1725 Third St., San Francisco | 6 | 7 | 6 | 6.0 |
| 1655 Third St., San Franco | 6 | 7 | 6 | 6.0 |
| Project Address | LTc3 a | EAc6 a | EAc6 b | EAc6 b |
|---|---|---|---|---|
| (7 Possible Points) | (25 Possible Points) | (%) | (kWh·Day·20 m2) | |
| 90 N. Mary Ave, Sunnyvale | 0 | 19 | 16 | 5.4 |
| 1200 Sierra Point Pkwy, Brisbane | 0 | 22 | 20 | 5.1 |
| 1050 Enterprise Way, Sunnyvale | 0 | 21 | 18 | 5.2 |
| 1620 E. Roseville Parkway, Roseville | 0 | 20 | 17 | 5.3 |
| 10888 White Rock Road, Rancho Cordova | 0 | 24 | 24 | 4.9 |
| 7650 Mission Valley Rd, San Diego | 0 | 14 | 11 | 5.7 |
| 625 N. Mary Ave, Sunnyvale | 0 | 20 | 17 | 5.3 |
| 925 W. Maude Ave, Sunnyvale | 0 | 20 | 17 | 5.3 |
| 220 Jefferson Dr, Menlo Park | 0 | 18 | 15 | 5.4 |
| 6530 Paseo Padre Pkwy, Fremont | 0 | 24 | 24 | 4.9 |
| 800 N. Mary Ave, Sunnyvale | 0 | 21 | 18 | 5.2 |
| 700 E. Middlefield Rd, Mountain View | 2 | 20 | 17 | 5.3 |
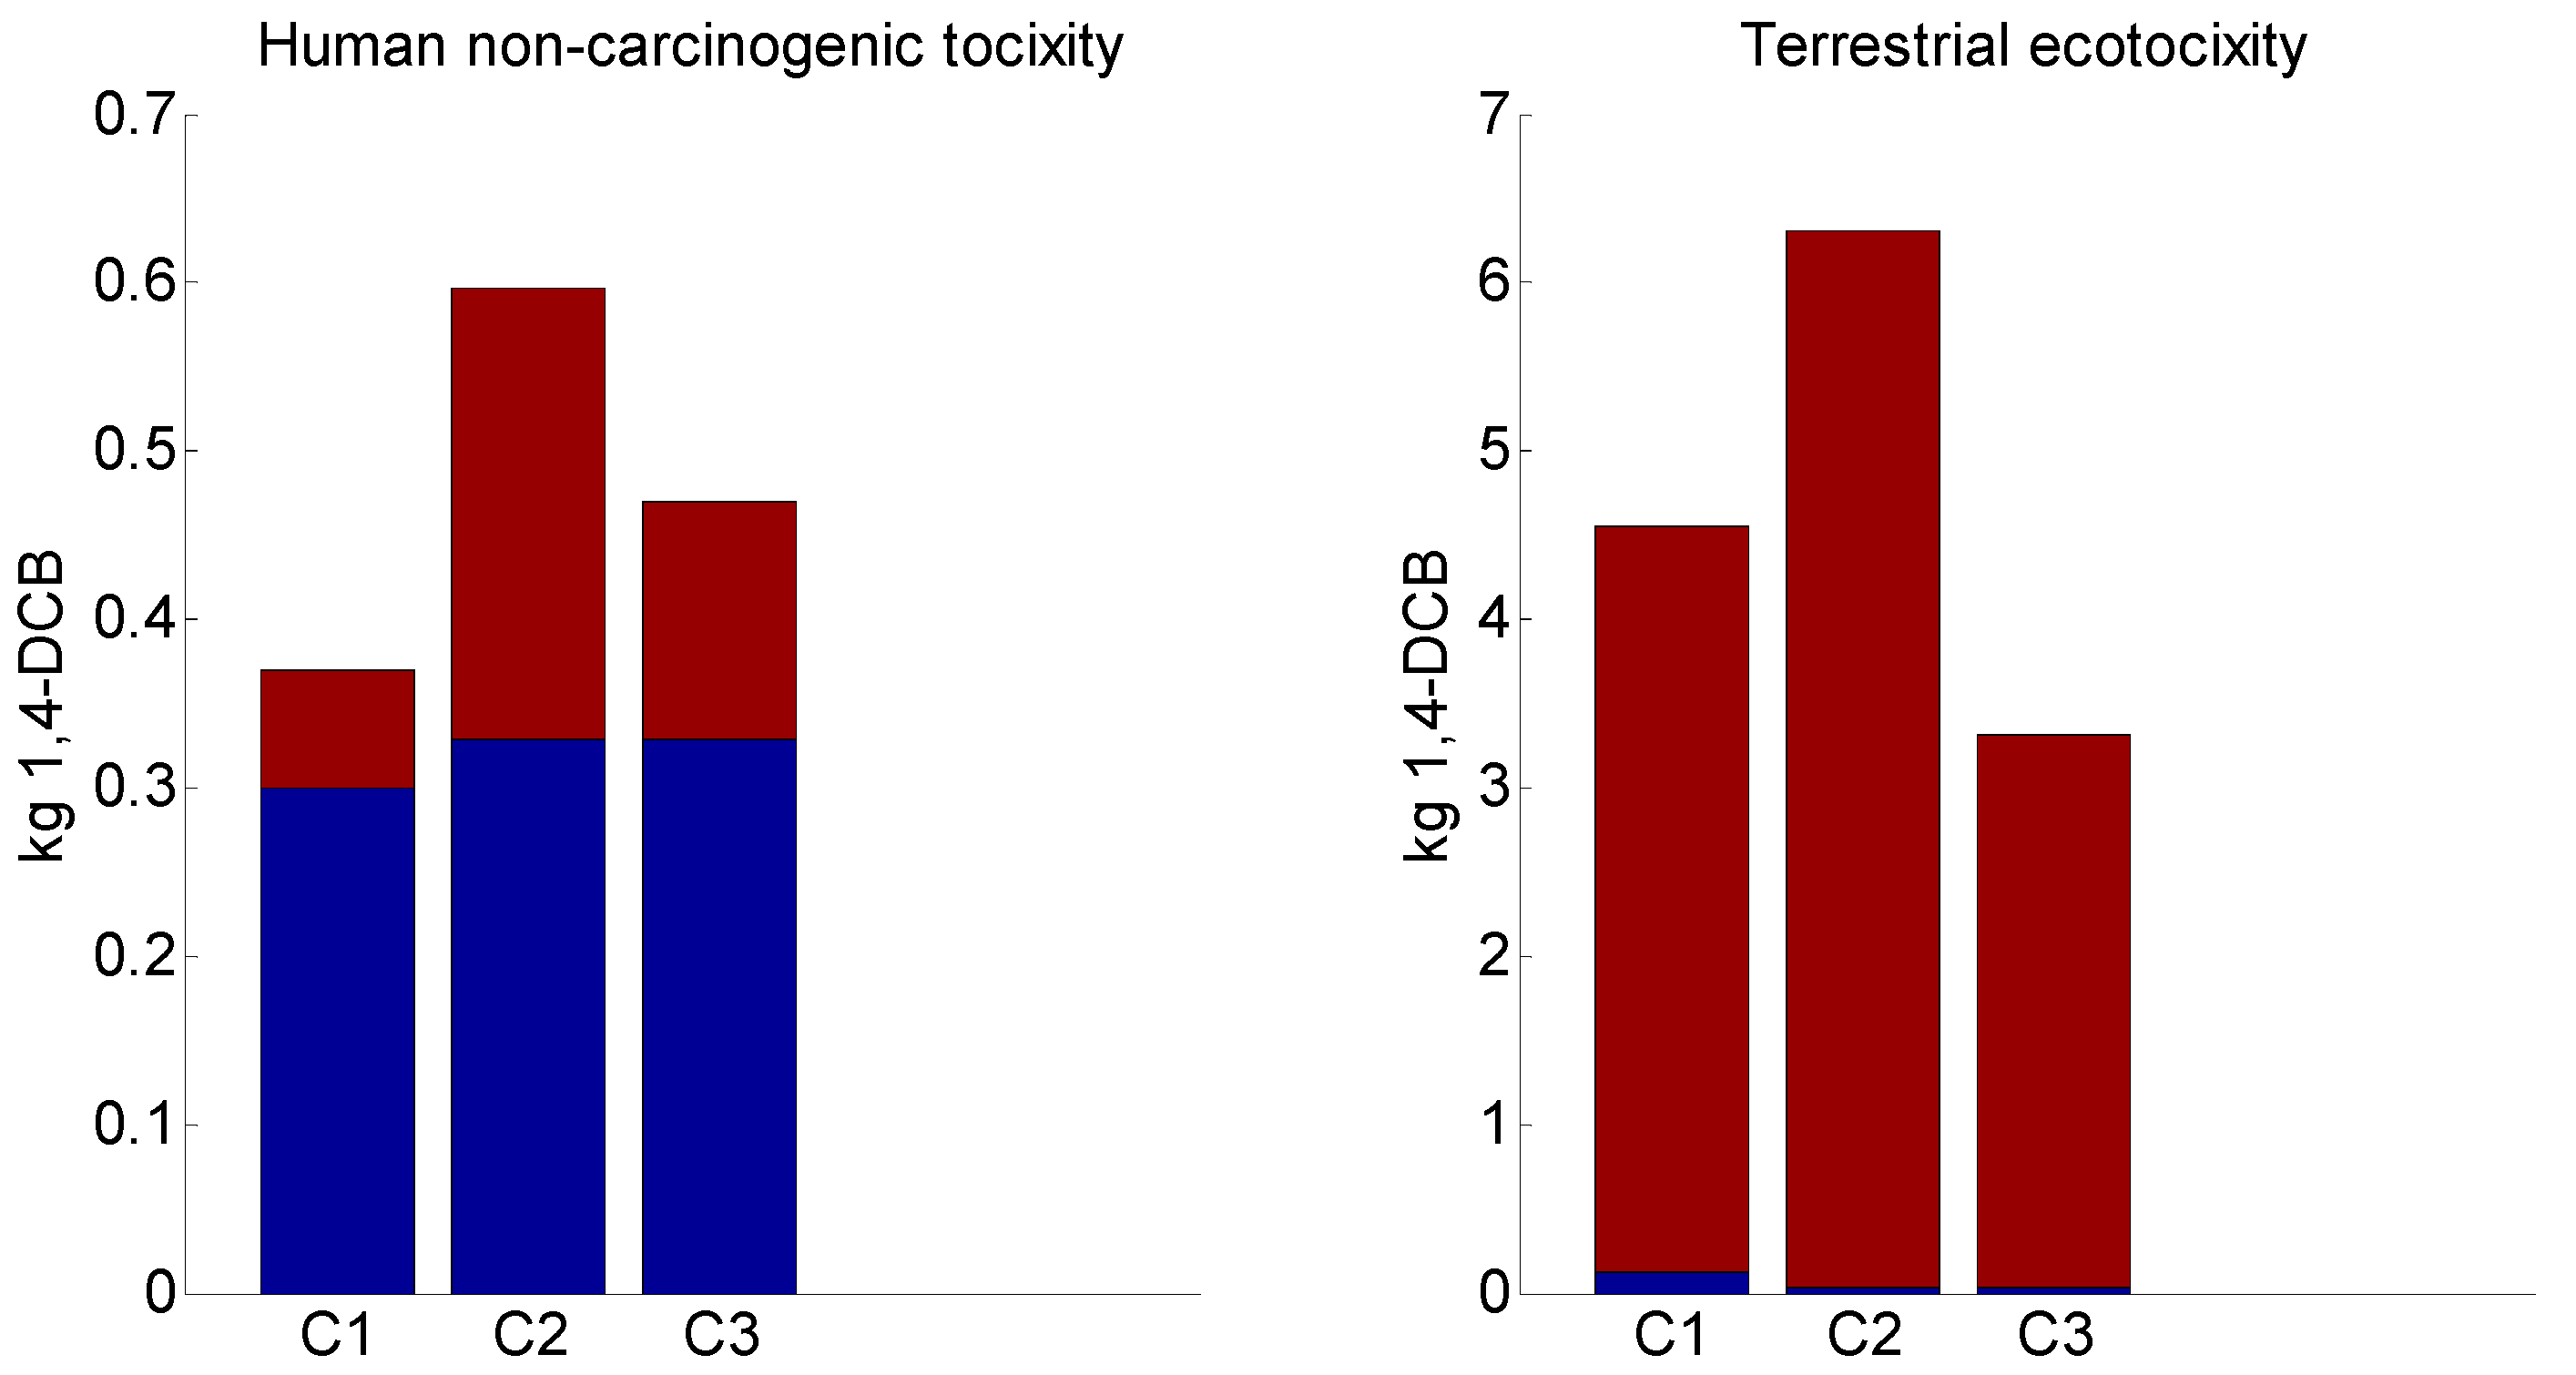
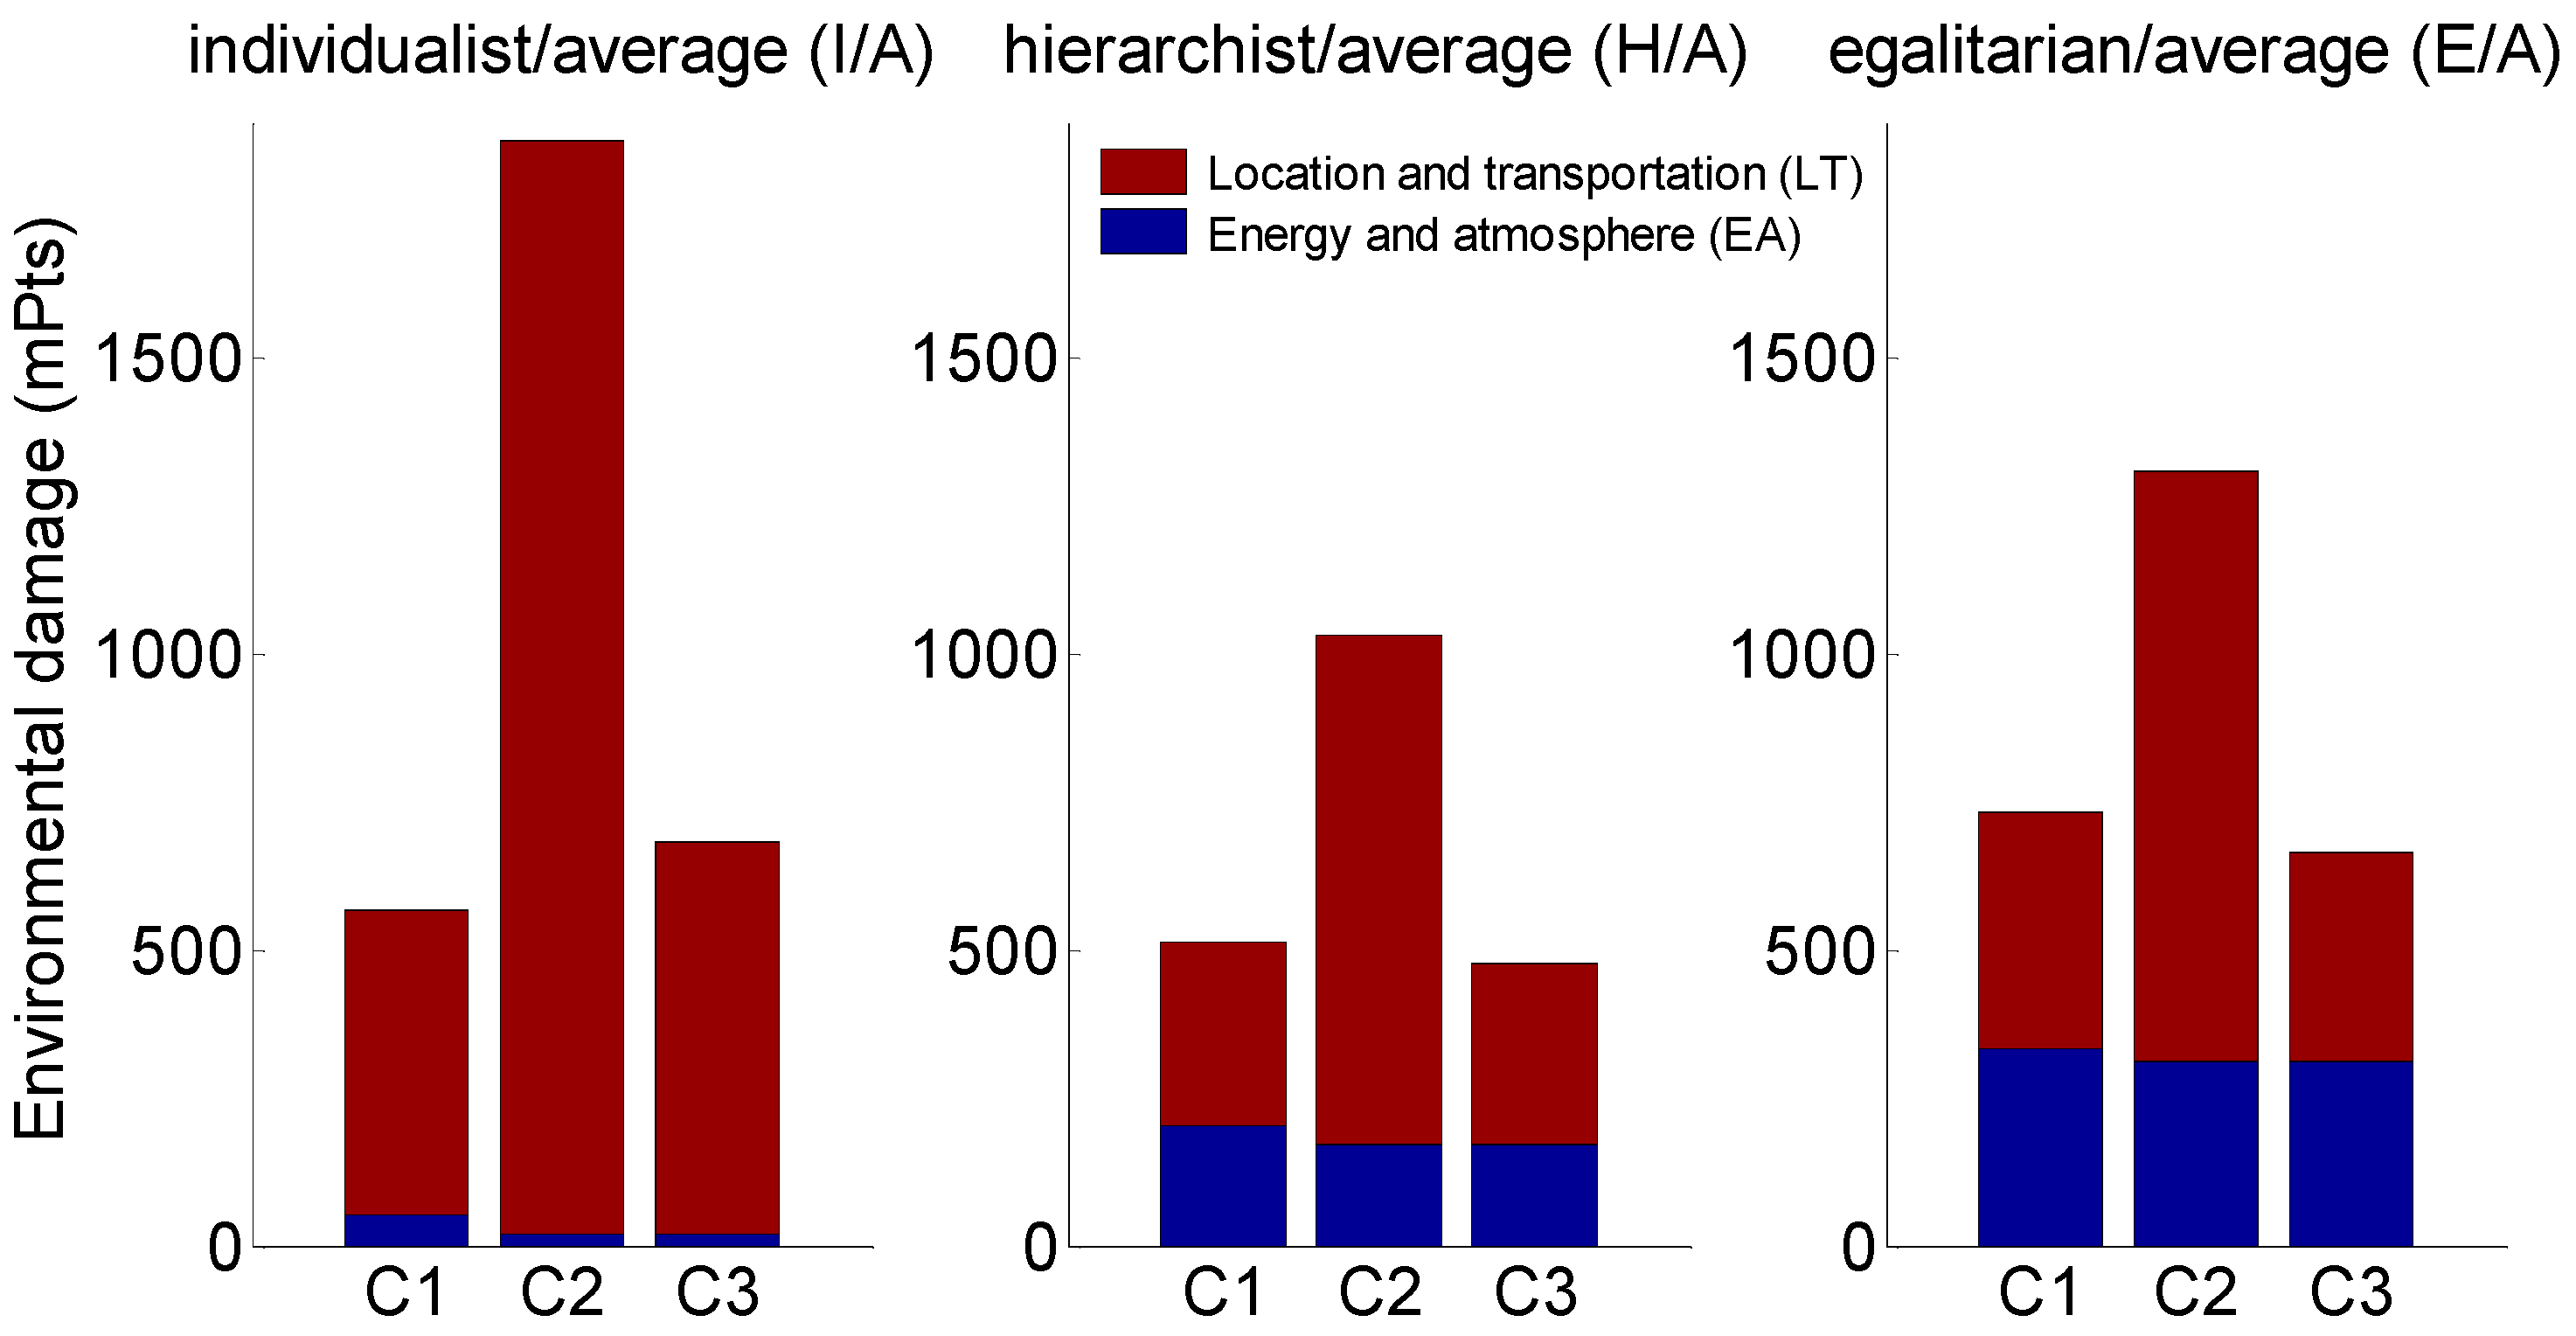
| Methodology | Median, 25–75th Percentiles | p-Value (Cliff’s ) | |||
|---|---|---|---|---|---|
| LTHigh: Typical Bus, EALow: Gas (C1) | LTLow: Typical Car, EAHigh: Gas (C2) | LTLow: Eco-Friendly Car, EAHigh: Gas (C3) | C1 versus C2 | C1 versus C3 | |
| I/A | 567 563—567 | 1871 1870—1871 | 683 682—683 | 0.0000002 (−1.00) | 0.0000002 (−1.00) |
| H/A | 512 495—512 | 1034 1029—1040 | 479 476—485 | 0.0000002 (−1.00) | 0.0001 (0.85) |
| E/A | 734 706—734 | 1311 1302—1314 | 665 656—668 | 0.0000002 (−1.00) | 0.00001 (0.89) |
Publisher’s Note: MDPI stays neutral with regard to jurisdictional claims in published maps and institutional affiliations. |
© 2022 by the author. Licensee MDPI, Basel, Switzerland. This article is an open access article distributed under the terms and conditions of the Creative Commons Attribution (CC BY) license (https://creativecommons.org/licenses/by/4.0/).
Share and Cite
Pushkar, S. Life-Cycle Assessment in the LEED-CI v4 Categories of Location and Transportation (LT) and Energy and Atmosphere (EA) in California: A Case Study of Two Strategies for LEED Projects. Sustainability 2022, 14, 10893. https://doi.org/10.3390/su141710893
Pushkar S. Life-Cycle Assessment in the LEED-CI v4 Categories of Location and Transportation (LT) and Energy and Atmosphere (EA) in California: A Case Study of Two Strategies for LEED Projects. Sustainability. 2022; 14(17):10893. https://doi.org/10.3390/su141710893
Chicago/Turabian StylePushkar, Svetlana. 2022. "Life-Cycle Assessment in the LEED-CI v4 Categories of Location and Transportation (LT) and Energy and Atmosphere (EA) in California: A Case Study of Two Strategies for LEED Projects" Sustainability 14, no. 17: 10893. https://doi.org/10.3390/su141710893
APA StylePushkar, S. (2022). Life-Cycle Assessment in the LEED-CI v4 Categories of Location and Transportation (LT) and Energy and Atmosphere (EA) in California: A Case Study of Two Strategies for LEED Projects. Sustainability, 14(17), 10893. https://doi.org/10.3390/su141710893


