Impact of Land Use/Cover Change on Ecosystem Service Value in Guangxi
Abstract
:1. Introduction
2. Materials and Methods
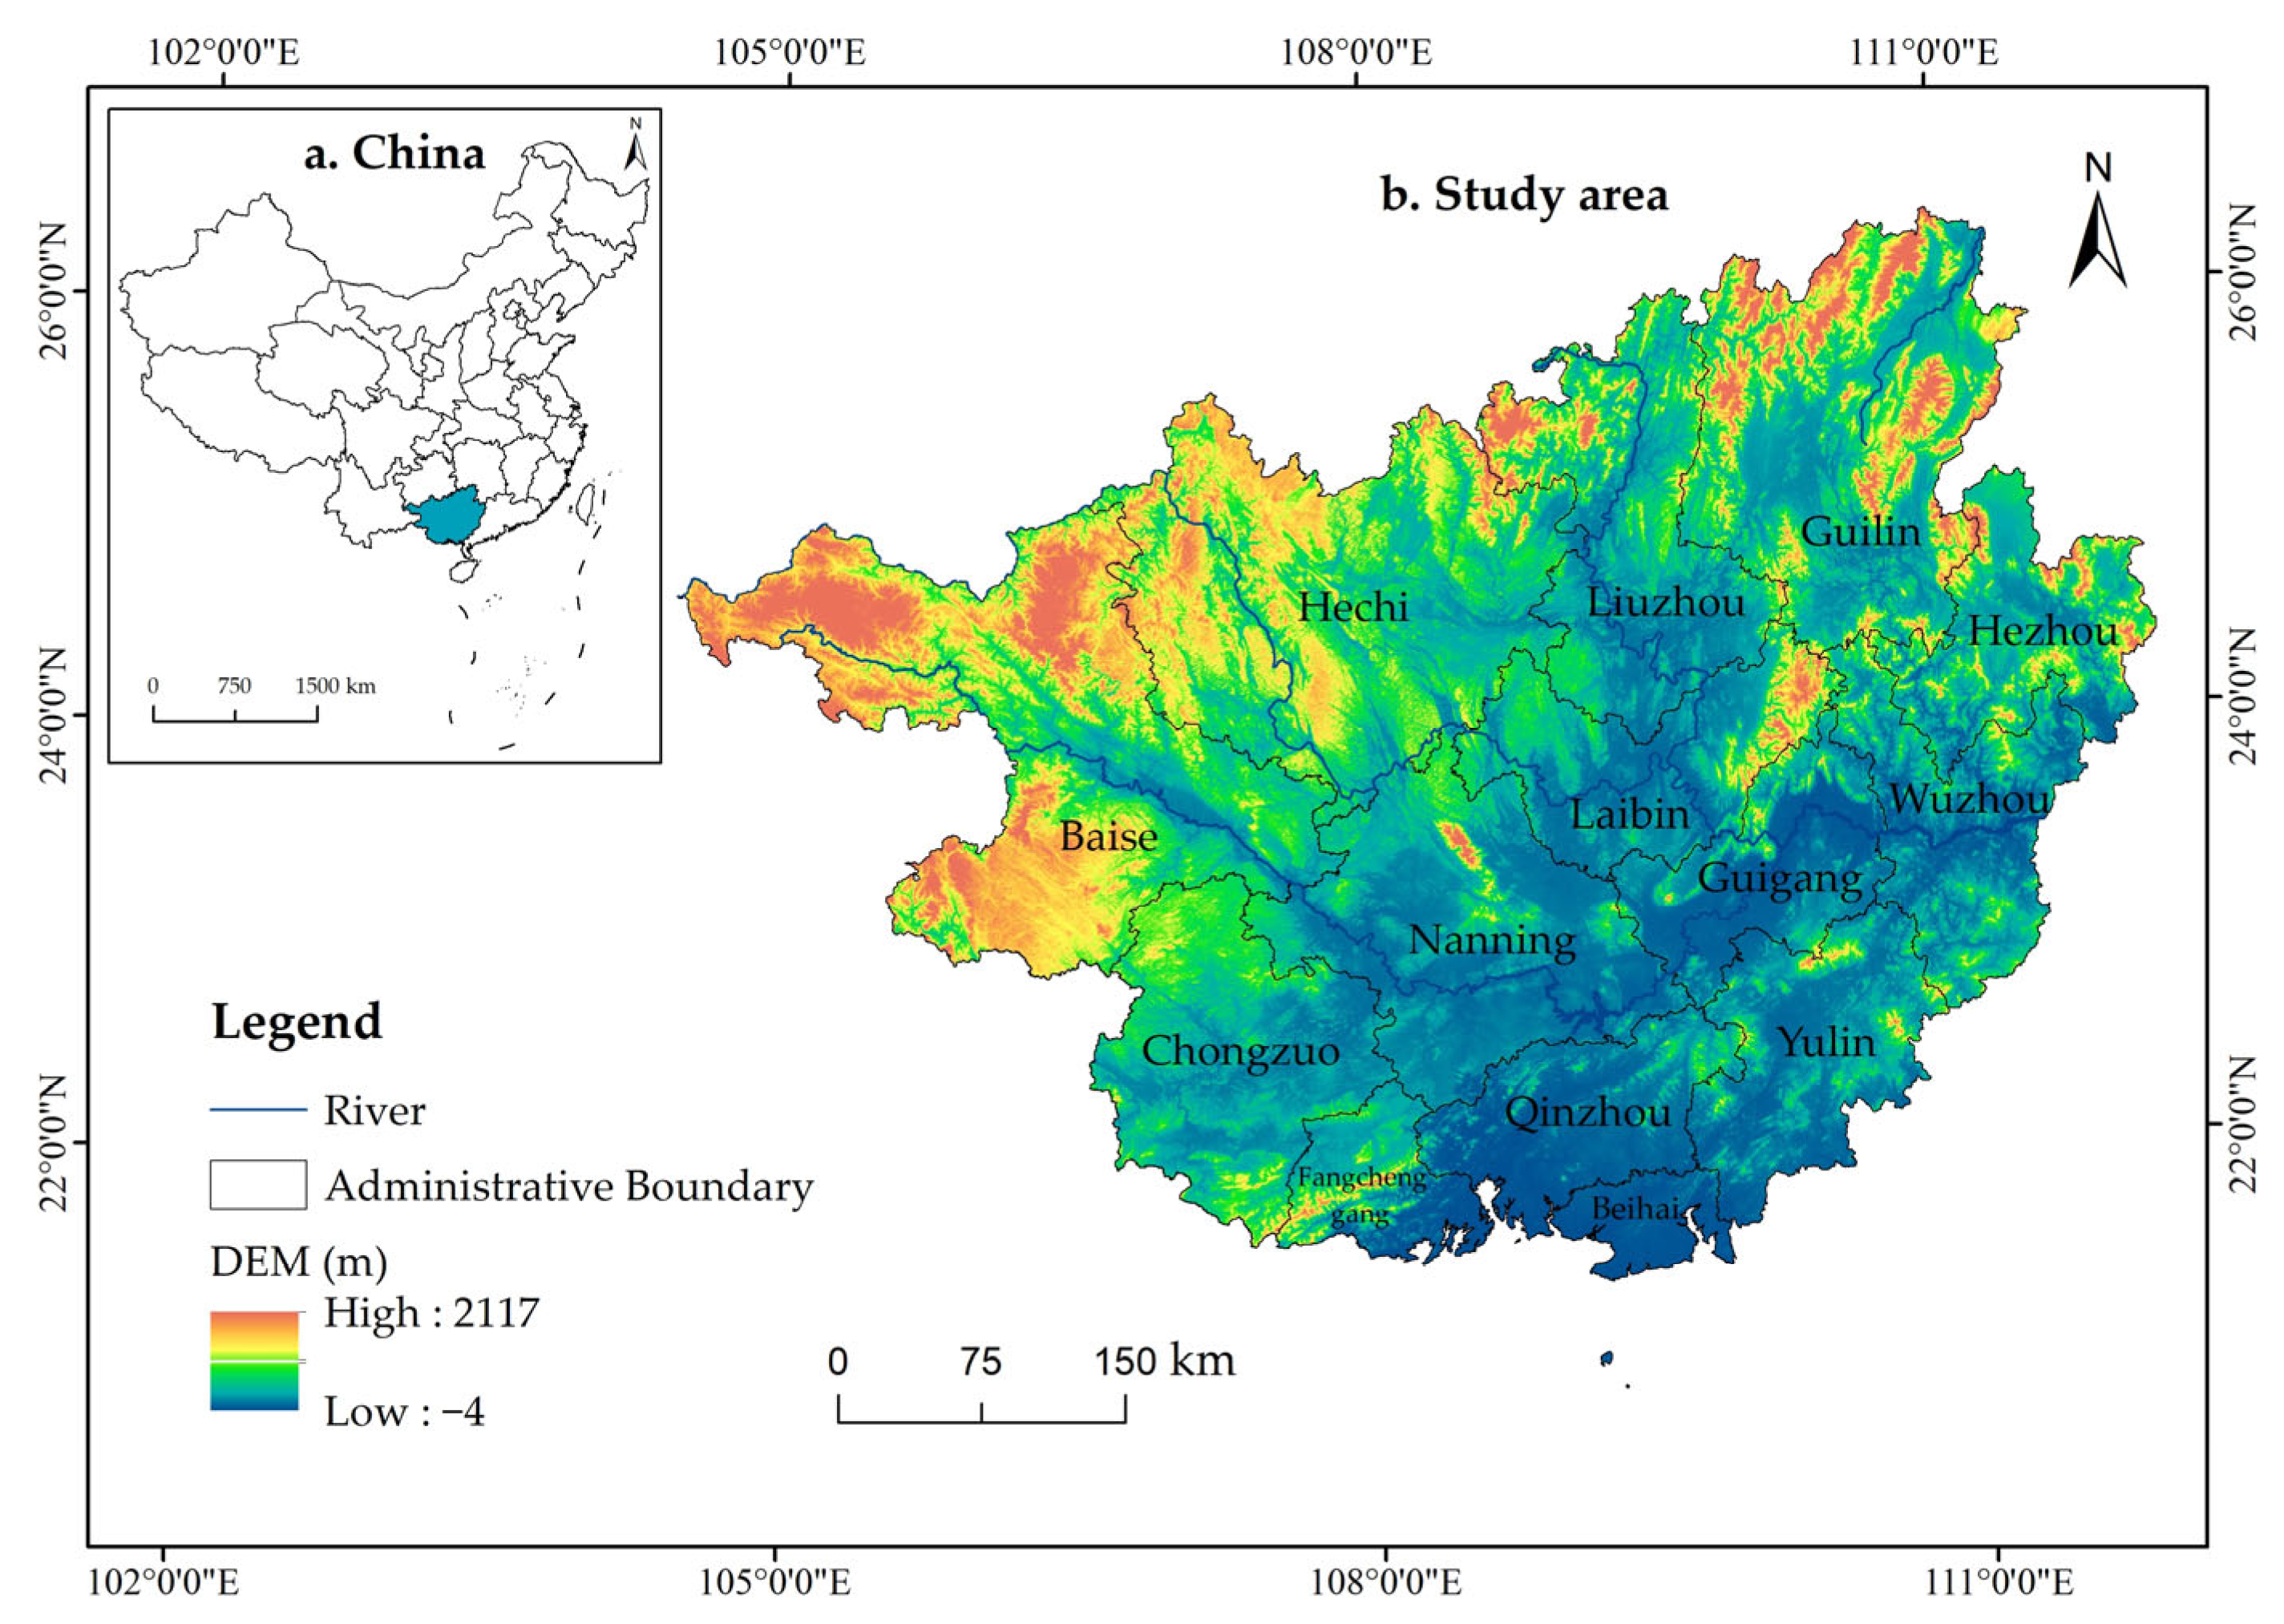
2.1. Overview of the Study Area
2.2. Data Sources
2.3. Methods
2.3.1. Single Dynamic Degree of Land Use
2.3.2. Land Use Transfer Matrix
2.3.3. Unit Area Equivalent Factor Method
2.3.4. Contribution of Ecosystem Service Value Variation
2.3.5. Spatial Autocorrelation Analysis
2.3.6. Getis-Ord’s Gi*
3. Results
3.1. Analysis of Land Use/Cover Change in Guangxi
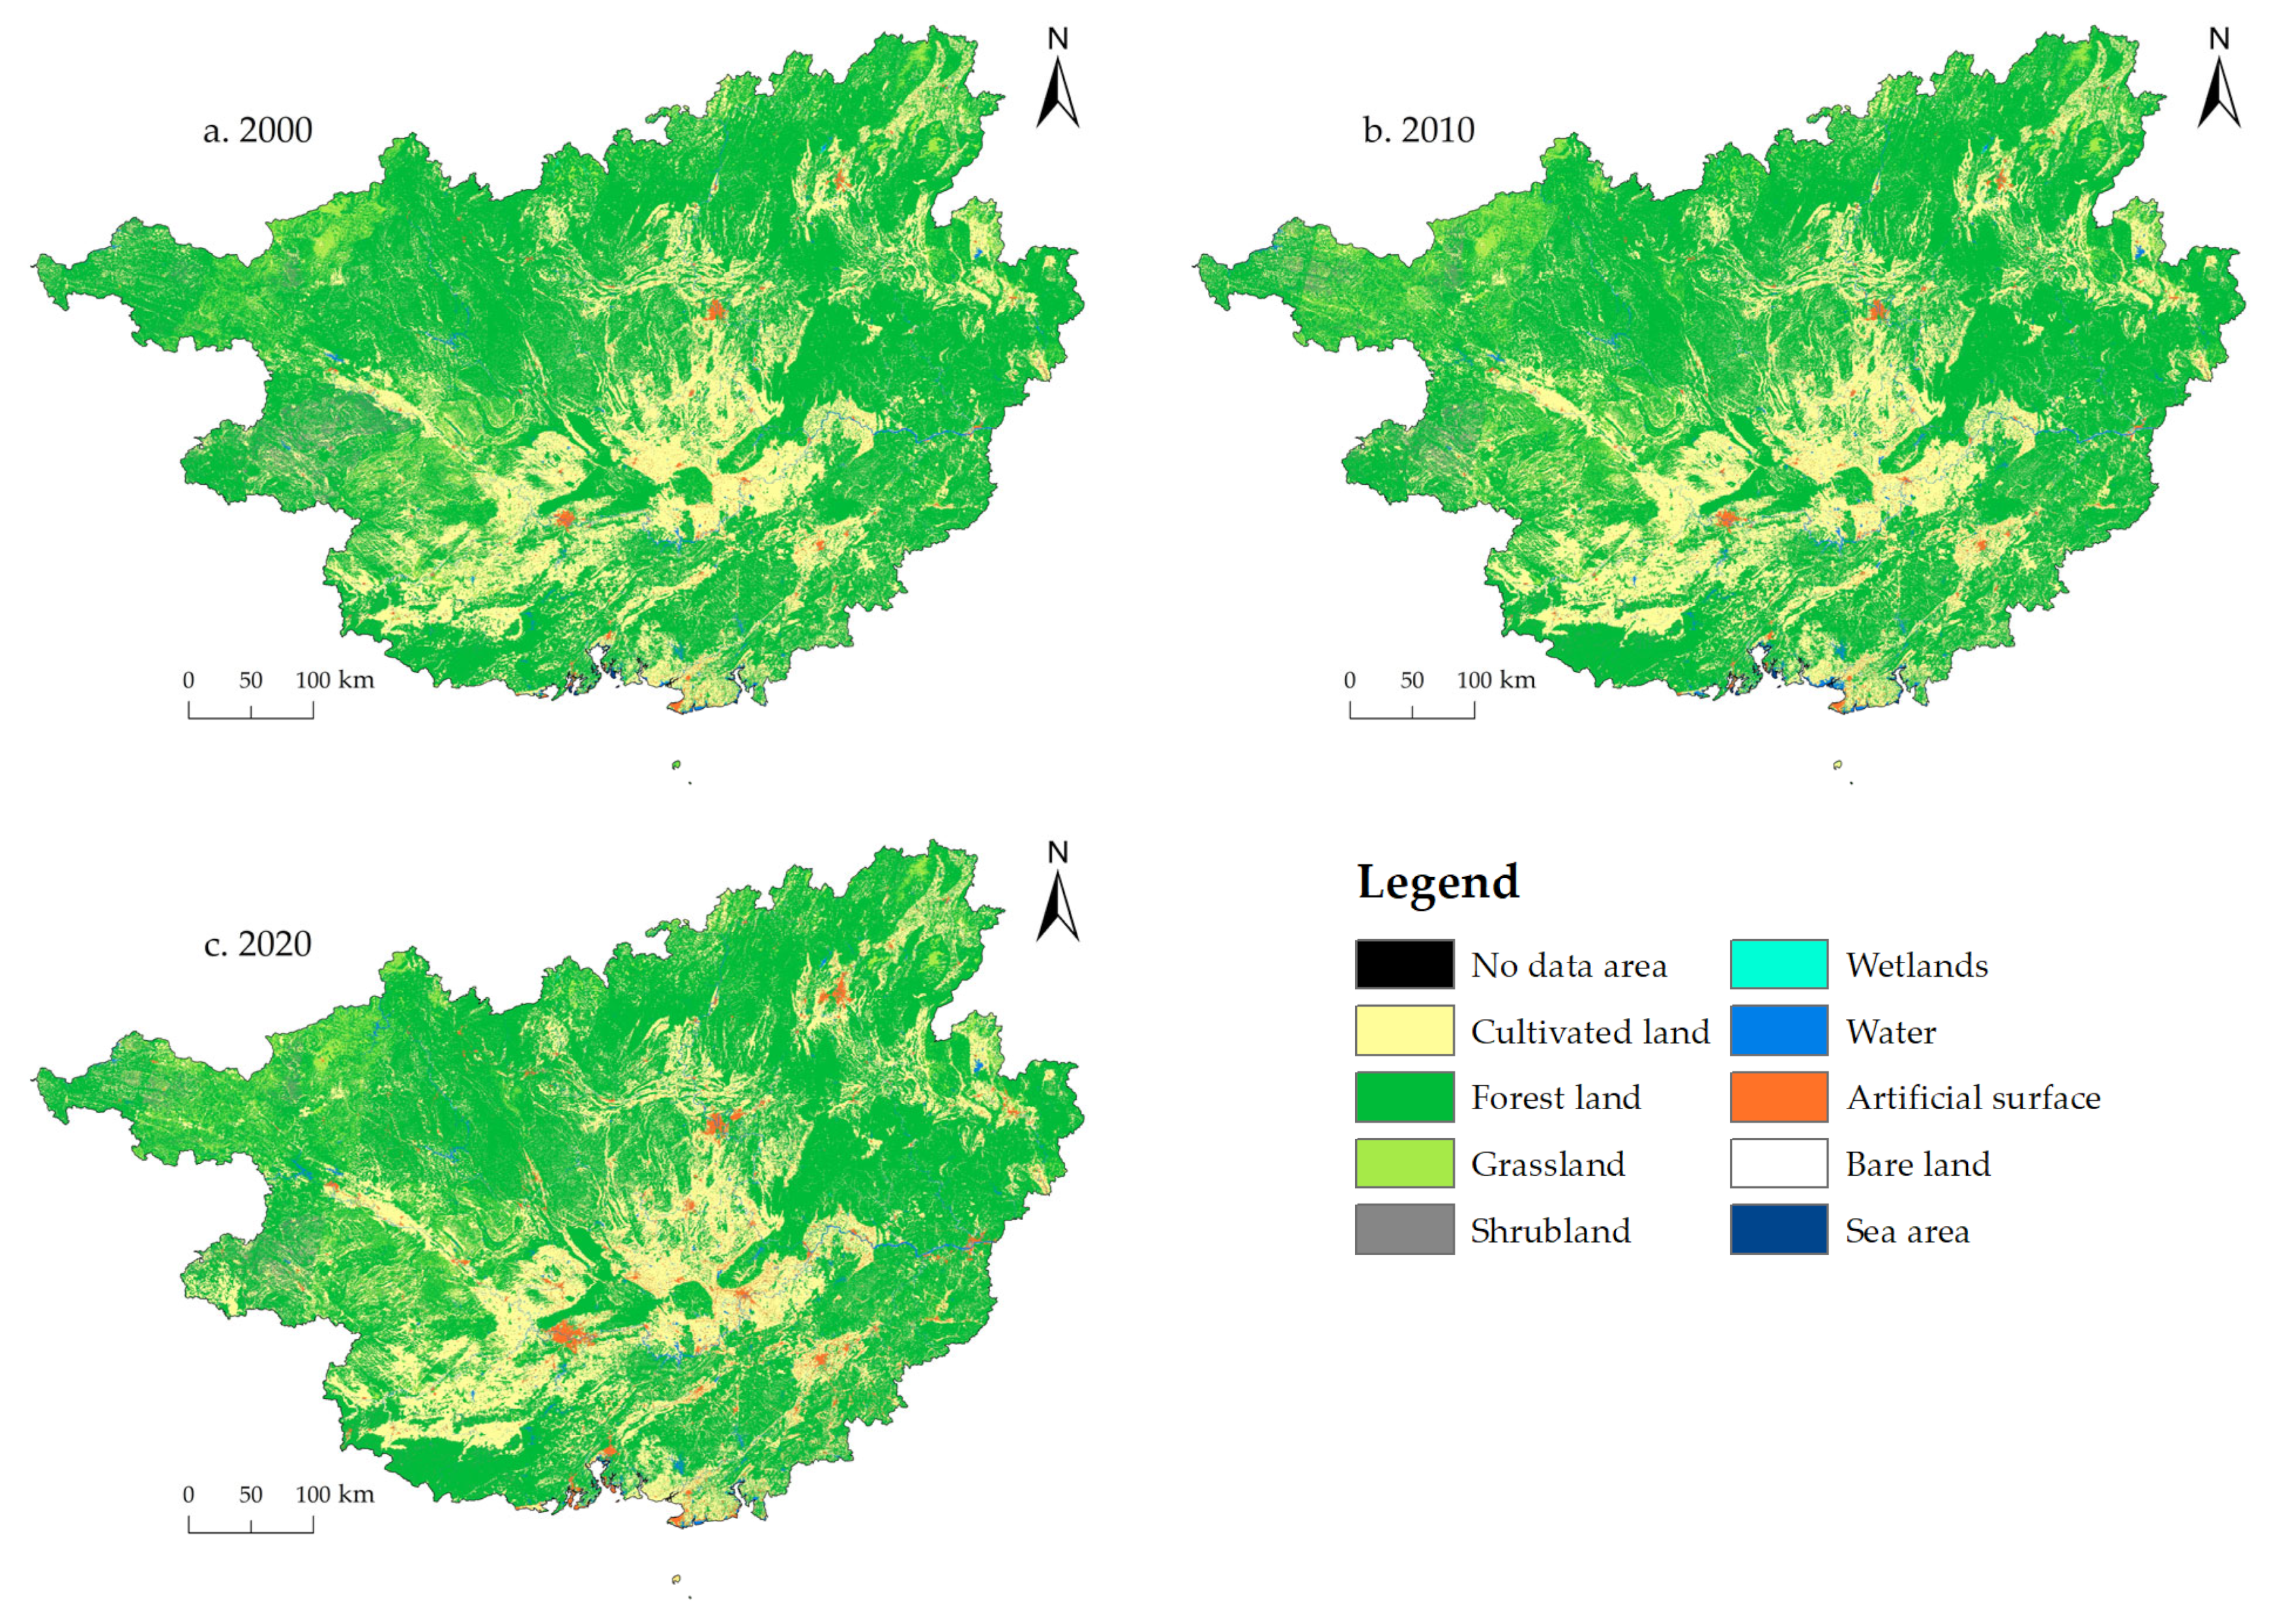
3.1.1. Analysis of Land Use/Cover Situation and Land Use Dynamic Attitude in Guangxi
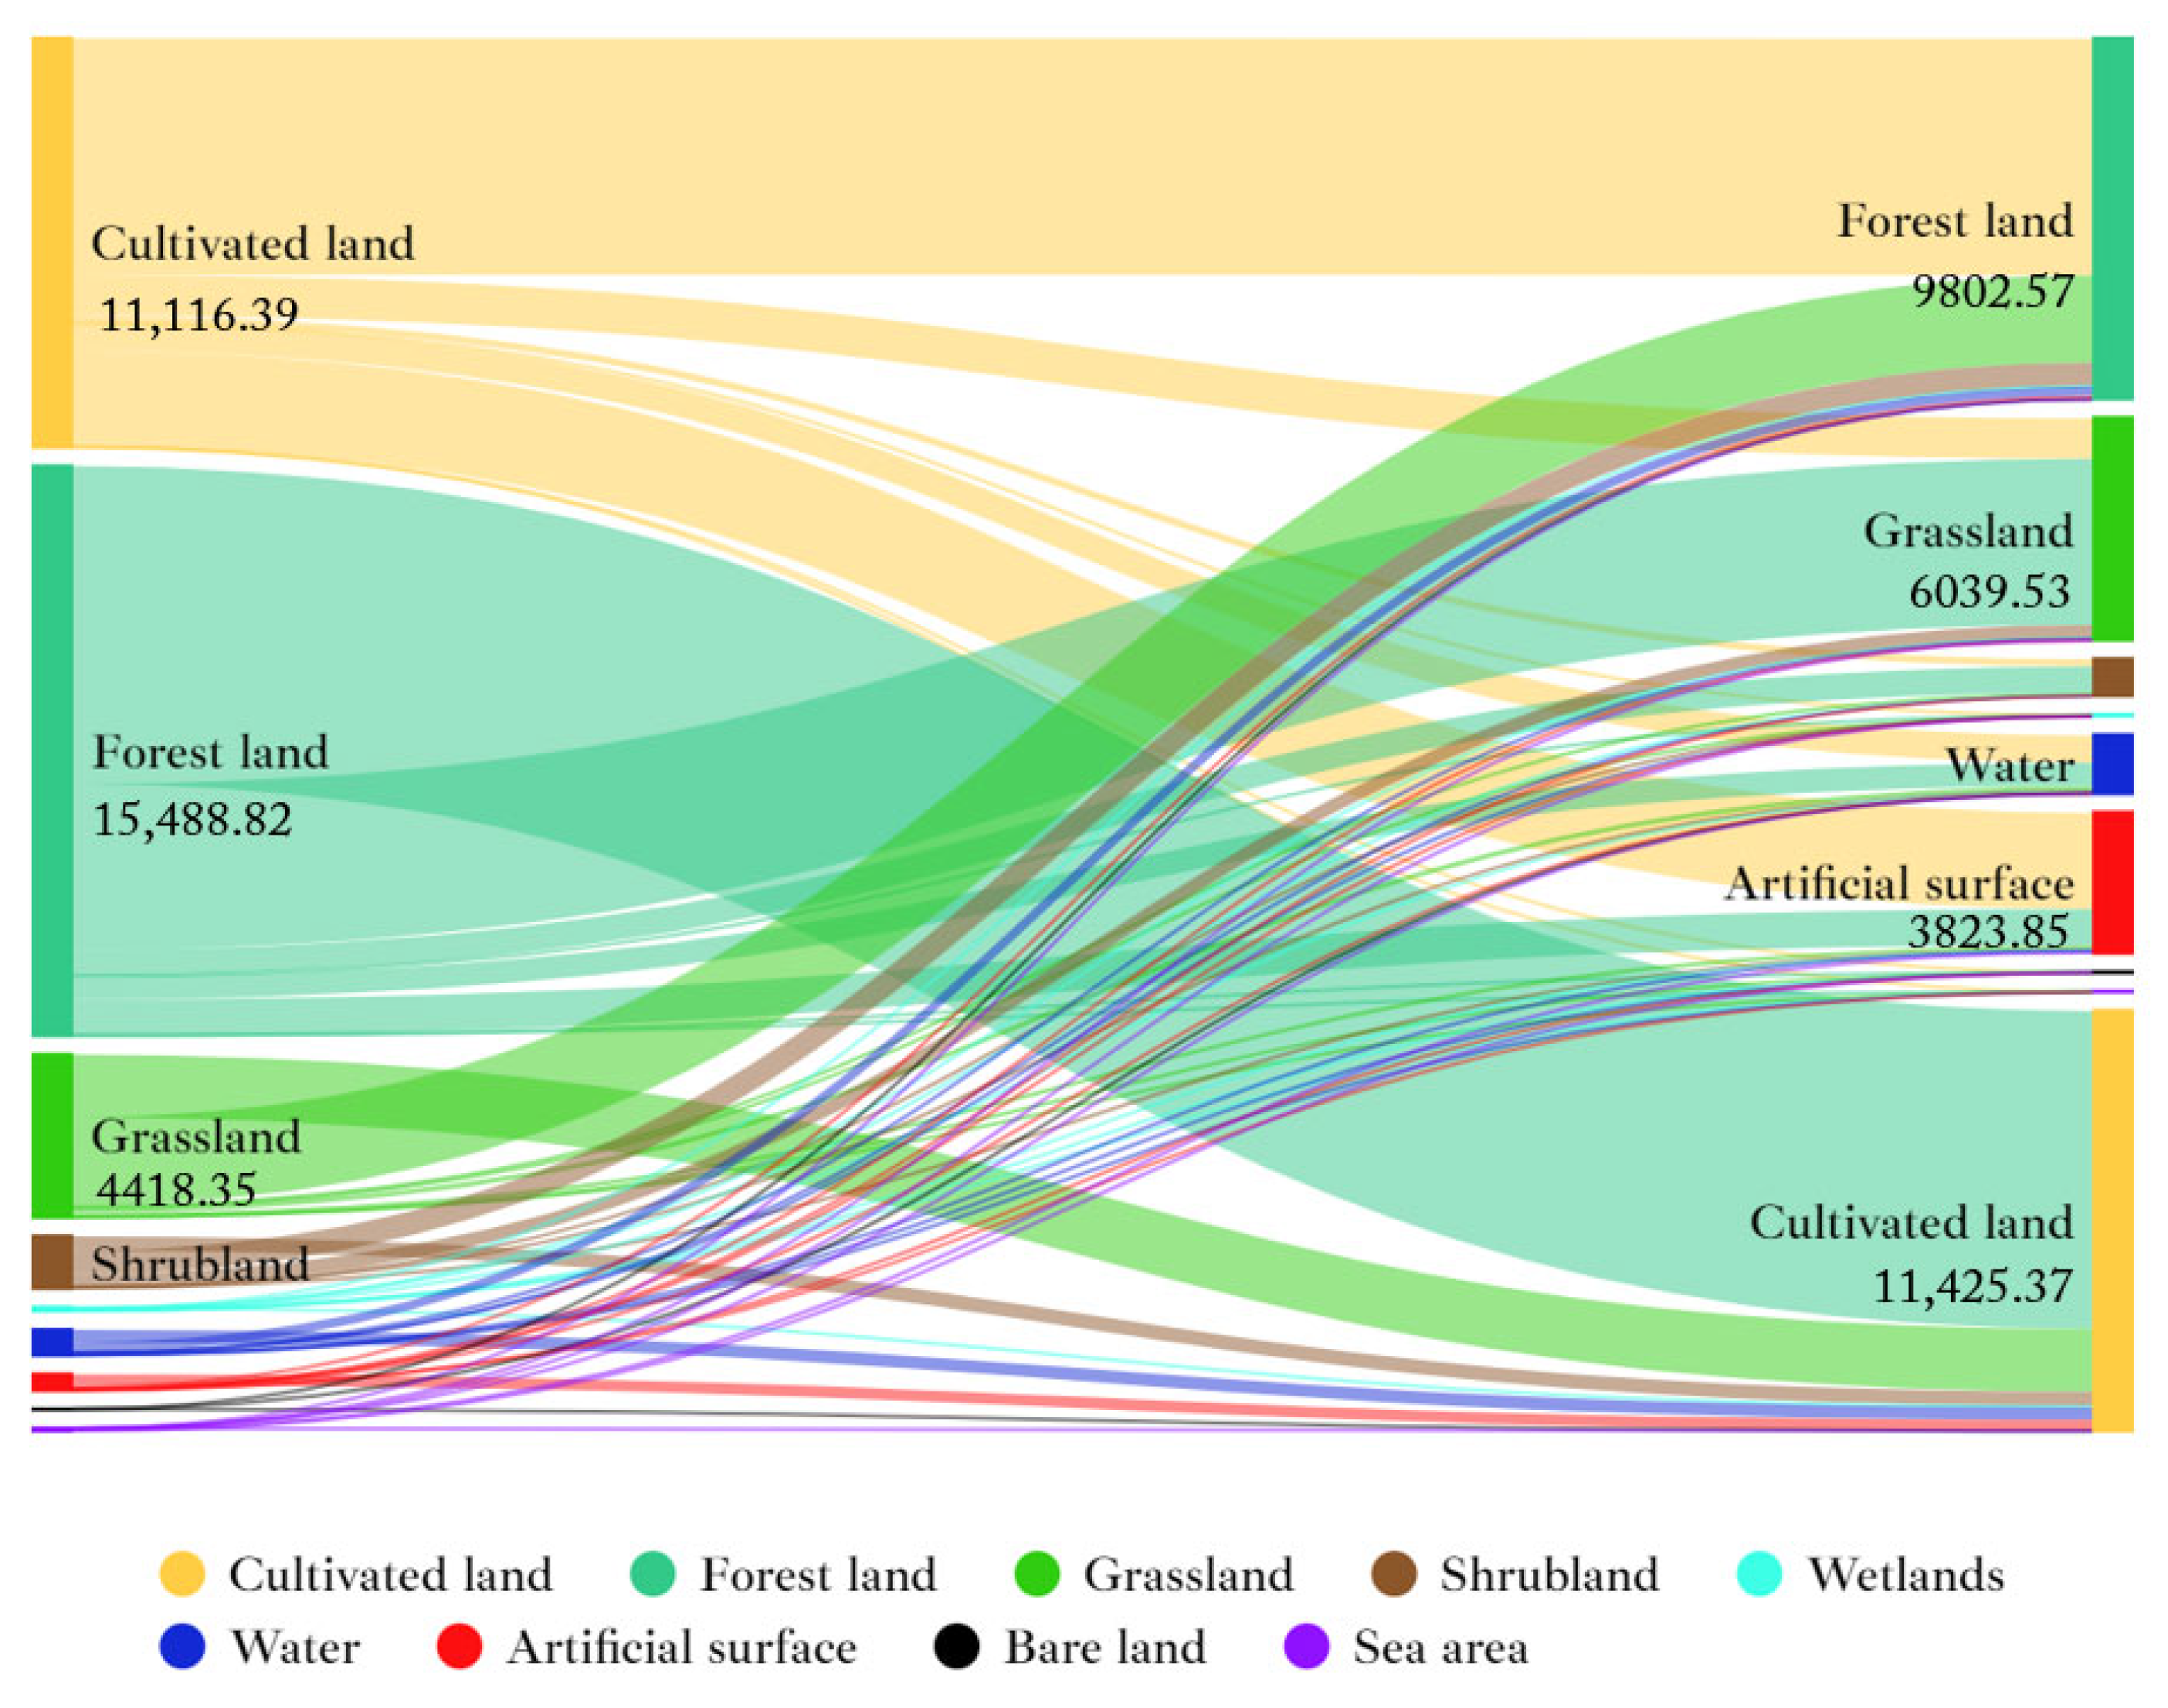
3.1.2. Analysis of Land Use Transfer Matrix for Guangxi
3.2. Valuation of Ecosystem Service Values in Guangxi
3.3. Analysis of the Drivers of the Changes in the ESV in Guangxi
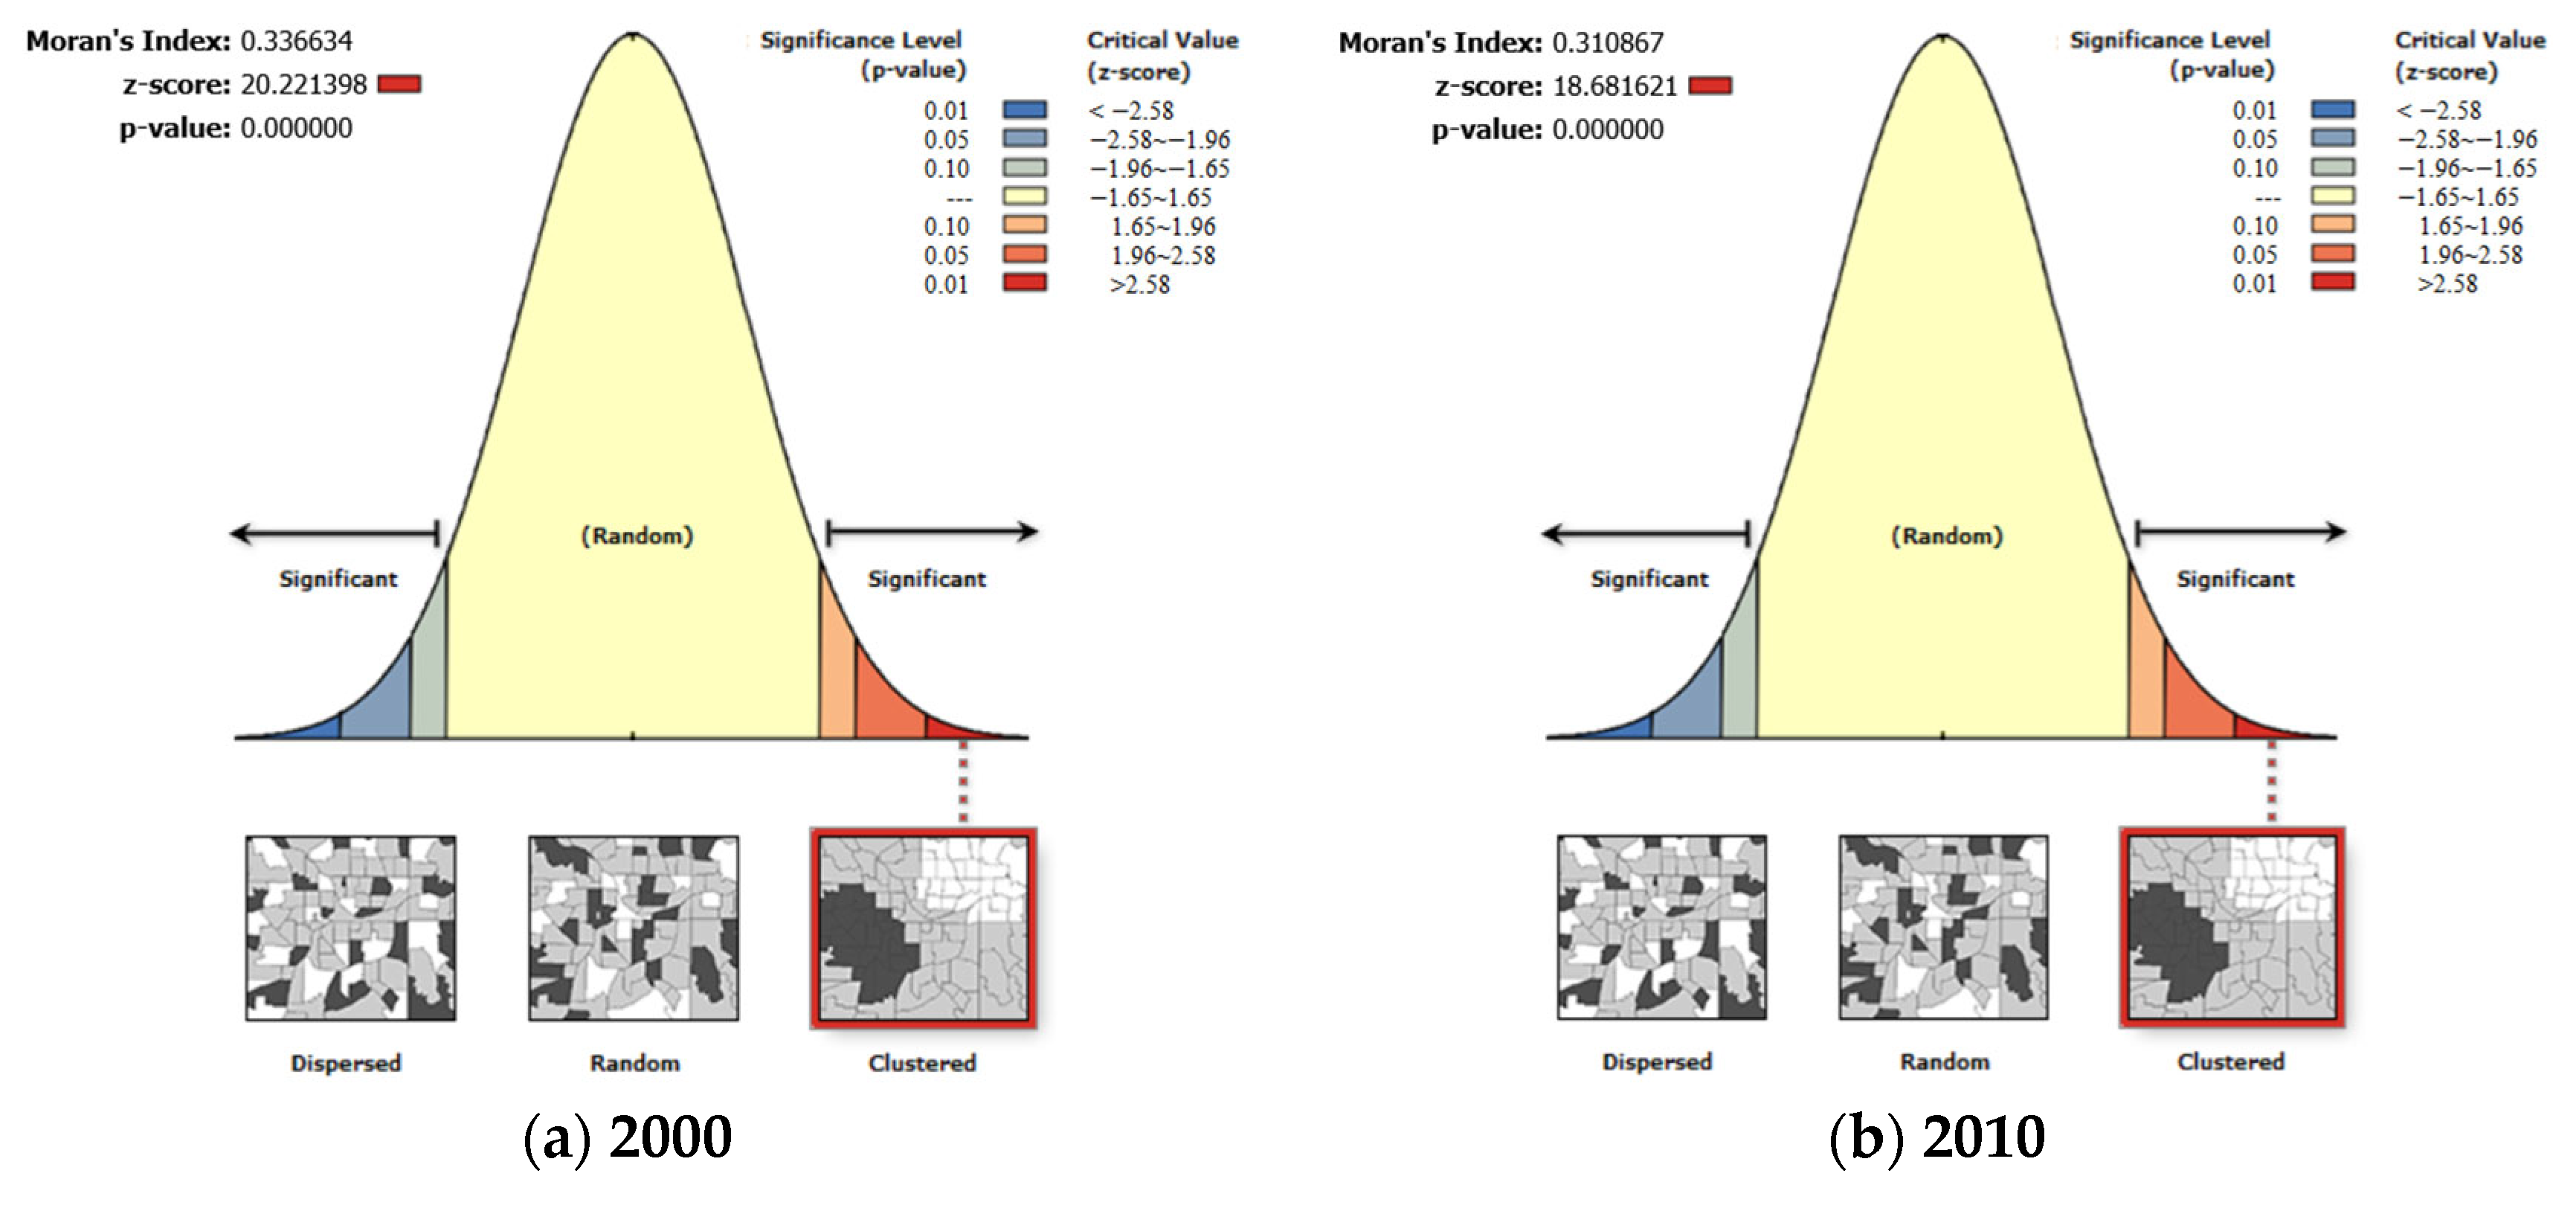
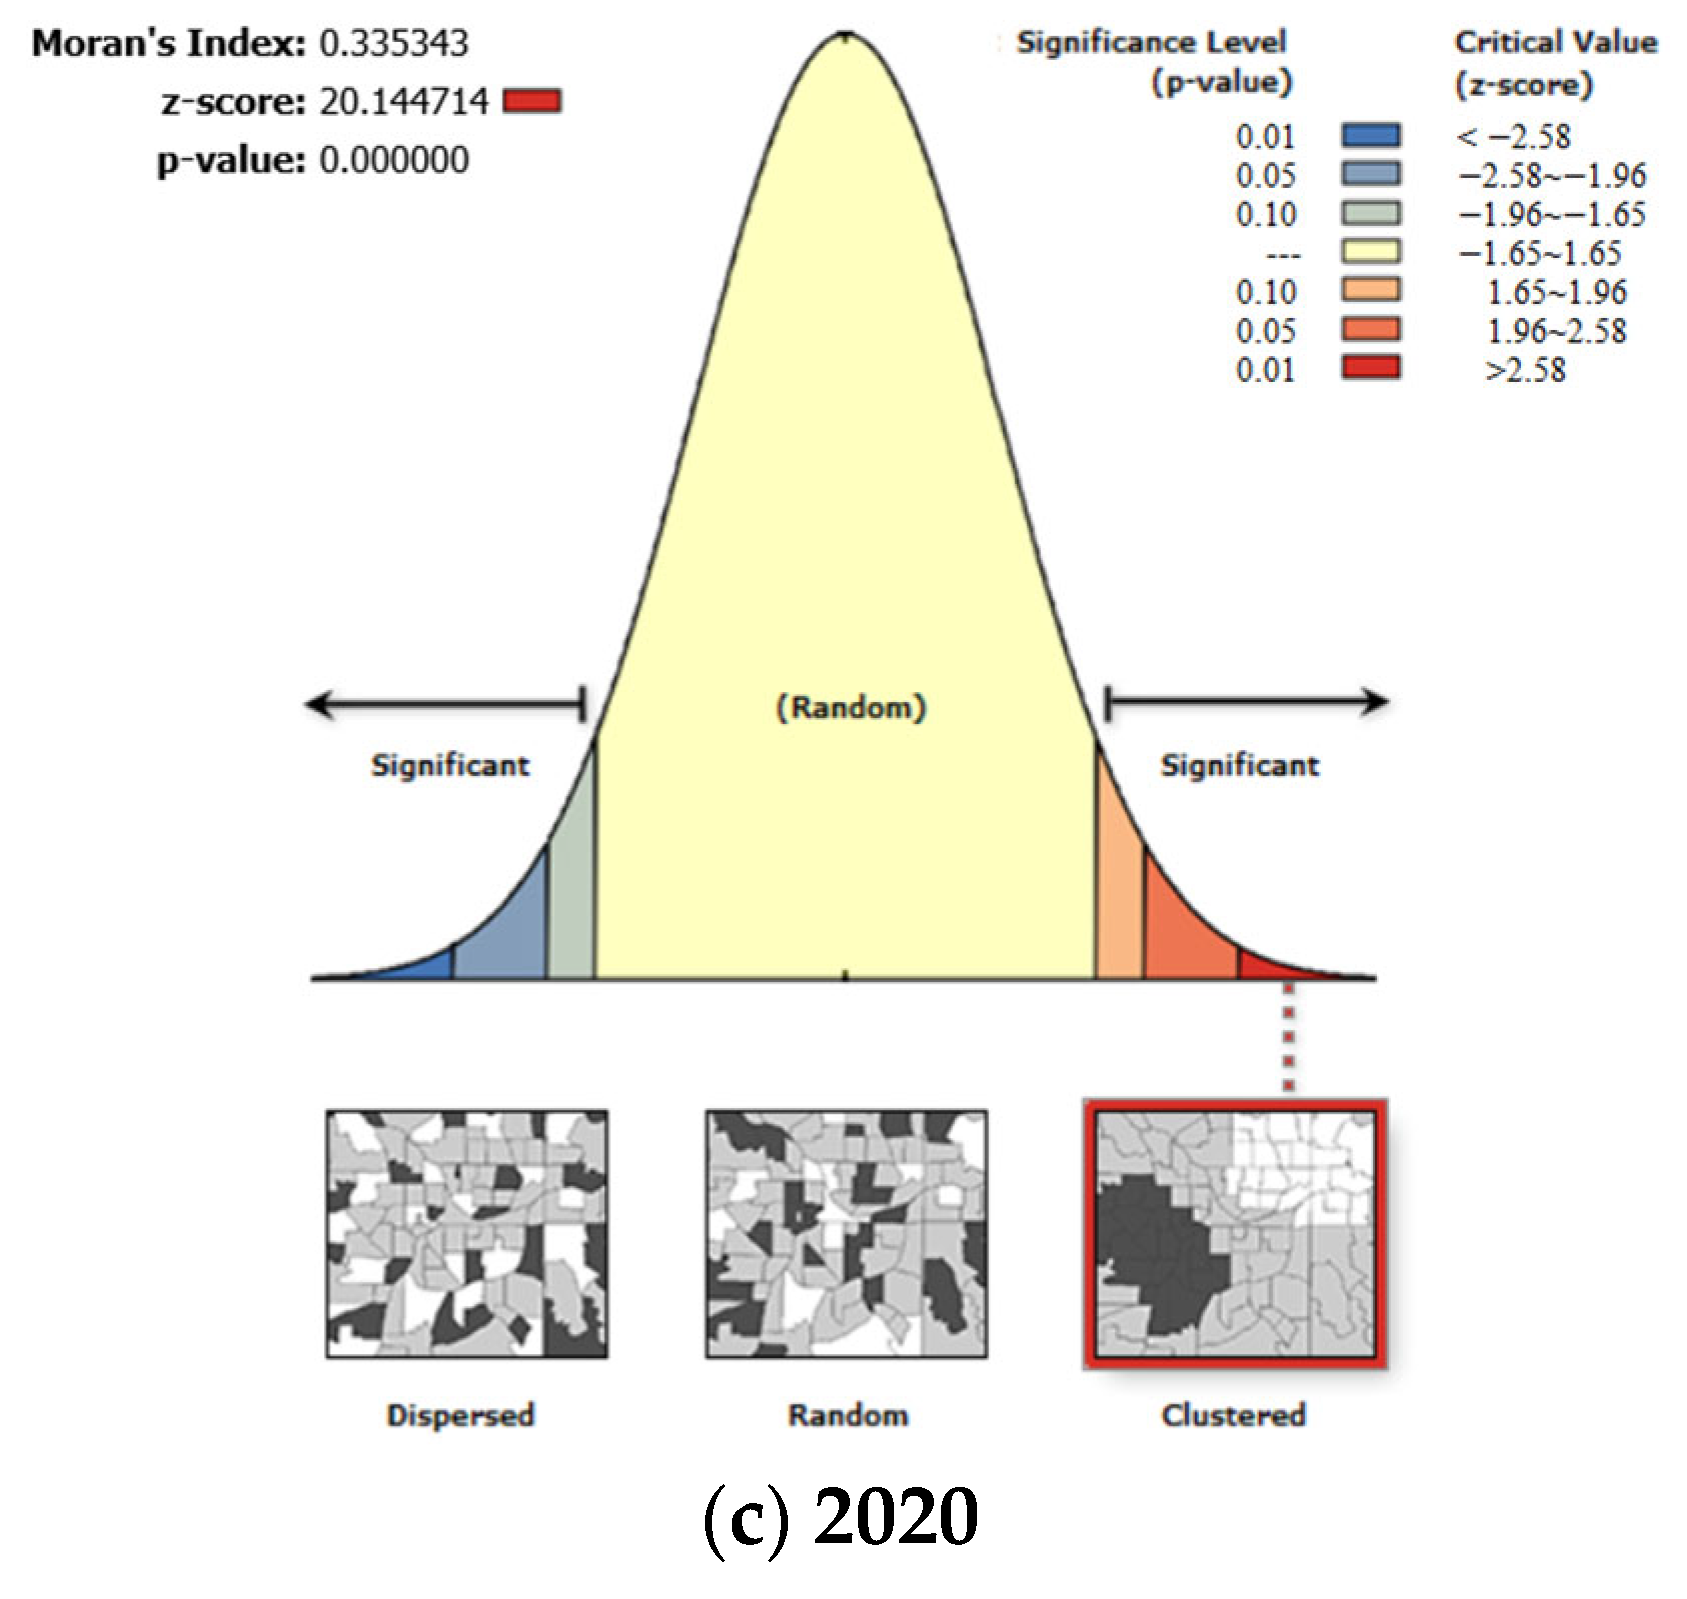
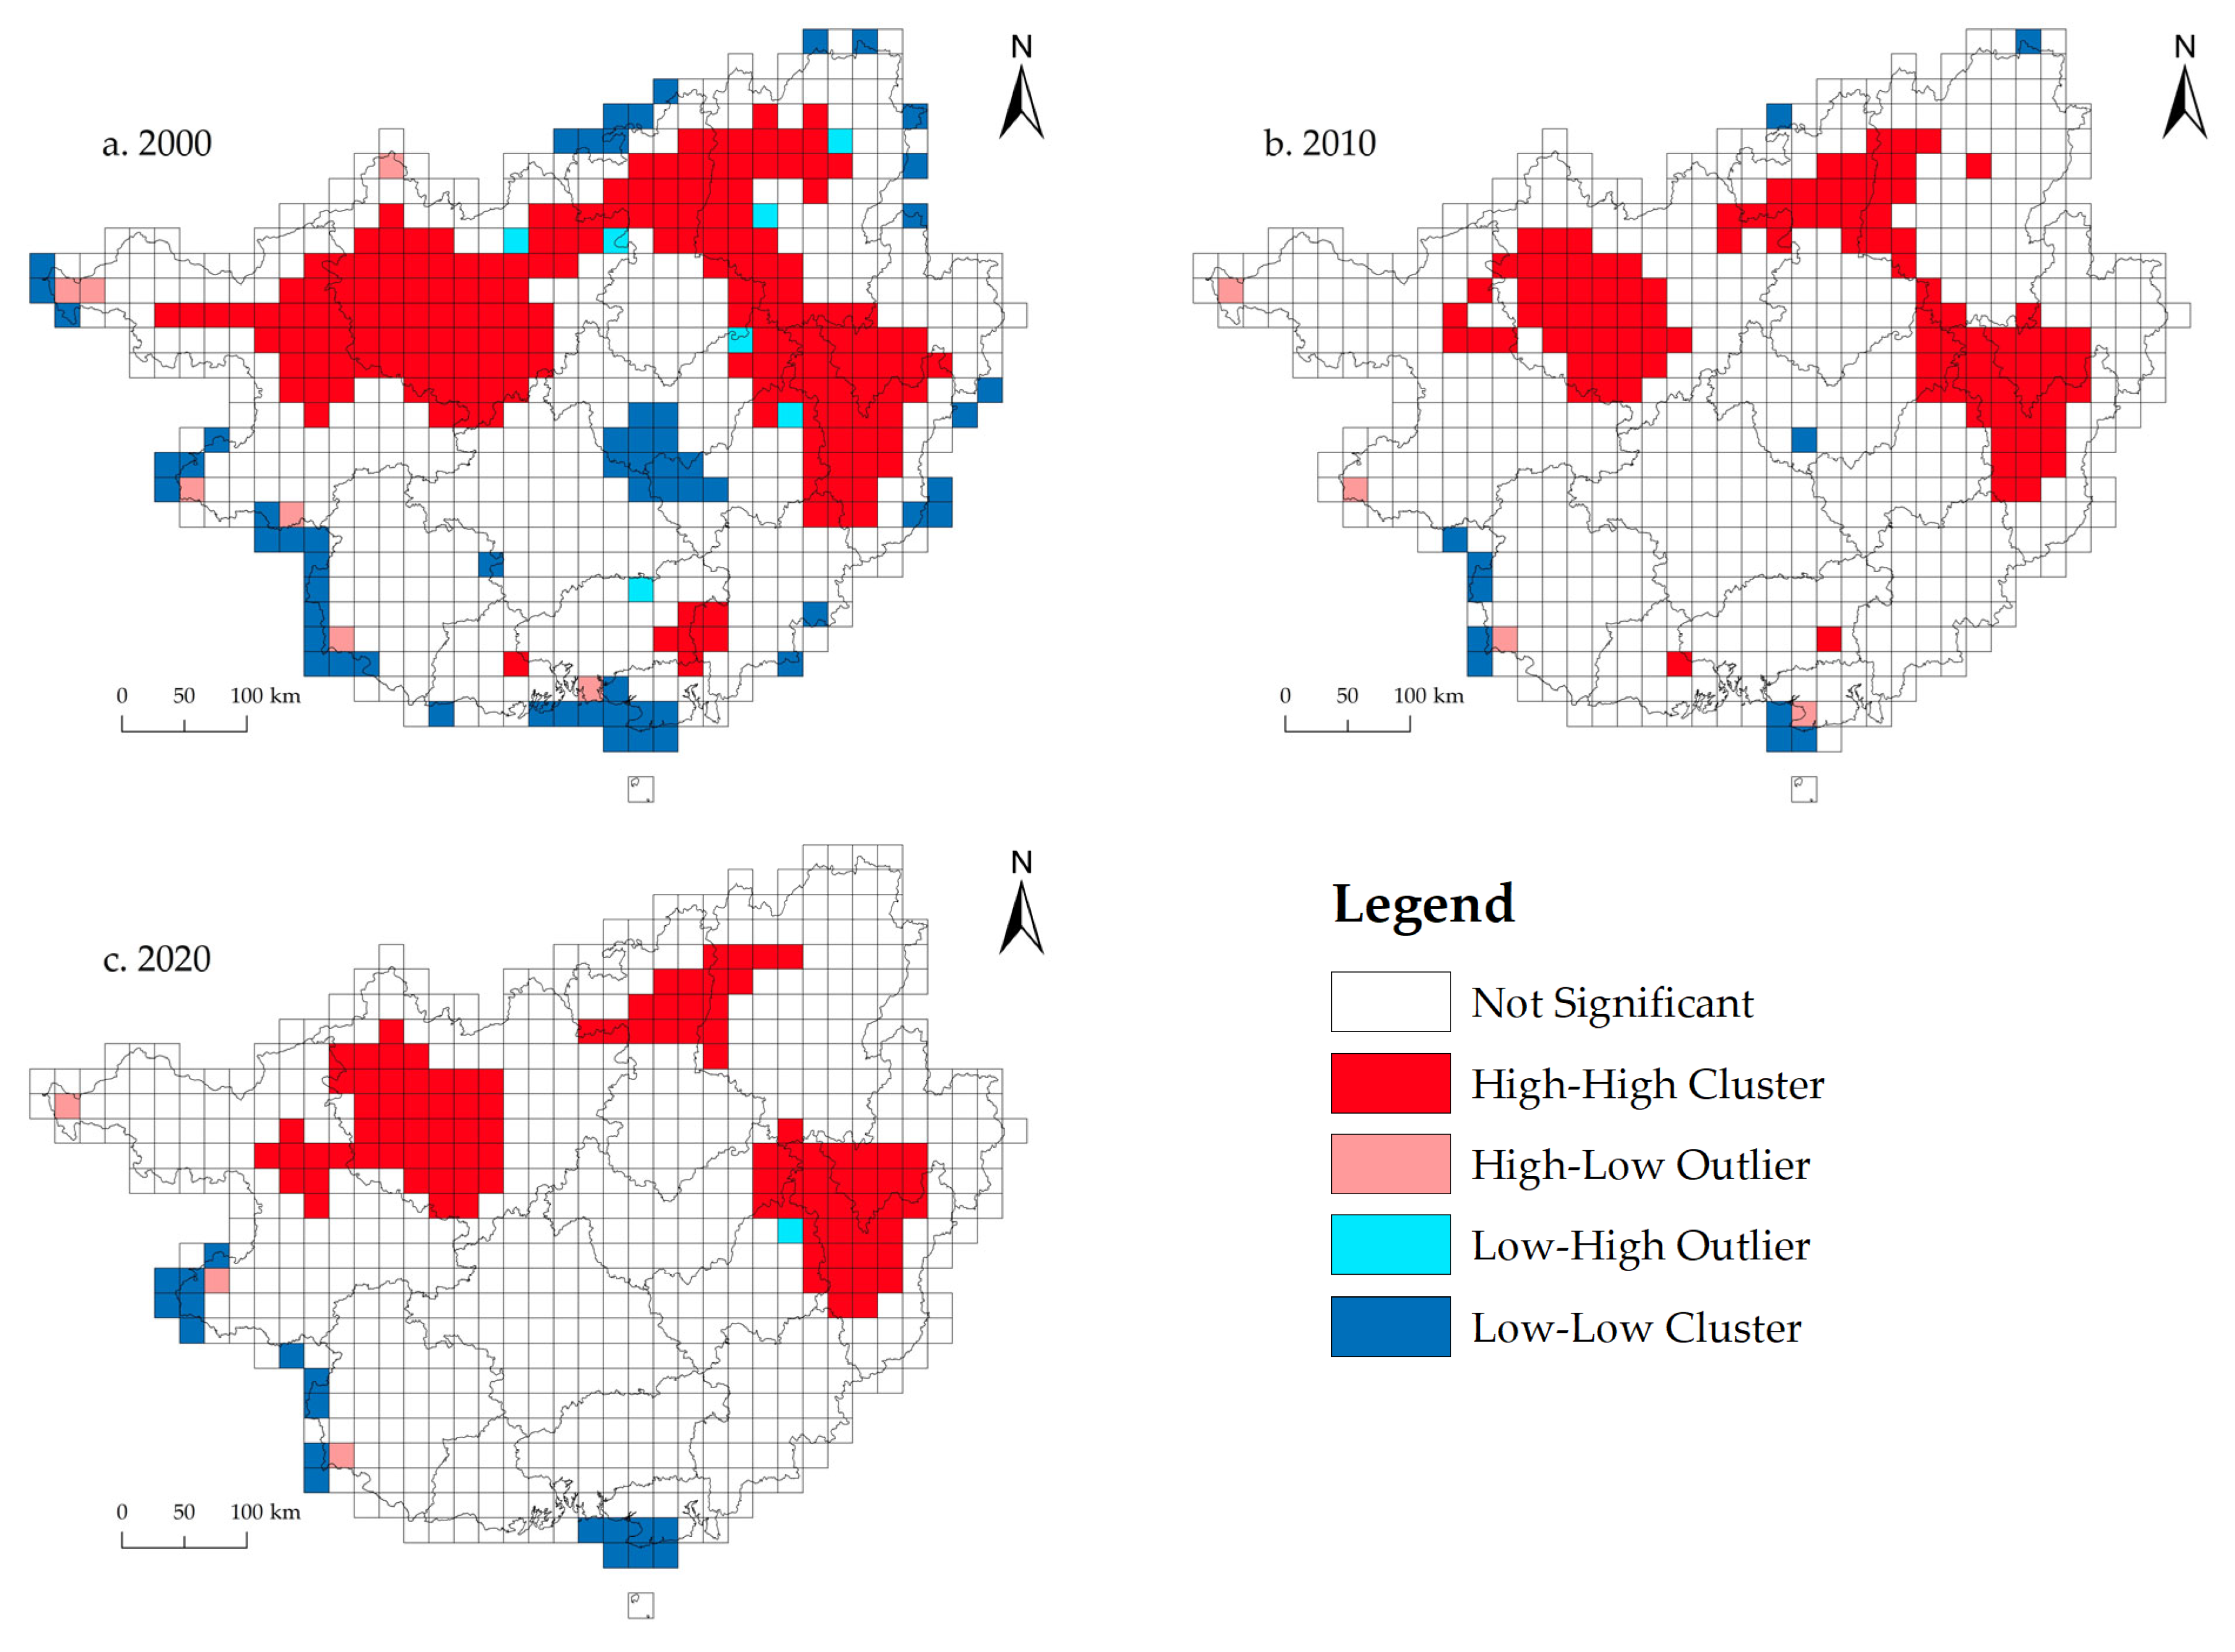
3.3.1. Spatial Autocorrelation Analysis of ESV in Guangxi
3.3.2. Impact of Land Use/Cover Change on ESV in Guangxi
4. Discussion
5. Conclusions
- (1)
- During 2000–2020, the areas of the forest land, shrubland, and sea area in Guangxi decreased continuously, among which the area of the forests decreased by 5679.39 km2 (3.64%). The areas of the cultivated land, grassland, water, and artificial surface have increased, among which the area of the artificial surface increased by 3390.67 km2 (by 1.36 times). The increase in artificial surface was mainly achieved through the conversion of cultivated land and forest land.
- (2)
- From 2000 to 2020, the ESV in Guangxi initially increased and then decreased, with a net appreciation of 1.295 billion RMB. In the first period, Guangxi’s ESV increased by 2.775 billion RMB due to the large increases in the areas of the cultivated land, grassland, and water. In the second period, the areas of the cultivated land, forest land, grassland, and shrubland decreased, and the ESV in Guangxi decreased by 1.480 billion RMB. Large amounts of cultivated land and forest land were converted into artificial surface, which was an important reason for the decrease in the ESV in Guangxi during the second period. From 2000 to 2020, the increase in water bodies contributed the most to the increase in total ESVs in Guangxi.
- (3)
- The distribution of the ESV in Guangxi exhibited significant spatial aggregation. The spatial distribution of the ESV in Guangxi was high in the north and low in the south. ESV high-high value aggregation areas were mainly distributed in northeastern and northwestern Guangxi. ESV low-low value aggregation areas were mainly distributed in the coastal areas of Beibu Gulf.
Author Contributions
Funding
Institutional Review Board Statement
Informed Consent Statement
Data Availability Statement
Acknowledgments
Conflicts of Interest
References
- Qu, Y.; Long, H.L. The economic and environmental effects of land use transitions under rapid urbanization and the implications for land use management. Habitat Int. 2018, 82, 113–121. [Google Scholar] [CrossRef]
- Hansen, H.M.; Li, H.; Svarverud, R. Ecological civilization: Interpreting the Chinese past, projecting the global future. Glob. Environ. Change 2018, 53, 195–203. [Google Scholar] [CrossRef]
- Chan, M.A.K.; Satterfield, T.; Goldstin, J. Rethinking ecosystem services to better address and navigate cultural values. Ecol. Econ. 2012, 74, 8–18. [Google Scholar] [CrossRef]
- Costanza, R. Valuing natural capital and ecosystem services toward the goals of efficiency, fairness, and sustainability. J. Ecosyst. Serv. 2020, 43, 101096. [Google Scholar] [CrossRef]
- Braat, L.C.; Groot, R.D. The ecosystem services agenda: Bridging the worlds of natural science and economics, conservation and development, and public and private policy. J. Ecosyst. Serv. 2012, 1, 4–15. [Google Scholar] [CrossRef]
- Daily, G.C.; Polasky, S.; Goldstein, J.; Kareiva, P.M.; A Mooney, H.; Pejchar, L.; Ricketts, T.H.; Salzman, J.; Shallenberger, R. Ecosystem services in decision making: Time to deliver. Front. Ecol. Environ. 2009, 7, 21–28. [Google Scholar] [CrossRef]
- Chee, Y.E. An ecological perspective on the valuation of ecosystem services. J. Biol. Conserv. 2004, 120, 549–565. [Google Scholar] [CrossRef]
- Gordon, I.M. Nature Function; Springer: New York, NY, USA, 1992. [Google Scholar]
- Costanza, R.; D’Angelo, R.; Groot, R.D.; Farber, S.; Grasso, M.; Hannon, B.; Limburg, K.; Naeem, S.; O’Neill, R.V.; Paruelo, J.; et al. The value of the world’s ecosystem services and nature capital. J. Nat. 1997, 387, 253–260. [Google Scholar] [CrossRef]
- Ouyang, Z.Y.; Wang, X.K.; Miao, H. A preliminary study on the service function and eco-economic value of terrestrial ecosystems in China. J. J. Ecol. 1999, 5, 19–25. [Google Scholar]
- Xie, G.D.; Zhen, L.; Lu, Q.X.; Cao, S.Y.; Xiao, Y. Supply, consumption and value of ecosystem services. J. Resour. Sci. 2008, 1, 93–99. [Google Scholar]
- Xie, G.D.; Lu, C.X.; Xiao, Y.; Zheng, D. Evaluation on ecosystem service value of Alpine Grassland in Qinghai Tibet Plateau. J. J. Mt. Reg. 2003, 1, 50–55. [Google Scholar]
- Yu, X.X.; Lu, S.W.; Jin, F.; Chen, L.H.; Rao, L.Y.; Lu, G.Q. Value assessment of forest ecosystem services in China. J. Ecol. 2005, 8, 2096–2102. [Google Scholar]
- Li, X.D.; Chen, S.H.; Chen, Y.Q.; Gao, W.S.; Ma, Y.C.; Ma, L. Ecosystem service value evaluation of multiple cropping and high-efficiency conservation tillage models in Sichuan Basin. J. J. Ecol. 2006, 11, 3782–3788. [Google Scholar]
- Liu, X.H.; Lu, X.G.; Jiang, M.; Shang, L.N.; Wang, X.G. Value evaluation of wetland ecosystem service function. J. Ecol. 2008, 11, 5625–5631. [Google Scholar]
- Shi, L.Y.; Cui, S.H.; Yin, K.; Liu, J. Impact of land use/Cover Change on ecosystem services in Xiamen. J. Geogr. 2010, 65, 708–714. [Google Scholar]
- Duan, J.; Kang, M.Y.; Jiang, Y. Study on the change of ecosystem service value in Dongjiang River Basin. J. Nat. Resour. 2012, 27, 90–103. [Google Scholar]
- Xie, G.D.; Zhen, L.; Lu, C.X.; Xiao, Y.; Chen, C. A method of valuing ecosystem services based on expert knowledge. J. Nat. Resour. 2008, 5, 911–919. [Google Scholar]
- Xu, L.F.; Xu, X.G.; Luo, T. Revision method of ecosystem service value equivalent based on land use–A case study of Bohai Bay coast. J. Geogr. Res. 2012, 31, 1775–1784. [Google Scholar]
- Xie, G.D.; Zhang, C.X.; Zhang, L.M.; Chen, W.H.; Li, S.M. Improvement of ecosystem service valuation method based on unit area value equivalent factor. J. J. Nat. Resour. 2015, 30, 1243–1254. [Google Scholar]
- Li, J.H.; Jiang, H.W.; Yang, B.; Alatalo, J.M.; Li, X.; Jiang, H.W.; Liu, G.; Xu, J. Indicators for spatial temporal comparisons of ecosystem service status between regions: A case study of the Taihu River Basin, China. Ecol. Indic. 2016, 60, 1008–1016. [Google Scholar] [CrossRef]
- Yan, Y.; Zhao, C.L.; Wang, C.X.; Shan, P.; Zhang, Y.J.; Wu, G. Ecosystem health assessment of the Liao River Basin upstream region based on ecosystem services. Acta Ecol. Sin. 2016, 36, 294–300. [Google Scholar] [CrossRef]
- Zhai, T.L.; Zhang, D.; Zhao, C.C. How to optimize ecological compensation to alleviate environmental injustice in different cities in the Yellow River Basin? A case of integrating ecosystem service supply, demand and flow. Sustain. Cities Soc. 2021, 75, 103341. [Google Scholar] [CrossRef]
- Cai, X.W.; Huang, X.J.; Wu, C.G.; Li, J.; Lu, Q.; Qi, X.; Zhang, M.; Zuo, T.; Lu, J. Land use and ecosystems services value changes and ecological land management in coastal Jiangsu, China. Habitat Int. 2016, 57, 164–174. [Google Scholar]
- Yirsaw, E.; Wu, W.; Shi, X.P.; Temesgen, H.; Bekele, B. Land Use/Land Cover Change Modeling and the Prediction of Subsequent Changes in Ecosystem Service Values in a Coastal Area of China, the Su-Xi-Chang Region. Sustainability 2017, 9, 1204. [Google Scholar] [CrossRef]
- Liu, Y.B.; Hou, X.Y.; Li, X.W.; Song, B.Y.; Wang, C. Assessing and predicting changes in ecosystem service values based on land use/cover change in the Bohai Rim coastal zone. Ecol. Indic. 2020, 111, 106004. [Google Scholar] [CrossRef]
- Wang, Y.Q.; Ma, J.M. Study on the impact of land-use change on ecosystem service value in Guangxi section of Pearl River Xijiang economic belt based on county scale. J. Ecol. 2020, 40, 7826–7839. [Google Scholar]
- Wu, B.; Li, Y.L.; Zhao, Q.Y.; Zhang, W.Z.; Lu, R.C. Evaluation of ecosystem service value of coastal wetland in Beibu Gulf of Guangxi and its influencing factors. J. Ecol. Econ. 2020, 36, 151–157. [Google Scholar]
- Li, S.Q.; Lu, R.C.; Wu, B.; Qin, L.Y.; Pang, Y. Study on the impact of land-use change on Ecosystem Service Value—A case study of Longsheng County, Guangxi. J. Volkswagen Technol. 2020, 22, 14–18. [Google Scholar]
- Qian, Y.F.; Lou, Y.; Hu, X.X.; Chu, Y.X.; Zhang, X.W.; Li, H. Study on the service value of wetland ecosystem in Hechi City, Guangxi. J. Guangxi For. Sci. 2021, 50, 600–604. [Google Scholar]
- Zheng, H.F.; Shao, Y.Y.; Li, C.C.; Liu, F.; Wei, L.Y.; Ma, Y.L.; Luo, X.M. Evaluation of forest ecosystem service value in Baise, Guangxi. J. Guangxi For. Sci. 2021, 50, 88–97. [Google Scholar]
- Shi, S.N.; Li, X.Q.; Xie, B.G.; Hu, B.Q.; Tang, C.R.; Yan, Y. Comparison of changes in agricultural landscape pattern and ecosystem service value between karst and non-Karst Areas—A case study of Quanzhou County, Guangxi. J. Trop. Geogr. 2018, 38, 487–497. [Google Scholar]
- Zhao, X.N.; Lan, G.W.; Chen, J.J.; Wang, Z.W. Land use and ecological environment assessment based on GIS: A case study in Yangshuo county, Guangxi. J. Anhui Agric. Univ. 2019, 46, 484–490. [Google Scholar]
- Liu, Y.S.; Wang, Y.S. Rural land engineering and poverty alleviation: Lessons from typical regions in China. J. Geogr. Sci. 2019, 29, 643–657. [Google Scholar] [CrossRef]
- Li, C.; Wu, Y.M.; Gao, B.P.; Zheng, K.J.; Wu, Y.; Li, C. Multi-scenario simulation of ecosystem service value for optimization of land use in the Sichuan-Yunnan ecological barrier, China. Ecol. Indic. 2021, 132, 108328. [Google Scholar] [CrossRef]
- Qiu, H.H.; Hu, B.Q.; Zhang, Z. Impacts of land use change on ecosystem service value based on SDGs report–Taking Guangxi as an example. Ecol. Indic. 2021, 133, 108366. [Google Scholar] [CrossRef]
- Huang, H.; Zhou, Y.; Qian, M.J.; Zeng, Z.Q. Land Use Transition and Driving Forces in Chinese Loess Plateau: A Case Study from Pu County, Shanxi Province. Land 2021, 10, 67. [Google Scholar] [CrossRef]
- Liu, W.; Shi, C.X.; Ma, Y.Y.; Li, H.J.; Ma, X.Q. Land use and land cover change-induced changes of sediment connectivity and their effects on sediment yield in a catchment on the Loess Plateau in China. Catena 2021, 207, 105688. [Google Scholar] [CrossRef]
- Xiao, Y.; Xie, G.D.; An, K. Study on the change of economic value of ecosystem service function in Mangcuo Lake Basin. J. J. Appl. Ecol. 2003, 5, 676–680. [Google Scholar]
- Luo, F.; Pan, A.; Chen, Z.S.; Zhang, H. Study on the impact of land-use change on ecosystem service value in Sichuan Province. J. J. Yunnan Agric. Univ. 2021, 36, 734–744. [Google Scholar]
- Guo, J. Analysis of ecosystem service value in red soil hilly region based on land-use change. J. Ecol. Econ. 2019, 35, 210–213. [Google Scholar]
- You, G.Y.; Liu, B.; Zou, C.X.; Li, H.D.; Kenzie, M.S.; He, Y.Q.; Gao, J.X.; Jia, X.R.; Arain, M.A.; Wang, S.S.; et al. Sensitivity of vegetation dynamics to climate variability in a forest-steppe transition ecozone, north-eastern Inner Mongolia, China. Ecol. Indic. 2021, 120, 106833. [Google Scholar] [CrossRef]
- Wang, Y.; Shataer, R.; Xia, T.T.; Chang, X.E.; Zhen, H.; Li, Z. Evaluation on the Change Characteristics of Ecosystem Service Function in the Northern Xinjiang Based on Land Use Change. Sustainability 2021, 13, 9679. [Google Scholar] [CrossRef]
- Yan, C.X.; Wang, L.C.; Zhang, Q. Study on Coupled Relationship between Urban Air Quality and Land Use in Lanzhou, China. Sustainability 2021, 13, 7724. [Google Scholar] [CrossRef]
- Zhang, H.; Liao, X.L.; Zhai, T.L. Evaluation of ecosystem service based on scenario simulation of land use in Yunnan Province. Phys. Chem. Earth 2018, 104, 58–65. [Google Scholar] [CrossRef]
- Fei, R.L.; Lin, Z.Y.; Chunga, J. How land transfer affects agricultural land use efficiency: Evidence from China’s agricultural sector. Land Use Policy 2021, 103, 105300. [Google Scholar] [CrossRef]
- Liu, Q.; Yang, Z.P.; Wang, C.R.; Han, F. Temporal-Spatial Variations and Influencing Factor of Land Use Change in Xinjiang, Central Asia, from 1995 to 2015. Sustainability 2019, 11, 696. [Google Scholar] [CrossRef]
- Wang, B.J.; Zhang, Q.; Cui, F.Q. Scientific research on ecosystem services and human well-being: A bibliometric analysis. Ecol. Indic. 2021, 125, 107449. [Google Scholar] [CrossRef]
- Felipe-Lucia, M.R.; Soliveres, S.; Penone, C.; Allan, E. Land-use intensity alters networks between biodiversity, ecosystem functions, and services. Biol. Sci. 2020, 117, 28140–28149. [Google Scholar] [CrossRef]
- Liu, C.; Yang, M.H.; Hou, Y.T.; Xue, X.Z. Ecosystem service multifunctionality assessment and coupling coordination analysis with land use and land cover change in China’s coastal zones. Sci. Total Environ. 2021, 797, 149033. [Google Scholar] [CrossRef]
- Mann, C.; Loft, L.; Morcillo, M.H. Assessing forest governance innovations in Europe: Needs, challenges and ways forward for sustainable forest ecosystem service provision. Ecosyst. Serv. 2021, 52, 101384. [Google Scholar] [CrossRef]
- Cortinovis, C.; Geneletti, D.; Hedlund, K. Synthesizing multiple ecosystem service assessments for urban planning: A review of approaches, and recommendations. Landsc. Urban Plan. 2021, 213, 104129. [Google Scholar] [CrossRef]
- Meng, F.X.; Guo, J.L.; Guo, Z.Q.; Lee, C.K.J.; Liu, G.Y.; Wang, N. Urban ecological transition: The practice of ecological civilization construction in China. Sci. Total Environ. 2021, 755, 142633. [Google Scholar] [CrossRef]
| Land Use Type | 2000 | 2010 | 2020 | |||
|---|---|---|---|---|---|---|
| km2 | % | km2 | % | km2 | % | |
| Cultivated land | 64,495.02 | 27.24 | 66,355.19 | 28.03 | 64,802.90 | 27.37 |
| Forest land | 156,002.13 | 65.89 | 151,763.08 | 64.10 | 150,322.74 | 63.49 |
| Grassland | 9044.16 | 3.82 | 11,108.51 | 4.69 | 10,667.92 | 4.51 |
| Shrubland | 1970.06 | 0.83 | 1693.32 | 0.72 | 1549.32 | 0.65 |
| Wetlands | 106.43 | 0.04 | 30.74 | 0.01 | 47.91 | 0.02 |
| Water | 2567.56 | 1.08 | 3134.07 | 1.32 | 3468.46 | 1.46 |
| Artificial surface | 2486.55 | 1.05 | 2609.72 | 1.10 | 5877.23 | 2.48 |
| Sea area | 78.74 | 0.03 | 64.50 | 0.03 | 16.51 | 0.01 |
| Bare land | 0.17 | 0.00 | - | - | 8.43 | 0.00 |
| Land Use Type | 2000–2010 | 2010–2020 | 2000–2020 | |||
|---|---|---|---|---|---|---|
| km2 | % | km2 | % | km2 | % | |
| Cultivated land | 1860.17 | 0.29 | −1552.29 | −0.23 | 307.88 | 0.02 |
| Forest land | −4239.05 | −0.27 | −1440.34 | −0.09 | −5679.39 | −0.18 |
| Grassland | 2064.35 | 2.28 | −440.59 | −0.40 | 1623.76 | 0.90 |
| Shrubland | −276.73 | −1.40 | −144.00 | −0.85 | −420.73 | −1.07 |
| Wetlands | −75.69 | −7.11 | 17.17 | 5.59 | −58.51 | −2.75 |
| Water | 566.50 | 2.21 | 334.39 | 1.07 | 900.90 | 1.75 |
| Artificial surface | 123.16 | 0.50 | 3267.51 | 12.52 | 3390.67 | 6.82 |
| Sea area | −14.24 | −1.81 | −47.98 | −7.44 | −62.22 | −3.95 |
| Land Use Type | Cultivated Land | Forest Land | Grassland | Shrubland | Wetlands | Water | Artificial Surface | Bare Land | Sea Area | Total | |
|---|---|---|---|---|---|---|---|---|---|---|---|
| 2000–2010 | Cultivated land | 56,418.88 | 5479.02 | 1170.57 | 181.17 | 5.69 | 723.79 | 513.70 | - | 0.53 | 8074.48 |
| Forest land | 7339.31 | 143,170.65 | 4235.09 | 691.35 | 2.20 | 446.73 | 100.81 | - | 1.78 | 12,817.27 | |
| Grassland | 1548.21 | 2092.26 | 5222.51 | 89.99 | 0.82 | 68.40 | 20.02 | - | 0.06 | 3819.76 | |
| Shrubland | 286.53 | 554.52 | 399.76 | 722.08 | 0.00 | 1.79 | 5.16 | - | - | 1247.77 | |
| Wetlands | 23.32 | 16.55 | 2.52 | 0.05 | 17.73 | 44.56 | 0.82 | - | 0.54 | 88.37 | |
| Water | 357.48 | 309.20 | 61.58 | 6.33 | 3.65 | 1811.02 | 12.83 | - | 2.12 | 753.19 | |
| Artificial surface | 374.10 | 125.71 | 9.75 | 0.43 | 0.12 | 24.88 | 1950.53 | - | 0.73 | 535.72 | |
| Sea area | 2.38 | 2.61 | 0.12 | - | 0.27 | 8.75 | 6.32 | - | 57.40 | 20.44 | |
| Total | 9931.33 | 8579.87 | 5879.40 | 969.32 | 12.75 | 1318.92 | 659.66 | - | 5.75 | - | |
| 2010–2020 | Cultivated land | 57,192.05 | 5522.45 | 595.37 | 92.81 | 6.30 | 468.86 | 2461.26 | - | 0.56 | 9147.62 |
| Forest land | 5925.81 | 140,540.49 | 3247.80 | 529.59 | 5.74 | 493.00 | 916.47 | - | 1.75 | 11,120.17 | |
| Grassland | 834.45 | 3271.69 | 6629.32 | 155.56 | 1.27 | 111.79 | 88.60 | - | 0.05 | 4463.41 | |
| Shrubland | 171.79 | 595.12 | 136.02 | 768.87 | 0.01 | 3.34 | 17.79 | - | - | 924.06 | |
| Wetlands | 2.60 | 3.06 | 0.40 | 0.01 | 15.83 | 8.00 | 0.39 | - | 0.07 | 14.52 | |
| Water | 435.48 | 238.79 | 22.41 | 1.68 | 16.32 | 2360.28 | 50.13 | - | 0.95 | 765.76 | |
| Artificial surface | 230.24 | 54.93 | 7.13 | 0.37 | 0.40 | 16.30 | 2298.21 | - | 0.24 | 309.62 | |
| Sea area | 1.11 | 1.94 | 0.03 | - | 1.28 | 3.11 | 43.47 | - | 12.24 | 50.95 | |
| Total | 7601.48 | 9687.98 | 4009.15 | 780.02 | 31.34 | 1104.41 | 3578.12 | - | 3.62 | - | |
| 2000–2020 | Cultivated land | 53,376.84 | 6434.11 | 1106.08 | 197.21 | 13.85 | 746.08 | 2618.02 | 0.69 | 0.35 | 11,116.38 |
| Forest land | 8644.43 | 140,499.30 | 4512.39 | 708.69 | 6.34 | 631.72 | 981.71 | 1.76 | 1.78 | 15,488.82 | |
| Grassland | 1706.44 | 2378.05 | 4624.13 | 86.54 | 0.95 | 135.34 | 110.88 | 0.12 | 0.03 | 4418.34 | |
| Shrubland | 391.71 | 635.38 | 364.65 | 551.62 | 0.01 | 2.78 | 23.73 | - | - | 1418.25 | |
| Wetlands | 30.25 | 12.96 | 1.74 | 0.03 | 13.58 | 44.51 | 2.24 | 0.24 | 0.41 | 92.39 | |
| Water | 343.18 | 248.36 | 43.78 | 4.52 | 10.16 | 1872.07 | 36.48 | 3.85 | 1.65 | 691.97 | |
| Artificial surface | 305.40 | 91.11 | 10.83 | 0.22 | 0.43 | 24.38 | 2051.89 | 1.24 | 0.74 | 434.36 | |
| Bare land | 0.12 | 0.03 | - | - | - | 0.02 | - | - | - | 0.17 | |
| Sea area | 3.84 | 2.57 | 0.06 | - | 1.42 | 7.51 | 50.79 | 0.39 | 10.73 | 66.59 | |
| Total | 11,425.36 | 9802.59 | 6039.53 | 997.20 | 33.17 | 1592.33 | 3823.86 | 8.29 | 4.96 | - |
| Type 1 | Type 2 | Cultivated Land | Forest Land | Grass land | Shrubland | Wetlands | Water | Bare Land | Artificial Surface |
|---|---|---|---|---|---|---|---|---|---|
| Provision of services | Food production | 1.36 | 0.29 | 0.38 | 0.19 | 0.51 | 0.80 | 0.00 | 0.00 |
| Raw material production | 0.09 | 0.66 | 0.56 | 0.43 | 0.50 | 0.23 | 0.00 | 0.00 | |
| Water supply | −2.63 | 0.34 | 0.31 | 0.22 | 2.59 | 8.29 | 0.00 | 0.00 | |
| Regulation service | Gas regulation | 1.11 | 2.17 | 1.97 | 1.41 | 1.90 | 0.77 | 0.02 | 0.00 |
| Climate regulation | 0.57 | 6.50 | 5.21 | 4.23 | 3.60 | 2.29 | 0.00 | 0.00 | |
| Purify environment | 0.17 | 1.93 | 1.72 | 1.28 | 3.60 | 5.55 | 0.10 | 0.00 | |
| Hydrological regulation | 2.72 | 4.74 | 3.82 | 3.35 | 24.23 | 102.24 | 0.03 | 0.00 | |
| Support service | Soil protection | 0.01 | 2.65 | 2.40 | 1.72 | 2.31 | 0.93 | 0.02 | 0.00 |
| Maintain nutrient cycle | 0.19 | 0.20 | 0.18 | 0.13 | 0.18 | 0.07 | 0.00 | 0.00 | |
| Biodiversity conservation | 0.21 | 2.41 | 2.18 | 1.57 | 7.87 | 2.25 | 0.02 | 0.00 | |
| Cultural service | Entertainment culture | 0.09 | 1.06 | 0.96 | 0.69 | 4.73 | 1.89 | 0.01 | 0.00 |
| Total | 3.89 | 22.95 | 19.69 | 15.22 | 52.02 | 125.31 | 0.20 | 0.00 | |
| Grain Type | Seeded Area/km2 | Total Production/kg | Unit Price/RMB |
|---|---|---|---|
| Early rice | 8051.80 | 4,767,500,000 | 2.54 |
| Late rice | 8212.00 | 4,431,900,000 | 3.04 |
| Corn | 5969.70 | 2,733,300,000 | 2.40 |
| Type 1 | Type 2 | Cultivated Land | Forest Land | Grassland | Shrubland | Wetlands | Water | Bare Land | Total |
|---|---|---|---|---|---|---|---|---|---|
| Provision of services | Food production | 28.09 | 5.99 | 7.85 | 3.92 | 10.53 | 16.52 | 0.00 | 72.90 |
| Raw material production | 1.86 | 13.63 | 11.57 | 8.88 | 10.33 | 4.75 | 0.00 | 51.01 | |
| Water supply | −54.32 | 7.02 | 6.40 | 4.54 | 53.49 | 171.21 | 0.00 | 188.35 | |
| Regulation service | Gas regulation | 22.92 | 44.82 | 40.69 | 29.12 | 39.24 | 15.90 | 0.41 | 193.10 |
| Climate regulation | 11.77 | 134.24 | 107.60 | 87.36 | 74.35 | 47.29 | 0.00 | 462.62 | |
| Purify environment | 3.51 | 39.86 | 35.52 | 26.44 | 74.35 | 114.62 | 2.07 | 296.36 | |
| Hydrological regulation | 56.17 | 97.89 | 78.89 | 69.19 | 500.41 | 2111.51 | 0.62 | 2914.68 | |
| Support service | Soil protection | 0.21 | 54.73 | 49.57 | 35.52 | 47.71 | 19.21 | 0.41 | 207.35 |
| Maintain nutrient cycle | 3.92 | 4.13 | 3.72 | 2.68 | 3.72 | 1.45 | 0.00 | 19.62 | |
| Biodiversity conservation | 4.34 | 49.77 | 45.02 | 32.42 | 162.53 | 46.47 | 0.41 | 340.97 | |
| Cultural service | Entertainment culture | 1.86 | 21.89 | 19.83 | 14.25 | 97.69 | 39.03 | 0.21 | 194.75 |
| Total | 80.34 | 473.97 | 406.65 | 314.33 | 1074.34 | 2587.96 | 4.13 | 4941.72 | |
| Land Use Type | ESV (108 RMB) | 2000–2010 | 2010–2020 | 2000–2020 | |||||
|---|---|---|---|---|---|---|---|---|---|
| 2000 | 2010 | 2020 | 108 RMB | % | 108 RMB | % | 108 RMB | % | |
| Cultivated land | 518.14 | 533.08 | 520.61 | 14.94 | 2.88 | −12.47 | −2.34 | 2.47 | 0.48 |
| Forest land | 7394.09 | 7193.17 | 7124.91 | −200.92 | −2.72 | −68.27 | −0.95 | −269.19 | −3.64 |
| Grassland | 367.78 | 451.72 | 433.81 | 83.95 | 22.83 | −17.92 | −3.97 | 66.03 | 17.95 |
| Shrubland | 61.92 | 53.23 | 48.70 | −8.70 | −14.05 | −4.53 | −8.50 | −13.22 | −21.36 |
| Wetlands | 11.43 | 3.30 | 5.15 | −8.13 | −71.12 | 1.85 | 55.87 | −6.29 | −54.98 |
| Water | 664.47 | 811.08 | 897.62 | 146.61 | 22.06 | 86.54 | 10.67 | 233.15 | 35.09 |
| Total | 9017.85 | 9045.60 | 9030.80 | 27.75 | 0.31 | −14.80 | −0.16 | 12.95 | 0.14 |
| Land Use Type | 2000–2010 | 2010–2020 | 2000–2020 |
|---|---|---|---|
| Cultivated land | 53.85 | 84.28 | 19.10 |
| Forest land | −724.05 | 461.36 | −2078.28 |
| Grassland | 302.51 | 121.08 | 509.79 |
| Shrubland | −31.35 | 30.59 | −102.10 |
| Wetlands | −29.30 | −12.47 | −48.53 |
| Water | 528.33 | −584.84 | 1800.04 |
Publisher’s Note: MDPI stays neutral with regard to jurisdictional claims in published maps and institutional affiliations. |
© 2022 by the authors. Licensee MDPI, Basel, Switzerland. This article is an open access article distributed under the terms and conditions of the Creative Commons Attribution (CC BY) license (https://creativecommons.org/licenses/by/4.0/).
Share and Cite
Zhao, Y.; Han, Z.; Xu, Y. Impact of Land Use/Cover Change on Ecosystem Service Value in Guangxi. Sustainability 2022, 14, 10867. https://doi.org/10.3390/su141710867
Zhao Y, Han Z, Xu Y. Impact of Land Use/Cover Change on Ecosystem Service Value in Guangxi. Sustainability. 2022; 14(17):10867. https://doi.org/10.3390/su141710867
Chicago/Turabian StyleZhao, Yunfei, Zhibo Han, and Yuanquan Xu. 2022. "Impact of Land Use/Cover Change on Ecosystem Service Value in Guangxi" Sustainability 14, no. 17: 10867. https://doi.org/10.3390/su141710867
APA StyleZhao, Y., Han, Z., & Xu, Y. (2022). Impact of Land Use/Cover Change on Ecosystem Service Value in Guangxi. Sustainability, 14(17), 10867. https://doi.org/10.3390/su141710867


