
A Systematic Review of Morphological Transformation of Urban Open Spaces: Drivers, Trends, and Methods


Abstract
:1. Introduction
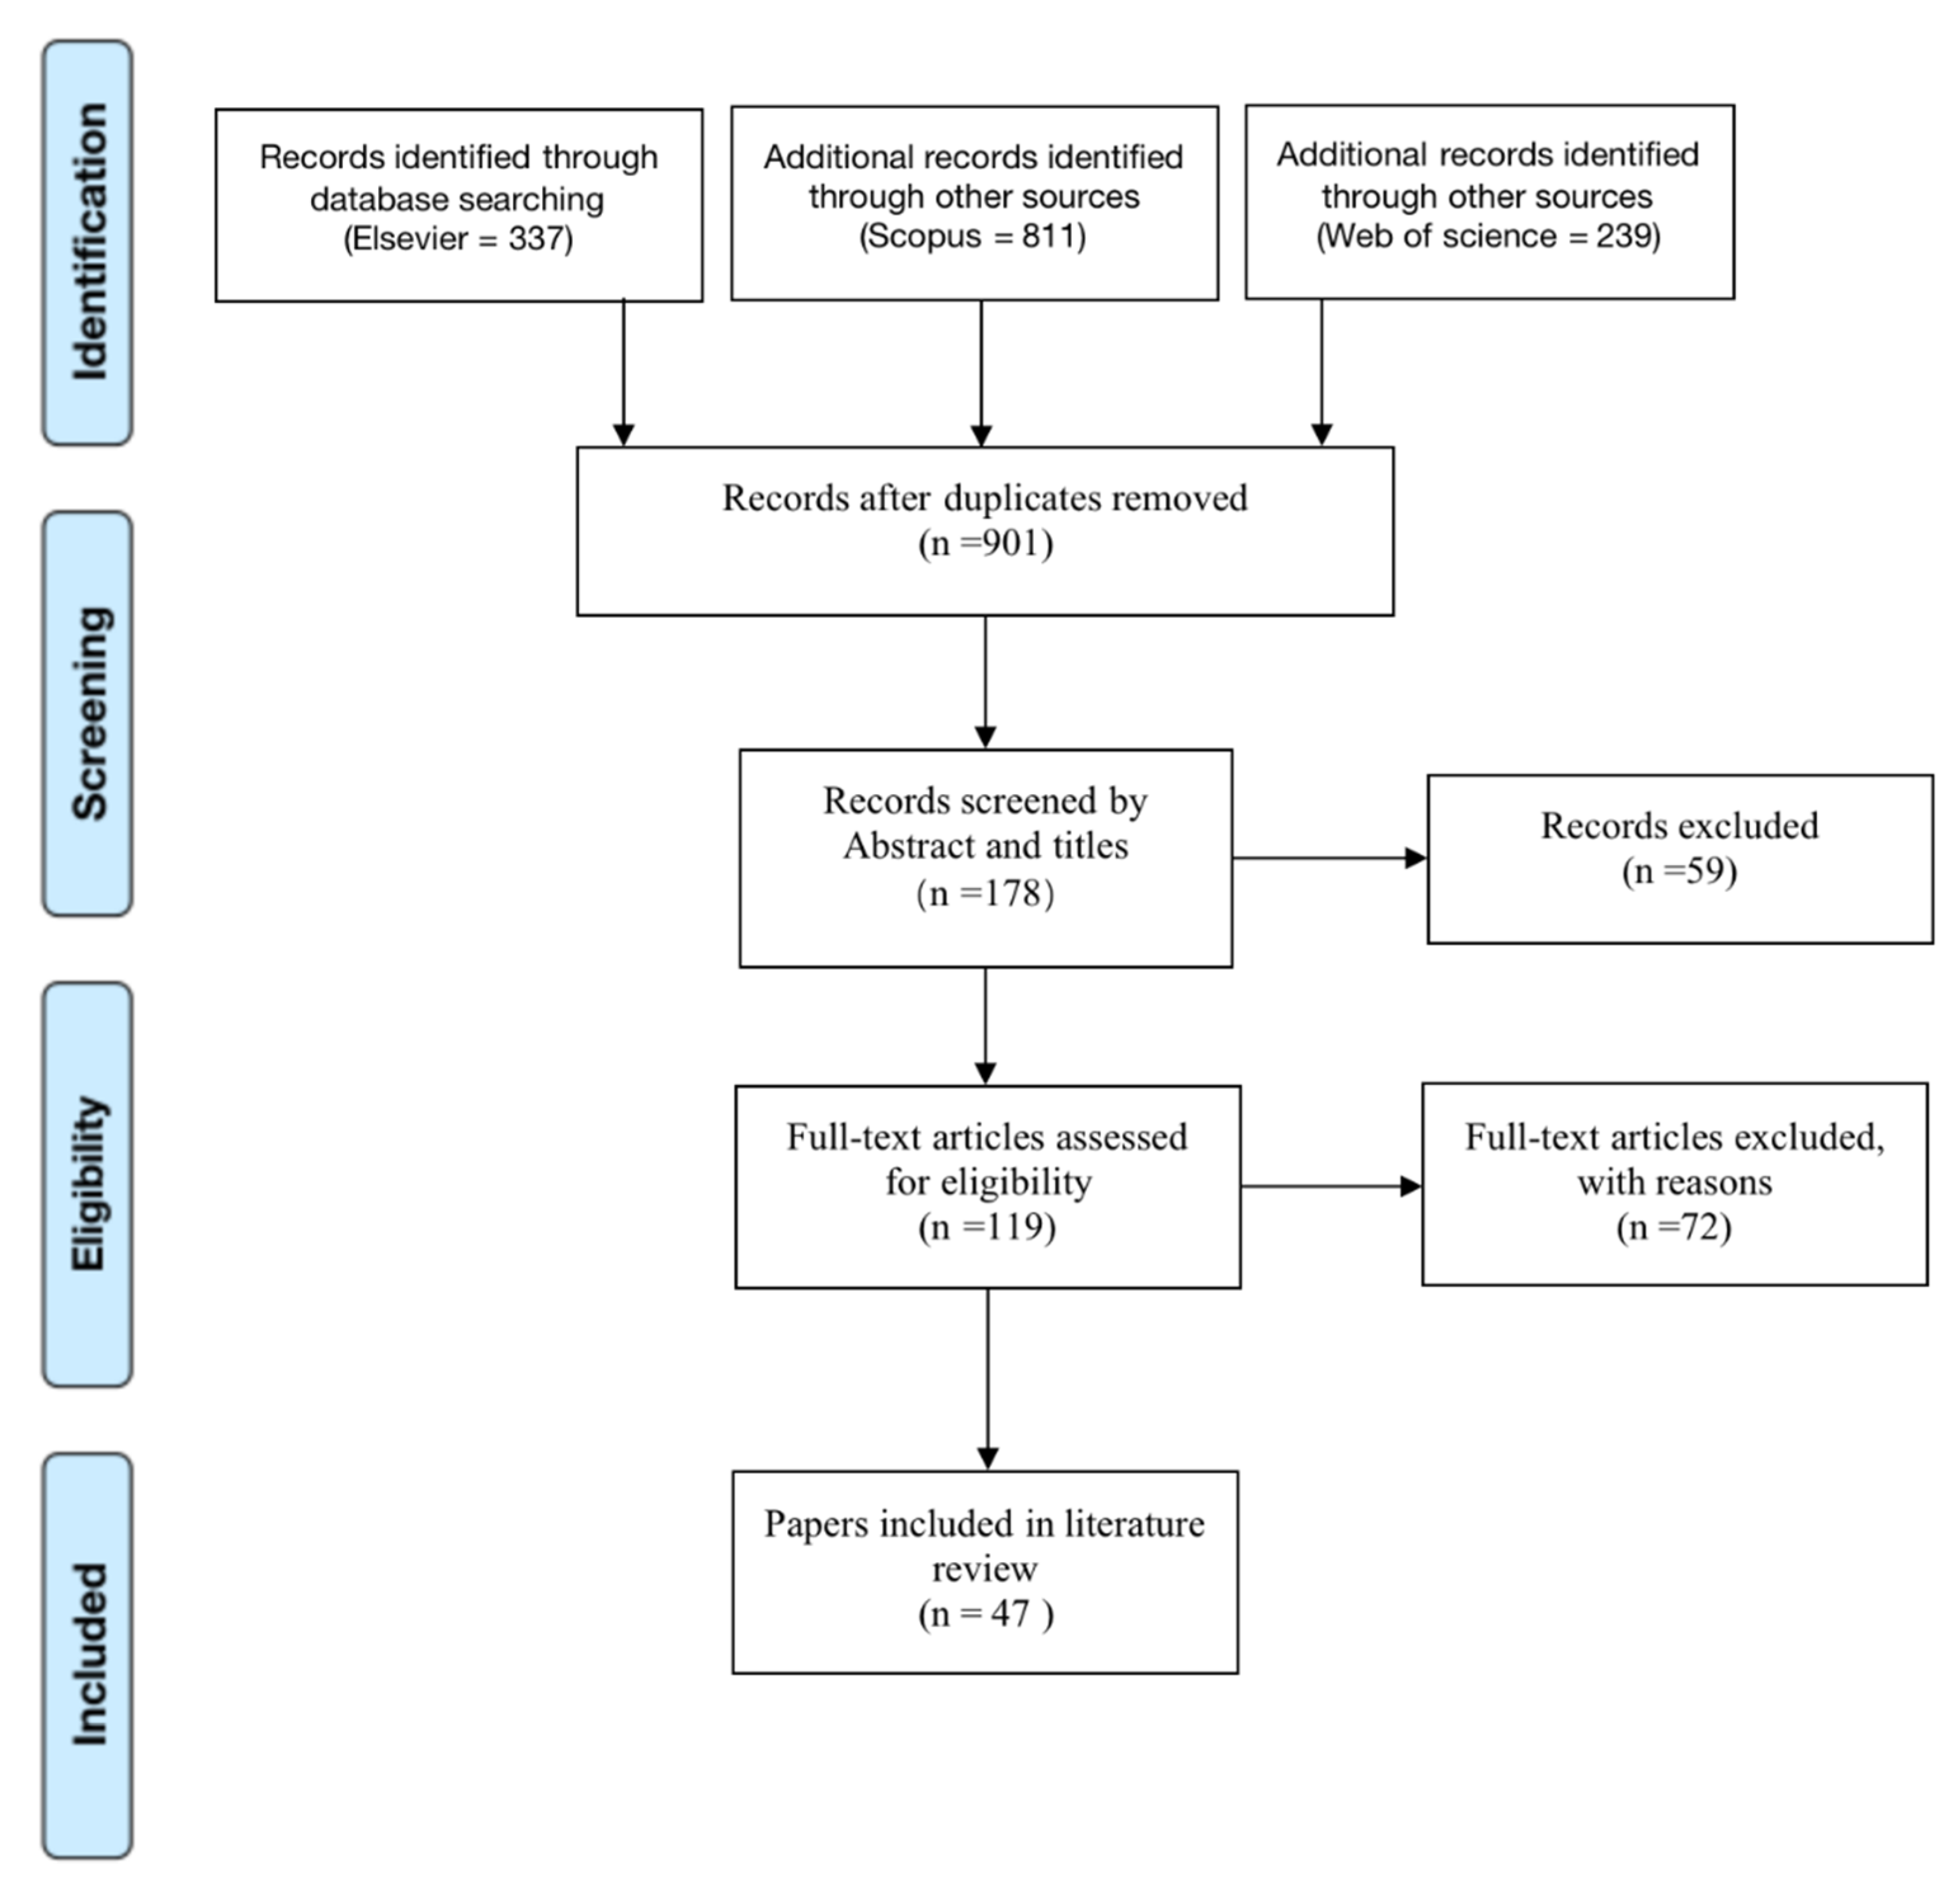
2. Methods
3. Results and Discussion
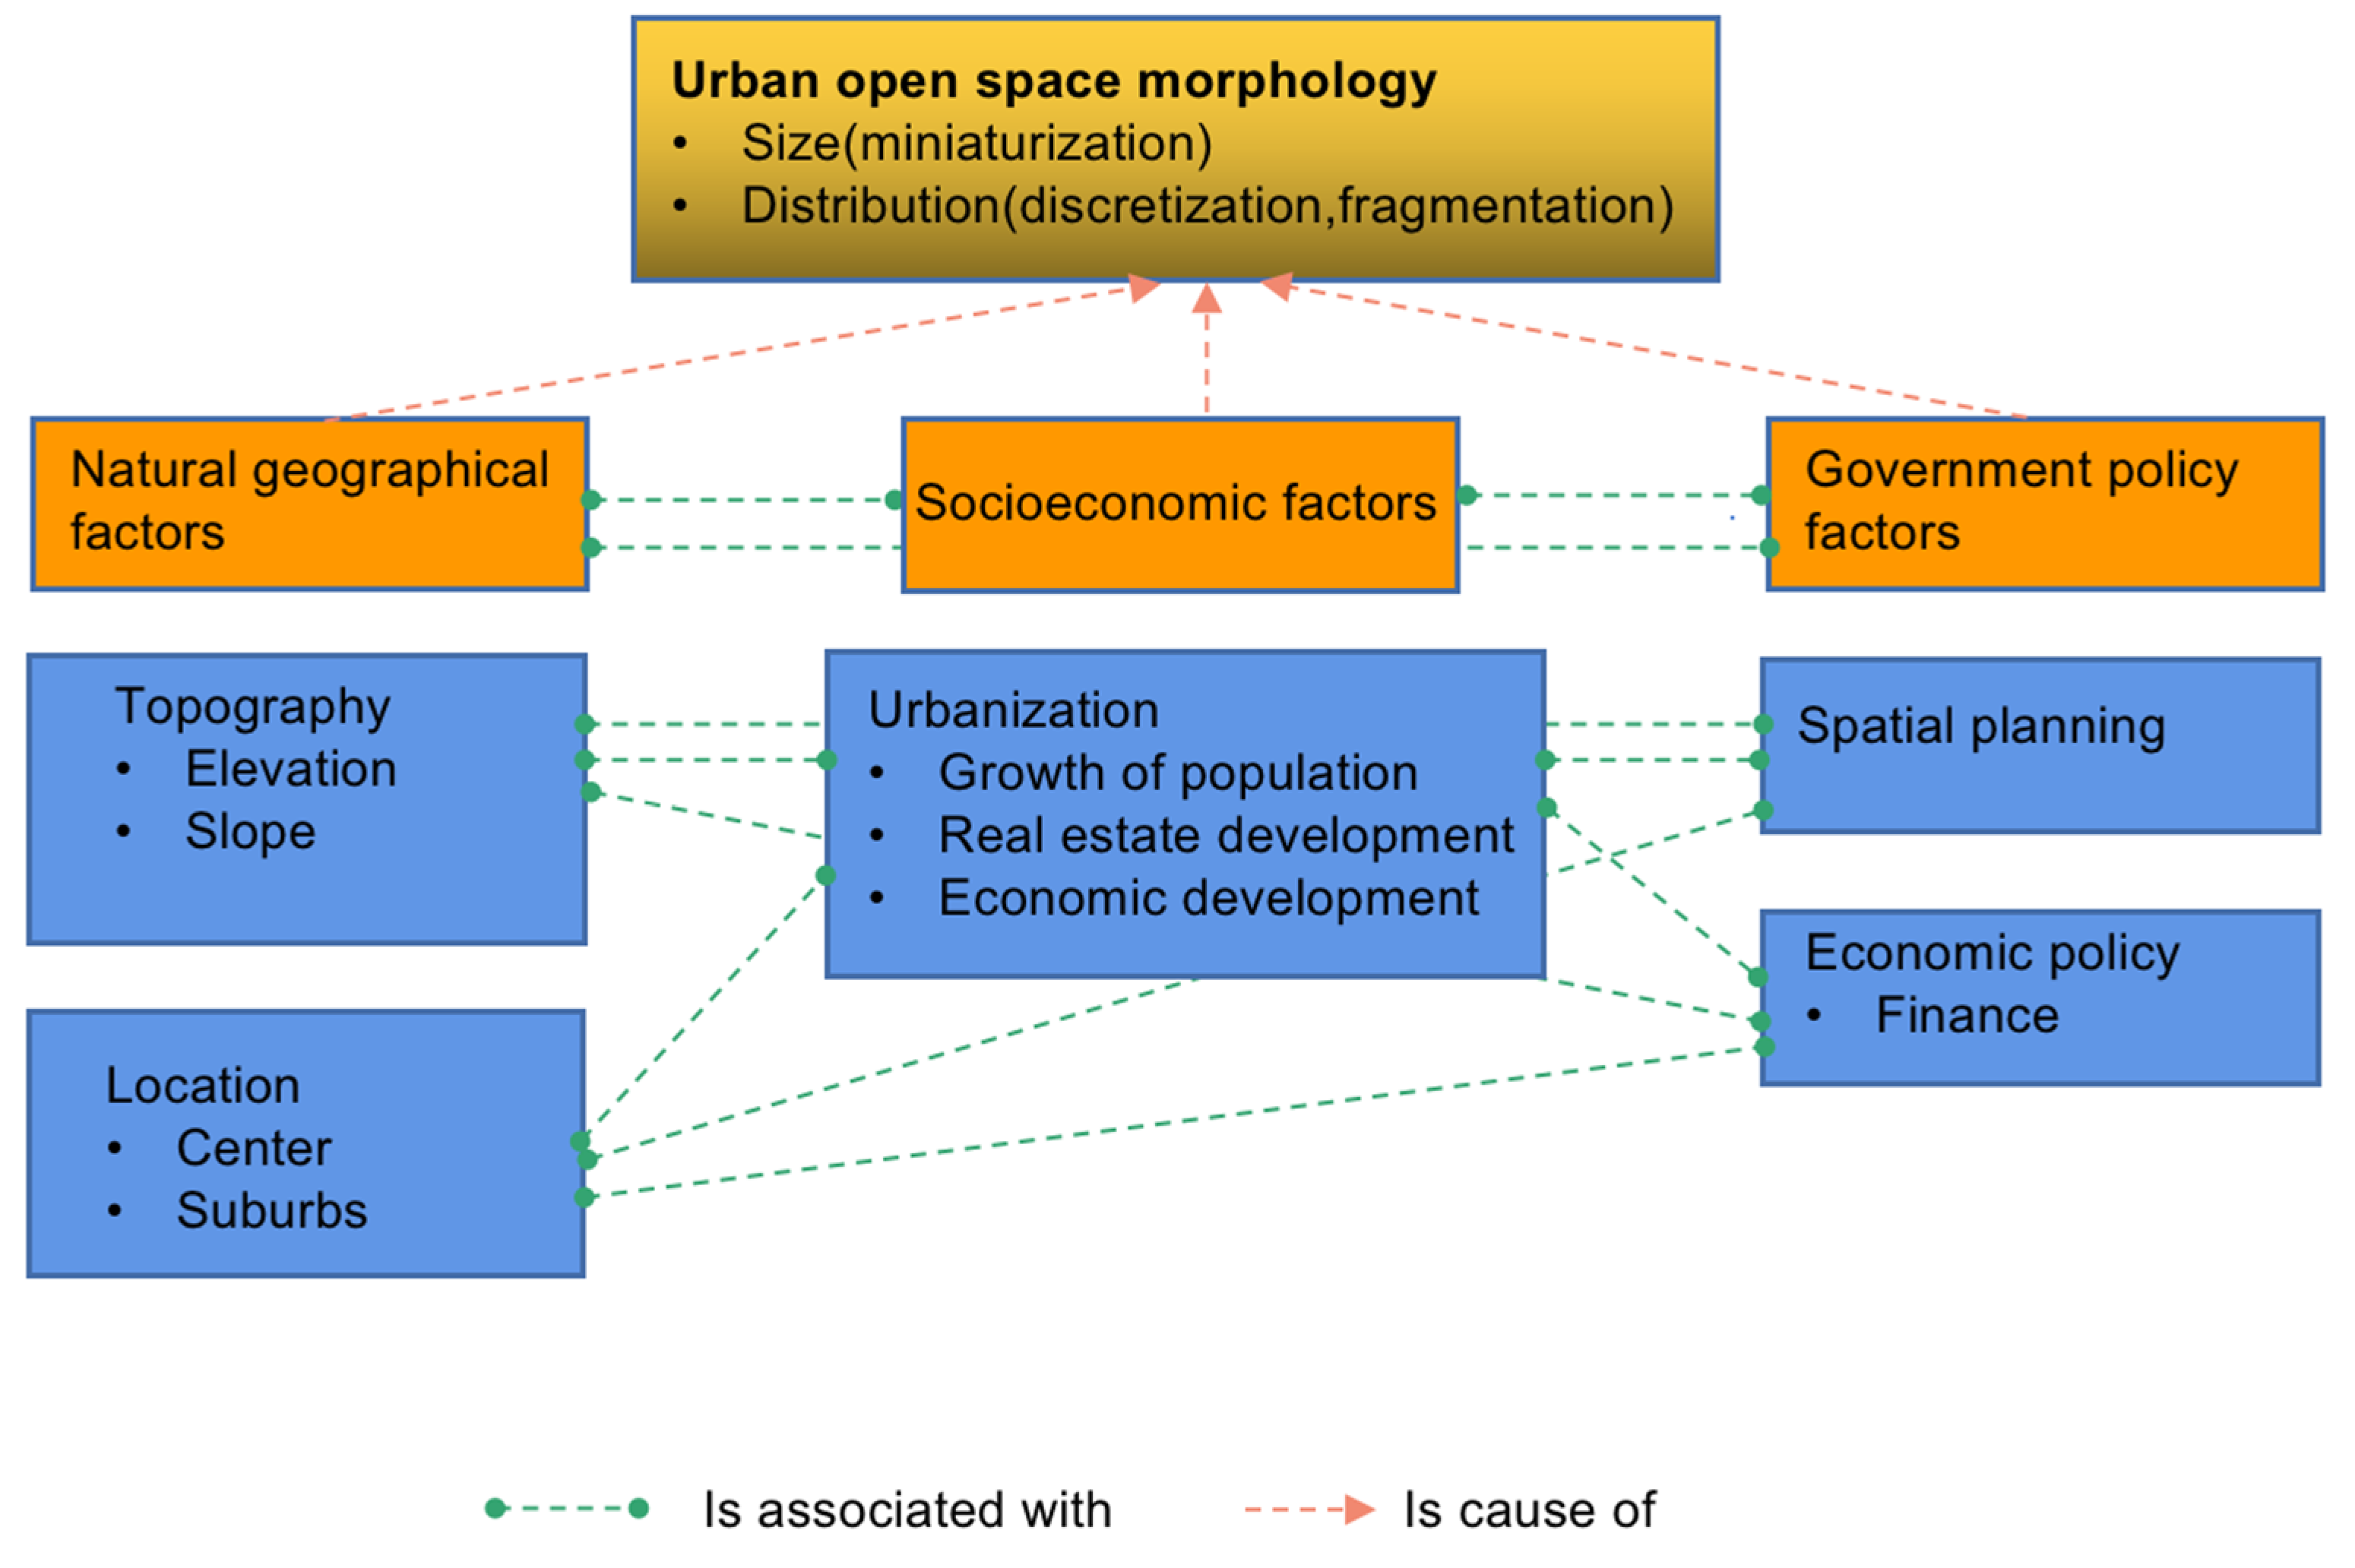
3.1. Drivers Influencing Urban Open Space Morphology
3.1.1. Natural Geographical Factors
3.1.2. Government Policy Factors
3.1.3. Socioeconomic Factors
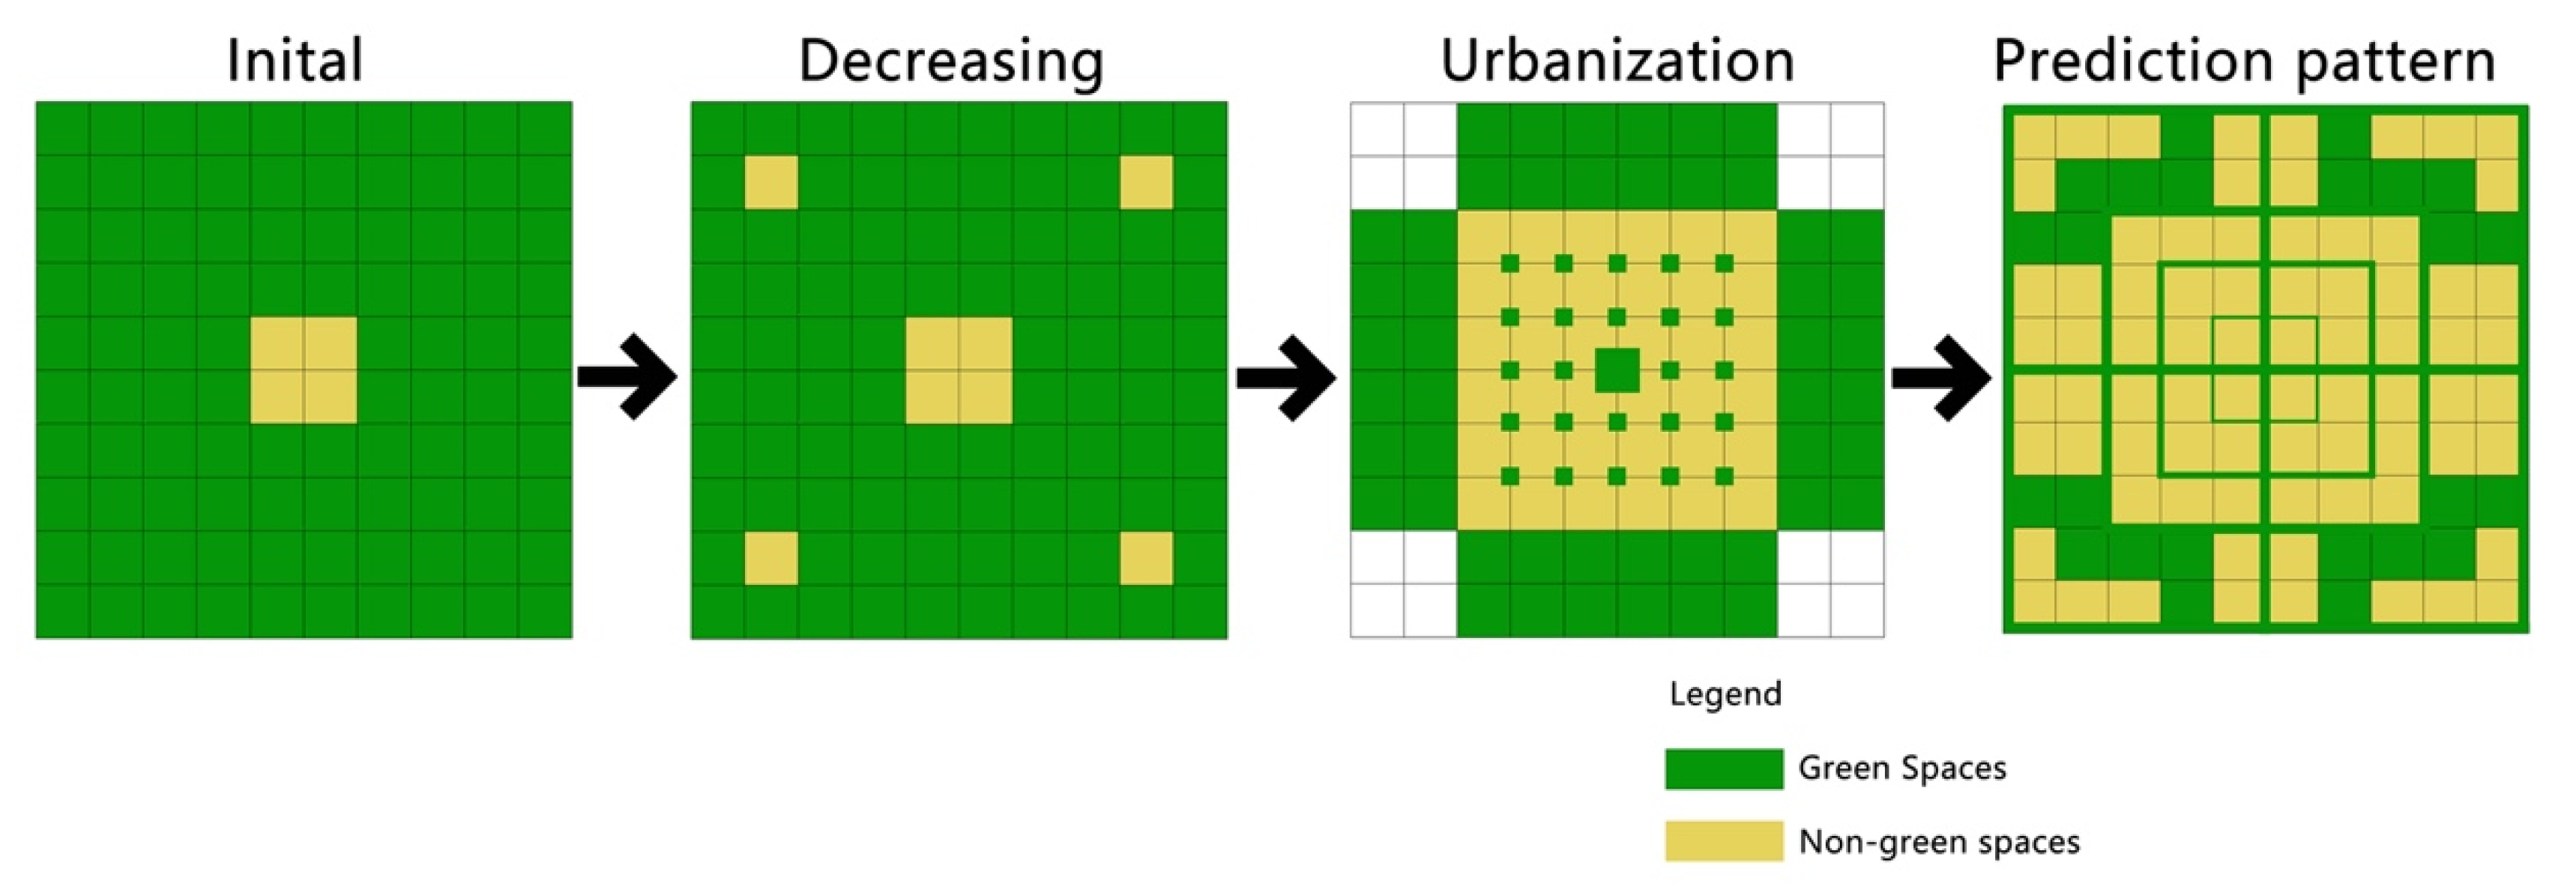
3.1.4. The Interaction Mechanisms of Three Factors on Urban Green Space Changes
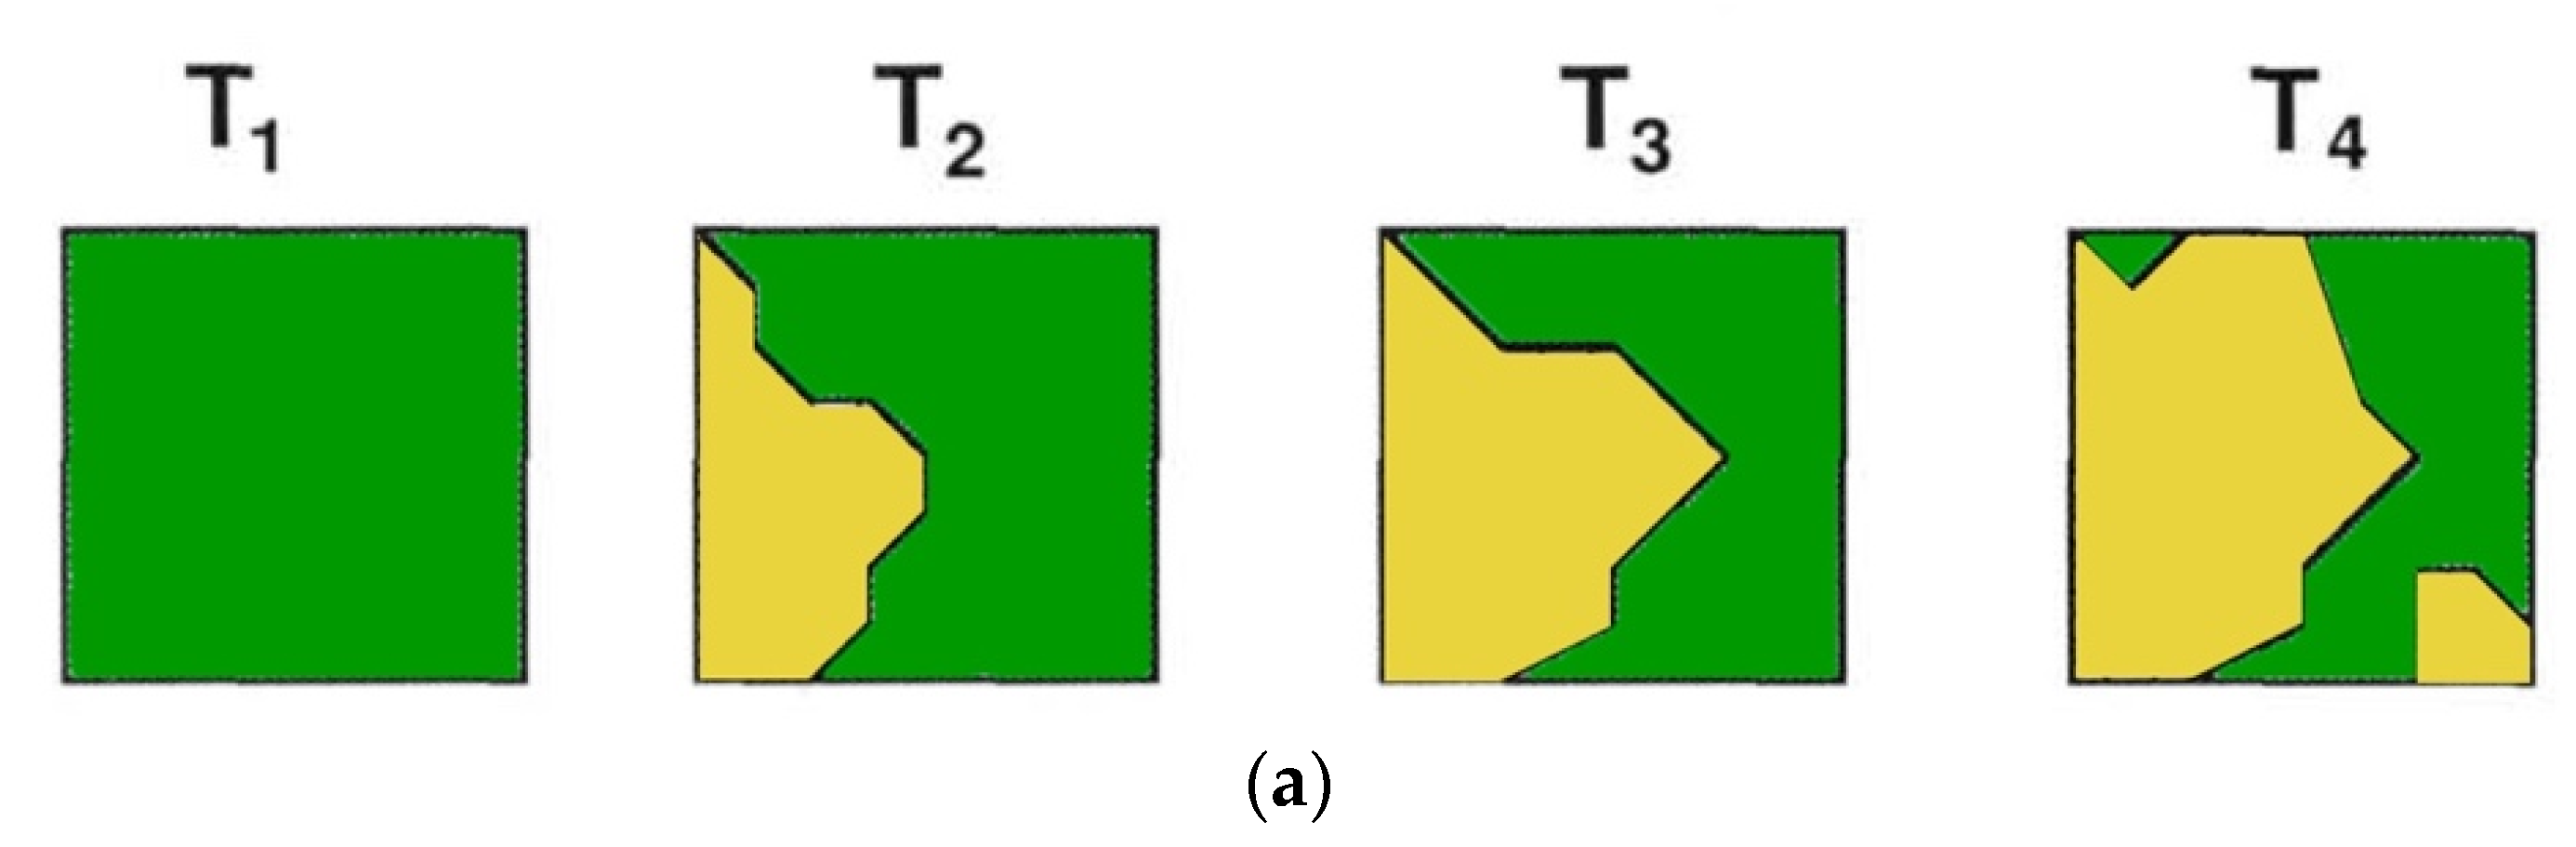
3.2. Trends of Urban Open Space Morphology
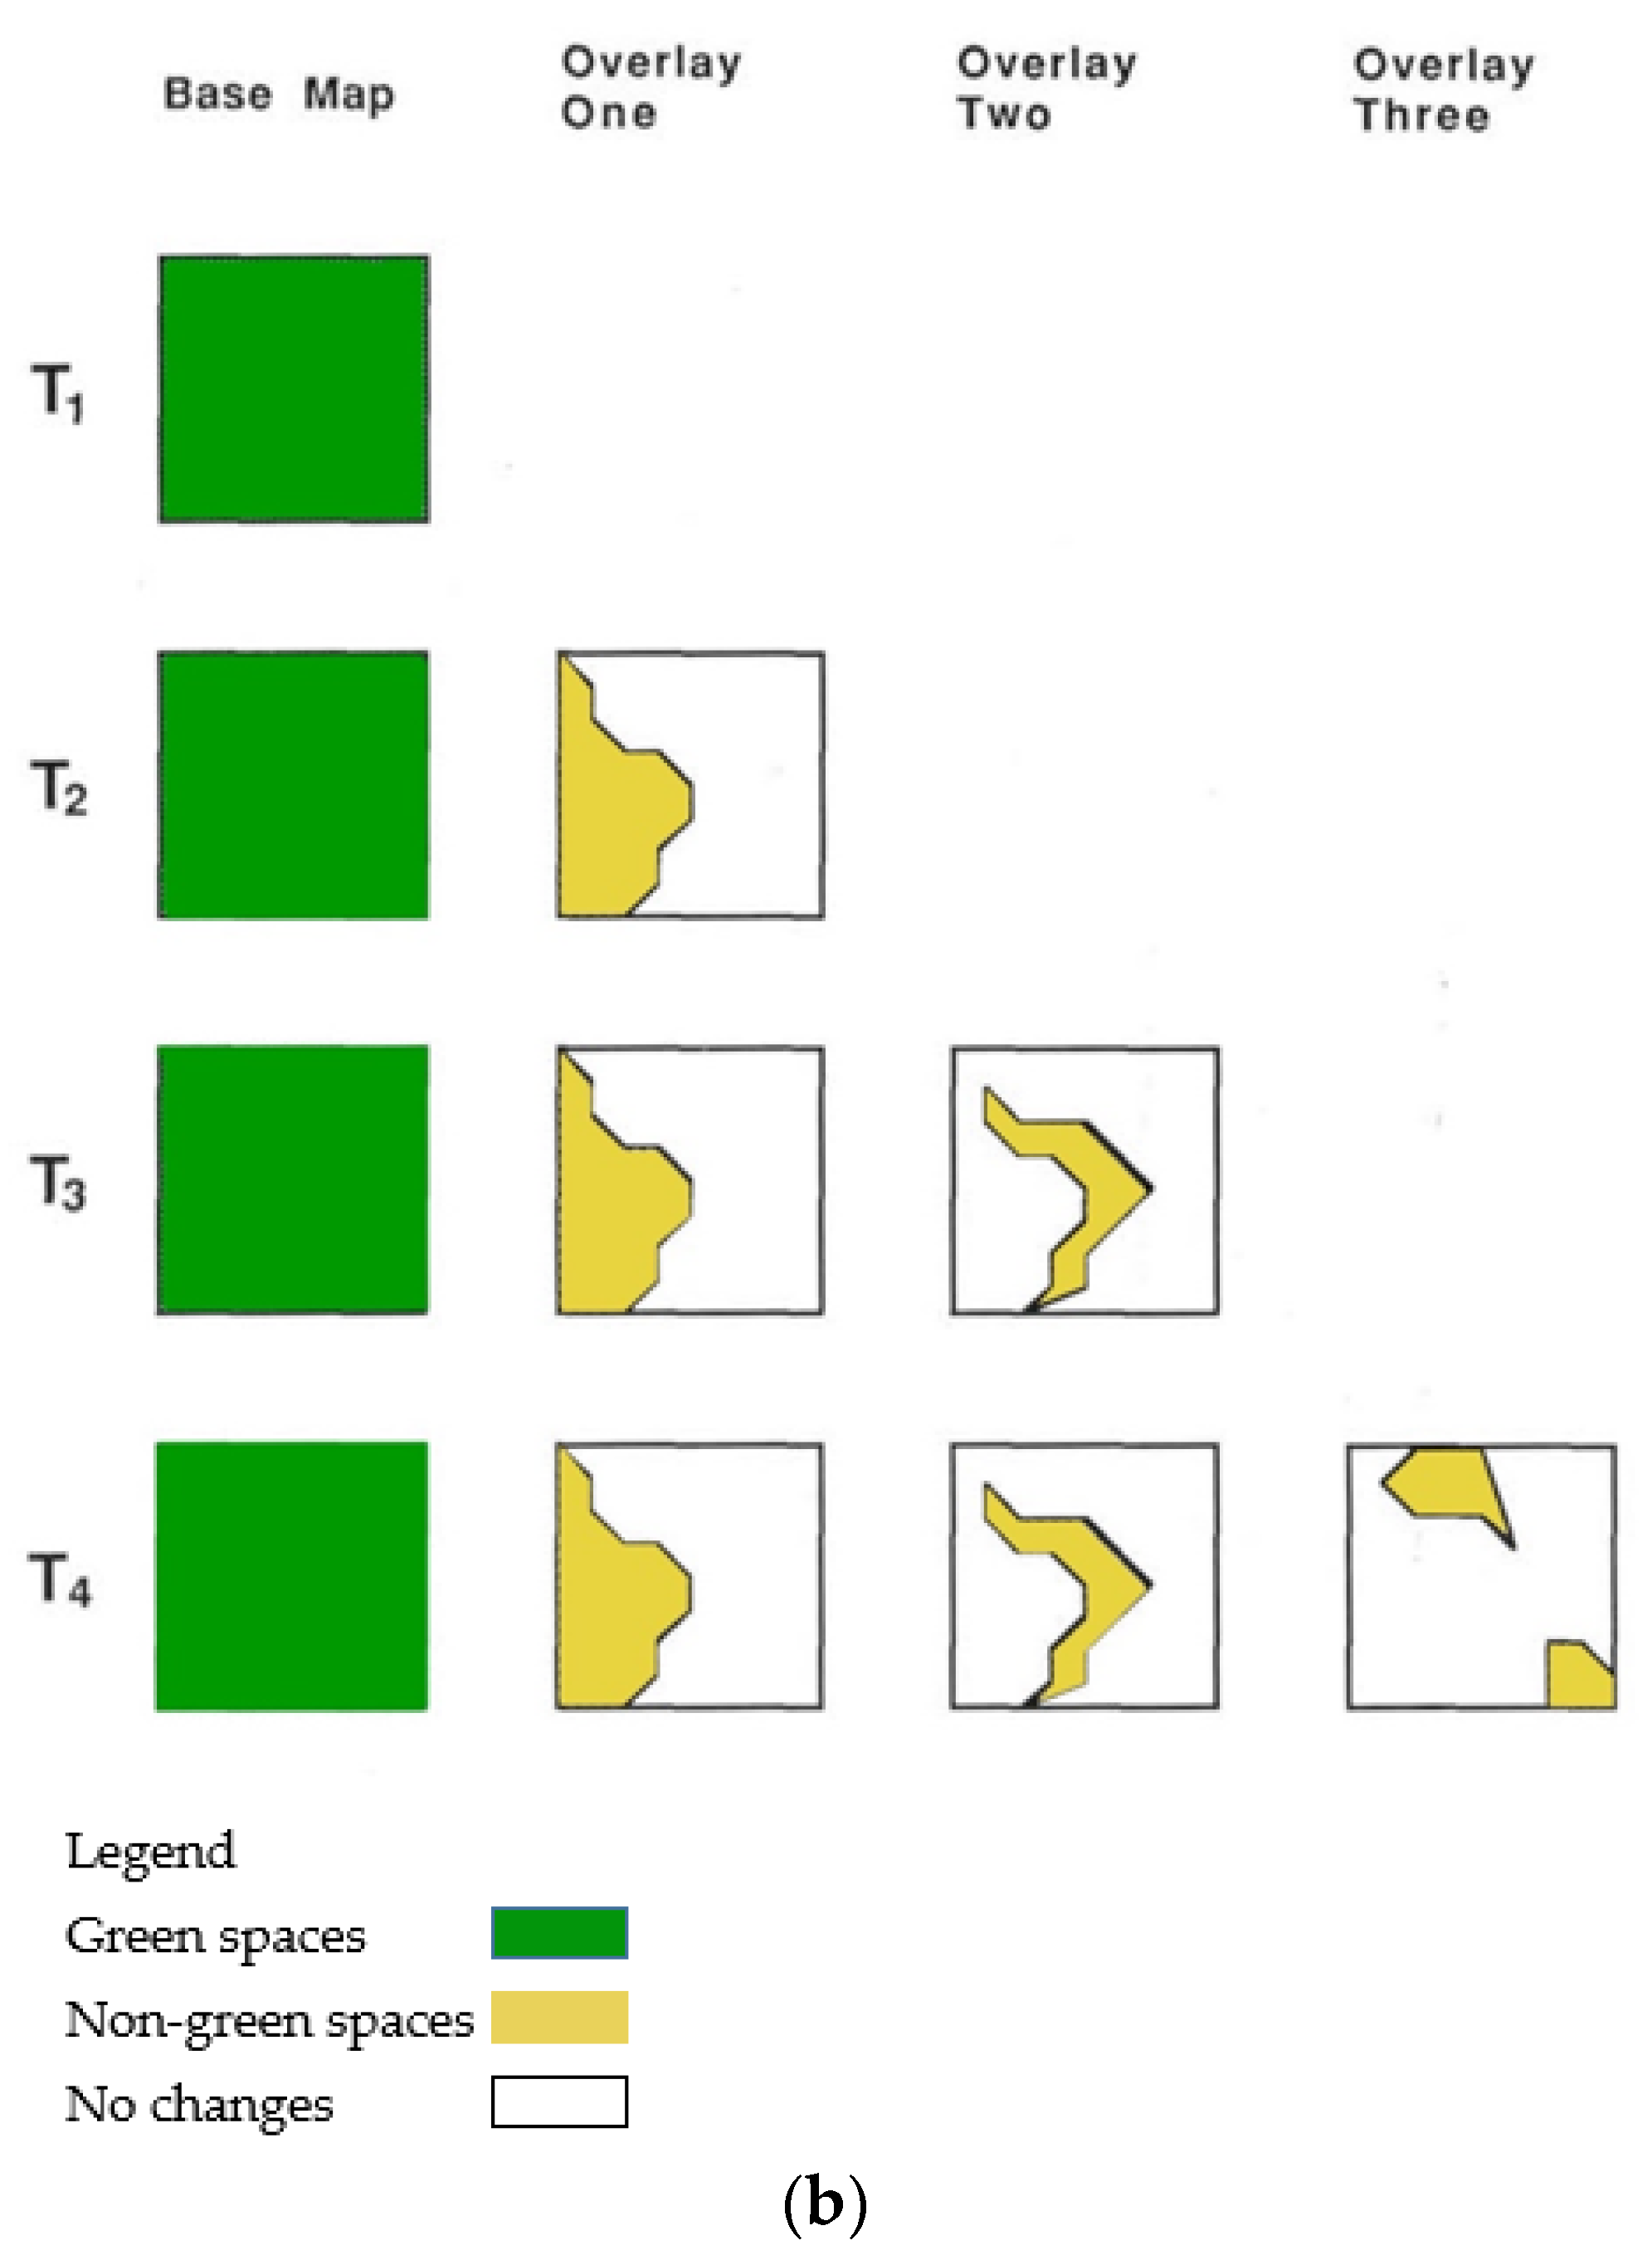
3.3. Methods Applied in Studying on Open Space Morphology
4. Conclusions and Recommendations
Author Contributions
Funding
Institutional Review Board Statement
Informed Consent Statement
Data Availability Statement
Conflicts of Interest
References
- Tang, B.-S.; Wong, S.-W. A Longitudinal Study of Open Space Zoning and Development in Hong Kong. Landsc. Urban Plan. 2008, 87, 258–268. [Google Scholar]
- Zube, E.; Moore, G. Advance in Environment, Behavior, and Design; Springer: Berlin/Heidelberg, Germany, 1989. [Google Scholar] [CrossRef]
- Haq, S.M.A. Urban Green Spaces and an Integrative Approach to Sustainable Environment. J. Environ. Prot. 2011, 2, 601–608. [Google Scholar]
- Zhang, L.; Tan, P.Y.; Richards, D. Relative Importance of Quantitative and Qualitative Aspects of Urban Green Spaces in Promoting Health. Landsc. Urban Plan. 2021, 213, 104131. [Google Scholar]
- Venter, Z.S.; Barton, D.N.; Gundersen, V.; Figari, H.; Nowell, M.S. Back to Nature: Norwegians Sustain Increased Recreational Use of Urban Green Space Months after the COVID-19 Outbreak. Landsc. Urban Plan. 2021, 214, 104175. [Google Scholar]
- Wu, L.; Rowe, P.G. Green Space Progress or Paradox: Identifying Green Space Associated Gentrification in Beijing. Landsc. Urban Plan. 2022, 219, 104321. [Google Scholar]
- Urban Development. Available online: https://www.worldbank.org/en/topic/urbandevelopment/overview (accessed on 18 June 2022).
- Nor Akmar, A.A.; Konijnendijk, C.C.; Sreetheran, M.; Nilsson, K. Greenspace Planning and Management in Klang Valley, Peninsular Malaysia. Arboric. Urban For. 2011, 37, 99–107. [Google Scholar] [CrossRef]
- Jim, C.Y. Monitoring the Performance and Decline of Heritage Trees in Urban Hong Kong. J. Environ. Manag. 2005, 74, 161–172. [Google Scholar]
- Qureshi, S.; Hasan Kazmi, S.J.; Breuste, J.H. Ecological Disturbances due to High Cutback in the Green Infrastructure of Karachi: Analyses of Public Perception about Associated Health Problems. Urban For. Urban Green. 2010, 9, 187–198. [Google Scholar]
- Uy, P.D.; Nakagoshi, N. Analyzing Urban Green Space Pattern and Eco-Network in Hanoi, Vietnam. Landsc. Ecol. Eng. 2007, 3, 143–157. [Google Scholar]
- Anguluri, R.; Narayanan, P. Role of Green Space in Urban Planning: Outlook towards Smart Cities. Urban For. Urban Greening. 2017, 25, 58–65. [Google Scholar] [CrossRef]
- Mıhçıoğlu Bilgi, E. The Physical Evolution of the Historic City of Ankara between 1839 and 1944: A Morphological Analysis; Middle East Technical University: Ankara, Turkey, 2010. [Google Scholar]
- Wortley, L.; Hero, J.-M.; Howes, M. Evaluating Ecological Restoration Success: A Review of the Literature. Restor. Ecol. 2013, 21, 537–543. [Google Scholar]
- Howes, M.; Wortley, L.; Potts, R.; Dedekorkut-Howes, A.; Serrao-Neumann, S.; Davidson, J.; Smith, T.; Nunn, P. Environmental Sustainability: A Case of Policy Implementation Failure? Sustain. Sci. Pract. Policy 2017, 9, 165. [Google Scholar] [CrossRef]
- Boulton, C.; Dedekorkut-Howes, A.; Byrne, J. Factors Shaping Urban Greenspace Provision: A Systematic Review of the Literature. Landsc. Urban Plan. 2018, 178, 82–101. [Google Scholar]
- Nordin, A.N.; Ling, G.H.T.; Tan, M.L.; Ho, C.S.; Ali, H.M. Spatial and Non-Spatial Factors Influencing Willingness to Pay (WTP) for Urban Green Spaces (UGS): A Review. J. Sustain. Dev. Afr. 2020, 13, 130. [Google Scholar]
- Ballantyne, M.; Pickering, C.M. The Impacts of Trail Infrastructure on Vegetation and Soils: Current Literature and Future Directions. J. Environ. Manag. 2015, 164, 53–64. [Google Scholar]
- Liu, H.; Li, F.; Xu, L.; Han, B. The Impact of Socio-Demographic, Environmental, and Individual Factors on Urban Park Visitation in Beijing, China. J. Clean. Prod. 2017, 163, S181–S188. [Google Scholar] [CrossRef]
- Humpel, N.; Owen, N.; Leslie, E. Environmental Factors Associated with Adults’ Participation in Physical Activity: A Review. Am. J. Prev. Med. 2002, 22, 188–199. [Google Scholar] [CrossRef]
- Wang, D.; Brown, G.; Liu, Y. The Physical and Non-Physical Factors That Influence Perceived Access to Urban Parks. Landsc. Urban Plan. 2015, 133, 53–66. [Google Scholar] [CrossRef]
- Zhang, H.-L.; Padullés Cubino, J.; Nizamani, M.M.; Harris, A.J.; Cheng, X.-L.; Da, L.; Sun, Z.; Wang, H.-F. Wealth and Land Use Drive the Distribution of Urban Green Space in the Tropical Coastal City of Haikou, China. Urban For. Urban Green. 2022, 71, 127554. [Google Scholar]
- Xiao, Z.; Tian, Y.; Hao, L. Evolution of Green Space Based on Remote Sensing Images in Zhengdong New District. Proc. Int. Wirel. Commun. Mob. Comput. Conf. 2022, 2022, 3599045. [Google Scholar] [CrossRef]
- Siddique, S.; Uddin, M.M. Green Space Dynamics in Response to Rapid Urbanization: Patterns, Transformations and Topographic Influence in Chattogram City, Bangladesh. Land Use Policy 2022, 114, 105974. [Google Scholar] [CrossRef]
- Choi, J.; Kim, G. History of Seoul’s Parks and Green Space Policies: Focusing on Policy Changes in Urban Development. Land 2022, 11, 474. [Google Scholar] [CrossRef]
- Nawar, N.; Sorker, R.; Chowdhury, F.J.; Rahman, M. Present Status and Historical Changes of Urban Green Space in Dhaka City, Bangladesh: A Remote Sensing Driven Approach. Environ. Chall. 2022, 6, 100425. [Google Scholar] [CrossRef]
- Liu, J.; Zhang, L.; Zhang, Q.; Li, C.; Zhang, G.; Wang, Y. Spatiotemporal Evolution Differences of Urban Green Space: A Comparative Case Study of Shanghai and Xuchang in China. Land Use Policy 2022, 112, 105824. [Google Scholar] [CrossRef]
- Liu, Y.; Li, H.; Li, C.; Zhong, C.; Chen, X. An Investigation on Shenzhen Urban Green Space Changes and Their Effect on Local Eco-Environment in Recent Decades. Sustain. Sci. Pract. Policy 2021, 13, 12549. [Google Scholar] [CrossRef]
- Zhou, Q.; Konijnendijk van den Bosch, C.C.; Chen, Z.; Wang, X.; Zhu, L.; Chen, J.; Lin, Y.; Dong, J. China’s Green Space System Planning: Development, Experiences, and Characteristics. Urban For. Urban Green. 2021, 60, 127017. [Google Scholar] [CrossRef]
- Muhamad Nor, A.N.; Abdul Aziz, H.; Nawawi, S.A.; Muhammad Jamil, R.; Abas, M.A.; Hambali, K.A.; Yusoff, A.H.; Ibrahim, N.; Rafaai, N.H.; Corstanje, R.; et al. Evolution of Green Space under Rapid Urban Expansion in Southeast Asian Cities. Sustain. Sci. Pract. Policy 2021, 13, 12024. [Google Scholar] [CrossRef]
- Woldesemayat, E.M.; Genovese, P.V. Monitoring Urban Expansion and Urban Green Spaces Change in Addis Ababa: Directional and Zonal Analysis Integrated with Landscape Expansion Index. For. Trees Livelihoods 2021, 12, 389. [Google Scholar] [CrossRef]
- Weng, H.; Gao, Y.; Su, X.; Yang, X.; Cheng, F.; Ma, R.; Liu, Y.; Zhang, W.; Zheng, L. Spatial-Temporal Changes and Driving Force Analysis of Green Space in Coastal Cities of Southeast China over the Past 20 Years. Land 2021, 10, 537. [Google Scholar] [CrossRef]
- Wu, W.-B.; Ma, J.; Meadows, M.E.; Banzhaf, E.; Huang, T.-Y.; Liu, Y.-F.; Zhao, B. Spatio-Temporal Changes in Urban Green Space in 107 Chinese Cities (1990–2019): The Role of Economic Drivers and Policy. Int. J. Appl. Earth Obs. Geoinf. 2021, 103, 102525. [Google Scholar] [CrossRef]
- Liu, S.; Zhang, X.; Feng, Y.; Xie, H.; Jiang, L.; Lei, Z. Spatiotemporal Dynamics of Urban Green Space Influenced by Rapid Urbanization and Land Use Policies in Shanghai. For. Trees Livelihoods 2021, 12, 476. [Google Scholar] [CrossRef]
- Siddique, G.; Roy, A.; Mandal, M.H.; Ghosh, S.; Basak, A.; Singh, M.; Mukherjee, N. An Assessment on the Changing Status of Urban Green Space in Asansol City, West Bengal. GeoJournal 2022, 87, 1299–1321. [Google Scholar] [CrossRef]
- Wan, J.; Zhao, Z. Analysis of landscape pattern change and ecosystem service value of urban green space—Taking Beidaihe district as an example. Fresenius Environ. Bull. 2020, 29, 5382–5389. [Google Scholar]
- Munyati, C.; Drummond, J.H. Loss of Urban Green Spaces in Mafikeng, South Africa. World Dev. Perspect. 2020, 19, 100226. [Google Scholar] [CrossRef]
- Rahaman, S.; Jahangir, S.; Haque, M.S.; Chen, R.; Kumar, P. Spatio-Temporal Changes of Green Spaces and Their Impact on Urban Environment of Mumbai, India. Environ. Dev. Sustain. A Multidiscip. Approach Theory Pract. Sustain. Dev. 2021, 23, 6481–6501. [Google Scholar] [CrossRef]
- Girma, Y.; Terefe, H.; Pauleit, S.; Kindu, M. Urban Green Spaces Supply in Rapidly Urbanizing Countries: The Case of Sebeta Town, Ethiopia. Remote Sens. Appl. Soc. Environ. 2019, 13, 138–149. [Google Scholar] [CrossRef]
- Rasli, F.N.; Kanniah, K.D.; Ho, C.S. Analysis of Fragmented Green Spaces in Kuala Lumpur, Malaysia. Chem. Eng. Trans. 2019, 72, 457–462. [Google Scholar]
- Wu, Z.; Chen, R.; Meadows, M.E.; Sengupta, D.; Xu, D. Changing Urban Green Spaces in Shanghai: Trends, Drivers and Policy Implications. Land Use Policy 2019, 87, 104080. [Google Scholar] [CrossRef]
- Aklibasinda, M.; Ozdarici Ok, A. Determination of the Urbanization and Changes in Open-Green Spaces in Nevsehir City through Remote Sensing. Environ. Monit. Assess. 2019, 191, 756. [Google Scholar] [CrossRef]
- Badiu, D.L.; Onose, D.A.; Niță, M.R.; Lafortezza, R. From “red” to Green? A Look into the Evolution of Green Spaces in a Post-Socialist City. Landsc. Urban Plan. 2019, 187, 156–164. [Google Scholar] [CrossRef]
- Sun, C.; Lin, T.; Zhao, Q.; Li, X.; Ye, H.; Zhang, G.; Liu, X.; Zhao, Y. Spatial Pattern of Urban Green Spaces in a Long-Term Compact Urbanization process—A Case Study in China. Ecol. Indic. 2019, 96, 111–119. [Google Scholar] [CrossRef]
- Li, F.; Zheng, W.; Wang, Y.; Liang, J.; Xie, S. Urban Green Space Fragmentation and Urbanization: A Spatiotemporal Perspective. Forests 2019, 10, 333. [Google Scholar] [CrossRef]
- Krzyżaniak, M.; Świerk, D.; Szczepańska, M.; Urbański, P. Changes in the Area of Urban Green Space in Cities of Western Poland. Bull. Geogr. Socio-Econ. Ser. 2018, 39, 65–77. [Google Scholar] [CrossRef]
- Tang, H.; Liu, W.; Yun, W. Spatiotemporal Dynamics of Green Spaces in the Beijing–Tianjin–Hebei Region in the Past 20 Years. Sustain. Sci. Pract. Policy 2018, 10, 2949. [Google Scholar] [CrossRef] [Green Version]
- Azare, I.M.; Dantata, I.J.; Musa, I.D.; Duala, T. Urban Public Spaces and Associated Environmental Challenges in Nigeria: A Review. Int. J. Innov. Res. Dev. 2018, 7, 18026. [Google Scholar] [CrossRef]
- Chan, K.M.; Vu, T.T. A Landscape Ecological Perspective of the Impacts of Urbanization on Urban Green Spaces in the Klang Valley. Appl. Geogr. 2017, 85, 89–100. [Google Scholar] [CrossRef]
- Wang, Z.B.; Zhang, L.J.; Zhao, X.L.; Du, H.Y.; Yang, D.Y.; Cai, Y.L. Analysis on landscape pattern of urban green space in Shanghai. J. Environ. Prot. Ecol. 2017, 18, 788–801. [Google Scholar]
- Tang, B.-S. Is the Distribution of Public Open Space in Hong Kong Equitable, Why Not? Landsc. Urban Plan. 2017, 161, 80–89. [Google Scholar] [CrossRef]
- Richards, D.R.; Passy, P.; Oh, R.R.Y. Impacts of Population Density and Wealth on the Quantity and Structure of Urban Green Space in Tropical Southeast Asia. Landsc. Urban Plan. 2017, 157, 553–560. [Google Scholar] [CrossRef]
- Xu, H.; Cui, J. Assessing changes in green space of Suzhou city using remote-sensing images and landscape metrics. Int. J. Simul. Syst. Sci. Technol. 2016, 17, 31.1–31.8. [Google Scholar]
- Xu, H. Assessment of Changes in Green Space of Nanjing City Using 1998 and 2007 Landsat Satellite Data. Open House Int. 2015, 40, 63–70. [Google Scholar] [CrossRef]
- Haaland, C.; van den Bosch, C.K. Challenges and Strategies for Urban Green-Space Planning in Cities Undergoing Densification: A Review. Urban For. Urban Green. 2015, 14, 760–771. [Google Scholar]
- Sharma, K.; Jalan, S. Change assessment of urban green spaces of Dehradun city using image derived parameters. Trans. Inst. Indian Geogr. 2013, 35, 63–74. [Google Scholar]
- Zhao, J.; Chen, S.; Jiang, B.; Ren, Y.; Wang, H.; Vause, J.; Yu, H. Temporal Trend of Green Space Coverage in China and Its Relationship with Urbanization over the Last Two Decades. Sci. Total Environ. 2013, 442, 455–465. [Google Scholar] [PubMed]
- Senanayake, I.P.; Welivitiya, W.D.D.P.; Nadeeka, P.M. Urban Green Spaces Analysis for Development Planning in Colombo, Sri Lanka, Utilizing THEOS Satellite Imagery—A Remote Sensing and GIS Approach. Urban For. Urban Green. 2013, 12, 307–314. [Google Scholar] [CrossRef]
- Xu, X.; Duan, X.; Sun, H.; Sun, Q. Green Space Changes and Planning in the Capital Region of China. Environ. Manag. 2011, 47, 456–467. [Google Scholar]
- Tian, Y.; Jim, C.Y.; Tao, Y.; Shi, T. Landscape Ecological Assessment of Green Space Fragmentation in Hong Kong. Urban For. Urban Green. 2011, 10, 79–86. [Google Scholar]
- Zhou, X.; Wang, Y.-C. Spatial–temporal Dynamics of Urban Green Space in Response to Rapid Urbanization and Greening Policies. Landsc. Urban Plan. 2011, 100, 268–277. [Google Scholar]
- Rafiee, R.; Salman Mahiny, A.; Khorasani, N. Assessment of Changes in Urban Green Spaces of Mashad City Using Satellite Data. Int. J. Appl. Earth Obs. Geoinf. 2009, 11, 431–438. [Google Scholar] [CrossRef]
- Yang, J.; Jinxing, Z. The Failure and Success of Greenbelt Program in Beijing. Urban For. Urban Green. 2007, 6, 287–296. [Google Scholar]
- Kong, F.; Nakagoshi, N. Spatial-Temporal Gradient Analysis of Urban Green Spaces in Jinan, China. Landsc. Urban Plan. 2006, 78, 147–164. [Google Scholar] [CrossRef]
- Nirarta Samadhi, T.; Tantayanusorn, N. Reinventing Religious Land as Urban Open Space: The Case of Kuang in Chiang Mai (Thailand). Habitat Int. 2006, 4, 886–901. [Google Scholar] [CrossRef]
- De Sousa, C.A. Turning Brownfields into Green Space in the City of Toronto. Landsc. Urban Plan. 2003, 62, 181–198. [Google Scholar] [CrossRef]
- Zhang, X.Q. High-Rise and High-Density Compact Urban Form: The Development of Hong Kong. In Compact Cities; Routledge: Abingdon-on-Thames, UK, 2002; pp. 257–266. ISBN 9780203478622. [Google Scholar]
- Johnson, M.P. Environmental Impacts of Urban Sprawl: A Survey of the Literature and Proposed Research Agenda. Environ. Plan. A 2001, 33, 717–735. [Google Scholar] [CrossRef]
- Huang, B.; Ouyang, Z.; Zheng, H.; Zhang, H.; Wang, X. Construction of an Eco-Island: A Case Study of Chongming Island, China. Ocean Coast. Manag. 2008, 51, 575–588. [Google Scholar] [CrossRef]
- Fan, P.; Xu, L.; Yue, W.; Chen, J. Accessibility of Public Urban Green Space in an Urban Periphery: The Case of Shanghai. Landsc. Urban Plan. 2017, 165, 177–192. [Google Scholar] [CrossRef]
- United States Environmental Protection Agency. Overview of EPA’s Brownfields Program; US EPA: Washington, DC, USA, 2014. [Google Scholar]
- Beijing Municipal Bureau of Parks. Yearbook of Beijing Landscape and Gardening; Beijing Municipal Bureau of Parks: Beijing, China, 1995. (In Chinese) [Google Scholar]
- Ara, S.; Islam, M.A.; Showkat, S. Effect of Land-Use Intensity on Surface Temperature: A Study on Chittagong City Corporation Area. In Proceedings of the 2016 5th International Conference on Informatics, Electronics and Vision (ICIEV), Dhaka, Bangladesh, 13–14 May 2016; pp. 72–77. [Google Scholar]
- Ethirajan, A. Bangladesh Pins Hope on Chittagong Port. BBC, 4 September 2012. [Google Scholar]
- Bss. Dhaka Ctg EPZ 4th in Global Ranking. Available online: https://www.thedailystar.net/news-detail-156797 (accessed on 19 June 2022).
- Antrop, M. Changing Patterns in the Urbanized Countryside of Western Europe. Landsc. Ecol. 2000, 15, 257–270. [Google Scholar] [CrossRef]
- Ghosh, I. The Dramatic Global Rise of Urbanization. Available online: https://www.weforum.org/agenda/2019/09/mapped-the-dramatic-global-rise-of-urbanization-1950-2020/ (accessed on 19 June 2022).
- McDonald, R.I.; Forman, R.T.T.; Kareiva, P. Open Space Loss and Land Inequality in United States’ Cities, 1990–2000. PLoS ONE 2010, 5, e9509. [Google Scholar] [CrossRef]
- Langran, G.; Chrisman, N.R. A Framework for Temporal Geographic Information. Cartogr. Int. J. Geogr. Inf. Geovis. 1988, 25, 1–14. [Google Scholar] [CrossRef]
- UN-Habitat. Adequate Open Public Space in Cities: A Human Settlements Indicator for Monitoring the Post-2015 Sustainable Development Agenda. In Human Settlements Indicator; UN Human Settlements Programme (UN Habitat): Nairobi, Kenya, 2015. [Google Scholar]

| Year | Types of Settings | Authors | Scale | Research Concerns and Objectives | Identified Drivers of Space Morphology | Methods (Data Collection and Data Analysis) |
|---|---|---|---|---|---|---|
| 2022 | Urban green spaces | [22] | City | Investigating the distribution patterns and drivers of UGS. | Wealth and land use | Using a combination of remote sensing data and fieldwork. Calculating the proportion of UGS in different urban functional units. |
| 2022 | Green spaces | [23] | District | Exploring the local spatial evolution and analyzing the influence factors of its transformation. | Social and economic development. | The remote sensing image data was used as the basic data. Extracting the green space area conversion analysis information. |
| 2022 | Green spaces | [24] | City | Investigating the changing pattern of green spaces and how the topographic gradients of elevation and slope influence changes. | Topographic gradients of elevation and slope. | Applied for land use/land cover classification using GIS. Using overlay analysis. |
| 2022 | Parks and green spaces | [25] | City | Analyzing the correlation between urban development and parks and green spaces policy. | Green spaces policy. | Literature review, including theses, academic journal papers, research reports, and newspaper materials. |
| 2022 | Green spaces | [26] | City | Analyzing the green spaces of Dhaka over a 30-year period using GIS and remote sensing. | High population density and accelerated infrastructure development. | Using GIS and Remote Sensing to collect images. Using normalized difference vegetation index (NDVI) to calculate the total changes. |
| 2022 | Urban green spaces | [27] | Downtown | Comparing the changes of greening policies for UGS evolution in the two cities. | Several urban greening policies. | Using GIS and Remote Sensing to collect images. Statistical Yearbooks and document planning. Using the area change index, spatial morphological dimension, and spatial aggregation dimension. |
| 2021 | Urban green spaces | [28] | City | Exploring the spatial-temporal dynamics of UGS and its influences on urban eco-environments in developing cities. | Rapid urbanization and population growth. | Landsat images and MODIS products; maps; statistical data. Landscape pattern analysis. |
| 2021 | Green spaces | [29] | Not available | Identifying the relevant issues to address the challenges facing China’s Green spaces planning system. | Policy regulations. | Literature review and policy analysis. |
| 2021 | Green spaces | [30] | City | Evaluating the impact of changes on the structure of green spaces, and exploring the impact of different types of urban expansion and planning policies on changes to green space structure. | Rapid urban expansion. | Land use land cover (LULC) maps of the cities were developed based on satellite images. Landscape metrics and statistical analysis. |
| 2021 | Urban green spaces | [31] | City | Assessing the magnitude, directions of urban expansion and UGS change, as well as spatial variations. | The spatio-temporal pattern of urban expansion. | RS and GIS and Landscape Expansion Index (LEI) were used to extract Land Use Land Cover (LULC) data. Measuring urban expansion and UGS change and analyze urban growth patterns. |
| 2021 | Green spaces | [32] | Regional | Revealing the spatial-temporal change and driving factors of green spaces. | Anthropogenic activities and geographical environmental factors. | Remote sensing imageries. Landscape pattern index. |
| 2021 | Urban green spaces | [33] | Cities | Exploring the effect of different levels of urbanization on changes in green spaces. | Economic development. | Using a time-series of remote sensing data. Indexes analysis. |
| 2021 | Urban green spaces | [34] | City | Employing integrated approaches to characterize the changing patterns and intensities of green spaces. | Rapid urbanization and greening policies. | Landsat images to interprete land use datasets. Landscape metrics. |
| 2020 | Urban green spaces | [35] | City | Assessing the present status of green cover and evaluating the spatio-temporal changes in the land use/land cover composition. | Rapid and unplanned urbanization. | Field visits, the Office of the Asansol Municipal Corporation. Calculation of NDVI. |
| 2020 | Urban green spaces | [36] | District | Analyzing the dynamic changes in landscape patterns, quantitatively evaluating the eco-service value of urban green spaces, and discussing how they mutually influence each other. | The rapid development of urban-rural integration and human factors. | Remote sensing image. Landscape pattern index. |
| 2020 | Urban green spaces | [37] | City | How political circumstances of municipal governance and the pursuit of development can precipitate losses. | The political circumstances of an urban area. | Using a time series of satellite images. Using the area calculation function in ArcMap 10.5. |
| 2020 | Green spaces | [38] | City | Analyzing and assessing the changing scale and spatial layout of the urban green spaces. | The expansion of urban and built-up areas, and the influx of migrants. | Using the landsat thematic mapper (TM) and OLI/TIRS remote sensing image data. Assessment using various indices. |
| 2019 | Urban green spaces | [39] | Town | Analyzing urban green space changes and their drivers. | Physical expansion of the built-up area, population growth, high land value, and laxity in the enforcement of planning regulations. | Using series Landsat images, land inventory, interview, focus group discussion, and field observation for data collection, and a combination of techniques, including pixel based image classification, qualitative descriptive and GIS-based processing for data analyses. |
| 2019 | Green spaces | [40] | City | An analysis of fragmented green spaces has been conducted. | Urbanization. | High-resolution satellite images. Using ENVI software computing. |
| 2019 | Urban green spaces | [41] | City | Analyzing temporal and spatial changes in urban green spaces and exploring the driving forces underlying the observed changes. | Different districts’ geographical locations. | The Earth System Science Data Sharing Platform. Remote sensing images. Calculating landscape indices. |
| 2019 | Urban open-green spaces | [42] | City | Investigating the changes that have occurred in urban open-green spaces in Nevsehir. | Urbanization. | Analyses consist of satellite image classification, plant index production, and GIS-based analyses methods. |
| 2019 | Green spaces | [43] | City | Understanding the factors that determine an increase or decrease of urban green spaces in a post-socialist city. | Different regimes. | Historical maps and aerial images. Temporal analysis, proximity analysis. |
| 2019 | Urban green spaces | [44] | City | Focusing on urban GS at a neighborhood scale to analyze GS in more granular detail. | Compact urbanization. | Urban GS was extracted using the normalized difference vegetation index based on GF-1 remote sensing images. Overlay. |
| 2019 | Urban green spaces | [45] | City center | Developing an understanding of how urbanization influences the fragmentation of urban green spaces, and offers insights into the planning of urban green spaces from the perspective of promoting sustainability. | Rapid urbanization and planning policies. | Landsat images. Landscape metrics. |
| 2018 | Urban green spaces | [46] | Cities | Determining the appropriate proportion of public greenery to built-up areas in cities. | Urbanization. | The Local Data Bank. Surveys. |
| 2018 | Green spaces | [47] | Regional | Investigating green space types of the Beijing–Tianjin–Hebei region based on the elevation data and land use/cover for those years. | Urbanization and greening policies. | Landsat images. Using ENVI software computing. |
| 2018 | Urban public spaces | [48] | City | Identifying the major environmental challenges associated with the continued destruction of public urban space. | Rapid population increase. | Literature review. |
| 2017 | Urban green spaces | [49] | Regional | Developing a systematic approach to monitoring changes in the urban landscape and assessing the conditions of UGS in the Klang Valley. | Urbanization. | Remote sensing processing techniques were used to extract meaningful data from mid-resolution Landsat satellite images. Analyse using landscape metrics. |
| 2017 | Urban green spaces | [50] | City | Studying the distribution of various types of urban green space in Shanghai. | Rapid urbanization. | High satellite image data. Landscape pattern index and gradient analysis. |
| 2017 | Public open spaces | [51] | City | Discerning the influence of factors on open space planning and development in Hong Kong. | Government planning and development strategies. | Government’s latest planning and development strategies. |
| 2017 | Urban green spaces | [52] | Cities | Identifying general patterns relating to the quantity and structure of urban green space, and the demographic and economic characteristics of the cities in the study. | Population density and economic level. | Using remote sensing analysis of Landsat 7 data. Calculating landscape indices. |
| 2016 | Green spaces | [53] | City | Exploring the change of green space in Suzhou and revealing the spatial characteristics, ecological benefits, and its impact mechanism. | Different districts’ geographical locations. | Landsat remote-sensing image data. Analyse using landscape metrics. |
| 2015 | Green spaces | [54] | City | Assessment of changes in green spaces of Nanjing in terms of scale and structure. | Population density. | Landsat Satellite Data. Analyse using landscape metrics. |
| 2015 | Urban green-spaces | [55] | Cities | Identifying problems, challenges and strategies of urban green space planning during the densification processes. | Urban densification. | Literature review. |
| 2013 | Urban green spaces | [56] | City | Investigating land use/land cover changes in Dehradun city and associated changes in urban green cover between 2004 and 2009. | Urbanization. | Remote Sensing to obtain detailed. Using Image Derived Parameters. |
| 2013 | Green spaces | [57] | Cities | Investigating the temporal trend in green space coverage and its relationship with urbanization. | Urbanization. | The Statistics Yearbook, green space coverage of cities were calculated through least square linear regressions. |
| 2013 | Urban green spaces | [58] | City | Analyzing the environmental quality based on green spaces to provide appropriate recommendations to elevate the environmental quality to international standards. | Population density. | Green space areas were extracted from Thailand Earth Observation System (THEOS) satellite imagery using Normalized Difference Vegetation Index (NDVI). Extracted green space areas were further analysed quantitatively with air quality indicators and population density utilizing deductive indexing method. |
| 2011 | Green spaces | [59] | City | To develop a comprehensive plan of green spaces development both at the municipal and regional levels. | Geography. | Using GIS and FRAGSTATS 3.3. Overlaying the two green space distribution maps and calculating the changing area, and the variation values of each green space type were obtained from the data of the land use change survey. |
| 2011 | Green spaces | [60] | City | Using landscape metrics to assess green spaces fragmentation. | Different districts’ geographical locations. | The original orthophoto maps and land use digital maps with 0.5 m resolution used in this study were purchased from the Hong Kong government. Green spaces and different land uses were extracted from the maps and transferred to raster maps, assisted by “3S” techniques. Calculating different landscape metrics. |
| 2011 | Urban green spaces | [61] | City | Using landscape pattern metrics to characterize shifting green space patterns. | Rapid urbanization and greening policies. | Remote-sensing image data. Landscape metrics analysis. |
| 2009 | Urban green spaces | [62] | City | To detect changes in the extent and pattern of green areas of Mashad and analyze the results of landscape ecology principles and functioning of the green spaces. | Open lands for housing development. | Combination of remote sensing image classification, landscape metrics assessment and vegetation indices. |
| 2008 | Open spaces | [1] | City | Evaluating the land-use zoning and development of open spaces. | Different districts’ geographical locations. | The land-use planning and statutory zoning for open space. |
| 2007 | Urban green spaces | [11] | Downtown | Identifying green space changes and their drivers. | Economic growth, population increases, urbanization, and weaknesses in the planning and management of urban development. | Graph theory, landscape metrics, GIS and FRAGSTATS 3.3. |
| 2007 | Greenbelt | [63] | City | Documenting the spatial and temporal changes of greenbelts over the past decade by analyzing satellite images. | Urban containment policy. | Remote Sensing, analysis of archived documents. |
| 2006 | Urban green spaces | [64] | City | Presenting a new method for quantifying and capturing changes in green space patterns. | Government policy. | GIS and remote sensing. Landscape metrics. |
| 2006 | Urban open spaces | [65] | City | Exploring the revitalization of existing traditional open spaces. | City Planning Act. | Case study. |
| 2003 | Green spaces | [66] | City | Examining the issues, obstacles, and processes involved in remediating potentially contaminated urban brownfield sites. | Urban planning policy. | Case studies and personal interviews. |
| Metrics | Purpose |
|---|---|
| Percent of land (PLAND) | PLAND refers to the greening rate. A larger PLAND value indicates a higher greening rate. |
| Mean patch size (MPS) | MPS refers to the average area of green space patches. A larger MPS value indicates a greater average area of green space patches. |
| Largest patch index (LPI) | LPI refers to the ratio of the floor area of the largest green space patch. A larger MPS value indicates a higher concentration degree of green space. |
| Patch number (NP) | NP refers to the degree of fragmentation. A larger NP value means that more green spaces are fragmented. |
| Patch density (PD) | PD refers to the degree of fragmentation. A larger PD value means that more green spaces are fragmented. |
| Total edge (TE) | TE refers to the shape complexity of a green space patch. A larger TE value indicates a higher degree of shape complexity and more severe disturbance of the patch. |
| Edge density (ED) | ED refers to the shape complexity of a green space patch. A larger ED value indicates a higher degree of shape complexity and more severe disturbance of the patch. |
| Mean proximity index (MPI) | MPI refers to the connectivity of green space patches, which increases with a higher MPI value. |
| Landscape shape index (LSI) | LSI refers to the shape complexity of a green space patch. A higher LSI value indicates greater shape complexity and more severe patch disturbance. |
Publisher’s Note: MDPI stays neutral with regard to jurisdictional claims in published maps and institutional affiliations. |
© 2022 by the authors. Licensee MDPI, Basel, Switzerland. This article is an open access article distributed under the terms and conditions of the Creative Commons Attribution (CC BY) license (https://creativecommons.org/licenses/by/4.0/).
Share and Cite
Zhu, Y.; Ling, G.H.T. A Systematic Review of Morphological Transformation of Urban Open Spaces: Drivers, Trends, and Methods. Sustainability 2022, 14, 10856. https://doi.org/10.3390/su141710856
Zhu Y, Ling GHT. A Systematic Review of Morphological Transformation of Urban Open Spaces: Drivers, Trends, and Methods. Sustainability. 2022; 14(17):10856. https://doi.org/10.3390/su141710856
Chicago/Turabian StyleZhu, Yaoyao, and Gabriel Hoh Teck Ling. 2022. "A Systematic Review of Morphological Transformation of Urban Open Spaces: Drivers, Trends, and Methods" Sustainability 14, no. 17: 10856. https://doi.org/10.3390/su141710856
APA StyleZhu, Y., & Ling, G. H. T. (2022). A Systematic Review of Morphological Transformation of Urban Open Spaces: Drivers, Trends, and Methods. Sustainability, 14(17), 10856. https://doi.org/10.3390/su141710856