Article

How New Urbanization Affects Tourism Eco-Efficiency in China: An Analysis Considering the Undesired Outputs

1
School of Management, Chongqing University of Technology, Chongqing 400054, China
2
Rural Revitalization and Regional High-Quality Development Research Center, Chongqing University of Technology, Chongqing 400054, China
3
School of Geography and Resources, Guizhou Education University, Guiyang 550018, China
4
School of Geography and Tourism, Chongqing Normal University, Chongqing 401331, China
*
Author to whom correspondence should be addressed.
Sustainability 2022, 14(17), 10820; https://doi.org/10.3390/su141710820
Submission received: 26 May 2022 / Revised: 25 August 2022 / Accepted: 27 August 2022 / Published: 30 August 2022
(This article belongs to the Section Tourism, Culture, and Heritage)

Abstract

:
In the context of the global Sustainable Development Goals, the study of tourism eco-efficiency (TE) becomes particularly important for the balance between environmental protection and economic development in tourist destinations. This paper improves the measurement method of tourism carbon emissions, uses the Super-SBM model of undesired output to measure China’s TE, and then explores the impact of new urbanization (NU) on TE. The results show that TE in China is in dynamic equilibrium in general, the agglomeration characteristics of efficiency changed from high in the east and low in the west to low in the south and high in the north, and developmental differences first increased and then decreased. NU development has a significant one-way positive impact on TE at the national level and in the eastern region. As far as impact, economic urbanization plays a great role, and ecological factors become more and more important. NU has a rapid and long-term impact on TE, and its contribution rate to developed economic regions can reach 35%. This study will provide an important reference for sustainable development of tourism under the trend of urbanization.

1. Introduction

In the past few decades, almost every country in the world has experienced rapid economic growth, resulting in a series of environmental problems, such as a reduction in biodiversity and the heat-island effect. Recognizing the seriousness of the problem, the 193 member states of the United Nations unanimously adopted the Sustainable Development Goals (SDGs) to solve development problems in the three dimensions of society, economy, and environment, and to push countries to shift to the path of sustainable development. For example, Singapore is trying to apply the concept of greenish cities more rationally to create eco-efficient cities [1]. Germany is also exploring urban efficiency development based on an environmentally driven resource-efficiency concept [2]. Ecological and environmental effects in the development process are also being gradually emphasized in the fields of electricity [3], industry [4], and agriculture [5]. In this trend, tourism is considered to have an important contribution to promoting socioeconomic growth, and negative ecological effects are increasingly more recognized [6,7]. According to the United Nations World Tourism Organization, the total global tourism revenue reached USD 5.8 trillion in 2019, with a year-on-year increase of 8.6%, indicating that the sector has become an important force for economic growth, creating more and better jobs. This growth reinforces the need to ensure effective destination management. It is thus vital to manage tourism in a sustainable manner. However, the intrinsic attributes of environmental dependence and resource consumption aggravate the contradiction between tourism, economic growth, and the ecological environment, and affect the sustainable development of tourism [8]. Tourism development increases CO2 emissions, causing environmental impacts and climate change, which are detrimental to the development of tourism with environmentally dependent attributes, as well as to human survival and the environment itself [9]. For example, tourists’ perception of the regional environment may affect their consumption, especially in terms of catering [10,11], which is obviously not conducive to the economic development of tourism. Therefore, it is urgent to improve the tense relationship between tourism, economic development, and the ecological environment.
Based on the above problems, the concept of eco-efficiency has gradually been introduced into the research field of sustainable tourism. The essential feature of the ecological benefit management of tourism is to minimize the impact of tourism on the environment in the process of pursuing economic development [12]. Eco-efficiency reflects the level of ecological civilization. Improving tourism eco-efficiency (TE) can not only alleviate the pressure of tourism economic development on the ecological environment, but also promote the sustainable development of tourism. However, while constantly pursuing economic growth related to tourism, the overexploitation of resources and the generation of environmental pollution are often ignored [13]. In recent years, the research on the influencing factors of TE has been paid more and more attention. However, previous studies mostly ignored the impact of relevant policies and governance on the eco-innovative development of tourism [14].
Urbanization is an important factor affecting regional eco-efficiency [15], expanding on a global scale. Urbanization can provide important support and a basic guarantee for the development of tourism, but at the same time, it increases the threat toward tourism resources and environments. Rapid urbanization has increased the burden of carbon emissions to a great extent, which is not conducive to the balance between regional economic development and ecological environment [16]. Existing studies have explored the relationships between urbanization and regional ecological environment [17,18], agriculture [19], and the construction industry [20], as they relate to the ecological environment. Lacking a systematic and in-depth investigation is not conducive to the sustainable development of the tourism industry nor the region. The construction of new urbanization (NU) requires that the mode of economic development be shifted from traditional rough and loose to intensive and innovative, and that a sound green, low-carbon, and cyclic economic system be established. The NU with green development connotations can directly or indirectly influence the economic and ecological environment of the tourism industry, thus affecting the eco-efficiency of the tourism industry, i.e., potentially changing the impact of tourism on the structure and function of the environment, and thus affecting the sustainable development of tourism and the urban climate. Therefore, in the process of developing tourism, it has become an urgent theoretical and practical problem to scientifically evaluate ecological efficiency, determine the law of urbanization’s influence on the eco-efficiency of tourism and related decisive factors, make corresponding management measures, and seek the balance between economic growth and environmental load.
China is experiencing rapid growth in the size of its tourism industry. The year 2019 saw the number of domestic tourist arrivals exceed six billion, with total domestic tourism revenue of CNY 6.65 trillion, representing a compound annual growth rate of 17.36%. The tourism industry is becoming an important engine of China’s economic growth, complementing the urbanization process. The NU implemented in China has not only effectively reduced pollution emissions and improved energy efficiency, but also has significant ecological effects [21]. In view of these, based on the perspective of carbon footprint, this paper uses the Super-SBM model to evaluate the TE of all provinces and municipalities directly under the central government, and autonomous regions (provinces for short) in China from 2006 to 2019 against the background of the NU strategy. There are three important objectives: (1) Analyze the spatial and temporal distribution of TE under the process of China’s NU; (2) explore the dynamic impact of NU on TE; (3) identify the key factors affecting TE in the internal structure of NU and analyze their influencing laws. In recent years, because carbon emissions are considered an important representative of the environment, tourism carbon emissions have gradually become an important undesired output index of TE evaluation. Scientific measurement of tourism carbon emissions is the key to evaluating the ecological efficiency of tourism. This study improves the measurement method of carbon emissions from tourism transportation modes. The transport department accounts for nearly 95% of tourism-related carbon dioxide emissions [22]. Thus, improvement of the measurement method is helpful to more accurately estimate tourism carbon emissions and providing reference for related research. In addition, China’s rapid urbanization process and the rapid growth of tourism have typical significance. This study illustrates the new impactful relationship between urbanization and TE from Chinese evidence and discusses how to walk the road of sustainable tourism development under the trend of urbanization. The results of this paper not only contribute to the improvement of regional TE but also can be used to guide the regional sustainable development strategy; balance the development relationships among urbanization, tourism, and ecological environment; and then realize the organic unity of economic, ecological, and social benefits, especially those regions experiencing rapid urbanization and seeking breakthroughs.

2. Literature Review

2.1. Tourism Eco-Efficiency

TE is derived from eco-efficiency. It has inherited principles and attributes and is one of the most important fields of sustainable tourism destination development research. Eco-efficiency was first proposed by Schaltegger and Sturm [23] as the ratio of economic value to environmental impact. It is widely used in the research of agricultural and industrial development. In recent years, with the rapid development of tourism and the increasingly prominent ecological and environmental problems caused by it, the concept of eco-efficiency has been gradually introduced into the field of tourism research and has become an important management tool for sustainable tourism development [24,25]. At present, the application of eco-efficiency in tourism mainly focuses on the measurement and evaluation of TE [26] and the application of eco-efficiency in tourism destination management [27], which provides an important basis for relevant literature research and sustainable development management of tourism destinations.
However, the existing research still has some limitations. In terms of eco-efficiency in tourism development, existing studies have conducted extensive research on tourism products [28], tourism transportation [29], tourism energy consumption [30], and tourism destination ecological management [12]. However, most of these studies only focus on a single resource or environmental factor, or focus on the eco-efficiency of specific case studies, and lack comprehensive research on TE under the influence of various factors, such as resources, environment, or economy. In fact, with increasing global attention on the change in ecological environments, the research on TE has gradually tended to explore its influencing factors and mechanisms. Some studies have discussed the impact of tourism development, industrial structure, technology level, pollutants, and eco-environmental effects on the eco-efficiency of tourism destinations [31,32]. However, on the one hand, most studies still lack analysis of its influencing factors. On the other hand, the current research focuses on the identification of influencing factors and lacks the systematic and in-depth exploration of the influencing laws of relevant factors. At present, the understanding of regional tourism ecological management and sustainable development of tourism is still insufficient, which is not conducive to providing feasible policy, management, and technical reference. Further exploration is needed in theoretical and empirical analysis.

2.2. New Urbanization

From the perspective of demography, the focus of urbanization is the process of rural populations gathering in cities [33]. The research on urbanization covers a wide range of disciplines, including history, demography, geography, economics, sociology, ecology, and so on [34]. With economic growth, the trend of urbanization is expanding, and the relationship between urbanization construction and ecological environment is becoming increasingly tense. In recent years, people have gradually paid attention to the ecological impact of urbanization. Relevant studies have found that rapid urbanization has an impact on the vulnerability of ecological functions [35], and regional ecological security is seriously threatened [36,37]. Bai et al. [38] believe that there is a complex relationship between urbanization and urban eco-efficiency. The improvement in technological level and the formulation of effective environmental policies will promote the improvement of urban eco-efficiency. At present, China is increasingly pursuing social equity and equality and paying more and more attention to the construction of ecological civilization.
In 2014, after proposing to integrate the concept of ecological civilization into the whole process of China’s urbanization construction, the Chinese government put forward an NU strategy, emphasizing the all-around integration of ecological concepts into urbanization construction to promote green urban development. China’s NU is an urbanization with the basic characteristics of urban–rural integration, industrial interaction, saving and intensive ecological livability, and harmonious development, and is an urbanization in which large, medium, and small cities; small towns; and new rural communities develop in a coordinated manner and promote each other, involving many fields, such as economy, population, society, and environment [21]. Compared with traditional urbanization, NU promotes the harmony between human and nature. Related studies have found that NU pilot policies have a tendency to improve urban air quality [39], and NU strategies are conducive to promoting harmony between cities and ecological environments [40]. That is, it shows that the effective governance of cities can achieve sustainable development goals. However, the current relevant research relatively lacks research on the impact of urbanization, or NU, on the ecological environment in different fields, such as different products, enterprises, and industries.

2.3. Impact Mechanism of New Urbanization on Tourism Eco-Efficiency

Based on the connotation of NU, the current evaluation of NU mostly focuses on five aspects: population, economy, space, society, and ecology [41,42]. Urbanization refers to the process of population agglomeration, urban-scale expansion, and a series of economic and social changes. In essence, it is a process of guiding the rational flow of factors, systematic agglomeration, and comprehensive economic and social development [43]. The spatial distribution of resource elements in China is uneven. The process of urbanization promotes the flow of factors, optimizes and forms agglomeration, and then becomes the driving force of industrial development. In the process of NU, considering the impact of agglomeration on economy, environment, and resources, the development of tourism is bound to be affected. On the one hand, the development of urbanization can provide important support and a basic guarantee for the development of tourism. On the other hand, the continuous increase in urban population and the continuous expansion of urban buildup have led to the total extrusion of resources and natural environment spaces in the process of urban expansion, which poses a direct or indirect threat to the economy and the tourism environment. Finally, these direct and indirect impacts on tourism development affect the expression of the TE destination. This paper describes the impact mechanism of NU on eco-efficiency, as shown in Figure 1.

3. Materials and Methods

3.1. Index System Construction

3.1.1. Index System of Tourism Eco-Efficiency

At present, there is no unified standard for measuring TE. This paper takes into account the synergy between population, economy, and environment, and refers to the existing research to form an indicator system, as shown in Table 1, covering three aspects: input, desired output, and undesired output. Due to incomplete statistics from Tibet, the required data are missing. This paper takes the other 30 provinces in mainland China as the research object. For some missing data, the interpolation method is used to supplement and perfect them.
The input indicators of labor, capital, energy, and natural resources are the basic factors of production related to the development of tourist destinations [25,32,44]. First, tourism is a labor-intensive industry, and labor input is an important link that affects overall economic benefits; the number of tourism employees is selected as the labor input index. Second, the construction and operation of scenic spots are inseparable from capital investment and tourism’s fixed asset investment, which is separated from the fixed asset investment of society as a whole to represent tourism capital investment. In order to ensure the comparability of data, they are converted into constant price investment based on 2006 when stripping. In addition, tourism energy consumption is an indispensable factor in the process of tourism development. Through the regional energy balance table, the total energy consumption of tourism is separated from the tourism-related industry sectors, such as transportation, storage and postal, wholesale and retail, and accommodation and catering. The estimation formula is as follows:
E t = i j E i j · t · β j · R t
In Equation (1), E t is the total tourism energy consumption in t years, E i j · t is the j-th energy terminal consumption of sector i in year t, β j is the standard coal coefficient of energy j (refer to General Principles for Calculation of Comprehensive Energy Consumption (GB/T2589-2020)), and R t is the tourism development coefficient in t, that is, the proportion of total tourism revenue in the tertiary industry in that year.
Desired outputs: Generally speaking, social, economic, and environmental outputs will be generated during the development of tourism. Because social output involves complex content and systems, it is difficult to measure, whereas environmental output usually manifests as the consumption of ecological environment resources, which is not suitable for desired output. Therefore, referring to the research of [45], total tourism income is selected as the desired output. The final data are converted into constant price economic income based on 2006 according to the consumer price index in 2007.
Undesired outputs: Generally speaking, economic activities will produce polluting wastes, which will negatively affect the ecological environment. From the perspective of sustainable tourism, the use of fossil fuels and related greenhouse gas emissions are the most pressing environmental issues related to tourism, so tourism carbon emissions are considered to be an important representative of environmental pressure caused by tourism [26]. This paper uses the bottom-up method to calculate the carbon emissions of tourism and estimates the tourism carbon emissions of all provinces in China from tourism transportation, tourism accommodation, and tourism activities. The estimation method is as follows [26,46,47,48,49]:
C = C T + C H + C A
In Equation (2), C T represents C O 2 emissions from tourism transportation modes, including road, railway, civil aviation, and water transport; C H represents C O 2 emissions from tourism accommodation, mainly involving star hotels; and C A represents C O 2 emissions from tourism activities according to the Tourism Sample Survey Data. It includes five types of tourism, including sightseeing, business, leisure, visiting relatives and friends, and other types of tourism. The specific calculation formula is as follows:
C T = l = 1 4 N · P l · D l · α l · ε l
In the past, most studies on the measurement of tourism transportation modes emissions have mainly used the transportation mode passenger turnover × the proportion of tourists in the passenger flow × the emission factor, that is, the tourist turnover × the emission factor. However, the proportion of tourists in the passenger flow of l-type transportation modes mainly adopts the results of expert consultation, which are estimated to be 13.8%, 31.6%, 64.7%, and 10.6% for highway, railway, civil aviation, and water transportation, respectively. Considering the time and regional differences, there are inevitable errors. Based on the connotation of the original formula, combined with the existing statistical data and related research literature, this paper constructs the calculation formula shown in Equation (3). In the formula, N is the total number of tourists; P l is the utilization rate of l-type transportation mode, that is, the proportion of l-type passenger volume in the total passenger volume; D l is the average transportation distance of l-type transportation mode, which can be obtained by the ratio of l-type transportation mode passenger turnover to l-type passenger volume; α l is the C O 2 emission factor of l-type transportation modes and the C O 2 emission factors of highway, railway, aviation, water transportation, and other transportation are 75 g/Pkm, 25 g/Pkm, 150 g/Pkm, and 70 g/Pkm, respectively; and ε l is the equivalent factor of the l-type transportation mode, which can play a role in reducing errors in calculation.
C H = B · R · β · 365
In Equation (4), B is the number of beds in star-rated hotel rooms, R is the average room occupancy rate of starred hotels, and β is the C O 2 emission factor of each bed per night, which is 2.458 g/per bed per night.
C A = m = 1 5 N · P m · γ m
In Equation (5), N is the total number of tourists, and P m is composed of m-category tourists. γ m is the C O 2 emission factor of m activities, and the C O 2 emission factors of sightseeing, business, leisure, visiting relatives and friends, and other types of tourism are 417 g/per person, 786 g/per person, 1670 g/per person, 591 g/per person, and 172 g/per person, respectively.

3.1.2. Index System of New Urbanization

China’s current urbanization is people-oriented, pursuing the transformation from quantity to quality, focusing on social fairness and equality, and paying attention to the construction of ecological civilization [50]. Population urbanization mainly manifests as urban population agglomeration and human capital accumulation. Economic urbanization lies in the transformation of the mode of economic development, industrial upgrading, and structural optimization. Spatial urbanization manifests as the expansion of urban space scale and the large-scale agglomeration of economy and population to cities. Social urbanization lies in creating a fair and harmonious social environment and improving the comprehensive carrying capacity of cities. Based on the strong demand for a better living environment, ecological urbanization manifests as ecological restoration ability and pollution control ability when environmental carrying capacity is threatened. To sum up, this paper builds the index system shown in Table 2 by referring to the existing studies of Wang et al. [42], Liang et al. [51], and Zhou et al. [52].

3.2. Research Methods

3.2.1. Super-SBM Model

Methods to measure eco-efficiency mainly include ecological footprint analysis, life cycle method, stochastic frontier analysis, and data envelopment analysis (DEA) [53,54]. At present, eco-efficiency evaluation is usually measured by DEA, which is a systematic analysis method using a variety of inputs and outputs to evaluate relative efficiency. However, other evaluation methods are often criticized for their limited evaluation scope, such as the analysis applicable to a single project or technical object [55]. The Super-SBM model introduced by Tone [56] is an excellent model widely used at present. It not only overcomes the errors caused by slack variables in traditional DEA models, but can also solve the problem of invalid ordering in multiple decision-making units. The TE value δTE can be calculated as follows:
min δ T E = 1 + 1 m i = 1 m s i / x i k 1 1 s r = 1 s s r + / y r k s . t .   j = 1 , j k n x i j λ j s i x i k j = 1 , j k n y i j λ j + s r + y r k λ   s , s + 0 i = 1 , 2 , , m ; r = 1 , 2 , , s ; j = 1 , 2 , , n ( j k )
In Equation (6), δ T E is TE value, m and s are the number of inputs and outputs; indicators Si ≥ 0, Sr+ ≥ 0 represent the slack variables of input and output, respectively; x and y represent the input and output variables, respectively; and λj ≥ 0 (j = 1, 2, …, n) represents the weight vector.

3.2.2. Entropy Method

In this paper, information entropy is used to calculate the weight of each indicator; then, the NU level of all provinces in China is comprehensively measured. It is an objective weighting method that has higher reliability and accuracy than subjective weighting. In order to make the urbanization levels of different years comparable, the time variable h is added to the model. Assuming h years, m cities, and n indicators, the matrix of year a is X = x i j m * n   ( 1 i m , 1 j n ) , and x i j is the index value of item j of the i-th city. In order to eliminate the dimensional influence, the original data x i j are processed by the minimization method to obtain Z i j . Referring to the study of Xia et al. [57], the specific calculation steps are as follows:
Normalization of indicators: P i j = Z i j / a = 1 h i = 1 m Z a i j (7)
Calculate the entropy of each indicator: E j = k a = 1 h i = 1 m P a i j ln P a i j k = 1 / ln ( h m )
Calculate the entropy redundancy of each indicator: D j = 1 E j
Calculate the weight of each indicator: W j = D j / j = 1 n D j
Entropy: N U i = j = 1 n Z i j W i j

3.2.3. Panel Vector Autoregression Model

Using panel data, the panel vector autoregression (PVAR) model can not only effectively solve the problem of individual heterogeneity, but also fully consider the individual and time effects, which is suitable for the characteristics of regional differences in China. In this paper, the PVAR model is used to simulate the interaction between TE and NU, and impulse response function and variance decomposition analysis are used to explore the response degree to disturbance term. The model is constructed as follows [58]:
y i t = α i + j = 1 p β j y i , t j + ε i , t
In Equation (8), i and t represent provinces and time, respectively; α i is the fixed effect; y i , t j and β j are simultaneity and lag effects, respectively; and ε i , t is the residual term, which follows a normal distribution.

3.2.4. Ordinary Least Square Model

Due to the significant results of Moran’s I, the spatial econometric method is considered for regression analysis. The ordinary least square (OLS) model, as a global regression model, can preliminarily judge the impact of NU on TE. The calculation formula is as follows [43]:
Y = β 0 + β 1 X + u
In Equation (9), β 0 is the intercept term, β 1 is the parameter to be estimated, X is the independent variable, and u is the error term.

3.2.5. Geographically Weighted Regression Model

The geographically weighted regression (GWR) model is an extension of the OLS model. It inserts the spatial structure of data into a regression model to reduce the error of the OLS model in calculating variables with spatial characteristics. This paper adopts the GWR model to further explore the key factors influencing the internal structure of NU on TE. The specific calculation formula is as follows [59]:
Y i = β 0 u i , v i + k = 1 p β k u i , v i X i k + ε i , i = 1 , 2 · · · , n  
In Equation (10), u i , v i is the spatial location of region i; β k u i , v i is the unknown parameter of unit centroid u i , v i in region i, that is, the regression coefficient of X i k ; X i k represents the normalized value of the impact factor in region i, X i k = j = 1 q X i j M i n X i j M a x X i j M i n X i j ; and ε i is the regression residual and the unexplained part of the dependent variable.

4. Results and Analysis

4.1. Measurement of Tourism Eco-Efficiency

With the help of the Super-SBM model of undesired output, the value of TE of all provinces in China from 2006 to 2019 was calculated. Due to limited space, some data are shown in Table 3. According to the division of China’s economic regions in the latest Statistical System and Classification Standards released by the National Bureau of Statistics (Table 4), further analysis will be performed of the four major economic regions of Northeast China, Eastern China, Central China, and Western China.
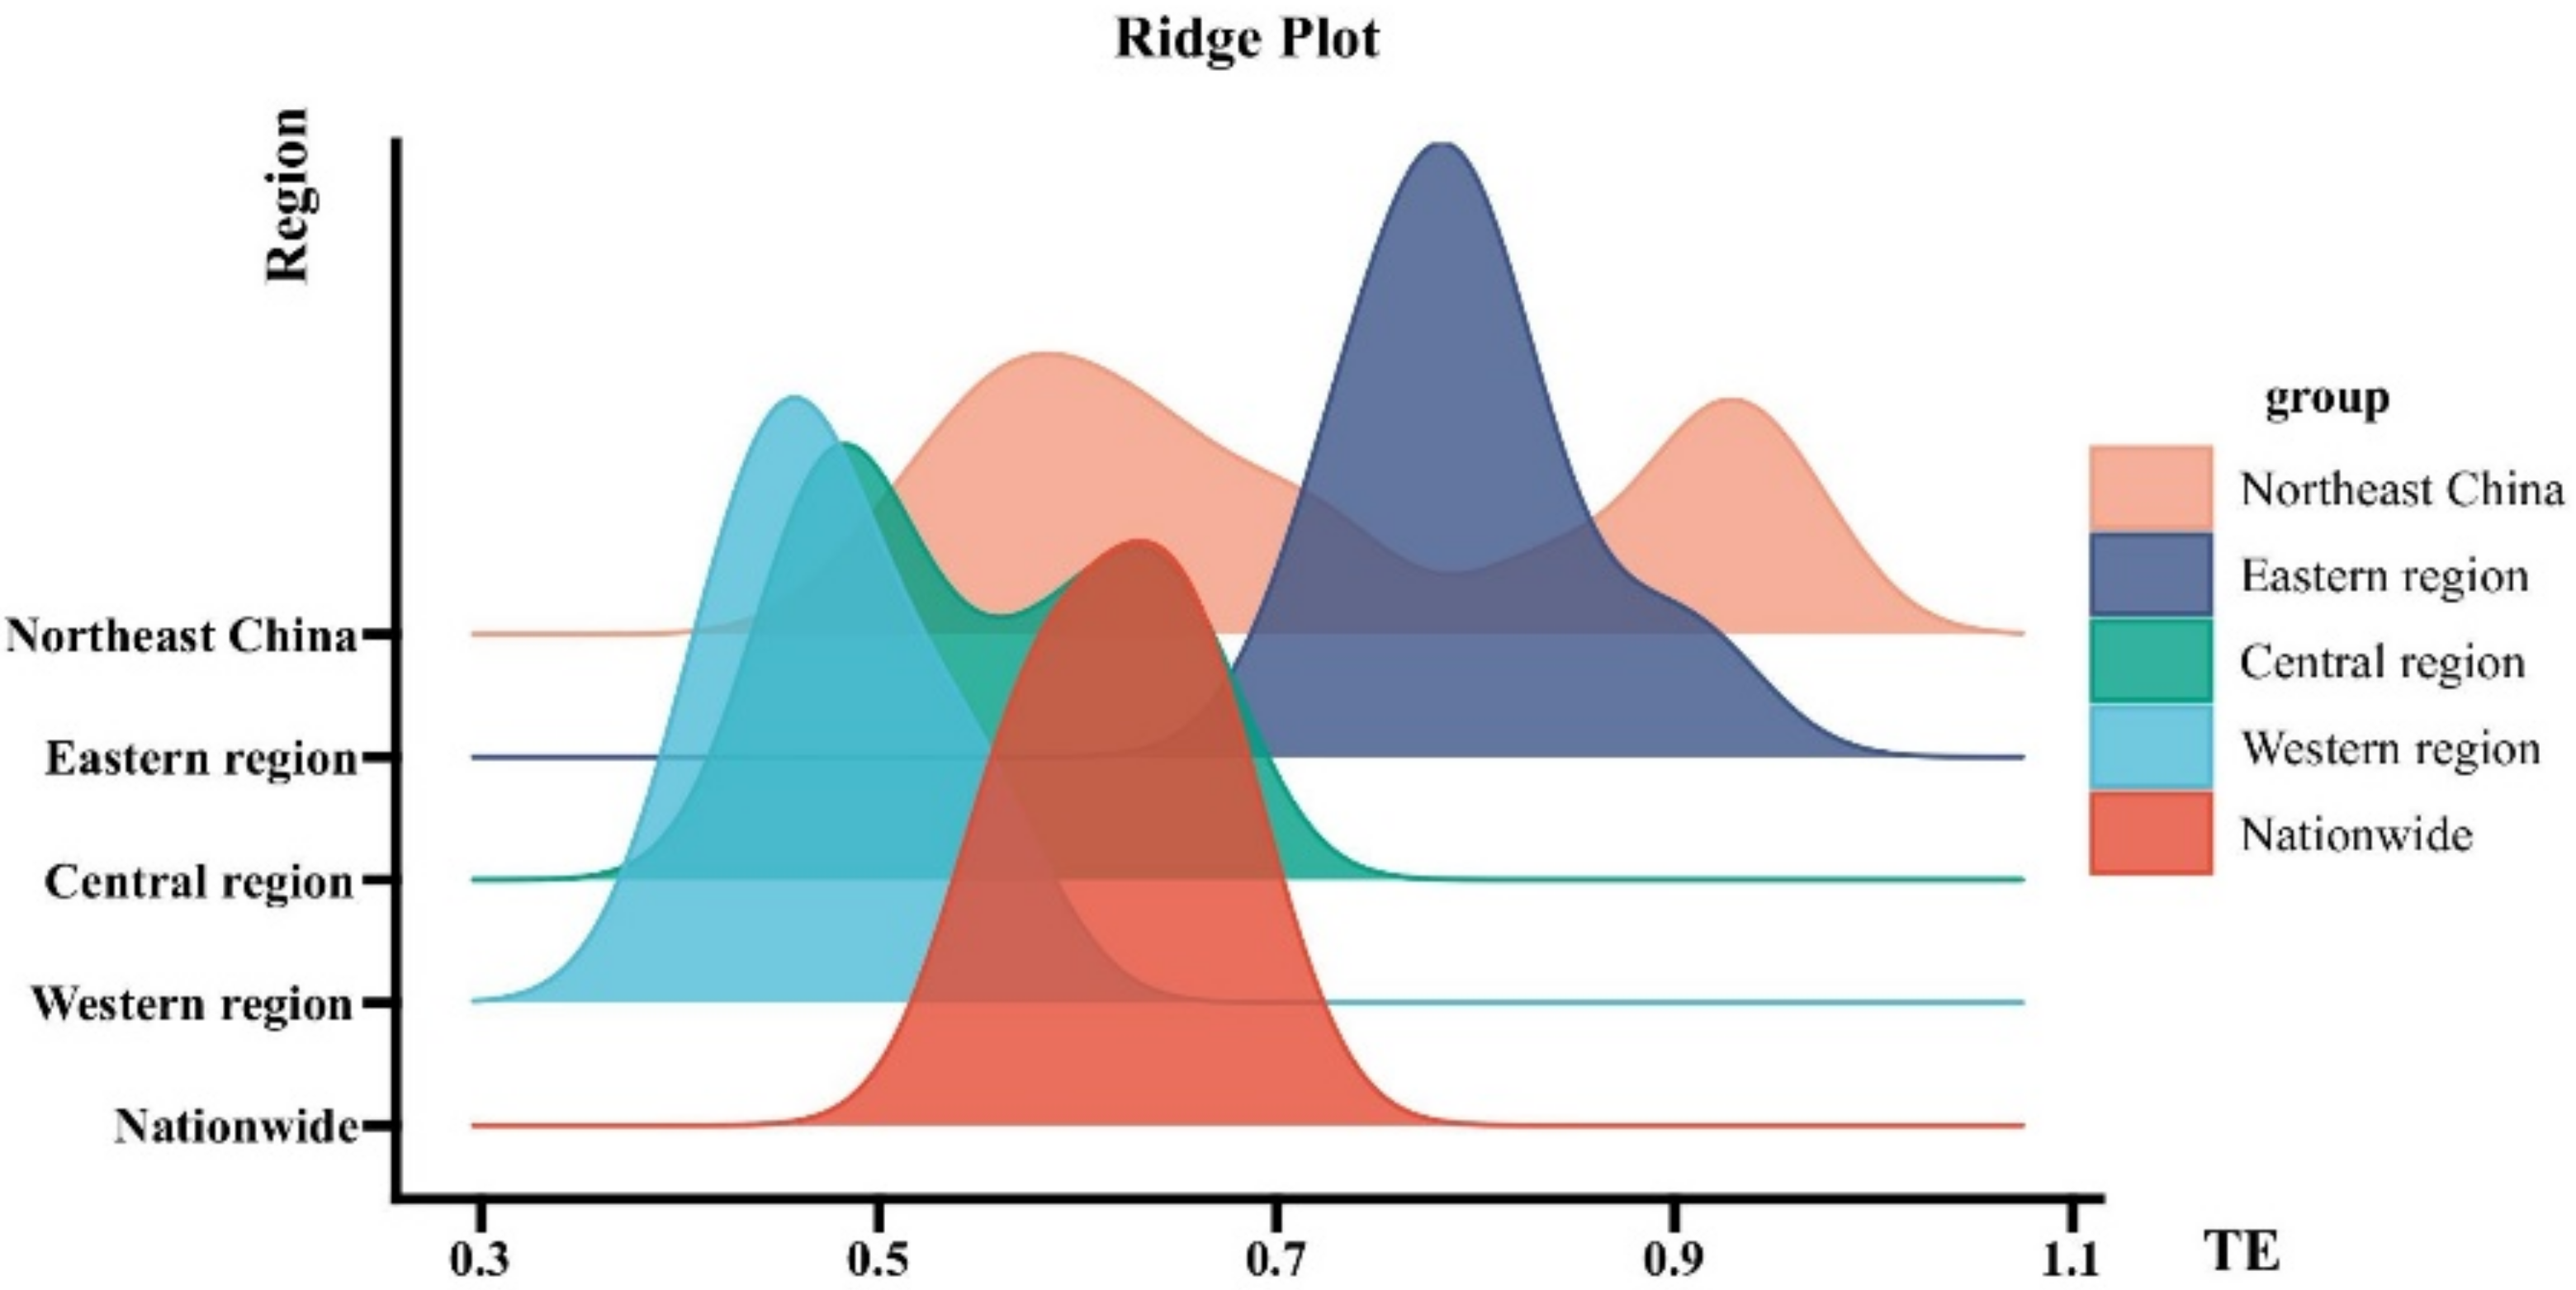
From the point of view of time dynamics, China’s TE showed a slight fluctuation trend. As shown in Figure 2, the total average value of China’s TE fluctuated between 0.5 and 0.7 during the study period, and the total average value of the final efficiency changed from 0.6520 to 0.6552, showing a slight increase. In terms of specific regions, the four major economic regions were in a state of fluctuation during the study period, and Eastern and Northeast China had certain leading advantages. Among them, Northeast China fluctuated the most, with two peaks, indicating that the development of TE in Northeast China is extremely unstable. The reason may be that, on the one hand, the development of tourism in the three provinces of Northeast China mainly depends on ecological tourism resources, and the comprehensive benefits between economy and environment are relatively good. On the other hand, in the northeast revitalization strategy, the country comprehensively promotes the revitalization of the old industrial base in Northeast China, which has affected its ecological environment to a certain extent. TE in Eastern China has always been ahead of the overall level of the country. It can be seen from Table 3 that the eastern region had the largest number of provinces with high TE. Among them, the average efficiency of Beijing, Tianjin, Shanghai, Jiangsu, and other places over the years exceeded 1, indicating that their tourism ecological effect is good. The main reason is that the eastern region is the most developed economic zone in China, with strong support from policies, funds, technology, and other resources. However, the TE of Hainan is at a low level in China, and its highest value was less than 0.5. Therefore, Hainan is the biggest obstacle to the overall improvement of TE in Eastern China. There were also two peaks in the central region, and the efficiency value was generally higher than that in the western region. However, the numerical distribution in the western region was relatively concentrated. The natural and cultural resources in the western region are rich, and the western region has greater potential to improve TE under the trend of the western development strategy.

4.2. Spatial and Temporal Distribution of Tourism Eco-Efficiency

4.2.1. General Characteristics of Temporal and Spatial Distribution of Tourism Eco-Efficiency in China

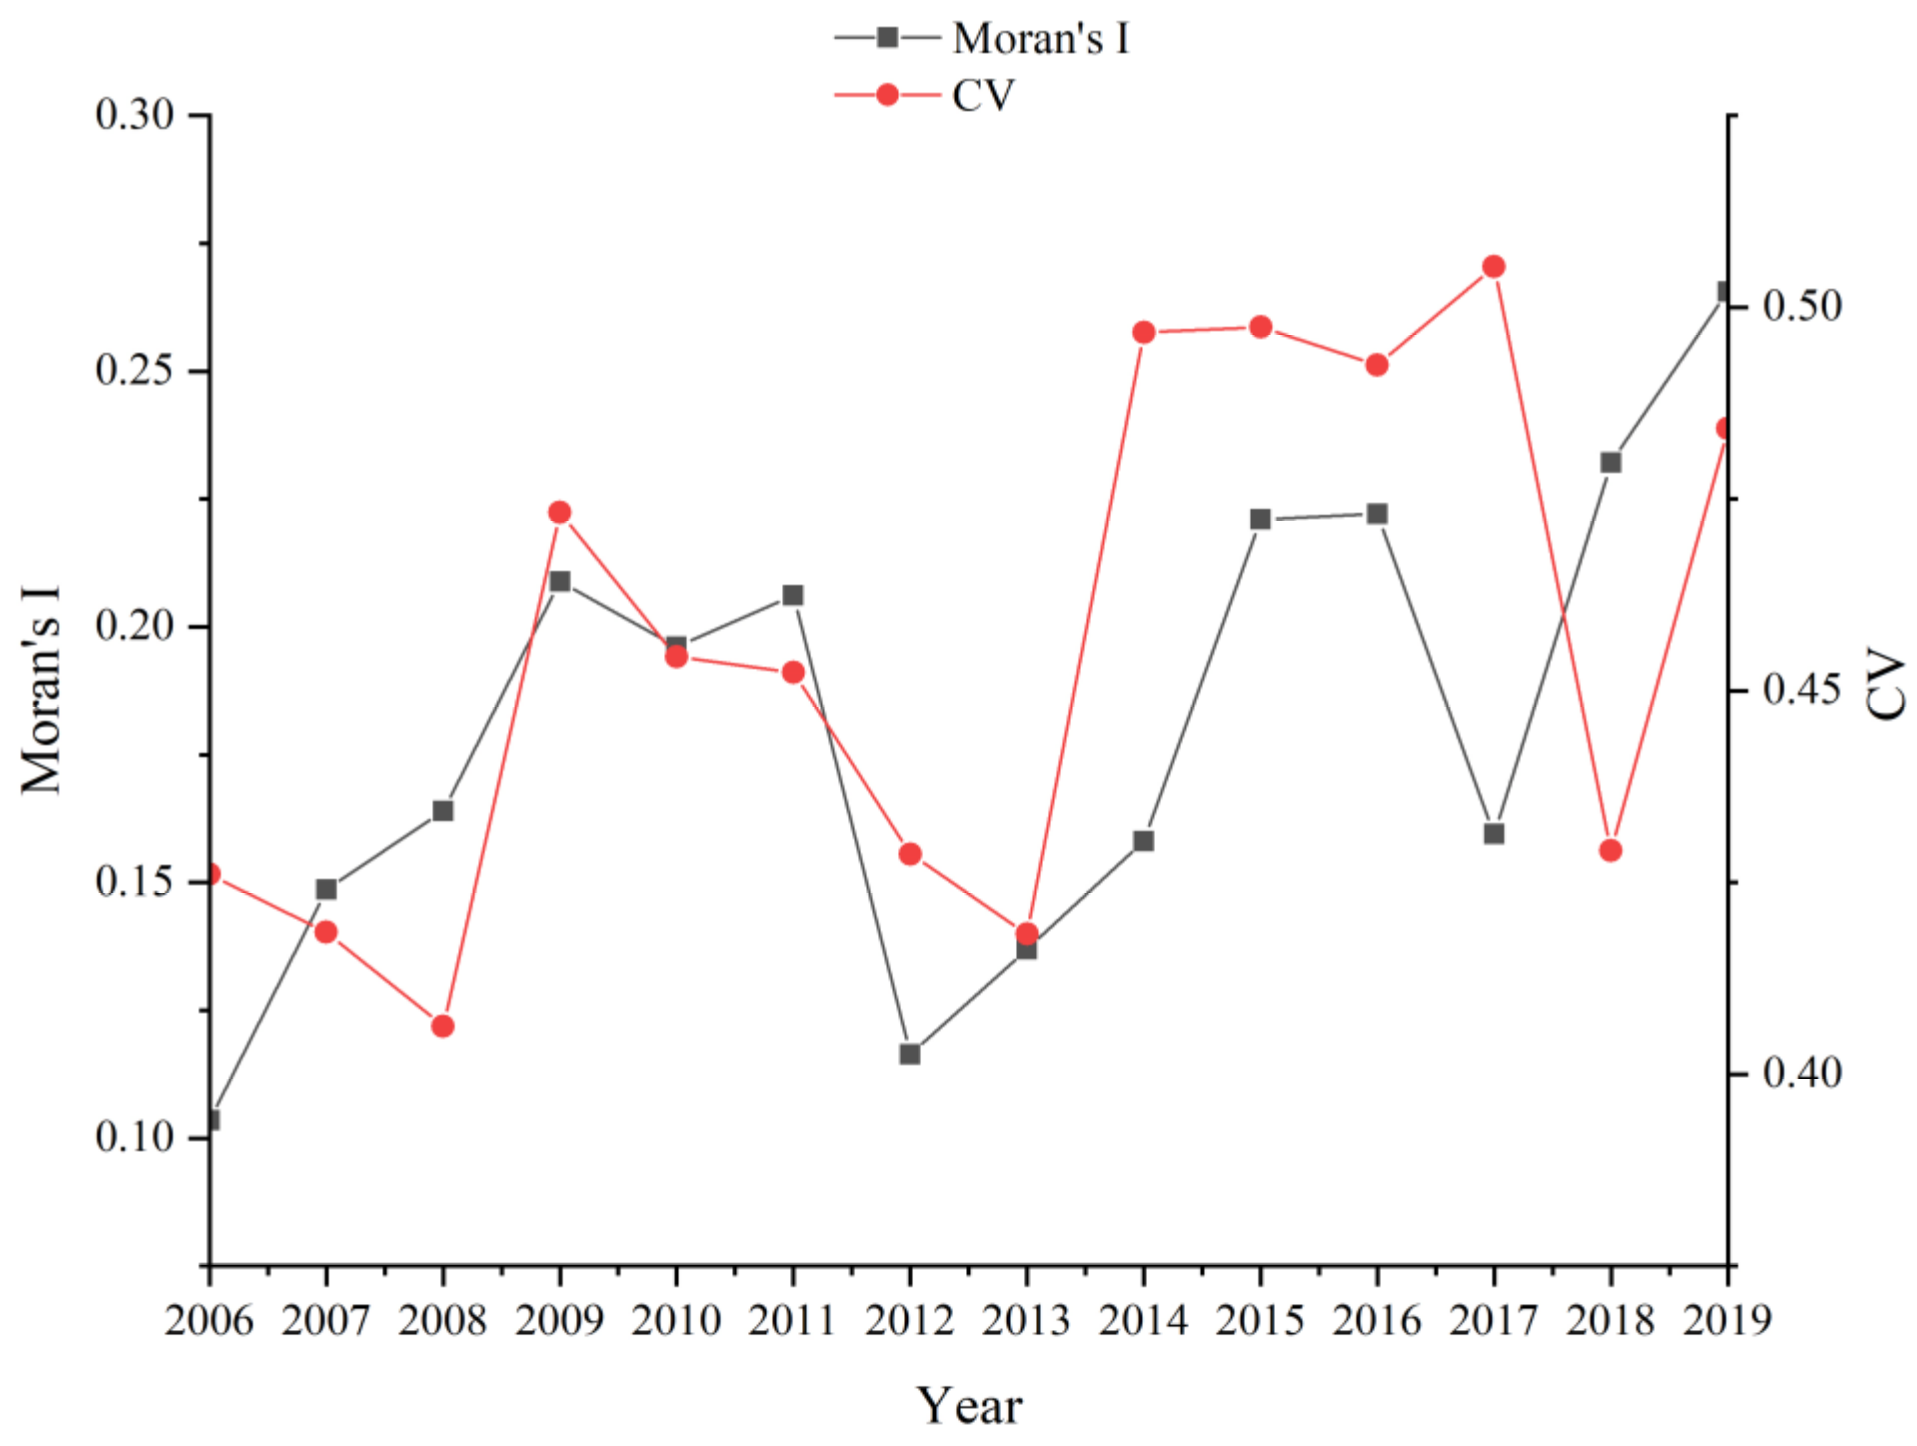
The overall characteristics of temporal variation and spatial evolution of TE in China can be observed through the coefficient of variation (CV) and global Moran’s I (Figure 3). From the CV, the relative difference fluctuation of China’s TE increased, indicating that its growth is unbalanced. From the perspective of the global Moran’s I, China’s TE passed the test at the significance level of 1% from 2006 to 2019, showing a significant positive spatial correlation in a relatively concentrated state. The global Moran’s I showed a large, staged increase, ranging from 0.1 to 0.3. Overall, the TE of 30 provinces in China changed from relatively weak clustering to relatively strong clustering. From the analysis of the center of gravity, although the difference of relative agglomeration of China’s TE increased, the deviation distance of its center of gravity changed little and always fell in Henan Province in different trajectory directions (Figure 4). This shows that the development direction of TE in China is changing due to regional development differences, but the balance point remains in Henan Province. On the whole, China’s TE presents a mode of dynamic equilibrium development from the perspective of global space.

4.2.2. Local Spatial Evolution Characteristics of Tourism Eco-Efficiency

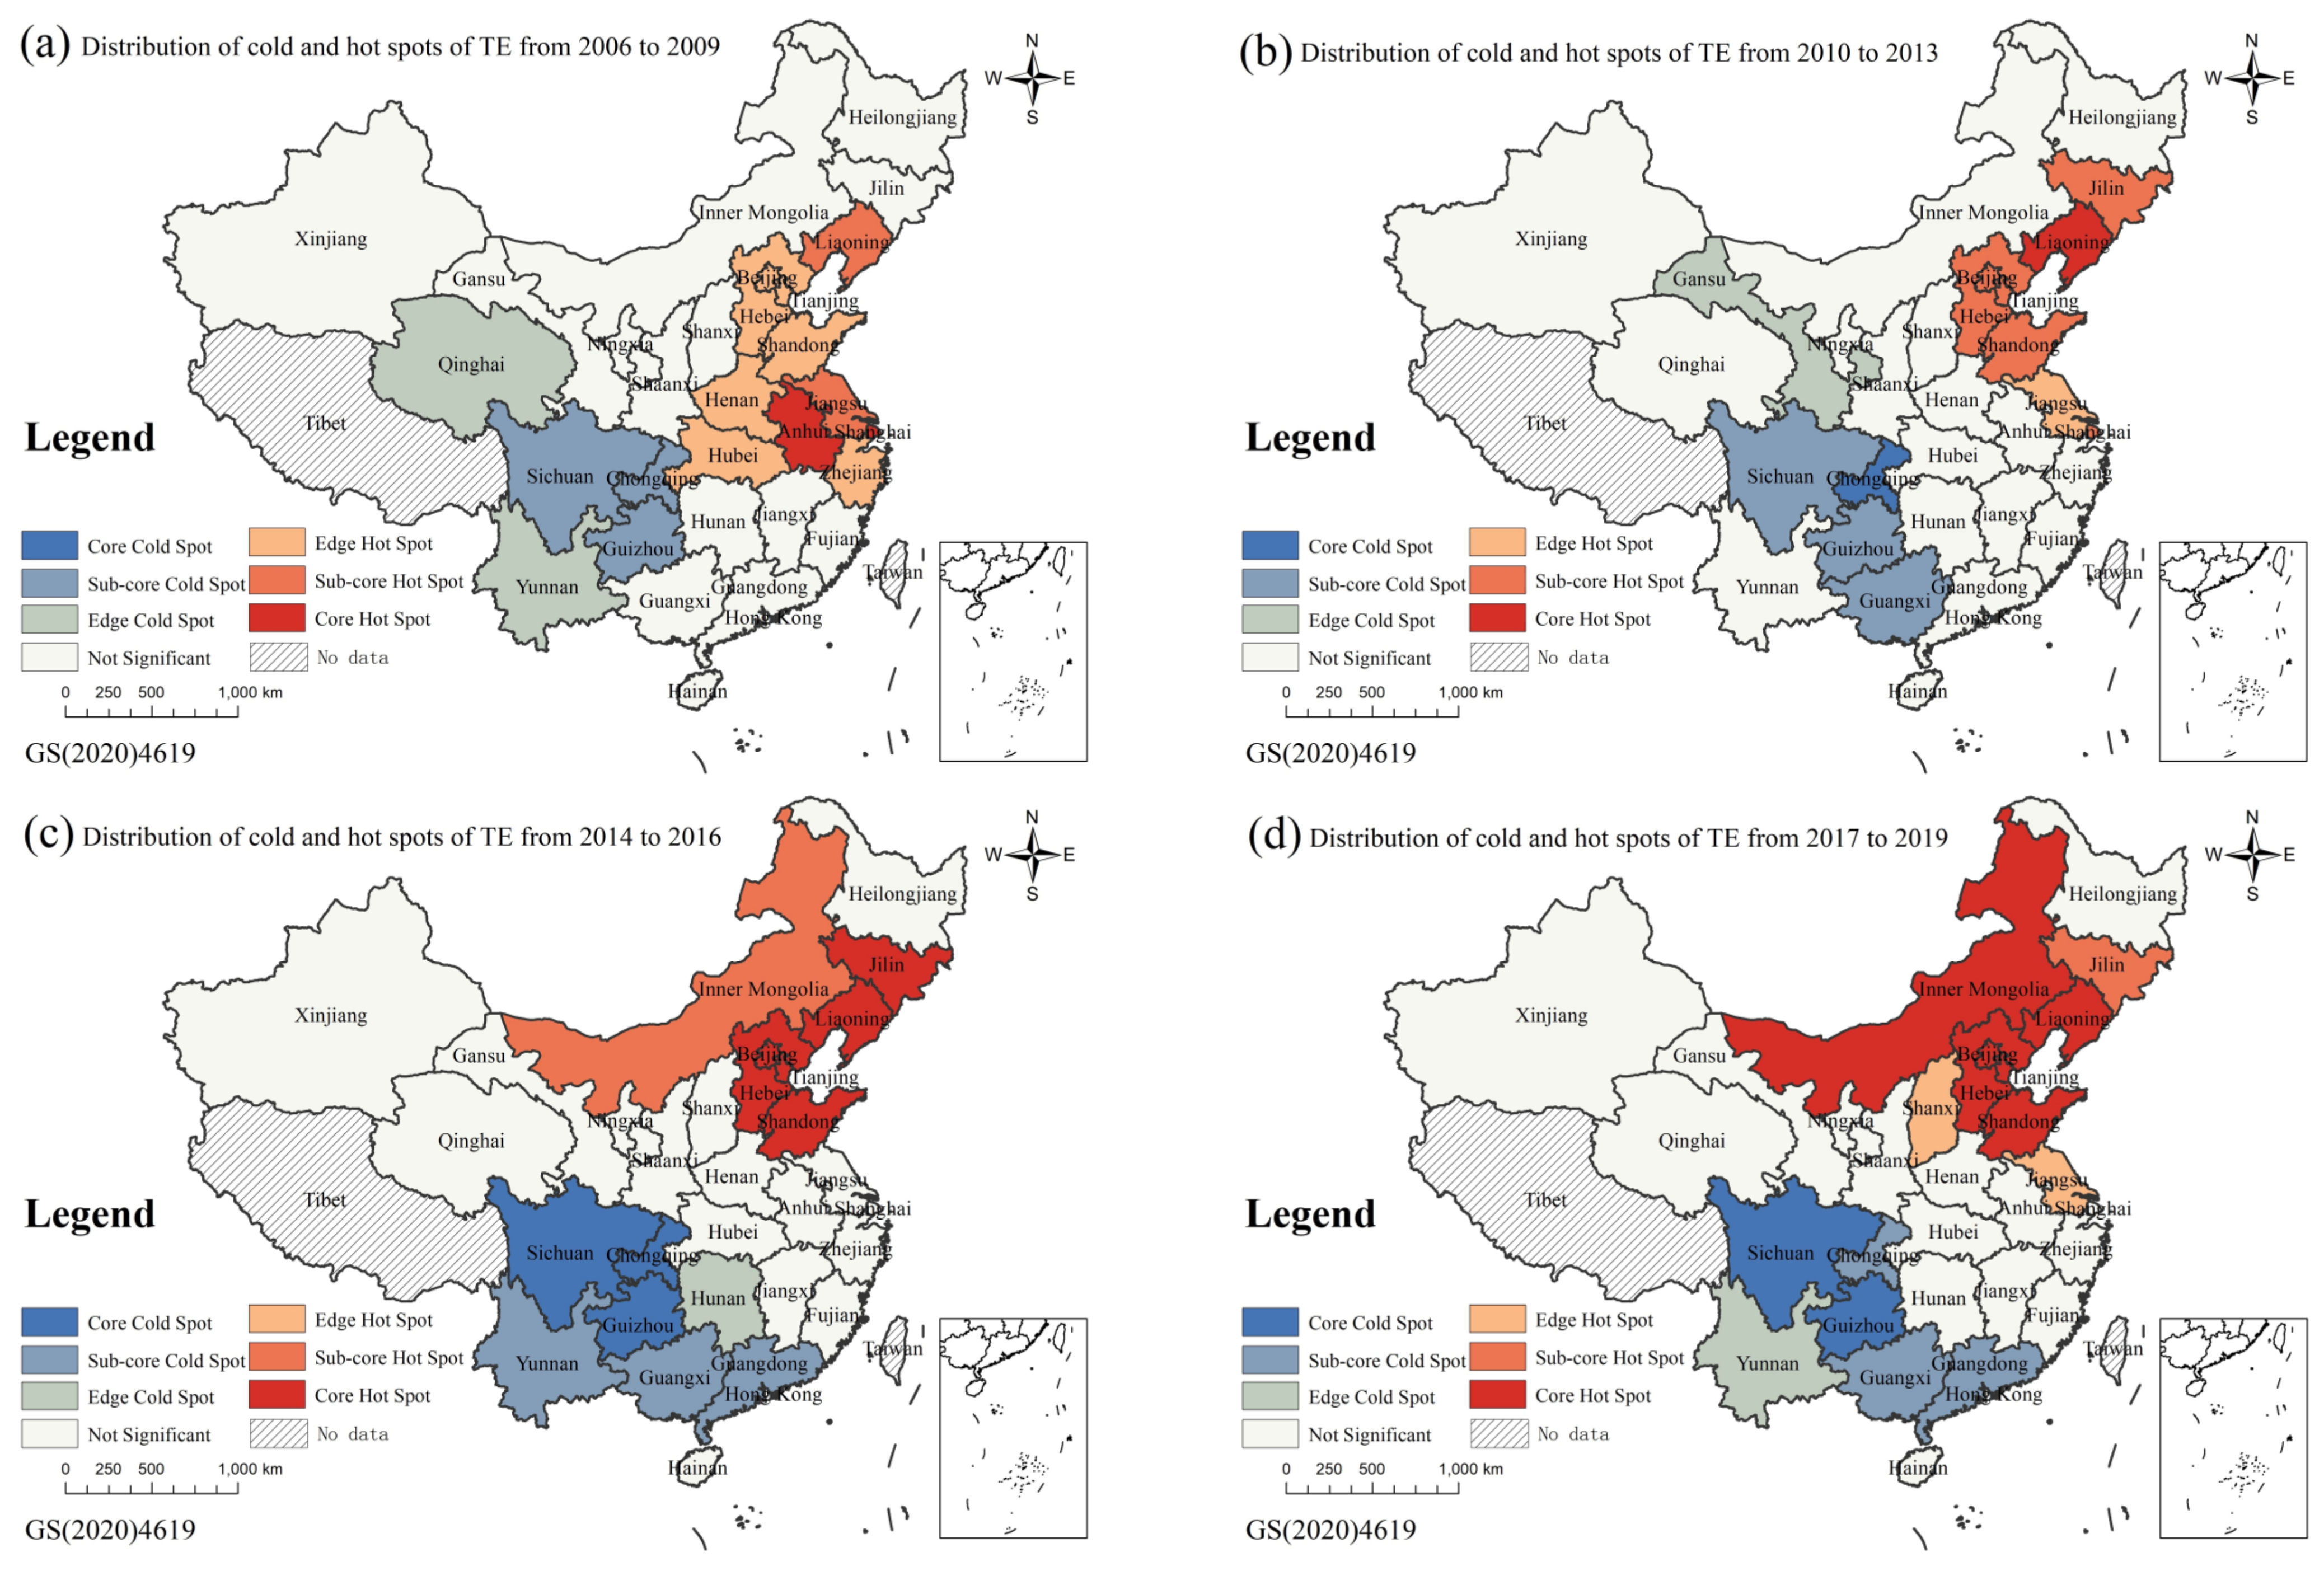
In order to analyze the spatial and local variation characteristics of TE in China in more detail, the clustering situation of high and low values of regional TE was further discussed by using Getis-Ord Gi* analysis. According to the Jenks natural fracture method, it can be divided into core hot spot, sub-core hot spot, edge hot spot, core cold spot, sub-core cold spot, and edge cold spot.
According to the spatial distribution of the four time periods in Figure 5, China’s TE is characterized as high in the east and low in the west, and low in the south and high in the north. In 2006–2009, the hot spots included Anhui, Shanghai, Jiangsu, and 11 other provinces, whereas the cold spots included Chongqing, Guizhou, Sichuan, and five other provinces. In 2010–2013, the hot spots were mainly concentrated in the eastern coastal areas. The core hot spots moved from Anhui and Shanghai to Liaoning. Meanwhile, Chongqing entered the core cold spot area, and the edge cold spot area moved from Qinghai to Gansu. In 2014–2016, the development of TE was dominated by the spatial agglomeration of the “Matthew effect,” which dictates that the stronger the strong, the weaker the weak, and the number of core hot spots and core cold spots increased significantly. At the same time, Inner Mongolia entered the hot zone, whereas Jiangsu and Shanghai withdrew from the hot zone. Hunan, Guangdong, and Yunnan entered the cold spot zone, whereas Gansu withdrew from the hot spot zone. Therefore, TE changed from an east–west difference to a north–south difference in 2006–2013. With the implementation of the policy of western development and the rise of Central China, hot spots shifted and spread in 2017–2019, and Inner Mongolia became the core hot spot. The number and severity of cold spots decreased, and the situation of cold spots in Western China improved significantly. The eco-efficiency of regional tourism shows a changing trend that the strong become weak and the weak become strong. From the perspective of the whole research period, the number of provinces in cold hot spots conformed to the law of “unbalanced growth theory.” With the adjustment of national regional development strategies and the implementation of policies, the number of hot spots (11, 8, 7, 9) first decreased and then increased, whereas the number of cold spots (5, 5, 7, 6) first increased and then decreased. This is in line with China’s strategic goal of coordinated regional development.

4.3. The Level of New Urbanization

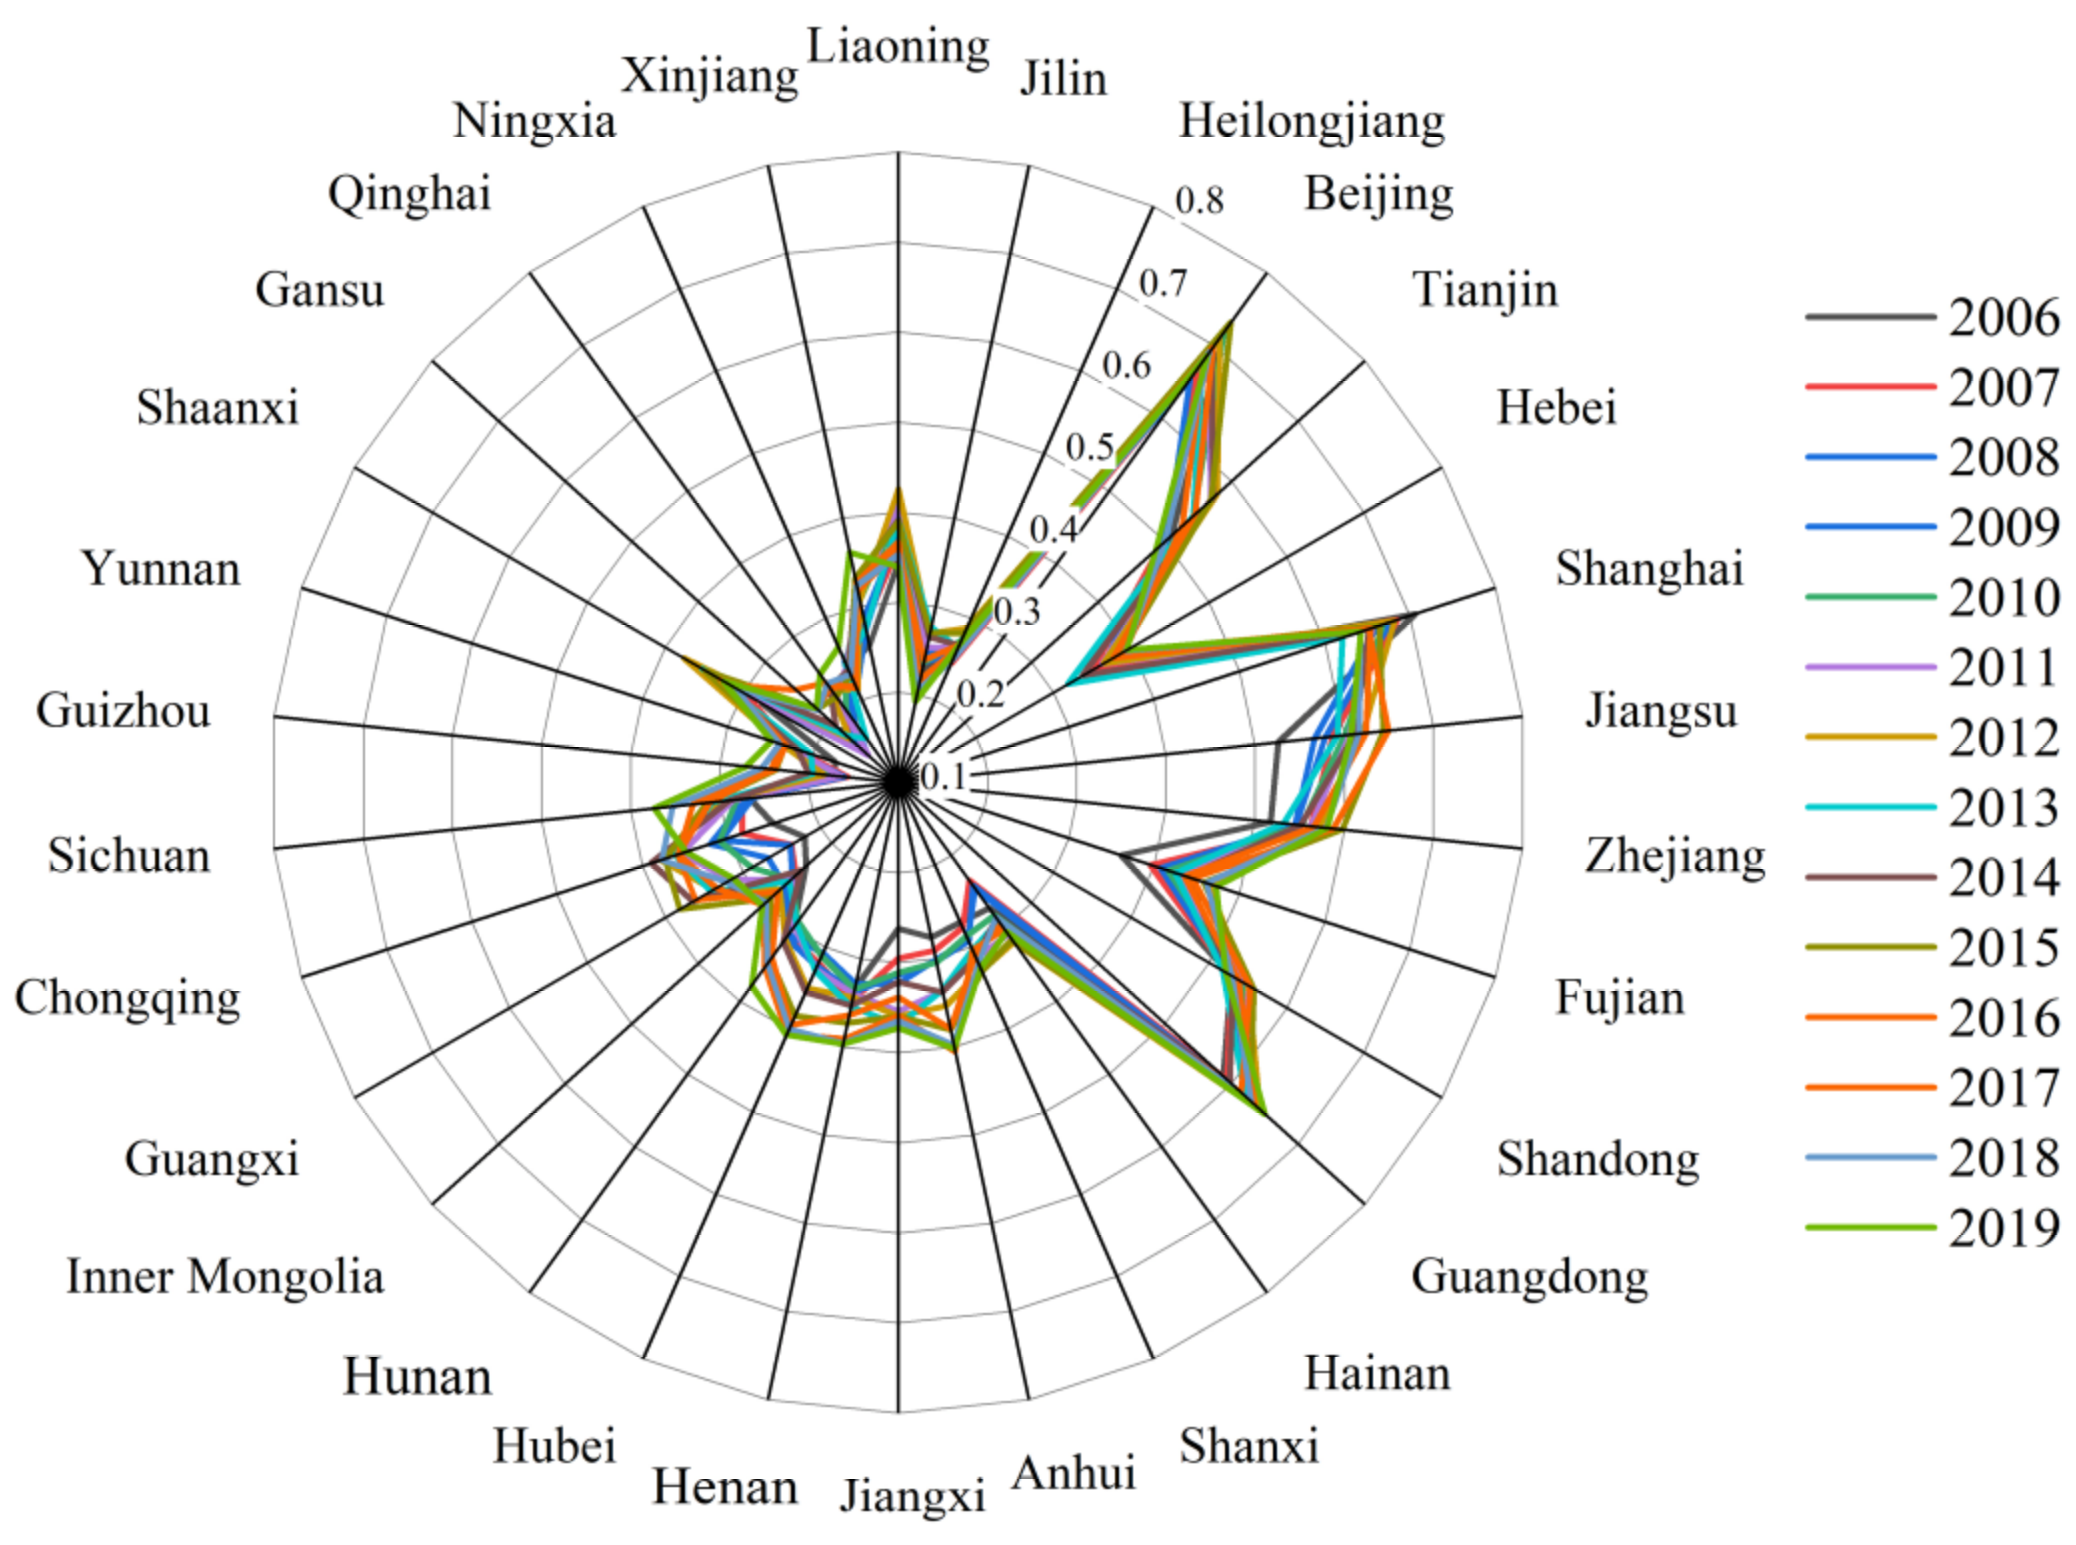
Based on the five dimensions of population, economy, space, society, and ecology, the comprehensive development level of NU in 30 provinces in China from 2006 to 2019 was estimated using the entropy method. The level of NU is on the rise as a whole. As shown in Figure 6 and Figure 7, the level of NU in Eastern China was significantly higher than that in other regions, with an average value of 0.5–0.6 and relatively stable development. Similar to the distribution of TE, Beijing, Tianjin, Shanghai, Jiangsu, Guangdong, and other places were in a leading position in the NU in the eastern region. During the study period, the central region and the western region rose steadily, which is largely consistent with the trend of the whole country. Specifically, the development gap between the central and western regions was relatively large, and the NU in the western region was at a low level. The reason is that the western region of China is limited by economic, geographical, resource, and environmental development. The urbanization level of Northeast China was generally between the central region and the western region. Specifically, the level of NU in the eastern region decreased after entering the 13th Five-Year Plan in 2016. The reason may be because the 13th Five-Year Plan period is a key period to promote the comprehensive revitalization of the old industrial base in Northeast China. The pressure to transform is great, and challenges are faced from many areas, which has a certain impact on the overall level of NU in the short term.

4.4. The Interactive Response of Tourism Eco-Efficiency and New Urbanization

4.4.1. Impulse Response Analysis

In order to weaken the collinearity and heteroscedasticity of the model, natural logarithm processing was performed on the original data without changing the correlation of variables. According to the unit root test, the original sequence of TE, the NU level in China, and the eastern region were stationary. The central and western regions were first-order differential stationary series. There was a unit root in the sequence data in Northeast China, so the PVAR model could not be constructed. The model obtains the optimal lag order according to the lag order information criterion and then carries out the Granger causality test. The results (Table 5) show that, at the significance level of 5%, China’s NU was a one-way Granger cause of TE, that is, TE responds significantly to the disturbance of NU, whereas the disturbance of TE does not have a significant impact on the development level of NU. In terms of the four economic regions, the relationship between the two in Northeast China is unclear. At the significance level of 1% in Eastern China, NU was a one-way Granger cause of TE. The Granger relationship between TE and the NU in Central and Western China was not significant. This indicates that the dynamic response of TE to NU has obvious regional specificity.
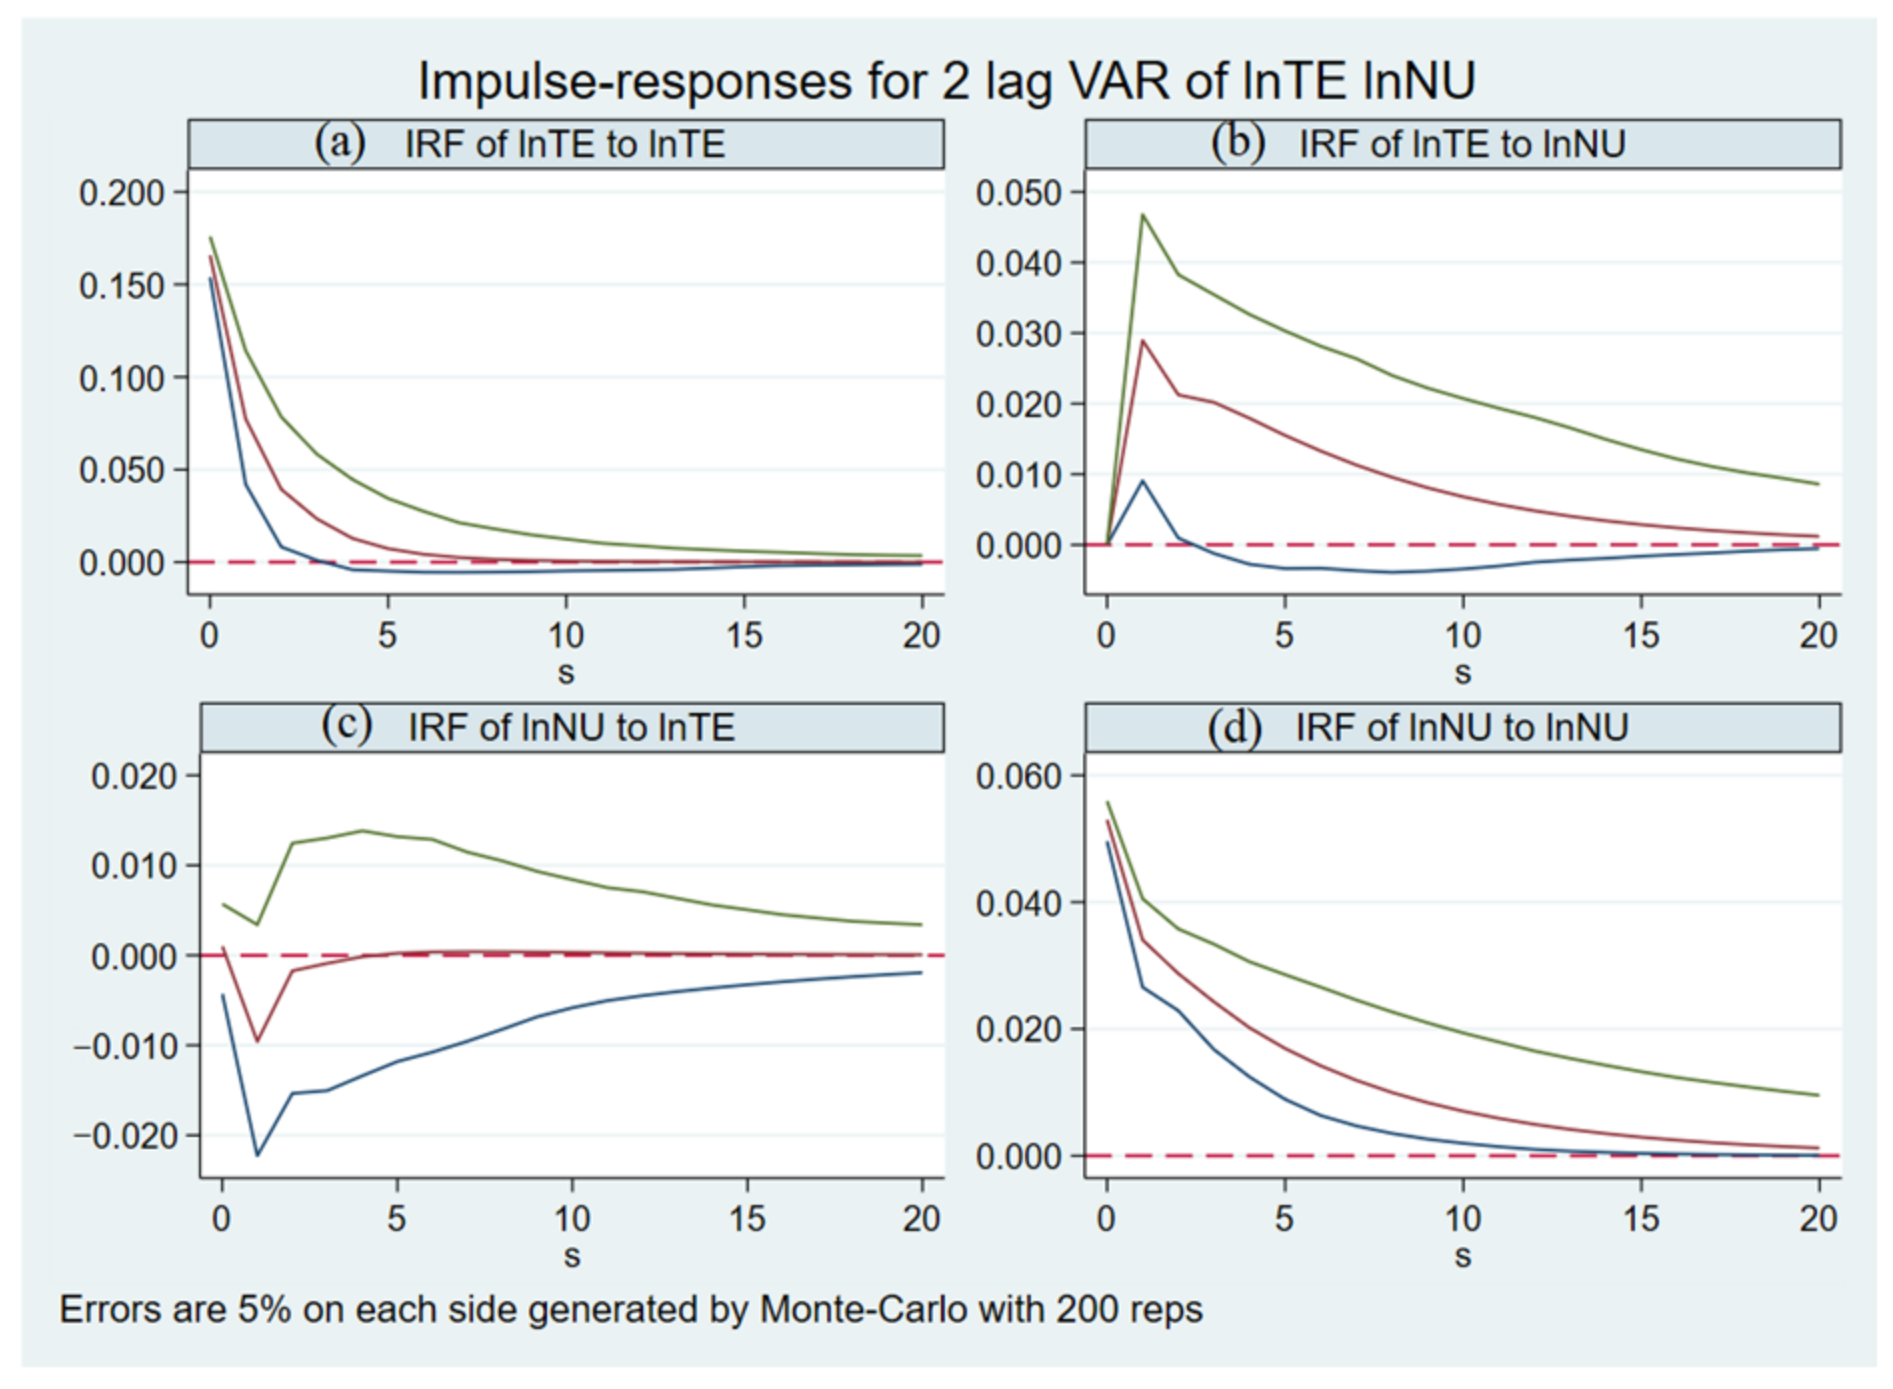
In order to further characterize the dynamic relationship between TE and NU, this paper used the impulse response model to analyze the national level and the eastern region. From the responses of TE and NU level in Figure 8a,d and Figure 9a,d, it can be seen that when a positive impact was given, it had a significant positive impact on itself. During the study period, the impact of self-disturbance on TE was significantly greater than that of NU and disappeared rapidly, indicating that the development system of tourism ecology is more sensitive and vulnerable to threat but has great potential for improvement. It can be seen from Figure 8b and Figure 9b that the development of NU had a significant positive impact on TE, that is, improvement of the NU level promotes the development of TE. At the national level, when the development level of NU was positively impacted, the TE did not respond in that year. It responded and reached the maximum in the first year after the disturbance, and the response value was about 0.029. After the eighth year, the response value started to be lower than 0.01, and the impact tended to flatten after 15 years.
The response time in the eastern region was shorter than that at the national level. In the eastern region, it also reached the maximum response value in the first year after the disturbance. The response value was about 0.029 and then gradually flattened, with a slow change trend. From the whole response curve, the response of TE had a long memory, and the response degree was in a slow weakening trend, indicating that improvement of the NU level has a long-term positive impact on the improvement of TE. Figure 8c and Figure 9c show that the impact of TE on NU was not significant, and it only showed a weak impact, which is consistent with the previous Granger causality test results. The above results show that in the face of the disturbance of NU, the response of TE is mild, but at the same time, the response is quick and the impact time is lasting.
In general, urbanization is always a one-way Granger cause of TE at both national and regional (eastern region) levels. The reason may be that TE mainly reflects the level of ecological civilization in the tourism industry, and its impact on comprehensive social development is not obvious. In addition, evidence from tourism-oriented cities proves that tourism development can promote urbanization, but due to environmental pressure, it is increasingly difficult for tourism development to promote urbanization [60]. With the continuous increase in the urbanization rate, the phenomenon of ecological overload is more and more serious. The improvement in TE is not enough to make up for the damage to the ecological environment, so it is difficult to expand its good effects on the process of urbanization in a large area.

4.4.2. Analysis of Variance Decomposition

In order to further clarify the contribution of NU to promoting TE, variance decomposition of China’s TE was carried out based on impulse response, and the results are shown in Table 6. The results show that the contribution rates of NU to TE at the national level and the eastern region were about 7.4% and 35%, respectively. Meanwhile, the eastern region was the only economic zone that passed the Granger causality test, and the disturbance law was similar to the national level. Therefore, in the context of China’s NU strategy, the development of Eastern China is of clear importance to the improvement of national TE. China needs to take the eastern region as the lead to improve TE and achieve sustainable tourism development goals.
Combined with impulse response analysis, it was found that, although the impact of NU on TE is not rapid or drastic, it has a long-term impact, which is of great practical significance to the sustainable and high-quality development of China’s tourism industry. At the same time, the limited impact of NU also reflects the existence of other important factors affecting TE.

4.5. The Impact of the Internal Structure of New Urbanization on Tourism Eco-Efficiency

China’s TE and its dynamic relationship with NU have obvious temporal and spatial characteristics. In order to further explore the driving mechanism of NU on TE, this study investigated the impact of five dimensions and 19 evaluation indicators of NU on TE. According to the OLS regression results, five factors, including population, economy, space, society, and ecological urbanization, passed the significance level test of 1%, and the variance inflation factor (VIF) was less than 7.5, the adjusted R2 was 1, and the Jarque–Bera statistic was not significant, indicating that there was no collinearity problem in the variables, and the model fitting was good. The regression coefficients are shown in Table 7. Initially, from 2006 to 2019, population, economy, space, society, and ecological urbanization had a significant positive impact on TE. Among them, economic urbanization had the greatest impact, followed by social urbanization, population urbanization, ecological urbanization, and spatial urbanization. As the OLS model is a global regression model, the estimated value of the regression coefficient obtained by OLS model is the average value of the whole study area. Considering the possible local effects of spatial objects, GWR was used for further regression to improve the accuracy of results. It was found that the GWR results are consistent with the OLS results, indicating that the five dimensions of NU had no regional specificity on the impact of China’s TE in that year.
In addition, as shown in Table 7, from the perspective of statistical significance, all factors of the internal structure of NU had a significant impact on TE. However, VIF indicates that there was redundancy in explanatory variables (VIF > 0.75). Therefore, the key influencing factors were preliminarily determined according to the OLS results and further regressed by the GWR model. As shown in Table 8, there was little spatial difference in the impact of internal key factors of NU on China’s TE. From the mean change in regression coefficient from 2006 to 2019, the impact of key influencing factors on TE in China’s four economic regions became more and more balanced. In 2019, the regression coefficients of the internal key influencing factors of NU in the four economic zones were about 0.17, which is in line with China’s coordinated development goal. In 2006, the urban registered unemployment rate and the proportion of education expenditure had a negative impact on TE. The urban population density and the harmless treatment rate of domestic waste had a positive impact on TE. In 2019, urban registered unemployment rate, urban population density, and per capita road area had a negative impact on TE. The proportion of total output value of secondary and tertiary industries in GDP, water use penetration rate, gas penetration rate, per capita park green space area, harmless treatment rate of domestic waste, and comprehensive utilization rate of industrial solid waste had a positive impact on TE. The results show that the importance of ecological factors of urbanization to TE was significantly improved.

5. Discussion

TE evaluation methods include the single ratio method, the indicator system method, and the model method. Based on the disadvantages of the first two methods of poor comprehensiveness and objectivity, this paper adopts the Super-SBM model based on undesired output to evaluate TE. In recent years, as carbon emissions have been considered an important pressuring representative of the environment, tourism carbon emissions have gradually become an important non-expected output indicator for TE evaluation. The scientific measurement of tourism carbon emissions is the key to evaluating TE. The measurement methods of tourism carbon emissions include both “top-down” and “bottom-up” approaches. Due to the lack of data from China’s tourism satellite accounts, the application of the top-down method is not favorable. Therefore, this paper adopted the bottom-up approach to measure carbon emissions from tourism and introduced an improved solution to measure carbon emissions from tourism transportation based on the consideration of tourist turnover of four types of transportation: road, rail, civil, and water transportation. Transportation accounts for nearly 95% of tourism-related carbon dioxide emissions [22]; thus, the improvements in measurement methods will help to estimate tourism carbon emissions more accurately. This will provide methodological implications for research in low-carbon tourism and other similar areas.
Based on this, the final results show that NU with Chinese characteristics can have a long-term positive impact on the improvement of China’s overall TE. This is consistent with the findings of Ruan et al. [61], who found that urbanization rate is an important driving factor for tourism ecological security—that is, the development of urbanization can promote coordinated development of the tourism economy and the ecological environment. Different from that, this paper further finds that the impact of green urbanization on the coordinated development of the tourism economy and ecological environment is mild and lasting through TE, which explains the functional characteristics of urbanization by eco-friendly transformation of the sustainable development of tourism. However, evidence from other countries suggests that urbanization has a negative impact on the ecological environment [62,63]. This paper provides new evidence for the relationship between urbanization and the ecological environment from the perspective of tourism development. This paper also confirms that economic factors and ecological environmental factors are more important indicators affecting the sustainable development of regional tourism [64,65]. In the long run, urbanization is the key to improving TE. Therefore, this paper believes that taking the road of intensive, intelligent, green, and low-carbon urbanization as a long-term development policy can improve environmental problems and promote the sustainable development of tourism. This is similar to the study of eco-efficiency in various other aspects of tourism, since such urbanization is consistent with their own ecological development requirements. For example, carrying out the following activities will contribute to the sustainable development of tourism: in the hotel sector, improving water efficiency [66]; in transportation, improving eco-efficiency and reducing resource consumption within the destination [67]; eco-efficient resource management for tourism destinations [68]; and improving the overall eco-efficiency of the scenic area [25].
The relationship between TE and NU also has regional specificity. From the OLS and GWR regression results, population, economy, space, society, and ecological urbanization had a significant positive impact on TE, among which economic urbanization was the strongest factor to promote TE in that year. In addition, the impact of the internal structure of NU on TE had no obvious regional specificity. Therefore, with a high level of economic development, the eastern region showed an obvious multiplier effect—that is, from a long-term perspective, the development of NU can have a significant positive impact on TE. Previous studies believed that low-level urbanization has had a negative impact on the climate and environment of tourist cities [69]. On the whole, when the regional tourism industry develops rapidly and the economy grows rapidly, destination cities with high-level urbanization can take timely measures to respond to the resource consumption required by tourism development through perfect supporting infrastructure and sufficient capital and policy support so as to reduce the damage on the ecological environment. In addition, the NU strategy of environment-friendly transformation is implemented in China. Therefore, Eastern China, in which the level of NU is ahead of the whole country, showed a significant positive impact of urban development on TE.
The results of impulse response and variance decomposition show that the maximum positive impact of urbanization on TE in Eastern China was about 0.03, with a contribution of about 35%, whereas the contribution at the national level was only 7.4%, and there was no obvious response relationship in other economic regions. The spatial characteristics of the comprehensive development level of China’s NU (the eastern region > the national level > other economic zones) support the conclusion that the higher the level of NU, the more effectively it can improve the TE—that is, the higher the level of environmentally friendly urbanization, the more it can promote the sustainable development of tourism. From the changes in the number and regression coefficient of the key influencing factors of NU on TE from 2006 to 2019, the value role of ecological factors is becoming more and more obvious. Therefore, for such regions, in order to promote the sustainable development of tourism, we should strengthen the policy support of ecological innovation and green ecological urbanization, and thereby organically combine the development of the tourism industry with regional urbanization and ecological environmental construction. The local government should combine its own regional characteristics, adhere to the people-oriented principle, pay attention to talent training and technological innovation, improve the resource utilization rate, strengthen pollution control, expand urban construction land in an orderly manner, protect the ecological environment so as to coordinate the development of all dimensions of urbanization, and further transform for quality improvement and environmental friendliness. At the same time, the government should guide and encourage the tourism industry to carry out green investment and production; strengthen policy coordination and cooperation with transportation, environment, energy, and other departments; and promote the ecological development of tourism elements. In the process of developing government response measures, special attention should be paid to the impact of key internal factors of NU on TE so as to improve the effectiveness of policies.
On the contrary, the lower the level of urbanization, the more difficult it is to support the necessary resource consumption of tourism activities, which should show the negative impact of urbanization on tourism ecology. However, the urbanization development in Northeast, Central, and Western China with low urbanization levels had no significant negative impact on TE. On the one hand, urbanization development is an important national strategy for China’s economic growth. Even regions with low urbanization levels are still strongly supported so that the urbanization level can match the development process of tourism, and to some extent, the damage to the urban environment of tourist destinations is weakened. On the other hand, China’s urbanization is a new type of urbanization characterized by economical, intensive, ecological, livable, and harmonious development, which has significant ecological effects and is conducive to ecologically sustainable development [21]. Therefore, developing green urbanization can actively improve the tension between tourism development and the ecological environment and improve the eco-efficiency of tourism in economically underdeveloped regions with rich natural resources but fragile ecological environments. In this case, the sustainable development of tourism has become more tolerant under the trend of urbanization, but no impact does not mean that wanton urbanization will not hinder the sustainable development of tourism. Ecological sustainable development is still the topic of the times.

6. Conclusions

This paper puts forward an improved method of tourism carbon emission measurement. Based on the perspective of carbon footprint, this paper mainly explores the temporal and spatial evolution characteristics of China’s TE, the long-term dynamic impact of NU on TE, and the impact of the internal structure of each dimension on TE from China’s four economic regions. By analyzing the performance of TE under the trend of urbanization, this paper aims to discuss how to balance the trade-offs between urbanization, tourism, and ecological environment according to regional differences under the global SDGs and promote the sustainable development of tourism. The results show that the transition to environmentally friendly urbanization is very important to the sustainable development goal of the tourism industry. The main conclusions are as follows:
(1)
China’s TE showed a slight fluctuation and upward trend. During the study period, the four major economic regions were in a state of fluctuation. Furthermore, the TE of the eastern and northeastern regions of China had a certain leading edge, but the northeast region fluctuated greatly, followed by the central region and finally the western region.
(2)
The agglomeration characteristics of China’s TE changed from high in the east and low in the west to low in the south and high in the north, but the balance point remained in Henan, indicating that it is in a dynamic equilibrium on the whole. The eco-efficiency of regional tourism showed a trend that the strong become weaker and the weak become stronger, and the regional differences first increased and then decreased, which is in line with the law of “unbalanced growth theory” and the goal of coordinated regional development in China.
(3)
The impact of NU on TE was one-way, and the dynamic response of TE had obvious regional specificity, especially in the eastern region, because economic urbanization had a great impact on the improvement of TE.
(4)
From the national level and the eastern region, the response of TE was the largest in the first year after the disturbance of NU, and the impact was long term. Moreover, the contribution rate of NU to developed economic regions reached 35%.
(5)
Among the key influencing factors of the impact of NU on TE, urban registered unemployment rate, urban population density, and per capita road area had a negative impact on TE. The proportion of the total output value of secondary and tertiary industries in GDP, the popularization rate of water and gas, the area of park green space per capita, the harmless treatment rate of domestic waste, and the comprehensive utilization rate of industrial solid waste had a positive impact on TE. It was found that ecological factors are becoming more and more important.

7. Limitations and Recommendations for Future Research

Almost every country is undergoing urbanization. China has experienced the largest and fastest urbanization process in the world, as well as the rapid growth of tourism. Some existing research discusses the effect of urbanization on tourism, but not for a comprehensive investigation on the temporal and spatial distribution characteristics and impact law of TE under the process of urbanization. Clarifying the possible relationship between regional TE and urbanization can not only provide practical guidance and a scientific reference for China to improve TE, but also provide a reference for the sustainable development of tourism in other countries, especially those regions experiencing rapid urbanization and seeking breakthroughs.
Finally, this paper has deficiencies and limitations. Due to the availability of data, only 30 provinces in China were selected as research subjects, and the results inevitably lacked certain accuracy. When future data are provided, the coordination between China’s tourism ecology and economy can be accurately analyzed from a more comprehensive spatial perspective. At the same time, other influencing factors and driving mechanisms of TE are also worth further discussion.

Author Contributions

Conceptualization, F.Z. and X.Y.; data curation, X.Y.; formal analysis, F.Z.; funding acquisition, F.Z. and J.Z.; methodology, X.Y. and D.M.; project administration, F.Z. and J.W.; software, D.M.; writing—original draft, F.Z. and X.Y.; writing—review and editing, F.Z., X.Y., J.W., D.M., Y.X., G.G. and J.Z. All authors have read and agreed to the published version of the manuscript.

Funding

This research was funded by the Science and Technology Research Program of Chongqing Municipal Education Commission (grant No. KJQN201901129), the Humanities and Social Sciences Research Program of Chongqing Municipal Education Commission (grant No.19SKGH132), the Chongqing Social Science Planning Project (grant No.2019YBGL075), the National Natural Science Foundation of China (grant No. 41901214), the Scientific Research Foundation of Chongqing University of Technology, and the Postgraduate innovation project of Chongqing University of Technology (grant No. gzlcx20223117).

Institutional Review Board Statement

Not applicable.

Informed Consent Statement

Not applicable.

Data Availability Statement

The datasets generated during and/or analyzed during the current study are available from the corresponding author on reasonable request.

Acknowledgments

Thanks for all the financial support. We would also like to thank the editor and all anonymous reviewers for their valuable comments.

Conflicts of Interest

The authors declare no conflict of interest.

References

  1. Newman, P. Green Urbanism and its Application to Singapore. Environ. Urban. ASIA 2010, 1, 149–170. [Google Scholar] [CrossRef]
  2. Deilmann, C.; Lehmann, I.; Reißmann, D.; Hennersdorf, J. Data envelopment analysis of cities—Investigation of the ecological and economic efficiency of cities using a benchmarking concept from production management. Ecol. Indic. 2016, 67, 798–806. [Google Scholar] [CrossRef]
  3. Sarkis, J.; Cordeiro, J.J. Ecological modernization in the electrical utility industry: An application of a bads–goods DEA model of ecological and technical efficiency. Eur. J. Oper. Res. 2011, 219, 386–395. [Google Scholar] [CrossRef]
  4. Li, J.; Lin, B. Ecological total-factor energy efficiency of China’s heavy and light industries: Which performs better? Renew. Sustain. Energy Rev. 2017, 72, 83–94. [Google Scholar] [CrossRef]
  5. Tittonell, P. Ecological intensification of agriculture—sustainable by nature. Curr. Opin. Environ. Sustain. 2014, 8, 53–61. [Google Scholar] [CrossRef]
  6. Grilli, G.; Tyllianakis, E.; Luisetti, T.; Ferrini, S.; Turner, R.K. Prospective tourist preferences for sustainable tourism development in Small Island Developing States. Tour. Manag. 2020, 82, 104178. [Google Scholar] [CrossRef]
  7. Yang, X.; Jia, Y.; Wang, Q.; Li, C.; Zhang, S. Space–time evolution of the ecological security of regional urban tourism: The case of Hubei Province, China. Environ. Monit. Assess. 2021, 193, 1–20. [Google Scholar] [CrossRef]
  8. Xiaobin, M.; Biao, S.; Guolin, H.; Xing, Z.; Li, L. Evaluation and spatial effects of tourism ecological security in the Yangtze River Delta. Ecol. Indic. 2021, 131, 108190. [Google Scholar] [CrossRef]
  9. Azam, M.; Alam, M.; Hafeez, M.H. Effect of tourism on environmental pollution: Further evidence from Malaysia, Singapore and Thailand. J. Clean. Prod. 2018, 190, 330–338. [Google Scholar] [CrossRef]
  10. Bonn, M.A.; Chang, H.; Cho, M. The environment and perceptions of wine consumers regarding quality, risk and value: Reputations of regional wines and restaurants. J. Hosp. Tour. Manag. 2020, 45, 203–212. [Google Scholar] [CrossRef]
  11. Cho, M.; Bonn, M.A.; Li, J. Examining Risk-Reduction Behavior Toward Water Quality Among Restaurant Guests. Cornell Hosp. Q. 2020, 61, 255–270. [Google Scholar] [CrossRef]
  12. Li, Y.; Zhang, L. Ecological efficiency management of tourism scenic spots based on carbon footprint analysis. Int. J. Low-Carbon Technol. 2020, 15, 550–554. [Google Scholar] [CrossRef]
  13. Hall, C.M.; Amelung, B.; Cohen, S.; Eijgelaar, E.; Gössling, S.; Higham, J.; Leemans, R.; Peeters, P.; Ram, Y.; Scott, D. On climate change skepticism and denial in tourism. J. Sustain. Tour. 2014, 23, 4–25. [Google Scholar] [CrossRef]
  14. Pikkemaat, B.; Peters, M.; Bichler, B.F. Innovation research in tourism: Research streams and actions for the future. J. Hosp. Tour. Manag. 2019, 41, 184–196. [Google Scholar] [CrossRef]
  15. Yasmeen, H.; Tan, Q.; Zameer, H.; Tan, J.; Nawaz, K. Exploring the impact of technological innovation, environmental regulations and urbanization on ecological efficiency of China in the context of COP21. J. Environ. Manag. 2020, 274, 111210. [Google Scholar] [CrossRef] [PubMed]
  16. Sun, W.; Huang, C. How does urbanization affect carbon emission efficiency? Evidence from China. J. Clean. Prod. 2020, 272, 122828. [Google Scholar] [CrossRef]
  17. Aguilera, M.A.; Tapia, J.; Gallardo, C.; Núñez, P.; Varas-Belemmi, K. Loss of coastal ecosystem spatial connectivity and services by urbanization: Natural-to-urban integration for bay management. J. Environ. Manag. 2020, 276, 111297. [Google Scholar] [CrossRef]
  18. Fang, X.; Shi, X.; Phillips, T.K.; Du, P.; Gao, W. The Coupling Coordinated Development of Urban Environment Towards Sustainable Urbanization: An Empirical Study of Shandong Peninsula, China. Ecol. Indic. 2021, 129, 107864. [Google Scholar] [CrossRef]
  19. Cai, J.; Li, X.; Liu, L.; Chen, Y.; Wang, X.; Lu, S. Coupling and coordinated development of new urbanization and agro-ecological environment in China. Sci. Total Environ. 2021, 776, 145837. [Google Scholar] [CrossRef]
  20. Zhang, S.; Li, Z.; Ning, X.; Li, L. Gauging the impacts of urbanization on CO2 emissions from the construction industry: Evidence from China. J. Environ. Manag. 2021, 288, 112440. [Google Scholar] [CrossRef]
  21. Yu, B. Ecological effects of new-type urbanization in China. Renew. Sustain. Energy Rev. 2020, 135, 110239. [Google Scholar] [CrossRef]
  22. Brida, J.G.; Gómez, D.M.; Segarra, V. On the empirical relationship between tourism and economic growth. Tour. Manag. 2020, 81, 104131. [Google Scholar] [CrossRef]
  23. Schaltegger, S.; Sturm, A. kologische Rationalitt (German/in English: Environmental rationality). Die Unternehm. 1990, 4, 117–131. [Google Scholar]
  24. Qin, M.; Sun, M.; Li, J. Impact of environmental regulation policy on ecological efficiency in four major urban agglomerations in eastern China. Ecol. Indic. 2021, 130, 108002. [Google Scholar] [CrossRef]
  25. Peng, H.; Zhang, J.; Lu, L.; Tang, G.; Yan, B.; Xiao, X.; Han, Y. Eco-efficiency and its determinants at a tourism destination: A case study of Huangshan National Park, China. Tour. Manag. 2016, 60, 201–211. [Google Scholar] [CrossRef]
  26. Gössling, S.; Peeters, P.; Ceron, J.-P.; Dubois, G.; Patterson, T.; Richardson, R.B. The eco-efficiency of tourism. Ecol. Econ. 2005, 54, 417–434. [Google Scholar] [CrossRef]
  27. Su, L.; Ji, X. Spatial-temporal differences and evolution of eco-efficiency in China’s forest park. Urban For. Urban Green. 2020, 57, 126894. [Google Scholar] [CrossRef]
  28. Yang, G.; Li, P.; Zheng, B.; Zhang, Y. GHG Emission-Based Eco-Efficiency Study on Tourism Itinerary Products in Shangri-La, Yunnan Province, China. Curr. Issues Tour. 2008, 11, 604–622. [Google Scholar] [CrossRef]
  29. Brida, J.G.; Deidda, M.; Pulina, M. Tourism and transport systems in mountain environments: Analysis of the economic efficiency of cableways in South Tyrol. J. Transp. Geogr. 2014, 36, 1–11. [Google Scholar] [CrossRef]
  30. Nepal, R.; al Irsyad, M.I.; Nepal, S.K. Tourist arrivals, energy consumption and pollutant emissions in a developing economy–implications for sustainable tourism. Tour. Manag. 2018, 72, 145–154. [Google Scholar] [CrossRef]
  31. Liu, J.; Zhang, J.; Fu, Z. Tourism eco-efficiency of Chinese coastal cities—Analysis based on the DEA-Tobit model. Ocean Coast. Manag. 2017, 148, 164–170. [Google Scholar] [CrossRef]
  32. Zha, J.; Yuan, W.; Dai, J.; Tan, T.; He, L. Eco-efficiency, eco-productivity and tourism growth in China: A non-convex metafrontier DEA-based decomposition model. J. Sustain. Tour. 2020, 28, 663–685. [Google Scholar] [CrossRef]
  33. Wilson, C. Dictionnaire de Démographie; Blackwell: New York, NY, USA, 1985. [Google Scholar]
  34. Xie, H.; Zhang, Y.; Duan, K. Evolutionary overview of urban expansion based on bibliometric analysis in Web of Science from 1990 to 2019. Habitat Int. 2019, 95, 102100. [Google Scholar] [CrossRef]
  35. Wang, Y.; Li, X.; Zhang, F.; Wang, W.; Xiao, R. Effects of rapid urbanization on ecological functional vulnerability of the land system in Wuhan, China: A flow and stock perspective. J. Clean. Prod. 2019, 248, 119284. [Google Scholar] [CrossRef]
  36. Zhang, B.; Wang, Q. Analysis and forecasts of investment scale and structure in upstream sector for oil companies based on system dynamics. Resour. Sci. 2011, 26, 1323–1332. [Google Scholar] [CrossRef]
  37. Zhang, C.; Tian, H.; Chen, G.; Chappelka, A.; Xu, X.; Ren, W.; Hui, D.; Liu, M.; Lu, C.; Pan, S.; et al. Impacts of urbanization on carbon balance in terrestrial ecosystems of the Southern United States. Environ. Pollut. 2012, 164, 89–101. [Google Scholar] [CrossRef]
  38. Bai, Y.; Deng, X.; Jiang, S.; Zhang, Q.; Wang, Z. Exploring the relationship between urbanization and urban eco-efficiency: Evidence from prefecture-level cities in China. J. Clean. Prod. 2017, 195, 1487–1496. [Google Scholar] [CrossRef]
  39. Wu, Y.; Cui, Z.; Hu, C. Does the New Urbanization Influence Air Quality in China? Front. Environ. Sci. 2021, 9. [Google Scholar] [CrossRef]
  40. Liu, N.; Liu, C.; Xia, Y.; Da, B. Examining the coordination between urbanization and eco-environment using coupling and spatial analyses: A case study in China. Ecol. Indic. 2018, 93, 1163–1175. [Google Scholar] [CrossRef]
  41. Fu, S.; Zhuo, H.; Song, H.; Wang, J.; Ren, L. Examination of a coupling coordination relationship between urbanization and the eco-environment: A case study in Qingdao, China. Environ. Sci. Pollut. Res. 2020, 27, 23981–23993. [Google Scholar] [CrossRef]
  42. Wang, Z.; Sun, Y.; Wang, B. How does the new-type urbanisation affect CO2 emissions in China? An empirical analysis from the perspective of technological progress. Energy Econ. 2019, 80, 917–927. [Google Scholar] [CrossRef]
  43. Yao, J.; Xu, P.; Huang, Z. Impact of urbanization on ecological efficiency in China: An empirical analysis based on provincial panel data. Ecol. Indic. 2021, 129, 107827. [Google Scholar] [CrossRef]
  44. Sun, Y.; Hou, G.; Huang, Z.; Zhong, Y. Spatial-Temporal Differences and Influencing Factors of Tourism Eco-Efficiency in China’s Three Major Urban Agglomerations Based on the Super-EBM Model. Sustainability 2020, 12, 4156. [Google Scholar] [CrossRef]
  45. Zha, J.; He, L.; Liu, Y.; Shao, Y. Evaluation on development efficiency of low-carbon tourism economy: A case study of Hubei Province, China. Socio-Economic Plan. Sci. 2018, 66, 47–57. [Google Scholar] [CrossRef]
  46. Becken, S.; Patterson, M. Measuring National Carbon Dioxide Emissions from Tourism as a Key Step Towards Achieving Sustainable Tourism. J. Sustain. Tour. 2006, 14, 323–338. [Google Scholar] [CrossRef]
  47. Tang, Z.; Shang, J.; Shi, C.; Liu, Z.; Bi, K. Decoupling indicators of CO2 emissions from the tourism industry in China: 1990–2012. Ecol. Indic. 2014, 46, 390–397. [Google Scholar] [CrossRef]
  48. Zha, J.; Dai, J.; Ma, S.; Chen, Y.; Wang, X. How to decouple tourism growth from carbon emissions? A case study of Chengdu, China. Tour. Manag. Perspect. 2021, 39, 100849. [Google Scholar] [CrossRef]
  49. Qiu, X.; Fang, Y.; Yang, X.; Zhu, F. Tourism Eco-Efficiency Measurement, Characteristics, and Its Influence Factors in China. Sustainability 2017, 9, 1634. [Google Scholar] [CrossRef]
  50. Huo, B. New urbanization path planning based on cluster calculation. Clust. Comput. 2018, 22, 6827–6835. [Google Scholar] [CrossRef]
  51. Liang, L.; Wang, Z.; Li, J. The effect of urbanization on environmental pollution in rapidly developing urban agglomerations. J. Clean. Prod. 2019, 237, 117649. [Google Scholar] [CrossRef]
  52. Zhou, C.; Wang, S.; Wang, J. Examining the influences of urbanization on carbon dioxide emissions in the Yangtze River Delta, China: Kuznets curve relationship. Sci. Total Environ. 2019, 675, 472–482. [Google Scholar] [CrossRef] [PubMed]
  53. Neto, J.Q.F.; Walther, G.; Bloemhof, J.; van Nunen, J.; Spengler, T. A methodology for assessing eco-efficiency in logistics networks. Eur. J. Oper. Res. 2009, 193, 670–682. [Google Scholar] [CrossRef]
  54. Rebolledo-Leiva, R.; Angulo-Meza, L.; Iriarte, A.; González-Araya, M.C.; Vásquez-Ibarra, L. Comparing two CF+DEA methods for assessing eco-efficiency from theoretical and practical points of view. Sci. Total Environ. 2018, 659, 1266–1282. [Google Scholar] [CrossRef] [PubMed]
  55. Sun, Y.-Y.; Pratt, S. The Economic, Carbon Emission, and Water Impacts of Chinese Visitors to Taiwan. J. Travel Res. 2014, 53, 733–746. [Google Scholar] [CrossRef]
  56. Tone, K. A slacks-based measure of super-efficiency in data envelopment analysis. Eur. J. Oper. Res. 2002, 143, 32–41. [Google Scholar] [CrossRef]
  57. Xia, H.; Zhang, W.; Wang, H.; Peng, H.; Zhang, Z.; Ke, Q.; Bu, S. Spatial-temporal patterns and characteristics of ecological function between 2009 and 2015 in China. Ecol. Indic. 2020, 116, 106478. [Google Scholar] [CrossRef]
  58. Love, I.; Zicchino, L. Financial development and dynamic investment behavior: Evidence from panel VAR. Q. Rev. Econ. Finance 2006, 46, 190–210. [Google Scholar] [CrossRef]
  59. Xu, W.; Huang, Y. The correlation between HSR construction and economic development—Empirical study of Chinese cities. Transp. Res. Part A Policy Pract. 2019, 126, 24–36. [Google Scholar] [CrossRef]
  60. Liu, S.; Geng, Y.; Zhang, J.; Kang, X.; Shi, X.; Zhang, J. Ecological trap in tourism-urbanization: Simulating the stagnation and restoration of urbanization from the perspective of government incentives. Ecol. Econ. 2021, 185, 107054. [Google Scholar] [CrossRef]
  61. Ruan, W.; Li, Y.; Zhang, S.; Liu, C.-H. Evaluation and drive mechanism of tourism ecological security based on the DPSIR-DEA model. Tour. Manag. 2019, 75, 609–625. [Google Scholar] [CrossRef]
  62. Mohanta, K.; Sharma, L.K. Assessing the impacts of urbanization on the thermal environment of Ranchi City (India) using geospatial technology. Remote Sens. Appl. Soc. Environ. 2017, 8, 54–63. [Google Scholar] [CrossRef]
  63. Rahman, M.M.; Alam, K. Clean energy, population density, urbanization and environmental pollution nexus: Evidence from Bangladesh. Renew. Energy 2021, 172, 1063–1072. [Google Scholar] [CrossRef]
  64. Wang, Y.; Wu, C.; Wang, F.; Sun, Q.; Wang, X.; Guo, S. Comprehensive evaluation and prediction of tourism ecological security in droughty area national parks—A case study of Qilian Mountain of Zhangye section, China. Environ. Sci. Pollut. Res. 2021, 28, 16816–16829. [Google Scholar] [CrossRef] [PubMed]
  65. Tang, C.; Wu, X.; Zheng, Q.; Lyu, N. Ecological security evaluations of the tourism industry in Ecological Conservation Development Areas: A case study of Beijing’s ECDA. J. Clean. Prod. 2018, 197, 999–1010. [Google Scholar] [CrossRef]
  66. Charara, N.; Cashman, A.; Bonnell, R.; Gehr, R. Water use efficiency in the hotel sector of Barbados. J. Sustain. Tour. 2011, 19, 231–245. [Google Scholar] [CrossRef]
  67. Reilly, J.; Williams, P.; Haider, W. Moving towards more eco-efficient tourist transportation to a resort destination: The case of Whistler, British Columbia. Res. Transp. Econ. 2010, 26, 66–73. [Google Scholar] [CrossRef]
  68. Kelly, J.; Williams, P. Tourism destination water management strategies: An eco-efficiency modelling approach. Leisure 2007, 31, 427–452. [Google Scholar] [CrossRef]
  69. Nitivattananon, V.; Srinonil, S. Enhancing coastal areas governance for sustainable tourism in the context of urbanization and climate change in eastern Thailand. Adv. Clim. Change Res. 2019, 10, 47–58. [Google Scholar] [CrossRef]
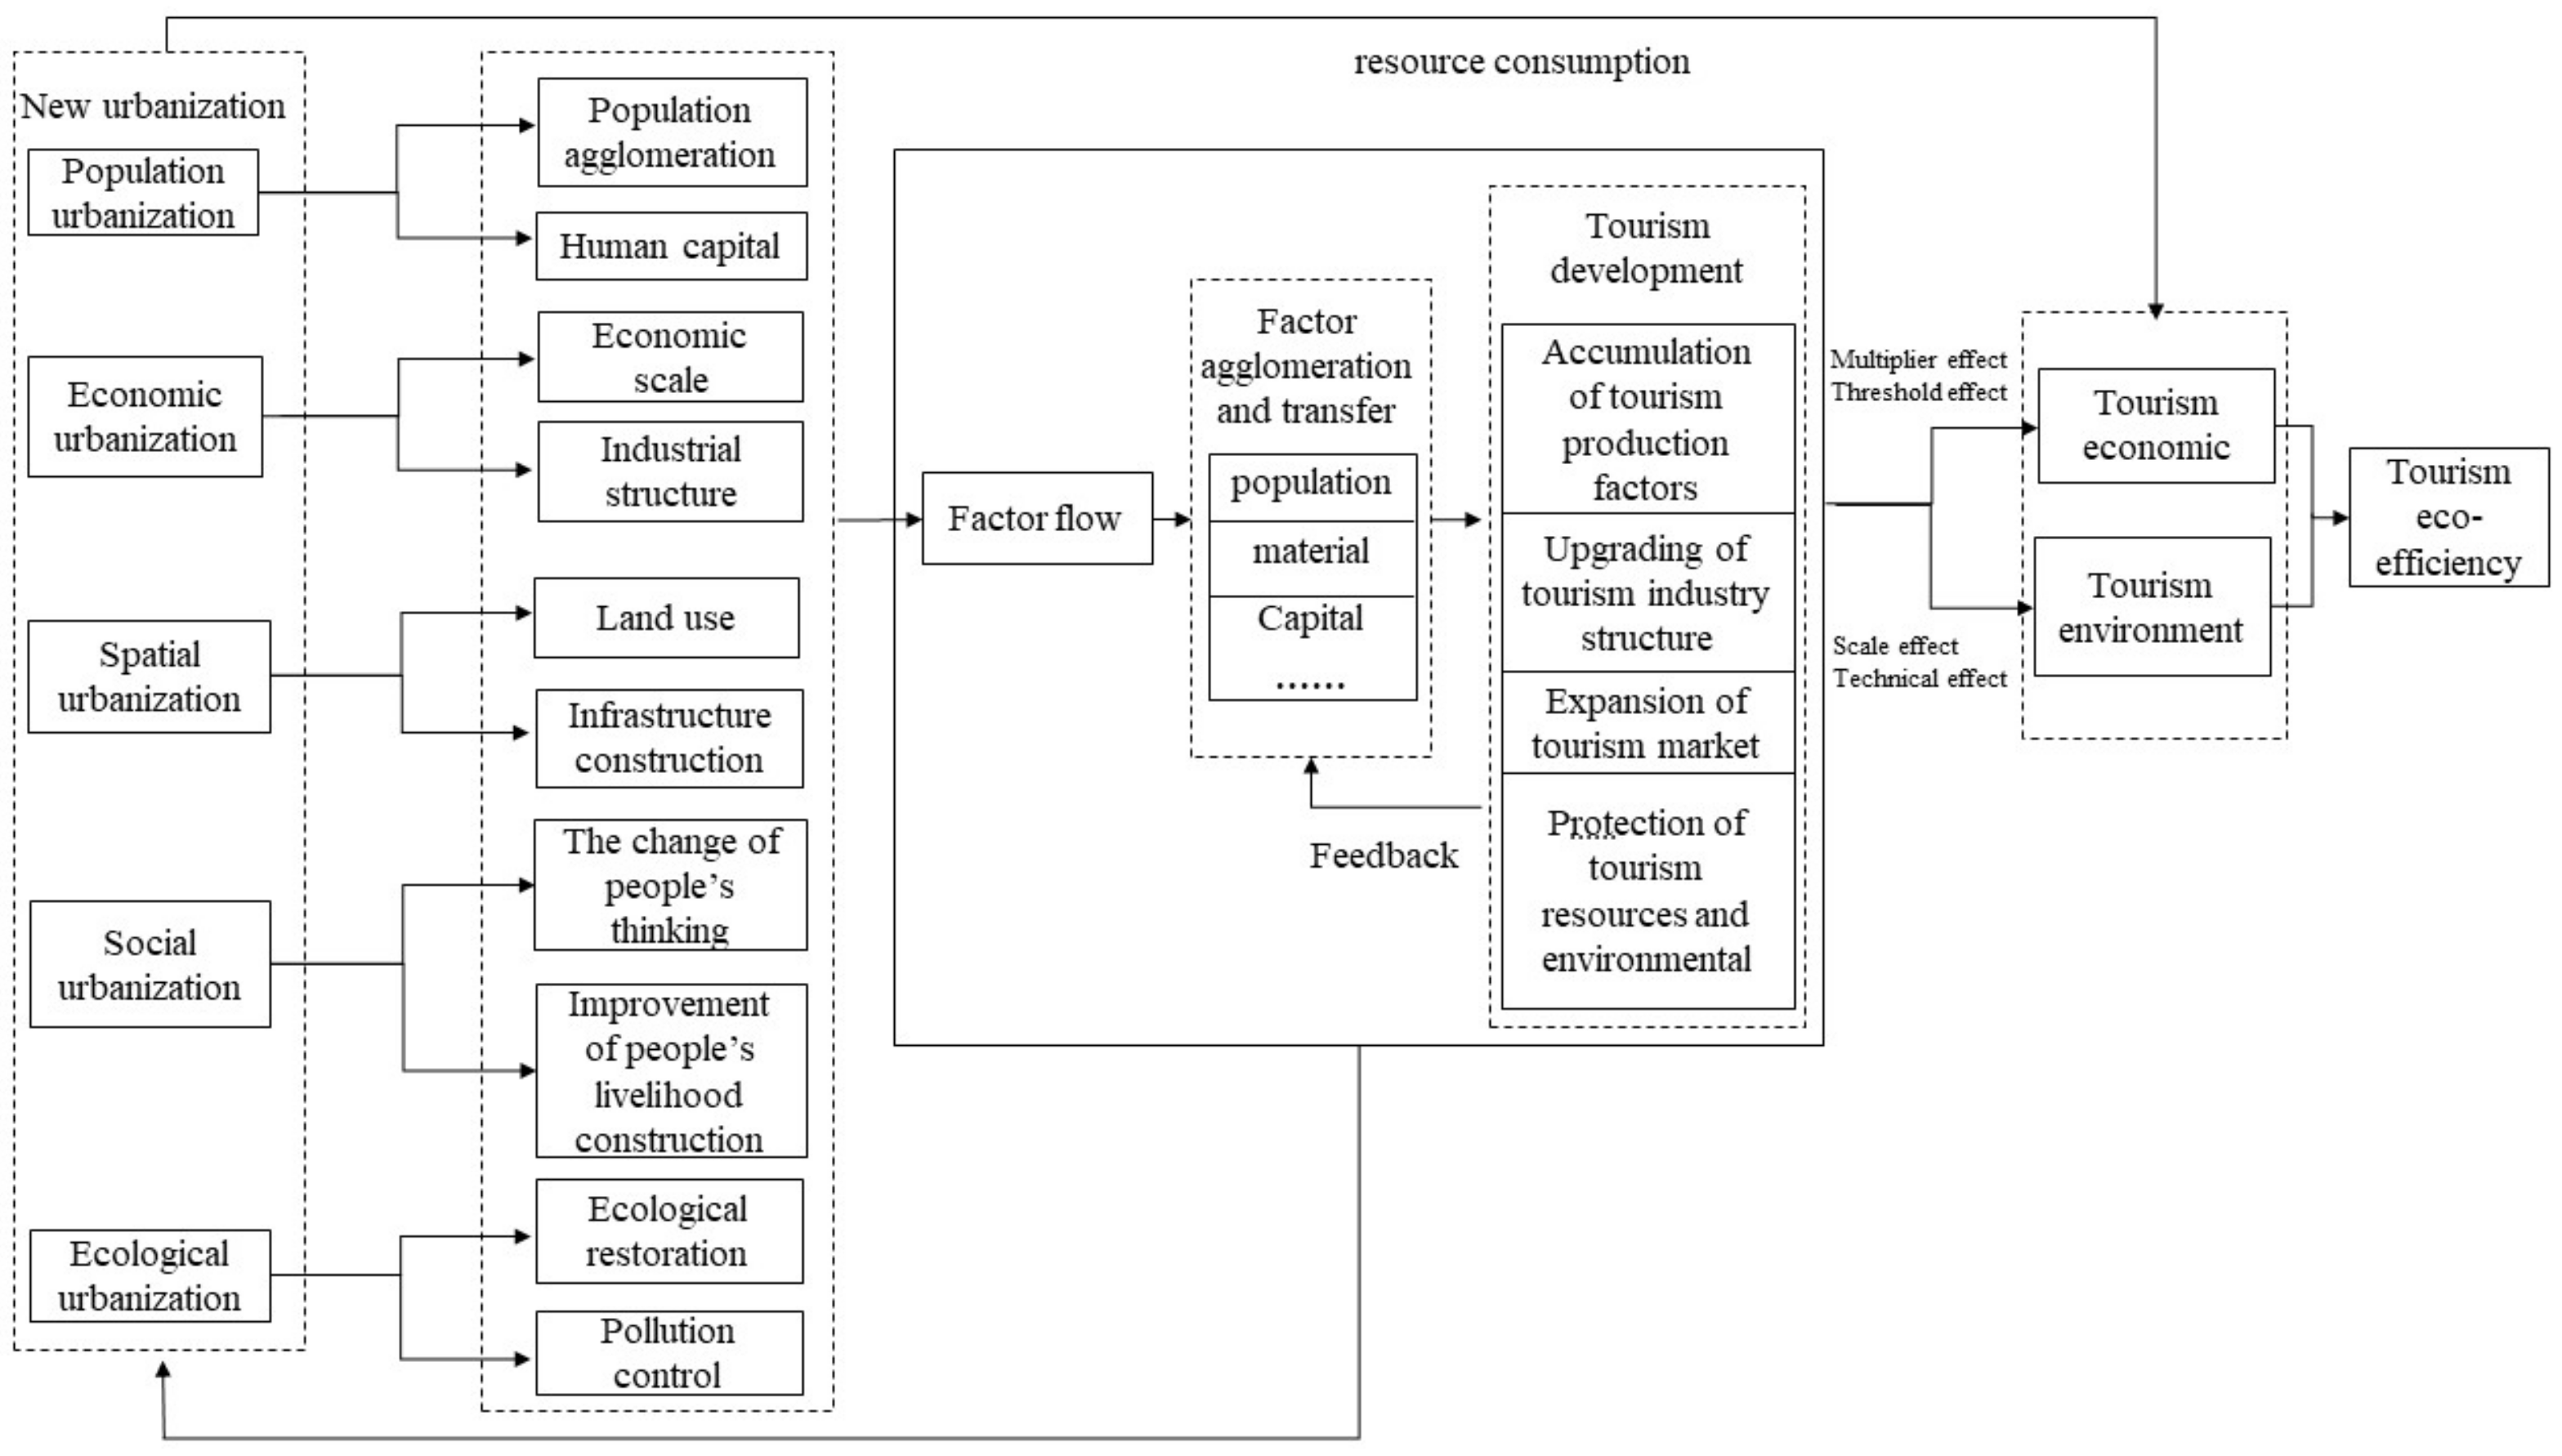
Figure 1. Impact mechanism of urbanization on tourism eco-efficiency.
Sustainability 14 10820 g001
Figure 2. Average value of tourism eco-efficiency.
Sustainability 14 10820 g002
Figure 3. CV and Moran’s I of tourism eco-efficiency.
Sustainability 14 10820 g003
Figure 4. Trajectory of tourism eco-efficiency gravity center.
Sustainability 14 10820 g004
Figure 5. Spatial pattern evolution of cold and hot spots of tourism eco–efficiency. Note: It is drawn based on the standard map of the State Bureau of surveying, mapping and geographic information (No.GS (2020) 4619), and the base map is not modified.
Sustainability 14 10820 g005
Figure 6. Comprehensive development level of new urbanization.
Sustainability 14 10820 g006
Figure 7. Average level of comprehensive development of new urbanization.
Sustainability 14 10820 g007
Figure 8. Interactive response of tourism eco–efficiency and new urbanization in China.
Sustainability 14 10820 g008
Figure 9. Interactive response of tourism eco-efficiency and new urbanization in Eastern China.
Sustainability 14 10820 g009
Table 1. Input–output index system of tourism eco-efficiency.
Measurement TargetIndicator TypeIndicator NamePrimaryMain Data Sources
Tourism eco-efficiency (TE)Input indicatorsLabor inputNumber of people employed in tourismChina Tourism Statistical Yearbook, China Tourism Yearbook
Capital inputTourism fixed asset investmentChina Statistical Yearbook
Energy inputTotal tourism energy consumptionChina Statistical Yearbook, China Tertiary Industry Statistical Yearbook
Desirable output indicatorTotal tourism economyTotal tourism revenueChina Tourism Statistical Yearbook China Tourism Yearbook, provincial Statistical Yearbook
Undesirable output indicatorTourism environmental pollutionTourism CO2 emissionsChina Tourism Statistical Yearbook China Tourism Yearbook, Tourism Sample Survey Data, China Traffic Statistical Yearbook, provincial Statistical Yearbook
Table 2. Comprehensive evaluation index system of new urbanization level.
Target LayerRule LayerIndex LayerAttributeWeightMain Data Sources
Comprehensive development level of new urbanization (NU)Population urbanizationProportion of urban population in total permanent population+0.0231China Statistical Yearbook, China Tertiary Industry Statistical Yearbook, provincial Statistical Yearbook
Proportion of employed persons in tertiary industry+0.0521
Registered urban unemployment rate0.0607
Economic urbanizationGDP per capita+0.0748
Proportion of total output value of secondary and tertiary industries in GDP+0.0189
Local fiscal revenue per capita+0.1443
Living expenditure of urban residents per capita+0.1059
Spatial urbanizationUrban population density+0.0521
Built-up urban area+0.0620
Road area per capita+0.0251
Social urbanizationWater penetration rate+0.0473
Gas penetration rate+0.0241
Beds in medical institutions+0.0569
Number of internet access ports+0.0711
Proportion of education expenditure in government expenditure+0.0351
Ecological urbanizationAfforestation coverage rate of built-up area+0.0413
Park green space area per capita+0.0342
Harmless treatment rate of household garbage+0.0276
Comprehensive utilization rate of industrial solid waste+0.0432
Table 3. Value of tourism eco-efficiency.
Region2006 201020142019AverageRegion2006 201020142019Average
Beijing1.02951.07081.15131.19451.1143Henan0.75170.54950.51540.47220.6036
Tianjin1.38161.24321.13001.48801.2331Hubei0.48540.45580.44630.45190.4654
Hebei0.55650.46050.42310.50510.4940Hunan0.47510.45580.40220.47860.4703
Shanxi1.03180.42030.56571.12020.7487Guangdong1.08110.63510.70390.66050.7467
Inner Mongolia0.46220.56371.15421.03010.8284Guangxi0.47110.35190.34690.43790.3988
Liaoning0.46900.39710.39081.08290.6865Hainan0.42530.31120.29010.36970.3220
Jilin0.67770.62551.02151.00210.8667Chongqing0.52840.39470.39820.52310.4361
Heilongjiang0.63570.63610.51770.41380.6008Sichuan0.48310.40710.43480.43130.4369
Shanghai1.01711.14671.14341.09021.1021Guizhou0.48330.59740.47450.47330.5429
Jiangsu1.09771.16431.04581.09781.1077Yunnan0.40310.32510.32690.32890.3693
Zhejiang0.66800.78900.59240.65090.6784Shaanxi0.42390.36660.34100.38070.3745
Anhui0.58020.53100.40220.58380.5051Gansu0.53040.38810.32390.41810.4122
Fujian1.13570.58350.43950.53750.6292Qinghai0.54000.41890.47010.26640.5601
Jiangxi0.43460.47030.42250.54100.5048Ningxia0.35250.45700.45090.63400.4644
Shandong0.56530.49220.58880.50940.5309Xinjiang0.38270.37000.35020.48230.3878
Table 4. Division of China’s economic regions.
RegionProvinces and Cities
Northeast ChinaLiaoning, Jilin, Heilongjiang
Eastern ChinaBeijing, Tianjin, Hebei, Shanghai, Jiangsu, Zhejiang, Fujian, Shandong, Guangdong, Hainan
Central ChinaShanxi, Anhui, Jiangxi, Henan, Hubei, Hunan
Western ChinaInner Mongolia, Guangxi, Chongqing, Sichuan, Guizhou, Yunnan, Shaanxi, Gansu, Qinghai, Ningxia, Xinjiang
Table 5. Granger causality test.
NationwideEastern RegionCentral RegionWestern Region
Chi-sqp-ValueChi-sqp-ValueChi-sqp-ValueChi-sqp-Value
Equation lnTE/Excluded lnNU6.30300.04312.1740.0020.610110.4352.94760.229
Equation lnNU/Excluded lnTE3.57510.1670.351240.8390.089710.7653.99810.136
Table 6. Variance decomposition of tourism eco-efficiency.
NationwideEastern Region
PeriodlnTElnNUlnTElnNU
110001000
297.62.490.19.9
396.53.583.316.7
495.44.678.121.9
594.75.374.325.7
1092.97.166.733.3
1592.67.465.334.7
2092.67.465.035.0
2592.67.464.9 35.1
Table 7. OLS regression coefficient of internal structure of new urbanization.
Dimension20062019Factors20062019
CoefficientCoefficientCoefficientVIFCoefficientVIF
Population urbanization0.199565 *0.225851 *Proportion of urban population in total permanent population0.1114 *76.25810.1227 *37.9070
Proportion of employed persons in tertiary industry0.0424 *8.78320.0467 *7.5526
Registered urban unemployment rate0.0956 *4.69550.1053 *2.3221
Economic urbanization0.603064 *0.673458 *GDP per capita0.1373 *76.25810.1512 *18.8918
Proportion of total output value of secondary and tertiary industries in GDP0.0347 *7.84920.0382 *2.6713
Local fiscal revenue per capita0.2647 *50.85410.2914 *25.4607
Living expenditure of urban residents per capita0.1943 *21.92050.2140 *25.8037
Spatial urbanization0.124309 *0.179521 *Urban population density0.0956 *2.16980.1052 *1.9793
Built-up urban area0.1138 *40.16800.1253 *19.5404
Road area per capita0.0460 *8.164030.0507 *5.4727
Social urbanization0.275655 *0.345117 *Water penetration rate0.0869 *10.18590.0956 *4.7905
Gas penetration rate0.0442 *13.18100.0487 *2.8137
Beds in medical institutions0.1044 *20.39010.1150 *11.2501
Number of internet access ports0.1304 *40.82990.1436 *22.1668
Proportion of government’s education expenditure 0.0644 *3.61430.0709 *9.9185
Ecological urbanization0.197794 *0.154883 *Afforestation coverage rate of built-up area0.0758 *7.61950.0835 *8.5107
Park green space area per capita0.0628 *7.68640.0691 *3.8030
Harmless treatment rate of household garbage0.0506 *2.83570.0557 *4.9206
Comprehensive utilization rate of industrial solid waste0.0793 *8.77080.0874 *6.9126
Note: * indicates a statistically significant p-value (p < 0.01).
Table 8. GWR regression coefficient of internal key influencing factors of new urbanization.
Key FactorsNortheast ChinaEastern RegionCentral RegionWestern Region
20062019200620192006201920062019
Registered urban unemployment rate0.4045 *−0.0108 *0.5604 *−0.0108 *0.6065 *−0.0108 *0.7187 *−0.0108 *
Proportion of total output value of secondary and tertiary industries in GDP--0.2883 *--0.2887 *--0.2888 *--0.2888 *
Urban population density−0.0745 *−0.0667 *−0.1655 *−0.0667 *−0.1568*−0.0667 *−0.1061 *−0.0668 *
Road area per capita--−0.4044 *--−0.4042 *--−0.4042 *--−0.4042 *
Water penetration rate--0.4800 *--0.4799 *--0.4798 *--0.4798 *
Gas penetration rate--0.382587 *--0.382845 *--0.3829 *--0.3830 *
Proportion of government’s education expenditure −0.1582 *--−0.2321 *--−0.2080 * −0.0939 *--
Park green space area per capita--0.4332 *--0.4331 * 0.4331 *--0.4330 *
Harmless treatment rate of household garbage0.5737 *0.2542 *0.4856 *0.2542 *0.4414 *0.2542 *0.2819 *0.2543 *
Comprehensive utilization rate of industrial solid waste --0.0056 *--0.0055 *--0.0054 *--0.0053 *
Average0.1864 *0.1716 *0.1621 *0.1717 *0.1708 *0.1717 *0.2001 *0.1717 *
Note: * indicates a statistically significant p-value (p < 0.01).
Publisher’s Note: MDPI stays neutral with regard to jurisdictional claims in published maps and institutional affiliations.