
Temporal and Spatial Evolution of the Science and Technology Innovative Efficiency of Regional Industrial Enterprises: A Data-Driven Perspective


Abstract
:1. Introduction
2. Method
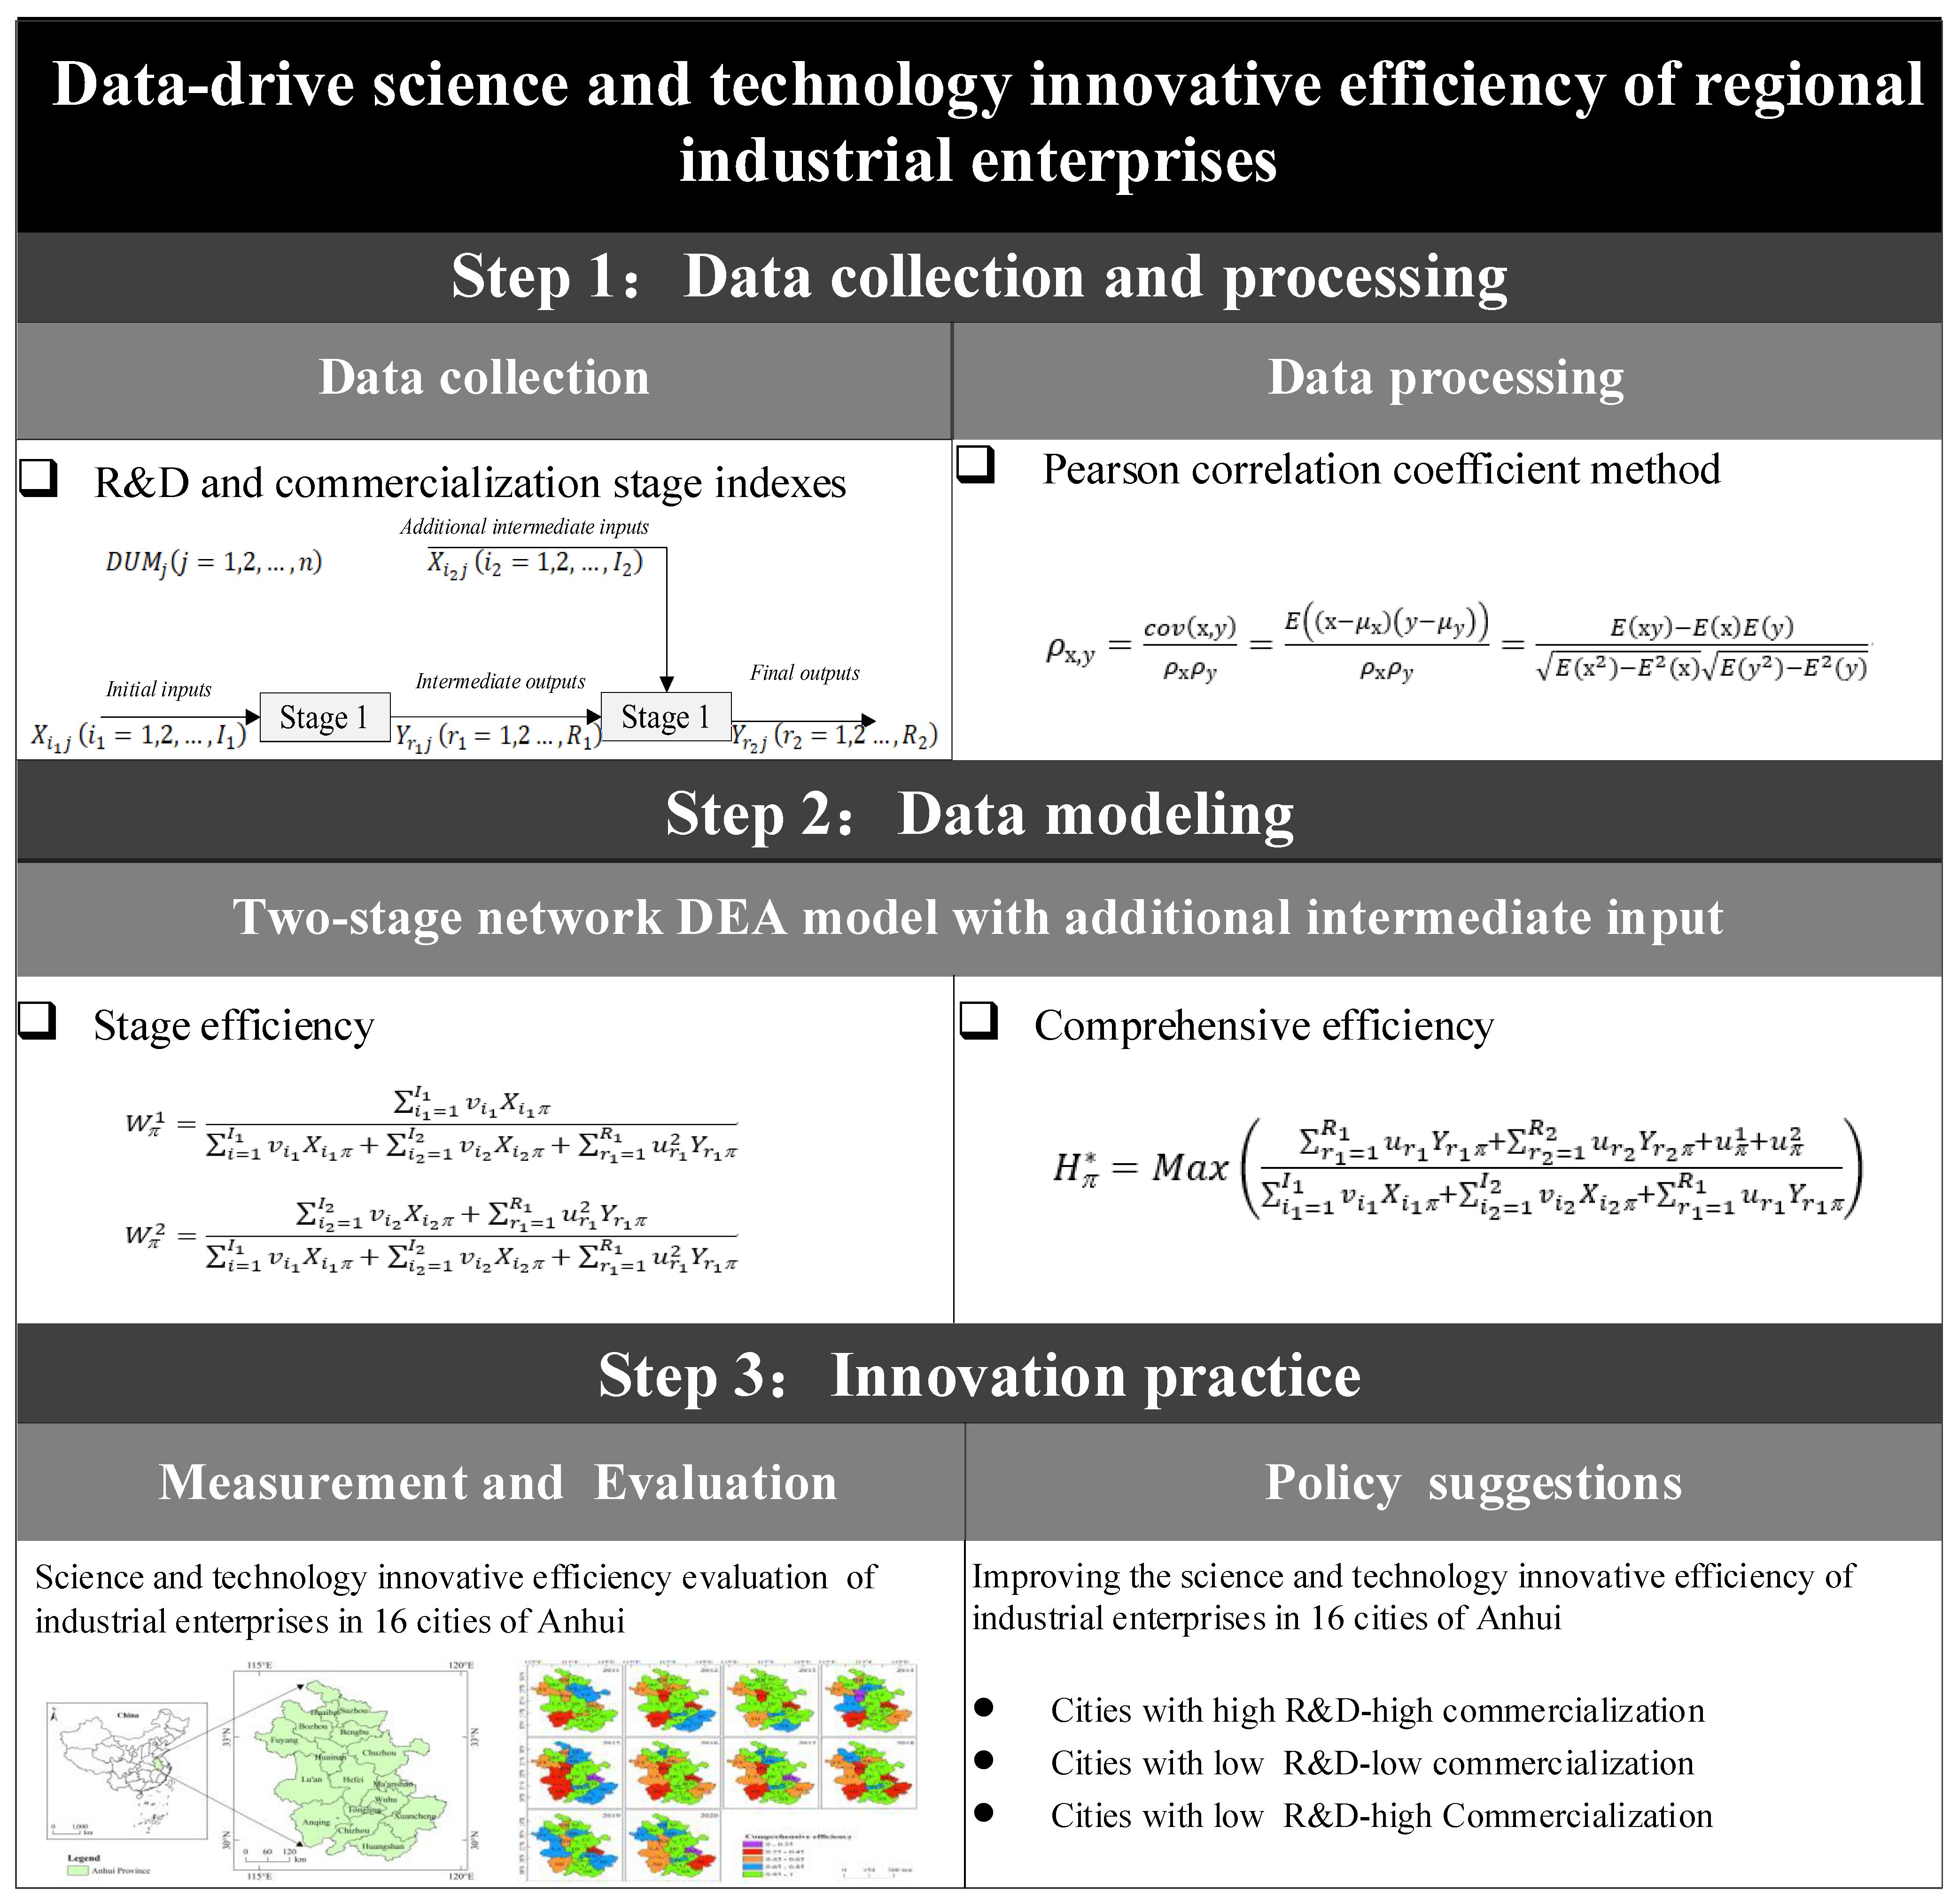
2.1. Method Flow
2.2. Data Collection and Processing
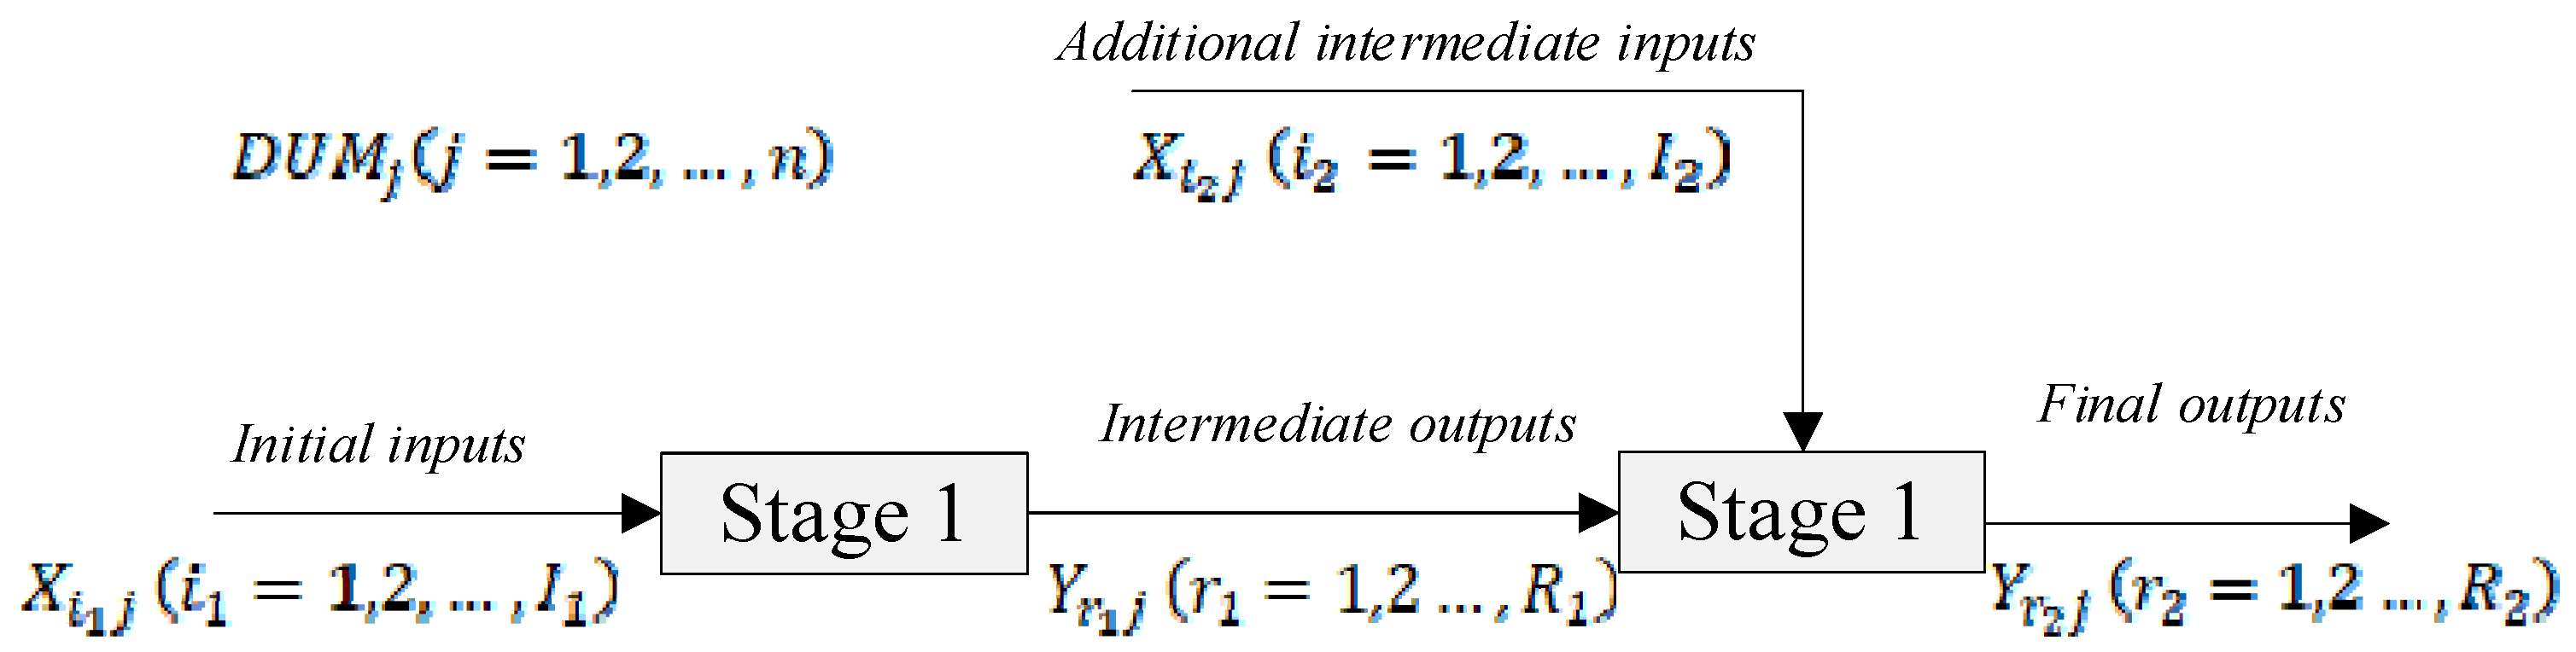
2.3. Data Modeling
3. Case Study
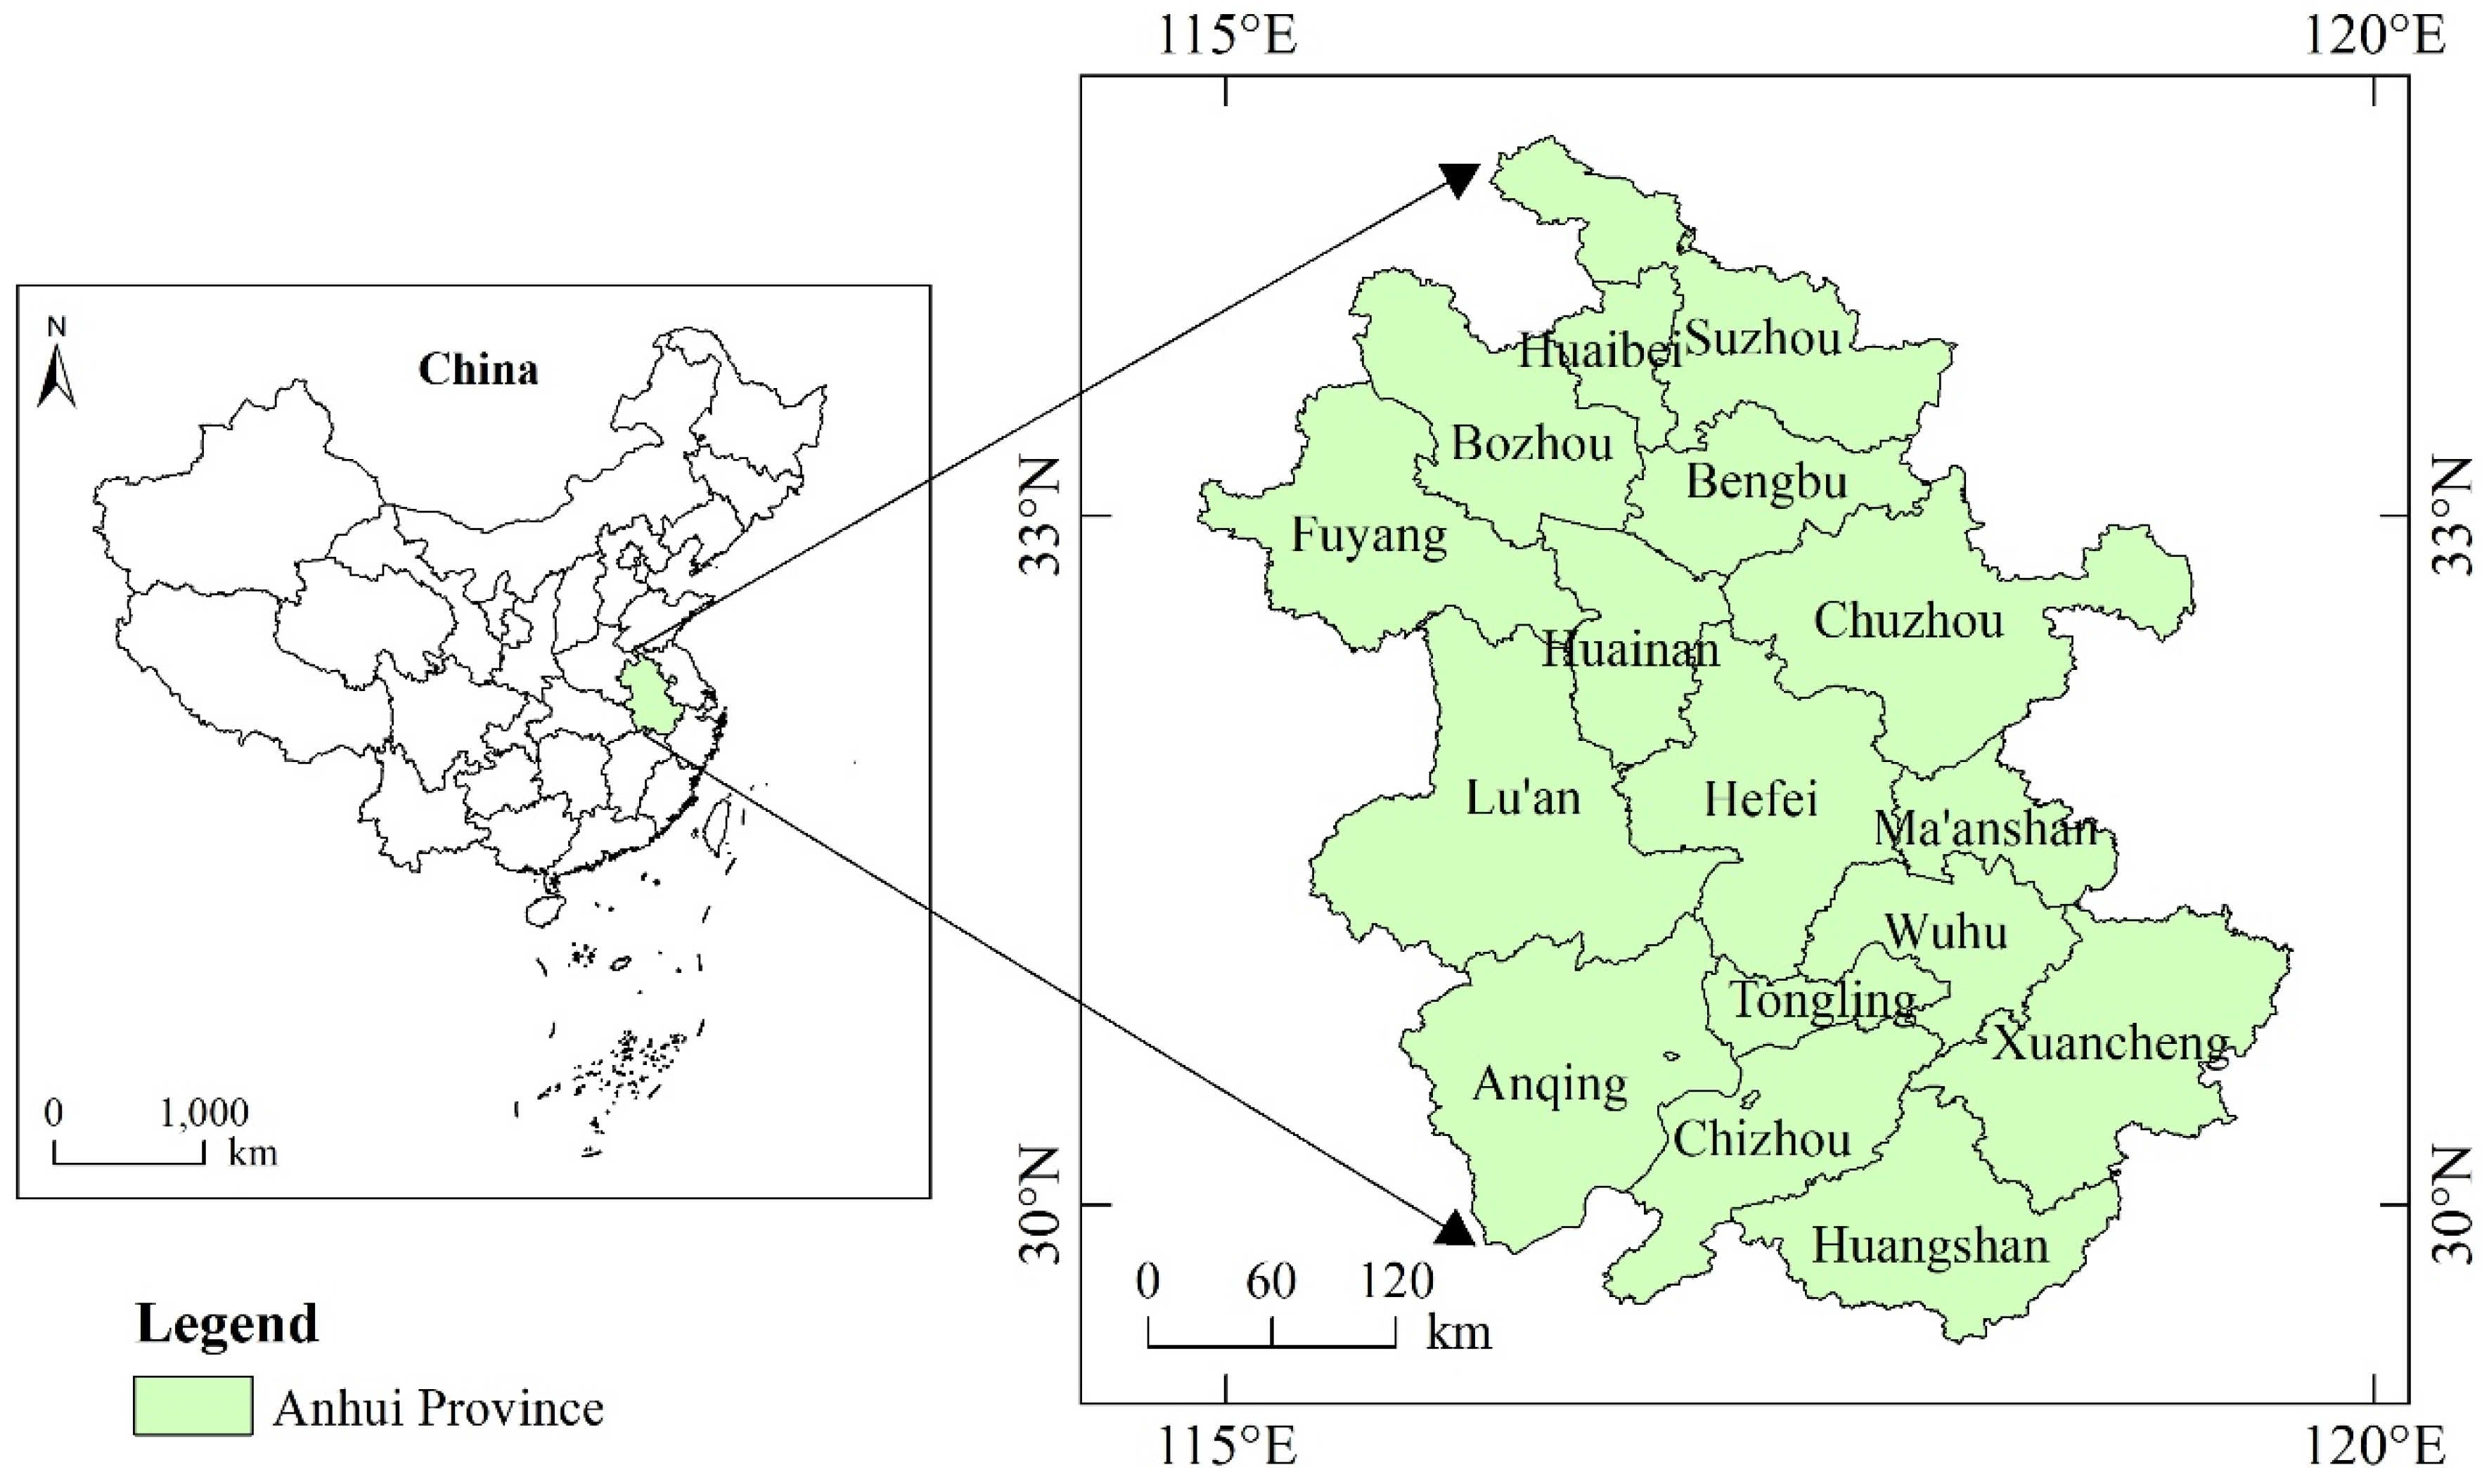
3.1. Background
3.2. Results
3.2.1. Data Acquisition and Processing Results
3.2.2. Two-Stage Network DEA Measurement Results
3.3. Results Analysis
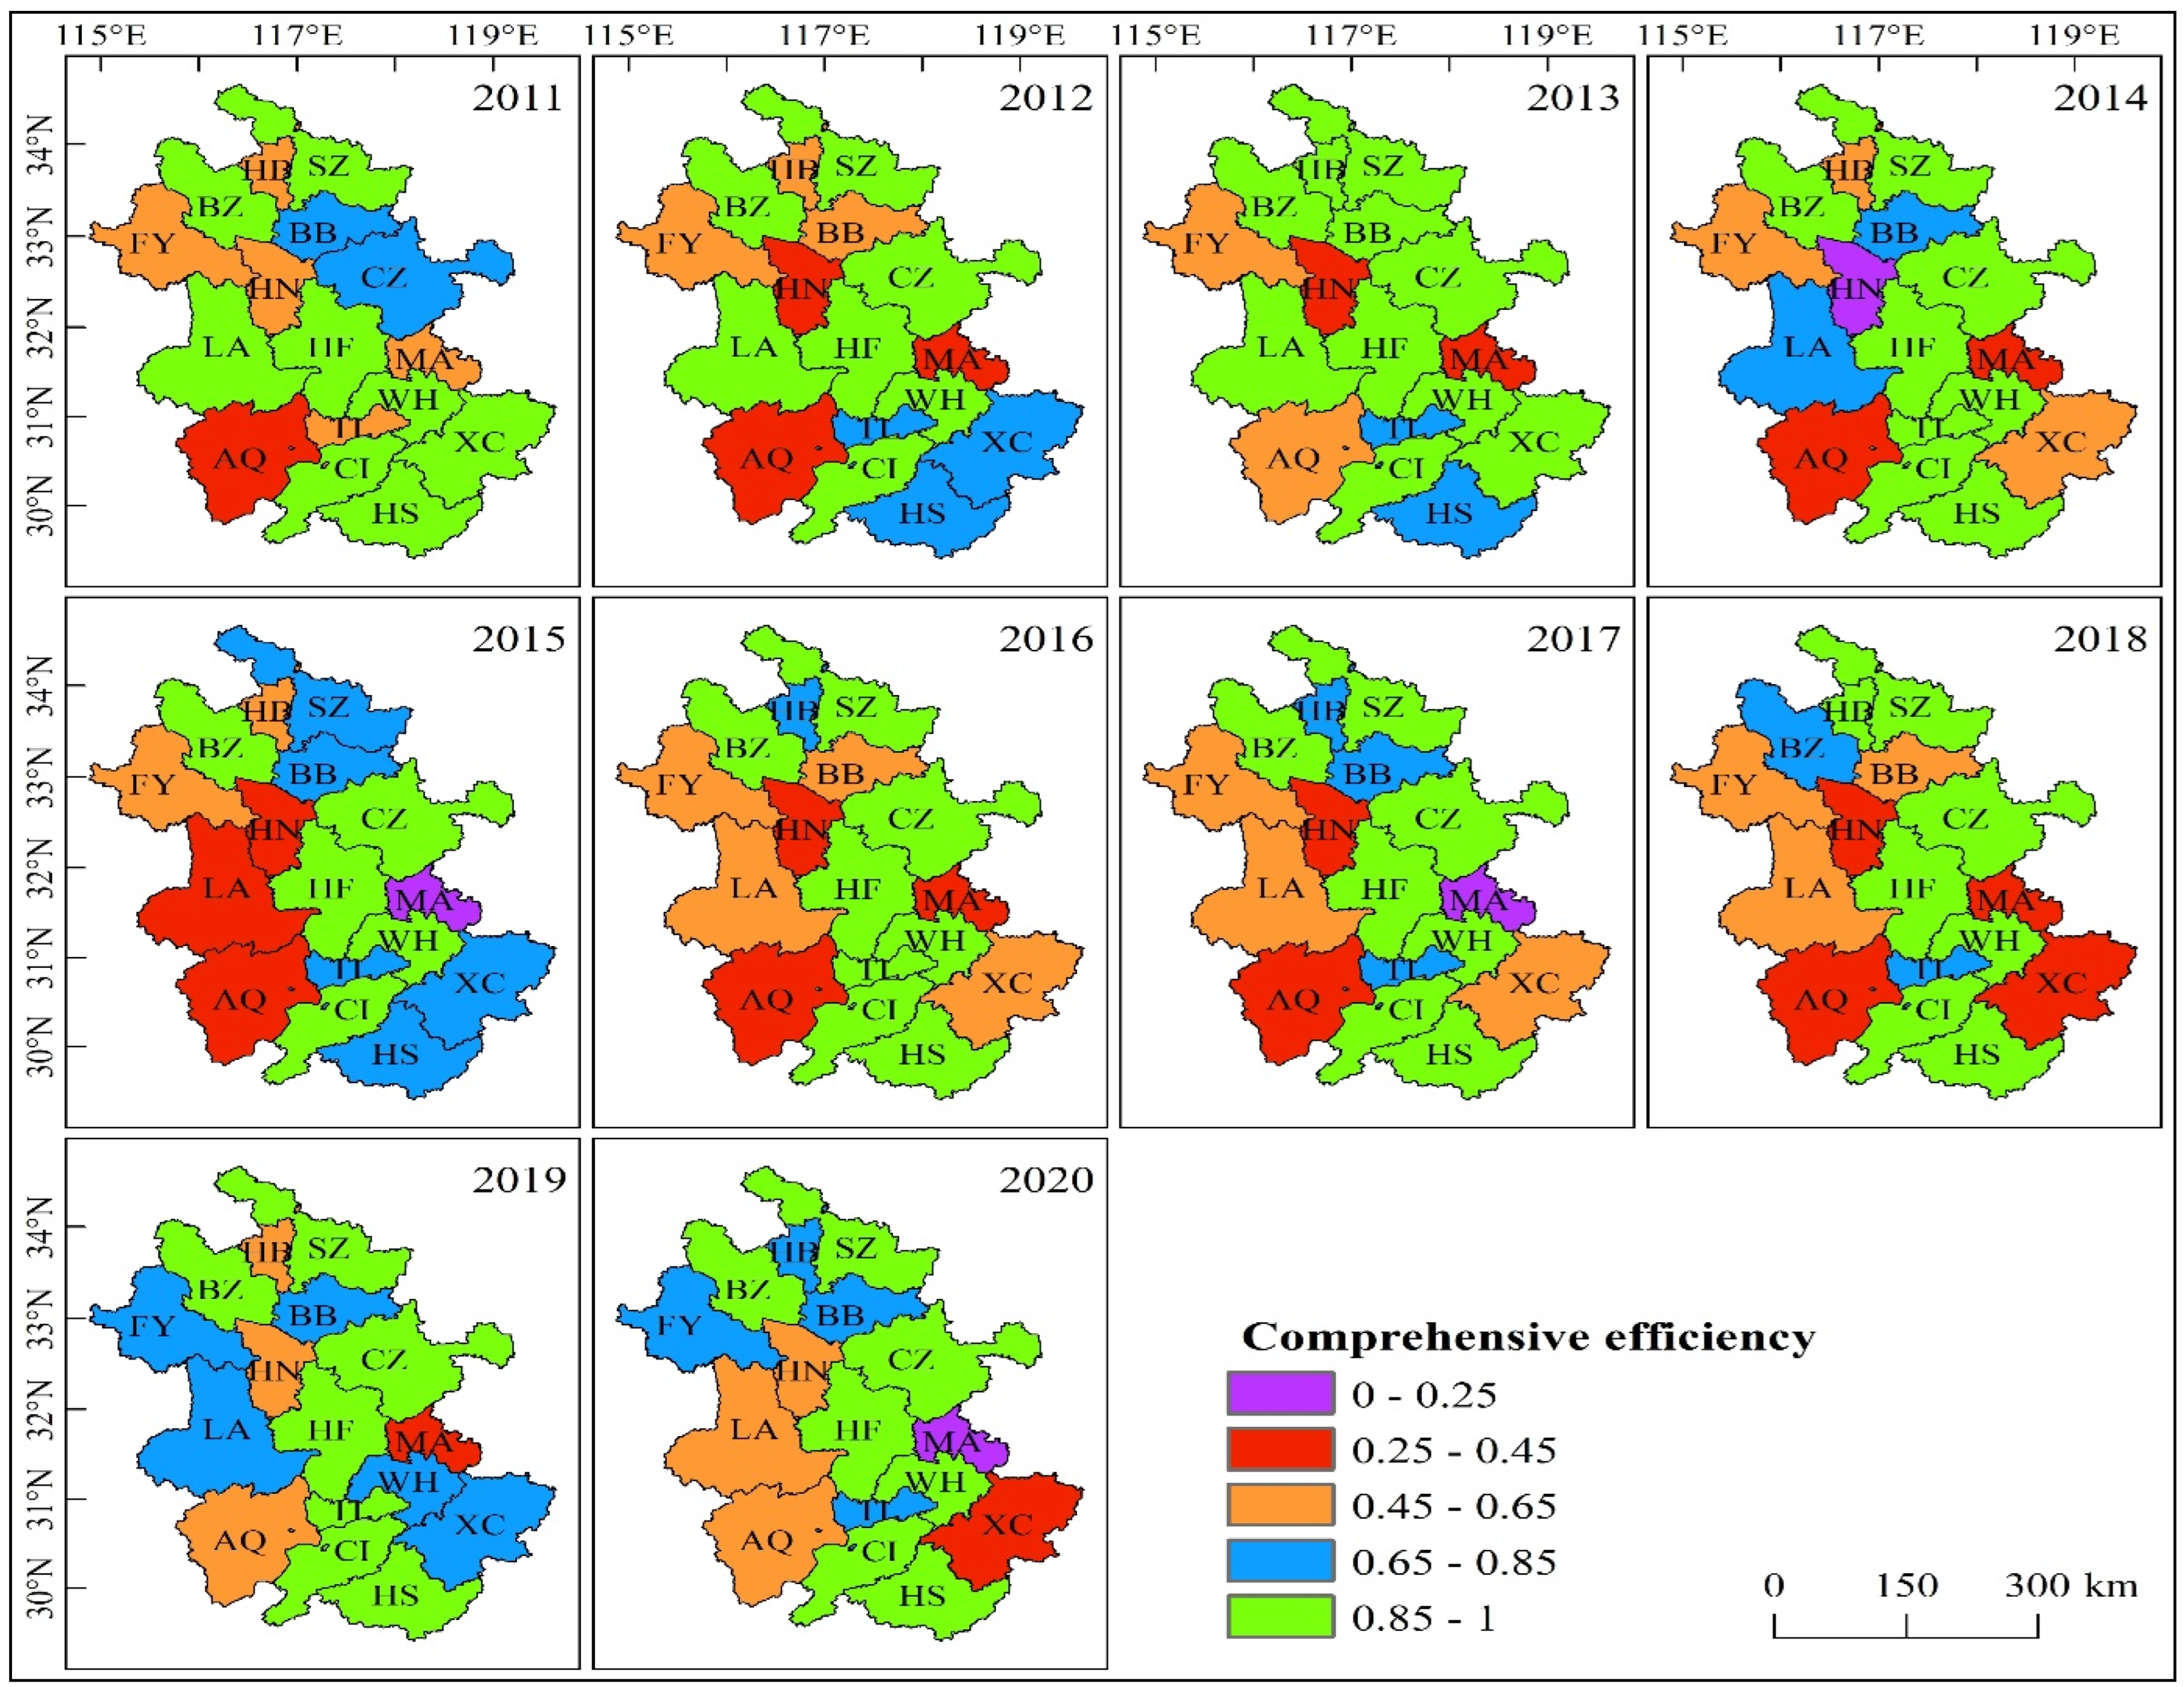
3.3.1. Analysis of Temporal and Spatial Evolution
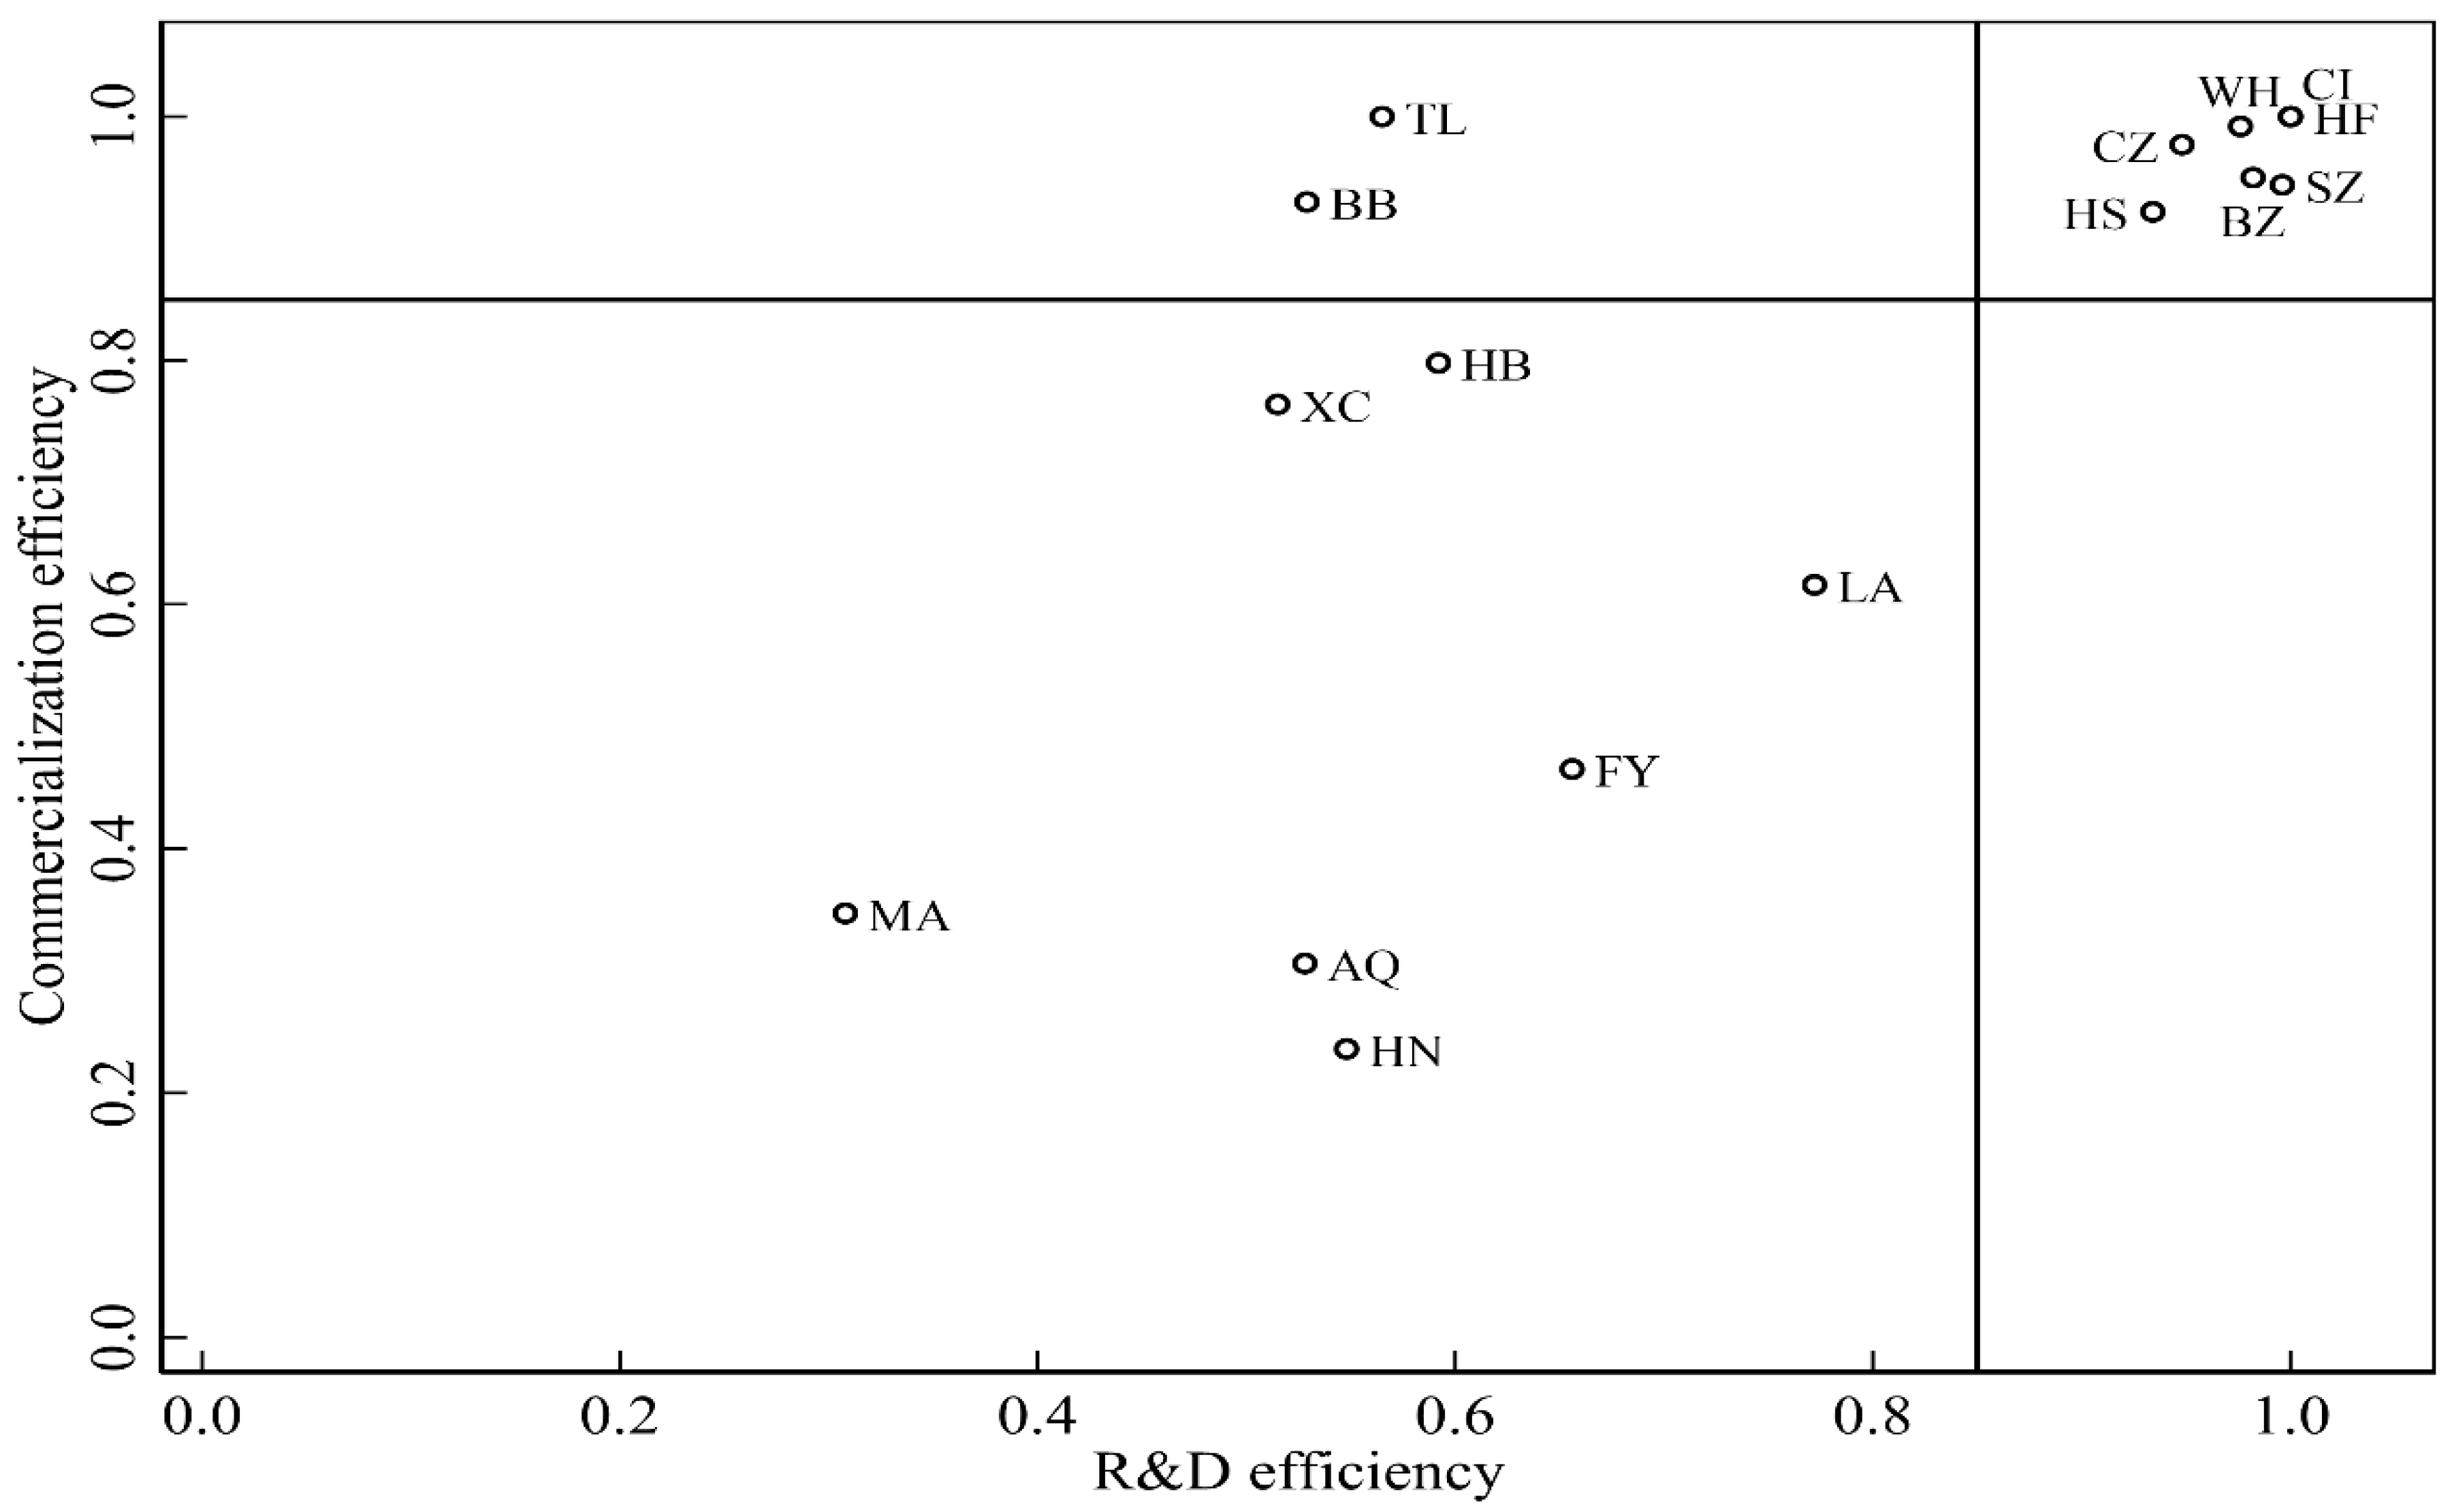
3.3.2. Two-Dimensional Distribution Analysis
3.4. Policy Suggestions
3.4.1. Cities with High R&D–High Commercialization
3.4.2. Cities with Low R&D–Low Commercialization
3.4.3. Cities with Low R&D–High Commercialization
3.5. Discussion and Managerial Implications
4. Conclusions
Author Contributions
Funding
Institutional Review Board Statement
Informed Consent Statement
Data Availability Statement
Acknowledgments
Conflicts of Interest
References
- Liu, C.; Cai, W.; Zhai, M.; Zhu, G.; Zhang, C.; Jiang, Z. Decoupling of wastewater eco-environmental damage and China’s economic development. Sci. Total Environ. 2021, 789, 147980. [Google Scholar] [CrossRef] [PubMed]
- Yang, Y.; Wang, Y.; Zhang, Y.; Liu, C. Data-driven coupling coordination development of regional innovation EROB composite system: An integrated model perspective. Mathematics 2022, 10, 2246. [Google Scholar] [CrossRef]
- Liu, C.; Gao, M.; Zhu, G.; Zhang, C.; Zhang, P.; Chen, J.; Cai, W. Data driven eco-efficiency evaluation and optimization in industrial production. Energy 2021, 224, 120170. [Google Scholar] [CrossRef]
- Potashnik, Y.S.; Artemyeva, M.V.; Kuznetsova, S.N.; Garin, A.P.; Letyagina, E.N. The status and trends in innovative activity of industrial enterprises of Nizhny Novgorod Region. In Growth Poles of the Global Economy: Emergence, Changes and Future Perspectives. Lecture Notes in Networks and Systems; Popkova, E., Ed.; Springer: Cham, Switzerland, 2020; Volume 73, pp. 525–534. [Google Scholar]
- Marhasova, V.; Garafonova, O.; Popelo, O.; Tulchynska, S.; Pohrebniak, A.; Tkachenko, T. Environmentalization of Production as a direction of ensuring the sustainability of production activities of enterprises and increasing their economic security. Int. J. Safe. Secur. Eng. 2022, 12, 159–166. [Google Scholar] [CrossRef]
- Liu, C.; Chen, J.; Cai, W. Data-driven remanufacturability evaluation method of waste parts. IEEE Trans. Indust Inform. 2022, 18, 4587–4595. [Google Scholar] [CrossRef]
- Xu, L.; Zhao, X.; Chen, J. Exploring the governance dilemma of nuclear wastewater in Fukushima: A tripartite evolutionary game model. Ocean. Coast. Manag. 2022, 225, 106220. [Google Scholar] [CrossRef]
- Geng, Y.; Sarkis, J.; Bleischwitz, R. How to globalize the circular economy. Nature 2019, 565, 153–155. [Google Scholar] [CrossRef]
- Ma, T.; Liu, C. Identification of driving factors of scientific and technological innovation in the new material industry based on the theory of complex adaptive system: Taking the construction of green innovation system as an example. Complexity 2021, 2021, 5537789. [Google Scholar] [CrossRef]
- Tang, Y.; Chen, Y.; Wang, K.; Xu, H.; Yi, X. An analysis on the spatial effect of absorptive capacity on regional innovation ability based on empirical research in China. Sustainability 2020, 12, 3021. [Google Scholar] [CrossRef]
- Wang, Y. How is innovation performance under the restriction of industry cluster: Evidence from a survey on high-tech firms. Converter 2021, 2021, 11–20. [Google Scholar] [CrossRef]
- Alvarez-Aros, E.L.; Bernal-Torres, C.A. Technological competitiveness and emerging technologies in Industry 4.0 and Industry 5.0. An. Acad Bras. Ciênc 2021, 93. [Google Scholar] [CrossRef] [PubMed]
- Akundi, A.; Euresti, D.; Luna, S.; Ankobiah, W.; Lopes, A.; Edinbarough, I. State of Industry 5.0—Analysis and identification of current research trends. Appl. Syst. Innov. 2022, 5, 27. [Google Scholar] [CrossRef]
- Wanke, P.; Tan, Y.; Antunes, J.; Hadi-Vencheh, A. Business environment drivers and technical efficiency in the Chinese energy industry: A robust Bayesian stochastic frontier analysis. Comput. Ind. Eng. 2020, 144, 106487. [Google Scholar] [CrossRef]
- Gu, W.; Saaty, T.L.; Wei, L. Evaluating and optimizing technological innovation efficiency of industrial enterprises based on both data and judgments. Int. J. Inf. Technol. Decis Mak. 2018, 17, 9–43. [Google Scholar] [CrossRef]
- Bezin, E. The economics of green consumption, cultural transmission and sustainable technological change. J. Econ. Theory 2019, 181, 497–546. [Google Scholar] [CrossRef]
- Ziyuan, X.; Lijuan, W. Industrial agglomeration level and innovation efficiency of industrial enterprises—an empirical study based on the panel data of 20 industries from the year 2000 to 2012. Sci. Res. Manag. 2017, 38, 91. [Google Scholar]
- Nizar, B.; Rejean, L.; Asmara, N. Lessons from innovation empirical studies in the manufacturing sector a systematic review of the literature from 1993-2003. Technovation 2006, 26, 64–78. [Google Scholar]
- Grigoryevich, C.A. Methodological approach to determination of innovations efficiency at industrial enterprises. Russ. J. Educ. Psychol. 2013, 7, 55. [Google Scholar]
- Zhang, J.; Kang, L.; Li, H.; Ballesteros-Pérez, P.; Skitmore, M.; Zuo, J. The impact of environmental regulations on urban green innovation efficiency: The case of Xi’an. Sustain. Cities Soc. 2020, 57, 102123. [Google Scholar] [CrossRef]
- Bartlett, D.; Trifilova, A. Green technology and eco-innovation: Seven case-studies from a Russian manufacturing context. J. Manuf. Technol. Manag. 2010, 21, 910–929. [Google Scholar] [CrossRef]
- Meltzer, J. A carbon tax as a driver of green technology innovation and the implications for international trade. Energy LJ 2014, 35, 45. [Google Scholar]
- Shi, H.; Shen, C. Tax competition, capital flow, and the innovation efficiency of industrial enterprises. Sustainability 2022, 14, 4645. [Google Scholar] [CrossRef]
- Costantini, V.; Crespi, F.; Palma, A. Characterizing the policy mix and its impact on eco-innovation: A patent analysis of energy-efficient technologies. Res. Policy 2017, 46, 799–819. [Google Scholar] [CrossRef]
- Yang, Y.; Wang, Y. Research on the impact of environmental regulations on the green innovation efficiency of Chinese industrial enterprises. Pol. J. Environ. Stud. 2021, 30, 1433–1445. [Google Scholar] [CrossRef]
- Lian, G.; Xu, A.; Zhu, Y. Substantive green innovation or symbolic green innovation? The impact of ER on enterprise green innovation based on the dual moderating effects. J. Innov. Knowl. 2022, 7, 100203. [Google Scholar] [CrossRef]
- Jin, W.; Zhang, H.Q.; Liu, S.; Zhang, H.B. Technological innovation, environmental regulation, and green total factor efficiency of industrial water resources. J. Clean. Prod. 2019, 211, 61–69. [Google Scholar] [CrossRef]
- Zhu, Y.; Wang, Z.; Qiu, S.; Zhu, L. Effects of environmental regulations on technological innovation efficiency in China’s industrial enterprises: A spatial analysis. Sustainability 2019, 11, 2186. [Google Scholar] [CrossRef]
- Tang, K.; Qiu, Y.; Zhou, D. Does command-and-control regulation promote green innovation performance? Evidence from China’s industrial enterprises. Sci. Total Environ. 2020, 712, 136362. [Google Scholar] [CrossRef]
- Zhang, H.; Shao, Y.; Han, X.; Chang, H.L. A road towards ecological development in China: The nexus between green investment, natural resources, green technology innovation, and economic growth. Resour. Policy 2022, 77, 102746. [Google Scholar] [CrossRef]
- Shinkevich, A.I.; Ershova, I.G.; Galimulina, F.F.; Yarlychenko, A.A. Innovative Mesosystems Algorithm for Sustainable Development Priority Areas Identification in Industry Based on Decision Trees Construction. Mathematics 2021, 9, 3055. [Google Scholar] [CrossRef]
- Amore, M.D.; Bennedsen, M. Corporate governance and green innovation. J. Environ. Econ. Manag. 2016, 75, 54–72. [Google Scholar] [CrossRef]
- Hou, B.; Hong, J.; Wang, H.; Zhou, C. Academia-industry collaboration, government funding and innovation efficiency in Chinese industrial enterprises. Technol Anal. Strateg Manag. 2019, 31, 692–706. [Google Scholar] [CrossRef]
- Miao, C.; Meng, X.; Duan, M.; Wu, X.Y. Energy consumption, environmental pollution, and technological innovation efficiency: Taking industrial enterprises in China as empirical analysis object. Environ. Sci. Pollut. Res. 2020, 27, 34147–34157. [Google Scholar] [CrossRef] [PubMed]
- Yang, Y.; Wu, X.; Liu, F.; Zhang, Y.; Liu, C. Promoting the efficiency of scientific and technological innovation in regional industrial enterprises: Data-driven DEA-Malmquist evaluation model. J. Intell Fuzzy Syst. 2022, 43, 4911–4928. [Google Scholar] [CrossRef]
- Chen, H.; Lin, H.; Zou, W. Research on the regional differences and influencing factors of the innovation efficiency of China’s high-tech industries: Based on a shared inputs two-stage network DEA. Sustainability 2020, 12, 3284. [Google Scholar] [CrossRef]
- Asheim, B.T.; Isaksen, A. Regional innovation systems: The integration of local ‘sticky’ and global ‘ubiquitous’ knowledge. J. Technol. Transf. 2002, 27, 77–86. [Google Scholar] [CrossRef]
- Luo, Q. Research on the dynamic evolution of scientific and technological innovation efficiency in universities and identification of influencing factors—based on Markov chain estimation and GMM model. Math. Probl. Eng. 2021, 2021, 9831124. [Google Scholar] [CrossRef]
- Guan, J.; Chen, K. Measuring the innovation production process: A cross-region empirical study of China’s high-tech innovations. Technovation 2010, 30, 348–358. [Google Scholar] [CrossRef]
- Hong, J.; Feng, B.; Wu, Y.; Wang, L. Do government grants promote innovation efficiency in China’s high-tech industries? Technovation 2016, 57, 4–13. [Google Scholar] [CrossRef]
- Revilla, E.; Sarkis, J.; Modrego, A. Evaluating performance of public–private research collaborations: A DEA analysis. J. Oper. Res. Soc. 2003, 54, 165–174. [Google Scholar] [CrossRef]
- Park, H.; Anderson, T.R.; Seo, W. Regional innovation capability from a technology-oriented perspective: An analysis at industry level. Comput. Ind. 2021, 129. [Google Scholar] [CrossRef]
- Lin, S.; Lin, R.; Sun, J.; Wang, E.; Wu, W. Dynamically evaluating technological innovation efficiency of high-tech industry in China: Provincial, regional and industrial perspective. Socioeco. Plann. Sci. 2021, 74, 100939. [Google Scholar] [CrossRef]
- Shen, W.; Shi, J.; Meng, Q.; Chen, X.; Liu, Y.; Cheng, K.; Liu, W. Influences of environmental regulations on industrial green technology innovation efficiency in China. Sustainability 2022, 14, 4717. [Google Scholar] [CrossRef]
- Guan, J.; Zuo, K. A cross-country comparison of innovation efficiency. Scientometr. 2014, 100, 541–575. [Google Scholar] [CrossRef]
- Lin, S.; Sun, J.; Wang, S. Dynamic evaluation of the technological innovation efficiency of China’s industrial enterprises. Sci. Public Policy 2018, 46, 232–243. [Google Scholar] [CrossRef]
- Miao, C.; Duan, M.; Zuo, Y.; Wu, X.Y. Spatial heterogeneity and evolution trend of regional green innovation efficiency—an empirical study based on panel data of industrial enterprises in China’s provinces. Energy Policy 2021, 156, 112370. [Google Scholar] [CrossRef]
- Chen, W.; Wang, X.; Peng, N.; Wei, X.; Lin, C. Evaluation of the green innovation efficiency of Chinese industrial enterprises: Research based on the three-stage chain network SBM model. Math. Prob. Eng. 2020, 2020, 3143651. [Google Scholar] [CrossRef]
- Wang, H.; An, L.; Zhang, X. Evaluation of regional innovation ability based on green and low-carbon perspective. Bulg. Chem. Commun. 2017, 49, 55–58. [Google Scholar]
- Heindl, A.B.; Liefner, I. The analytic hierarchy process as a methodological contribution to improve regional innovation system research: Explored through comparative research in China. Technol. Soc. 2019, 59, 101197. [Google Scholar] [CrossRef]
- Li, L.; Wang, R.; Li, X. Grey fuzzy comprehensive evaluation of regional financial innovation ability based on two types weights. Grey Syst. Theory Appl. 2016, 6, 187–202. [Google Scholar] [CrossRef]
- Krndzija, L. Public sector innovation performance in Federation of Bosnia and Herzegovina: An exploratory factor analysis. Croat. Rev. Econ. Bus. Soc. Stat. 2021, 7, 13–30. [Google Scholar] [CrossRef]
- Ke, H.; Dai, S.; Yu, H. Effect of green innovation efficiency on ecological footprint in 283 Chinese Cities from 2008 to 2018. Environ. Dev. Sustain. 2022, 24, 2841–2860. [Google Scholar] [CrossRef]
- Huang, Q.; Jiang, M.S.; Miao, J. Effect of government subsidization on Chinese industrial firms’ technological innovation efficiency: A stochastic frontier analysis. J. Bus. Econ. Manag. 2016, 17, 187–200. [Google Scholar] [CrossRef]
- Haider, S.; Mishra, P. Does innovative capability enhance the energy efficiency of Indian Iron and Steel firms? A Bayesian stochastic frontier analysis. Energ. Econ. 2021, 95, 105128. [Google Scholar] [CrossRef]
- Li, T.; Liang, L.; Han, D. Research on the efficiency of green technology innovation in China’s provincial high-end manufacturing industry based on the RAGA-PP-SFA model. Math. Prob. Eng. 2018, 2018, 9463707. [Google Scholar] [CrossRef] [Green Version]
- Wang, X.; Wang, Y.; Lan, Y. Measuring the bias of technical change of industrial energy and environment productivity in China: A global DEA-Malmquist productivity approach. Environ. Sci. Pollut. Res. 2021, 28, 41896–41911. [Google Scholar] [CrossRef]
- Xin-gang, Z.; Zhen, W. The technical efficiency of China’s wind power list enterprises: An estimation based on DEA method and micro-data. Renew. Energy 2019, 133, 470–479. [Google Scholar] [CrossRef]
- Saeedi, H.; Behdani, B.; Wiegmans, B.; Zuidwijk, R. Assessing the technical efficiency of intermodal freight transport chains using a modified network DEA approach. Transp. Res. Part. E Logist. Transp. Rev. 2019, 126, 66–86. [Google Scholar] [CrossRef]
- Jin, F.; Garg, H.; Pei, L.; Liu, J.; Chen, H. Multiplicative consistency adjustment model and data envelopment analysis-driven decision-making process with probabilistic hesitant fuzzy preference relations. Int. J. Fuzzy Syst. 2020, 22, 2319–2332. [Google Scholar] [CrossRef]
- Zhang, Q.; Liu, L. Research on the Evaluation of Technological Innovation Efficiency of Different Industrial Enterprises in China. In Proceedings of the 2020 International Conference on Social Sciences and Big Data Application (ICSSBDA 2020), Xi’an, China, 17–18 October 2020; Atlantis Press: Amsterdam, The Netherlands, 2020; pp. 277–283. [Google Scholar]
- Ma, J.; Qi, L.; Deng, L. Efficiency measurement and decomposition in hybrid two-stage DEA with additional inputs. Expert Syst. Appl. 2017, 79, 348–357. [Google Scholar] [CrossRef]
- Tone, K.; Tsutsui, M. Dynamic DEA with network structure: A slacks-based measure approach. Omega 2014, 42, 124–131. [Google Scholar] [CrossRef]
- Kao, C. Efficiency decomposition in network data envelopment analysis: A relational model. Eur. J. Oper. Res. 2009, 192, 949–962. [Google Scholar] [CrossRef]
- Lin, B.; Luan, R. Do government subsidies promote efficiency in technological innovation of China’s photovoltaic enterprises? J. Clean. Prod. 2020, 254, 120108. [Google Scholar] [CrossRef]
- Li, H.; Zhang, J.; Wang, C.; Wang, Y.; Coffey, V. An evaluation of the impact of environmental regulation on the efficiency of technology innovation using the combined DEA model: A case study of Xi’an, China. Sustain. Cities Soc. 2018, 42, 355–369. [Google Scholar] [CrossRef]
- Xiao, R.Q.; Wang, Z.J.; Qian, L. Research on technology innovation efficiency of Chinese inter-provincial industrial enterprises under environmental constraints. Manage. Rev. 2014, 26, 56–65. [Google Scholar] [CrossRef]
- Wang, Q.; Hang, Y.; Sun, L.; Zhao, Z. Two-stage innovation efficiency of new energy enterprises in China: A non-radial DEA approach. Technol. Forecast. Soc. Change 2016, 112, 254–261. [Google Scholar] [CrossRef]
- Du, J.; Liu, Y.; Diao, W. Assessing regional differences in green innovation efficiency of industrial enterprises in China. Int. J. Environ. Res. Public Health 2019, 16, 940. [Google Scholar] [CrossRef]
- Zeng, G.; Guo, H.; Geng, C. A Five-stage DEA model for technological innovation efficiency of China’s strategic emerging industries, considering environmental factors and statistical errors. Pol. J. Environ. Stud. 2021, 30, 927–941. [Google Scholar] [CrossRef]
- Popelo, O.; Tulchynska, S.; Revko, A.; Butko, M.; Derhaliuk, M. Methodological approaches to the evaluation of innovation in Polish and Ukrainian regions, taking into account digitalization. Comp. Econ. Res. Cent. East. Eur. 2022, 25, 55–74. [Google Scholar] [CrossRef]
- Charnes, A.; Cooper, W.W.; Rhodes, E. Measuring the efficiency of decision making units. Eur. J. Oper. Res. 1978, 2, 429–444. [Google Scholar] [CrossRef]
- Liu, H.; Yang, G.; Liu, X.; Song, Y. R&D performance assessment of industrial enterprises in China: A two-stage DEA approach. Socioecon. Plan. Sci. 2020, 71, 100753. [Google Scholar]
- Lim, S.; Zhu, J. A note on two-stage network DEA model: Frontier projection and duality. Eur. J. Oper. Res. 2016, 248, 342–346. [Google Scholar] [CrossRef]
- Jiang, B.; Chen, H.; Li, J.; Lio, W. The uncertain two-stage network DEA models. Soft Comput. 2021, 25, 421–429. [Google Scholar] [CrossRef]
- Kao, C. Efficiency decomposition and aggregation in network data envelopment analysis. Eur. J. Oper. Res. 2016, 255, 778–786. [Google Scholar] [CrossRef]
- Furman, J.L.; Porter, M.E.; Stern, S. The determinants of national innovative capacity. Res. Policy 2002, 31, 899–933. [Google Scholar] [CrossRef]
- Su, Y.; Liang, D.; Guo, W. Application of multiattribute decision-making for evaluating regional innovation capacity. Math. Prob. Eng. 2020, 2020, 2851840. [Google Scholar] [CrossRef]
- Luo, Q.; Miao, C.; Sun, L.; Meng, X.; Duan, M. Efficiency evaluation of green technology innovation of China’s strategic emerging industries: An empirical analysis based on Malmquist-data envelopment analysis index. J. Clean. Prod. 2019, 238, 117782. [Google Scholar] [CrossRef]
- Zhou, S.; Deng, Q.; Peng, F. Effect of International Technology Transfer on the Technical Efficiency of High-Tech Manufacturing in China: A RAGA-PP-SFA Analysis. Complexity 2021, 2021, 6633484. [Google Scholar] [CrossRef]
- Boiarynova, K.; Popelo, O.; Tulchynska, S.; Gritsenko, S.; Prikhno, I. Conceptual foundations of evaluation and forecasting of innovative development of regions. Period. Polytech Soc. Manag Sci. 2022, 30, 167–174. [Google Scholar] [CrossRef]
- Kao, C.; Hwang, S.N. Efficiency decomposition in two-stage data envelopment analysis: An application to non-life insurance companies in Taiwan. Eur. J. Oper. Res. 2008, 185, 418–429. [Google Scholar] [CrossRef]
- Khoveyni, M.; Eslami, R. Two-stage network DEA with shared resources: Illustrating the drawbacks and measuring the overall efficiency. Knowl. Based. Syst. 2022, 250, 108725. [Google Scholar] [CrossRef]
- Wang, Y.; Pan, J.; Pei, R.; Yi, B.; Yang, G. Assessing the technological innovation efficiency of China’s high-tech industries with a two-stage network DEA approach. Socio-Econ. Plan. Sci. 2020, 71, 100810. [Google Scholar] [CrossRef]
- Chen, X.; Liu, Z.; Zhu, Q. Performance evaluation of China’s high-tech innovation process: Analysis based on the innovation value chain. Technovation 2018, 74, 42–53. [Google Scholar] [CrossRef]
- Chen, Y.; Du, J.; David Sherman, H.; Zhu, J. DEA model with shared resources and efficiency decomposition. Eur. J. Oper. Res. 2010, 207, 339–349. [Google Scholar] [CrossRef]
- Jin, F.; Cao, M.; Liu, J.; Martínez, L.; Chen, H. Consistency and trust relationship-driven social network group decision-making method with probabilistic linguistic information. Appl. Soft Comput. 2021, 103, 107170. [Google Scholar] [CrossRef]
- Liu, Z.; Li, K.W.; Tang, J.; Gong, B.; Huang, J. Optimal operations of a closed-loop supply chain under a dual regulation. Int. J. Prod. Econ. 2021, 233, 107991. [Google Scholar] [CrossRef]
- Hohberger, J.; Almeida, P.; Parada, P. The direction of firm innovation:the contrasting roles of strategic alliances and individual scientific collaborations. Res. Policy 2015, 44, 1473–1478. [Google Scholar] [CrossRef]
- Liu, Z.; Zheng, X.-X.; Li, D.-F.; Liao, C.-N.; Sheu, J.-B. A novel cooperative game-based method to coordinate a sustainable supply chain under psychological uncertainty in fairness concerns. Transport. Res. E-Log. 2021, 147, 102237. [Google Scholar] [CrossRef]


| Stage | Category | Index | Sign | Unit | References |
|---|---|---|---|---|---|
| R&D stage | Input | R&D personnel full-time equivalent | X1 | person year | [35,40,46,78] |
| Internal expenditure of R&D funds | X2 | 104 RMB | [35,40,46,78] | ||
| Output | Number of utility model and design patent applications | X3 | piece | [29,40,41,42] | |
| Number of invention patent applications | X4 | piece | [35,41,46,47] | ||
| Commercialization stage | Intermediate input | Expenditure for technological transformation | X5 | 104 RMB | [79,80] |
| Expenditure for technology introduction and absorption | X6 | 104 RMB | [79,80] | ||
| Output | Sales revenue of new products | X7 | 104 RMB | [35,36] |
| Variable | Minimum | Maximum | Mean Value | Standard Deviation |
|---|---|---|---|---|
| X1 | 162.00 | 35,780.00 | 6061.5625 | 7002.75498 |
| X2 | 9353.00 | 1,922,350.00 | 232,215.5750 | 320,656.64279 |
| X3 | 16.00 | 10,148.00 | 1600.3875 | 1993.78911 |
| X4 | 3.00 | 8834.00 | 1136.5437 | 1670.76238 |
| X5 | 2365.00 | 644,328.00 | 104,466.5188 | 131,064.70966 |
| X6 | 0.00 | 115,606.00 | 9609.8875 | 18,434.66311 |
| X7 | 87,865.00 | 36,064,735.00 | 4,343,921.631 | 6,187,936.754 |
| Area | 2011 | 2012 | 2013 | 2014 | 2015 | 2016 | 2017 | 2018 | 2019 | 2020 | Mean |
|---|---|---|---|---|---|---|---|---|---|---|---|
| Anqing | 0.364 | 0.626 | 0.572 | 0.559 | 0.581 | 0.487 | 0.447 | 0.460 | 0.701 | 0.480 | 0.528 |
| Bengbu | 0.626 | 0.476 | 0.959 | 0.618 | 0.515 | 0.373 | 0.498 | 0.225 | 0.529 | 0.471 | 0.529 |
| Bozhou | 0.990 | 1.000 | 1.000 | 1.000 | 1.000 | 1.000 | 1.000 | 0.881 | 1.000 | 0.952 | 0.982 |
| Chizhou | 1.000 | 1.000 | 1.000 | 1.000 | 1.000 | 1.000 | 1.000 | 1.000 | 1.000 | 1.000 | 1.000 |
| Chuzhou | 0.773 | 1.000 | 1.000 | 1.000 | 1.000 | 1.000 | 1.000 | 1.000 | 0.709 | 1.000 | 0.948 |
| Fuyang | 0.677 | 0.696 | 0.682 | 0.681 | 0.685 | 0.727 | 0.672 | 0.566 | 0.653 | 0.517 | 0.656 |
| Hefei | 1.000 | 1.000 | 1.000 | 1.000 | 1.000 | 1.000 | 1.000 | 1.000 | 1.000 | 1.000 | 1.000 |
| Huaibei | 0.276 | 0.279 | 1.000 | 0.432 | 0.454 | 0.594 | 0.594 | 1.000 | 0.682 | 0.612 | 0.592 |
| Huainan | 0.197 | 0.299 | 0.267 | 0.326 | 0.434 | 0.565 | 0.683 | 0.846 | 0.976 | 0.891 | 0.548 |
| Huangshan | 0.950 | 0.765 | 0.767 | 1.000 | 0.859 | 1.000 | 1.000 | 1.000 | 1.000 | 1.000 | 0.934 |
| Lu’an | 1.000 | 1.000 | 1.000 | 0.637 | 0.660 | 0.643 | 0.649 | 0.633 | 0.676 | 0.820 | 0.772 |
| Ma’anshan | 0.300 | 0.283 | 0.424 | 0.461 | 0.268 | 0.226 | 0.254 | 0.237 | 0.386 | 0.243 | 0.308 |
| Suzhou | 1.000 | 1.000 | 1.000 | 1.000 | 0.961 | 1.000 | 1.000 | 1.000 | 1.000 | 1.000 | 0.996 |
| Tongling | 0.287 | 0.373 | 0.375 | 1.000 | 0.342 | 1.000 | 0.375 | 0.691 | 0.754 | 0.455 | 0.565 |
| Wuhu | 1.000 | 1.000 | 1.000 | 1.000 | 1.000 | 1.000 | 1.000 | 1.000 | 0.760 | 1.000 | 0.976 |
| Xuancheng | 0.746 | 0.466 | 0.848 | 0.401 | 0.459 | 0.399 | 0.413 | 0.305 | 0.637 | 0.475 | 0.515 |
| Area | 2011 | 2011 | 2011 | 2011 | 2011 | 2011 | 2011 | 2011 | 2011 | 2011 | Mean |
|---|---|---|---|---|---|---|---|---|---|---|---|
| Anqing | 0.239 | 0.275 | 0.343 | 0.211 | 0.239 | 0.197 | 0.162 | 0.306 | 0.561 | 0.524 | 0.306 |
| Bengbu | 1.000 | 0.805 | 1.000 | 1.000 | 1.000 | 0.634 | 1.000 | 0.856 | 1.000 | 1.000 | 0.930 |
| Bozhou | 1.000 | 1.000 | 1.000 | 1.000 | 1.000 | 1.000 | 0.882 | 0.617 | 1.000 | 1.000 | 0.950 |
| Chizhou | 1.000 | 1.000 | 1.000 | 1.000 | 1.000 | 1.000 | 1.000 | 1.000 | 1.000 | 1.000 | 1.000 |
| Chuzhou | 0.770 | 1.000 | 1.000 | 1.000 | 1.000 | 1.000 | 1.000 | 1.000 | 1.000 | 1.000 | 0.977 |
| Fuyang | 0.522 | 0.337 | 0.381 | 0.259 | 0.560 | 0.197 | 0.363 | 0.369 | 0.858 | 0.808 | 0.465 |
| Hefei | 1.000 | 1.000 | 1.000 | 1.000 | 1.000 | 1.000 | 1.000 | 1.000 | 1.000 | 1.000 | 1.000 |
| Huaibei | 0.687 | 0.662 | 1.000 | 0.814 | 0.638 | 0.821 | 1.000 | 1.000 | 0.457 | 0.902 | 0.798 |
| Huainan | 0.838 | 0.234 | 0.285 | 0.156 | 0.177 | 0.220 | 0.075 | 0.052 | 0.211 | 0.111 | 0.236 |
| Huangshan | 0.995 | 0.856 | 0.816 | 1.000 | 0.549 | 1.000 | 1.000 | 1.000 | 1.000 | 1.000 | 0.922 |
| Lu’an | 1.000 | 1.000 | 1.000 | 0.888 | 0.220 | 0.295 | 0.260 | 0.471 | 0.644 | 0.387 | 0.616 |
| Ma’anshan | 0.949 | 0.421 | 0.244 | 0.146 | 0.102 | 0.599 | 0.221 | 0.342 | 0.291 | 0.154 | 0.347 |
| Suzhou | 1.000 | 1.000 | 1.000 | 1.000 | 0.552 | 0.893 | 1.000 | 1.000 | 1.000 | 1.000 | 0.944 |
| Tongling | 1.000 | 1.000 | 1.000 | 1.000 | 1.000 | 1.000 | 1.000 | 1.000 | 1.000 | 1.000 | 1.000 |
| Wuhu | 1.000 | 1.000 | 1.000 | 1.000 | 1.000 | 1.000 | 1.000 | 1.000 | 0.918 | 1.000 | 0.992 |
| Xuancheng | 1.000 | 0.983 | 1.000 | 0.585 | 0.853 | 0.868 | 0.809 | 0.396 | 0.722 | 0.422 | 0.764 |
| Area | 2011 | 2012 | 2013 | 2014 | 2015 | 2016 | 2017 | 2018 | 2019 | 2020 | Mean |
|---|---|---|---|---|---|---|---|---|---|---|---|
| Anqing | 0.302 | 0.450 | 0.457 | 0.385 | 0.410 | 0.342 | 0.304 | 0.383 | 0.631 | 0.502 | 0.417 |
| Bengbu | 0.813 | 0.640 | 0.979 | 0.809 | 0.758 | 0.504 | 0.749 | 0.541 | 0.764 | 0.736 | 0.729 |
| Bozhou | 0.995 | 1.000 | 1.000 | 1.000 | 1.000 | 1.000 | 0.941 | 0.749 | 1.000 | 0.976 | 0.966 |
| Chizhou | 1.000 | 1.000 | 1.000 | 1.000 | 1.000 | 1.000 | 1.000 | 1.000 | 1.000 | 1.000 | 1.000 |
| Chuzhou | 0.772 | 1.000 | 1.000 | 1.000 | 1.000 | 1.000 | 1.000 | 1.000 | 0.855 | 1.000 | 0.963 |
| Fuyang | 0.600 | 0.516 | 0.532 | 0.470 | 0.622 | 0.462 | 0.517 | 0.467 | 0.755 | 0.662 | 0.560 |
| Hefei | 1.000 | 1.000 | 1.000 | 1.000 | 1.000 | 1.000 | 1.000 | 1.000 | 1.000 | 1.000 | 1.000 |
| Huaibei | 0.482 | 0.471 | 1.000 | 0.623 | 0.546 | 0.707 | 0.797 | 1.000 | 0.569 | 0.757 | 0.695 |
| Huainan | 0.518 | 0.266 | 0.276 | 0.241 | 0.306 | 0.392 | 0.379 | 0.449 | 0.594 | 0.501 | 0.392 |
| Huangshan | 0.972 | 0.811 | 0.792 | 1.000 | 0.704 | 1.000 | 1.000 | 1.000 | 1.000 | 1.000 | 0.928 |
| Lu’an | 1.000 | 1.000 | 1.000 | 0.762 | 0.440 | 0.469 | 0.454 | 0.552 | 0.660 | 0.603 | 0.694 |
| Ma’anshan | 0.625 | 0.352 | 0.334 | 0.303 | 0.185 | 0.412 | 0.238 | 0.290 | 0.338 | 0.198 | 0.328 |
| Suzhou | 1.000 | 1.000 | 1.000 | 1.000 | 0.757 | 0.946 | 1.000 | 1.000 | 1.000 | 1.000 | 0.970 |
| Tongling | 0.644 | 0.687 | 0.687 | 1.000 | 0.671 | 1.000 | 0.688 | 0.845 | 0.877 | 0.728 | 0.783 |
| Wuhu | 1.000 | 1.000 | 1.000 | 1.000 | 1.000 | 1.000 | 1.000 | 1.000 | 0.839 | 1.000 | 0.984 |
| Xuancheng | 0.873 | 0.724 | 0.924 | 0.493 | 0.656 | 0.633 | 0.611 | 0.351 | 0.679 | 0.448 | 0.639 |
Publisher’s Note: MDPI stays neutral with regard to jurisdictional claims in published maps and institutional affiliations. |
© 2022 by the authors. Licensee MDPI, Basel, Switzerland. This article is an open access article distributed under the terms and conditions of the Creative Commons Attribution (CC BY) license (https://creativecommons.org/licenses/by/4.0/).
Share and Cite
Yang, Y.; Wang, Y.; Wang, C.; Zhang, Y.; Zhang, C. Temporal and Spatial Evolution of the Science and Technology Innovative Efficiency of Regional Industrial Enterprises: A Data-Driven Perspective. Sustainability 2022, 14, 10721. https://doi.org/10.3390/su141710721
Yang Y, Wang Y, Wang C, Zhang Y, Zhang C. Temporal and Spatial Evolution of the Science and Technology Innovative Efficiency of Regional Industrial Enterprises: A Data-Driven Perspective. Sustainability. 2022; 14(17):10721. https://doi.org/10.3390/su141710721
Chicago/Turabian StyleYang, Yaliu, Yuan Wang, Cui Wang, Yingyan Zhang, and Cuixia Zhang. 2022. "Temporal and Spatial Evolution of the Science and Technology Innovative Efficiency of Regional Industrial Enterprises: A Data-Driven Perspective" Sustainability 14, no. 17: 10721. https://doi.org/10.3390/su141710721
APA StyleYang, Y., Wang, Y., Wang, C., Zhang, Y., & Zhang, C. (2022). Temporal and Spatial Evolution of the Science and Technology Innovative Efficiency of Regional Industrial Enterprises: A Data-Driven Perspective. Sustainability, 14(17), 10721. https://doi.org/10.3390/su141710721