Article

The Whole Process CFD Numerical Simulation of Flow Field and Suspended Solids Distribution in a Full-Scale High-Rate Clarifier

1
Changjiang Institute of Survey, Planning, Design and Research Corporation, Wuhan 430010, China
2
Center for Water and Ecology, School of Environment, Tsinghua University, Beijing 100084, China
3
Hubei Provincial Engineering Research Center for Comprehensive Water Environment Treatment in the Yangtze River Basin, Wuhan 430010, China
4
Key Laboratory of Changjiang Regulation and Protection of Ministry of Water Resources, Wuhan 430010, China
5
Hubei Key Laboratory of Basin Water Security, Wuhan 430010, China
*
Author to whom correspondence should be addressed.
Sustainability 2022, 14(17), 10624; https://doi.org/10.3390/su141710624
Submission received: 25 July 2022 / Revised: 17 August 2022 / Accepted: 17 August 2022 / Published: 26 August 2022
(This article belongs to the Special Issue Sustainability in Water Treatment)

Abstract

:
To further reduce the contents of phosphorus and suspended solids (SS) in the effluent, the high-rate clarifier is adopted by some wastewater treatment plants (WWTPs) to upgrade their processes. However, due to the complex phosphorus species and unclear hydraulic characteristics after the addition of the high-rate clarifier, the removal efficiencies of total phosphorus and the optimization strategies of SS removal remain unclear. The high-rate clarifiers are mainly composed of the mixing zone and the settling zone. Only the hydraulic characteristics of the mixing zone have been studied. It is necessary to focus on the hydrodynamics of the settling zone to understand the sedimentation process and pollutant removal mechanism in depth. Therefore, this study focused on the whole process of high-rate clarifier of the Wuhan Nantaizi Lake WWTP in China. The distributions of flow velocity and SS in the full-scale high-rate clarifier were simultaneously simulated by the solid-liquid two-phase whole process computational fluid dynamics (CFD) model which was established in this study. The simulated results of the developed CFD model were in good agreement with the experimental data obtained in the high-rate clarifier. The normalized standard error was less than 7.66%. The overall flow velocities in the settling tank were much smaller than that in the reaction tank. After the fluid passed through the diversion effect of the overflow wall and the under-through channel, the overall kinetic energy loss was relatively large. Meanwhile, the residence time of fluid in the settling tank was longer than that in the reaction tank. The sludge sedimentation happened at the edge of the settling tank due to the vertical angle between the plug-flow fluid and the outlet. The successful construction of the CFD model could lay the foundation for the next step of the high-rate clarifier optimization operation and research on pollutant removal.

1. Introduction

With the continuous advancement of the conservation of the Yangtze River in recent years, great attention has been paid to water environmental management and water environment restoration in rivers and lakes in China [1,2,3,4,5]. Therefore, China has increased the scale of municipal wastewater treatment plants and improved the discharge standards of wastewater effluent [6]. To further reduce the contents of phosphorus and suspended solids (SS) in the effluent, the high-rate clarifier is adopted by more and more wastewater treatment plants (WWTPs) to upgrade their processes [7,8]. However, due to the complex phosphorus species and unclear hydraulic characteristics, the removal efficiencies of total phosphorus and the optimization strategies of SS removal remain unclear [9,10,11]. The high-rate clarifiers, as a new technology used for WWTPs upgrading, have little research on their complex tank structure and coagulation-flocculation sedimentation processes [12,13,14]. However, high-rate clarifiers are often accompanied by complex flow regimes during operation. The changes and movements of the flow field are drastically affected by the internal structure of the high-rate clarifier. In addition, the hydrodynamics also affect the removal efficiencies of pollutants in a high-rate clarifier [15,16].
Generally, experimental research, theoretical analysis, and numerical simulation are three types of methods for hydrodynamics study [17,18,19]. Experimental research and theoretical analysis were often used to study hydraulic characteristics. The numerical simulation of computational fluid dynamics (CFD) has been widely used in the field of hydrodynamics analysis due to the rapid development of computers [20,21,22]. Numerical simulation is based on the theory, using a large number of calculations to obtain results of simulated hydrodynamics problems, often combined with the results of the experimental analysis to solve practical problems. By this approach, hydrodynamic results are obtained at a lower cost, in a shorter time, and easily visualized for understanding and analysis by CFD numerical simulation [23,24].
The CFD has been widely used in solid-liquid flow simulation, such as membrane bioreactors, oxidation ditches, flotation tanks, etc. [19,25,26,27,28,29,30]. Song et al. [31] studied the flow field of the industrial Pachuca tanks by a gas-liquid CFD model. The results demonstrated that the CFD model could be effectively used for the design and operation of tanks. Aubin et al. [32] used ANSYS-CFX commercial software to investigate the effects of various Intermig impeller arrangements on the hydrodynamic and mixing performance in a stirred reactor. The results showed that it could be adapted to more operating conditions, such as the ability to handle fluids with lower Reynolds numbers, by rotating the Intermig impeller 45° relative to its adjacent impeller, rather than under the 90° rotation conditions recommended by the manufacturer. In addition, it was ensured that the Reynolds number of fluid flow between the impellers was reduced to 27 by slightly reducing the distance between the lower two impellers. Achouri et al. [33] studied the flow field of self-inducing turbines by a two-phase CFD model with a volume of fluid model. A good agreement was obtained between the simulated results and the experimental data in this study. In addition to the related study of rotational reactors by the CFD model, many researchers mainly studied the solid-liquid two-phase flow [34,35,36,37,38]. Xie et al. [39] simulated the flow field and solid phase distributions of a full-scale oxidation ditch by using a two-phase CFD model. The results indicated that the flow field and the solid phase distribution were interrelated, and the operation of the oxidation ditch could be modified by CFD simulation. Patziger et al. [40] studied the simulation of fluid velocities and SS concentrations in the secondary settling tank by an axisymmetric CFD model. It indicated that the fluid velocities were related to the solid distribution. As can be seen from these applications of CFD modeling, an efficient, time-saving, and cost-effective method for the research of hydraulic characteristics in different reactors has been developed.
As such, it is important to study the distribution of flow velocities and SS concentrations by the CFD model for the high-rate clarifier. However, the whole process of solid-liquid two-phase flow simulation in the high-rate clarifier to avoid SS sedimentation has been seldom studied. Xu et al. [41] studied hydrodynamics in the mixing zone of the high-rate clarifier. In other words, it is not enough to only study the hydraulic characteristics of the mixing zone because of the sedimentation-targeted of the high-rate clarifier [42,43]. Moreover, it needs to focus on the hydrodynamics of the settling zone to understand the sedimentation process and pollutant removal mechanism in depth.
In general, the distribution of flow velocities and SS concentrations was studied by establishing a solid-liquid two-phase whole process CFD model in the full-scale high-rate clarifier. The simulated results of the developed CFD model were validated by the experimental data obtained in the high-rate clarifier. Based on the simulated results, the hydrodynamics of the reaction tank and the settling tank was compared. Moreover, the hydrodynamics of the high-rate clarifier were investigated and analyzed to reduce the possibility of sludge settling.

2. Materials and Methods

2.1. The Full-Scale High-Rate Clarifier Geometry

A full-scale high-rate clarifier of the Wuhan Nantaizi Lake WWTP was studied in China. Per day, 60,000 m3 of wastewater following the secondary settling tank is treated by this high-rate clarifier. The clarifier is mainly composed of the reaction tank and the settling tank as shown in Figure 1. The wastewater inlet was at the central bottom of the reaction tank. The wastewater was mixed with the chemicals in the reaction tank and the mechanical agitation of stirred paddle improved the kinetic energy of the fluid. Then, the fluid flowed to the settling tank by passing through the overflow wall and the under-through channel. The sludge would settle and separate from the water in the settling tank by inclined tube sedimentation. The entire high-rate clarifier tank is composed of complex structures and multiple sizes in this study. The reaction tank and the settling tank of the high-rate clarifier were simultaneously studied.
The geometry sizes of the reactor tank in the model are 8200 mm in length, 8200 mm in width, and 6600 mm in height, respectively. Moreover, the chamfer of the reactor tank is 750 mm at the bottom. There is a central hollow cylinder made of steel plate in the center with a height of 5056 mm, a radius of 1980 mm in the upper part, and a radius of 2180 mm in the lower part of the flare. The angle between the flare and the cylinder body is 30° and the upper edge of the central hollow cylinder is 850 mm from the liquid surface of the reactor tank. There are four baffles evenly set around the central hollow cylinder. The geometry sizes of the baffle are 3300 mm in height and 2150 mm in width, respectively. A cylindrical water inlet with a diameter of 1200 mm and a height of 2000 mm is set in the center bottom of the reaction tank. A stirred paddle is set in the center of the reaction tank. The stirred paddle consists of a rotating shaft with a diameter of 100 mm, a length of 3650 mm, and two blades. The two blades are with a 180° distribution between each other. The blade was in the shape of trapezoidal. The geometry size of the blade is 1700 mm in length. Between the areas of the reaction tank and the settling tank, the wastewater of the inlet passed through the under-through channel with a height of 2000 mm at the lower position of the reaction tank and then overflowed through the overflow wall with a height of 5050 mm into the settling tank after passing through the slope.
In the settling tank, due to the presence of an inclined tube sedimentation area in the part between the settling tank and the reaction tank, the liquid level in the downstream area of the reaction tank is affected by the structure of the building and is lower compared to that of the central hollow cylinder area. The width of the settling tank is increased to 16,000 mm in the downstream area of the overflow wall. After the water flow passed through the overflow wall of the reaction tank, it gradually entered the settling tank. The geometry sizes of the settling tank are 16,000 mm in length, 16,000 mm in width, and 6300 mm in height, respectively. The lower four corners of the settling tank were curved. The wastewater and flocs were separated at the upper part of the settling tank by inclined tube sedimentation. The water flowed through the 16 overflow weirs which were 400 mm in width above the inclined tube sedimentation to discharge. The sludge flocs were collected and scraped at the bottom of the settling tank. Finally, the sludge flocs were discharged by the sludge pump.

2.2. Mathematical Modeling

2.2.1. CFD Model

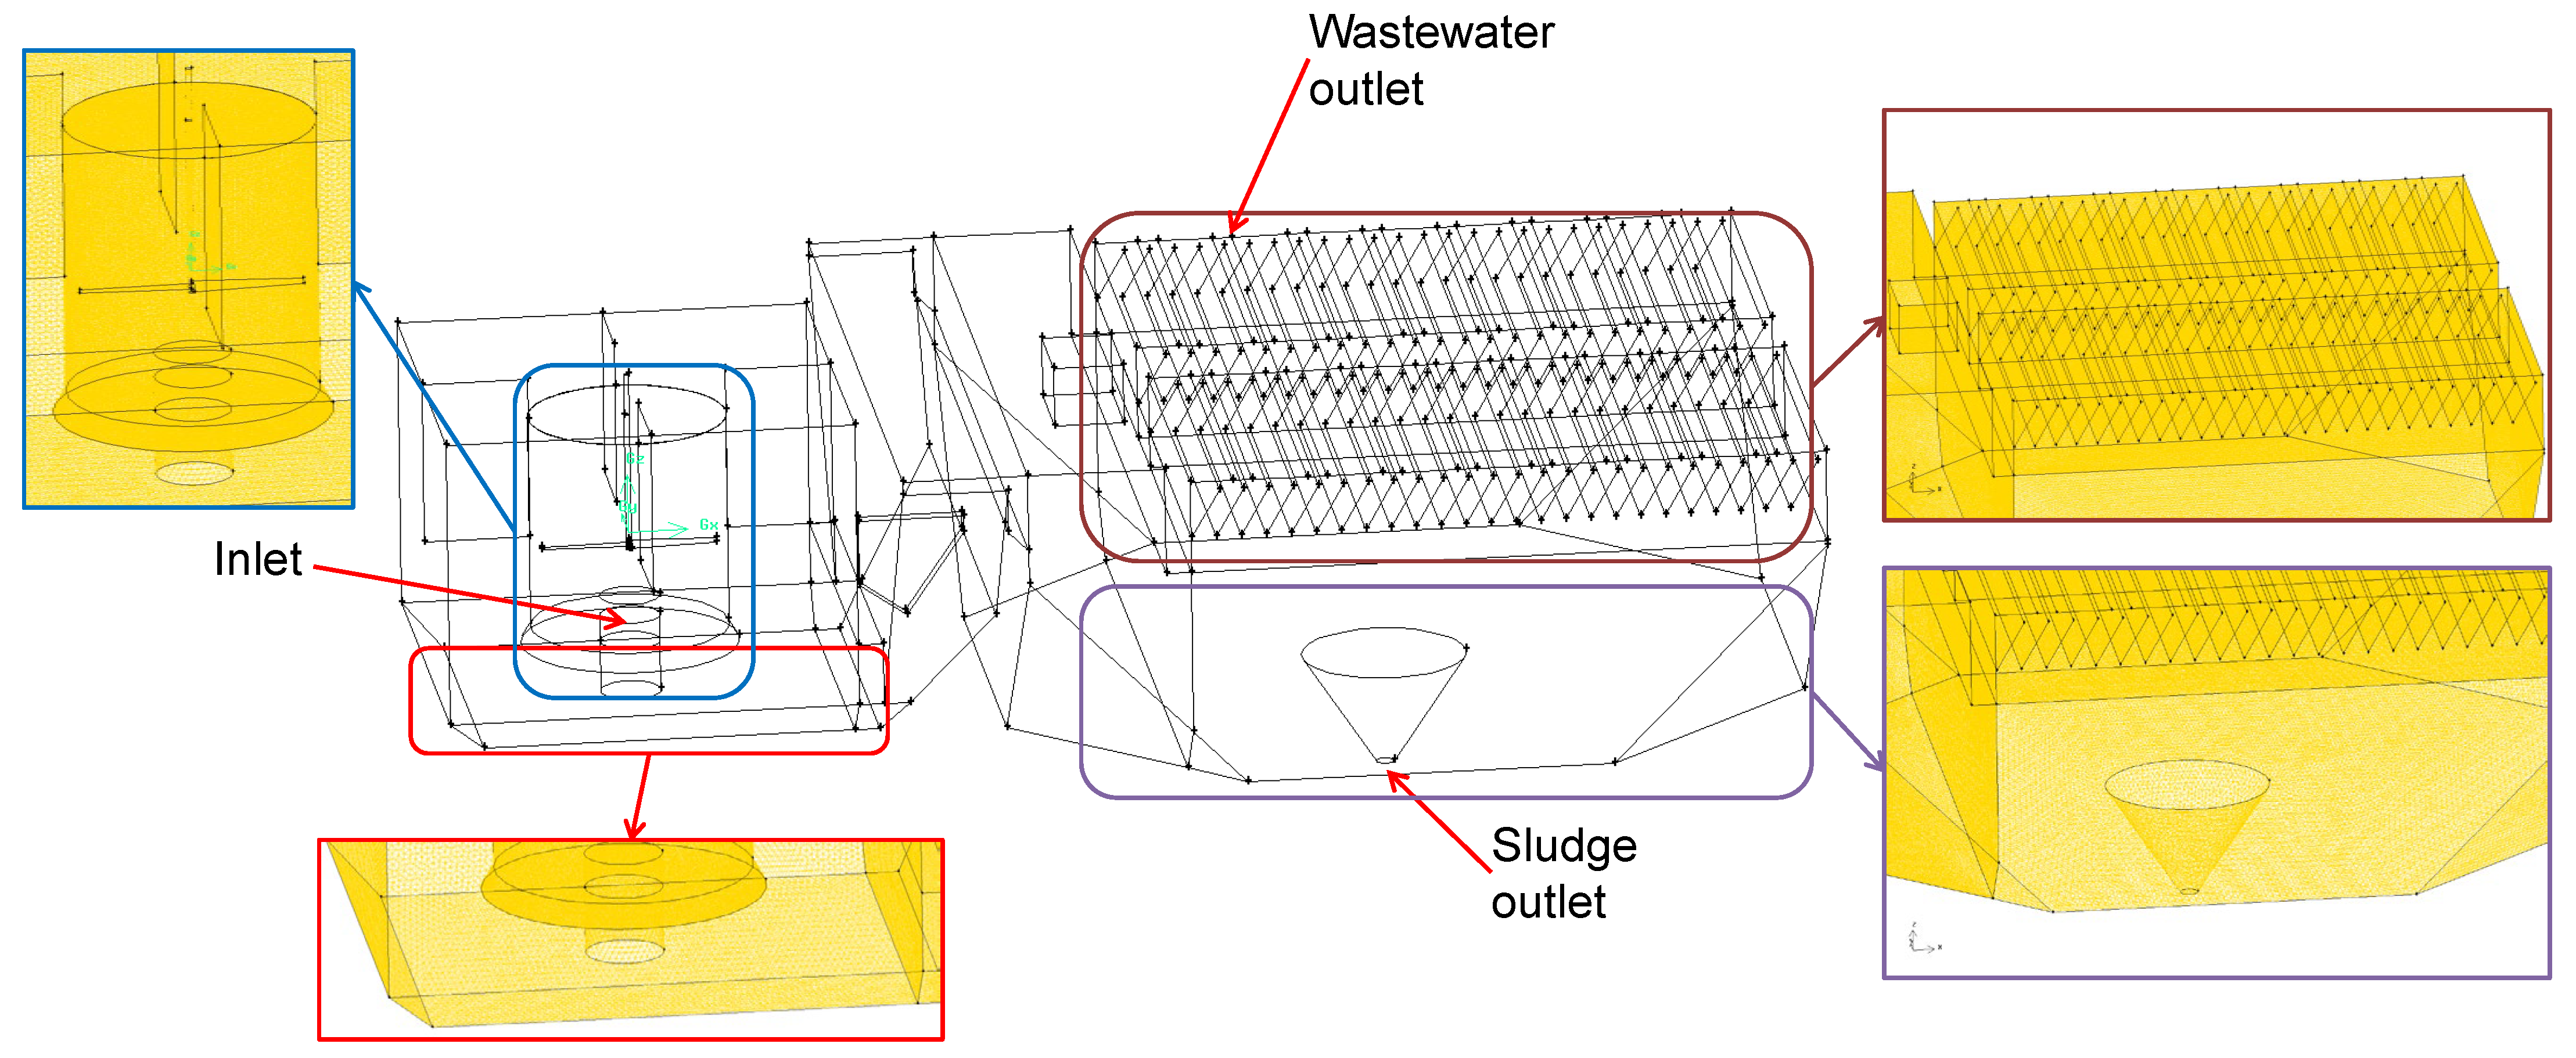
The whole process including the reaction tank and the settling tank was simulated and studied wherein SS sedimentation was easy to happen [44,45]. The three-dimensional (3D) geometry model of the full-scale high-rate clarifier was constructed using the software of Gambit (Gambit 2.4.6, Exceed 13) in Figure 2. The unstructured meshes of tetrahedrons were introduced and the grid of the model was generated by Gambit [41,46]. There were 13,378,966 tetrahedral cells for computed volume.

2.2.2. Governing Equations

The flow field and the SS concentration were simulated by a 3D solid-liquid two-phase CFD model. The CFD model was developed by using the 13.0 version of a commercial CFD code FLUENT (ANSYS, Inc., Canonsburg, PA, USA) [41].
The continuity equation and the momentum equation were typical governing equations for the CFD simulations and solved using the Navier–Stokes equations by inputting the parameters of boundary conditions. The continuity equations are presented as follows:
ρ m t + · ( ρ m u m ) = 0
u m = k = 1 2 α k ρ k u k / ρ m
ρ m = k = 1 2 α k ρ k
where um—mass averaged velocity vector (m/s);
ρ m —mixture density (kg/m3);
t—time (s);
α k —volume fraction (%);
ρ k —density of phase k (kg/m3);
uk—velocity vector of phase k (m/s);
k—phase type, k = 1 denotes liquid phase, and k = 2 denotes solid phase [41].
The momentum equation is presented as follows:
( ρ m u m ) t + ( u m · ) ρ m u m = p + · τ ρ m + ρ m g + ρ m F + · ( k = 1 2 α k ρ k u d , k )
where p—pressure (Pa);
τ —stress tensor (Pa);
g—gravity vector (m/s2);
F—body force (N).
The u d , k is the drift velocity of phase k (m/s), presented as follows:
u d , k = u k u m
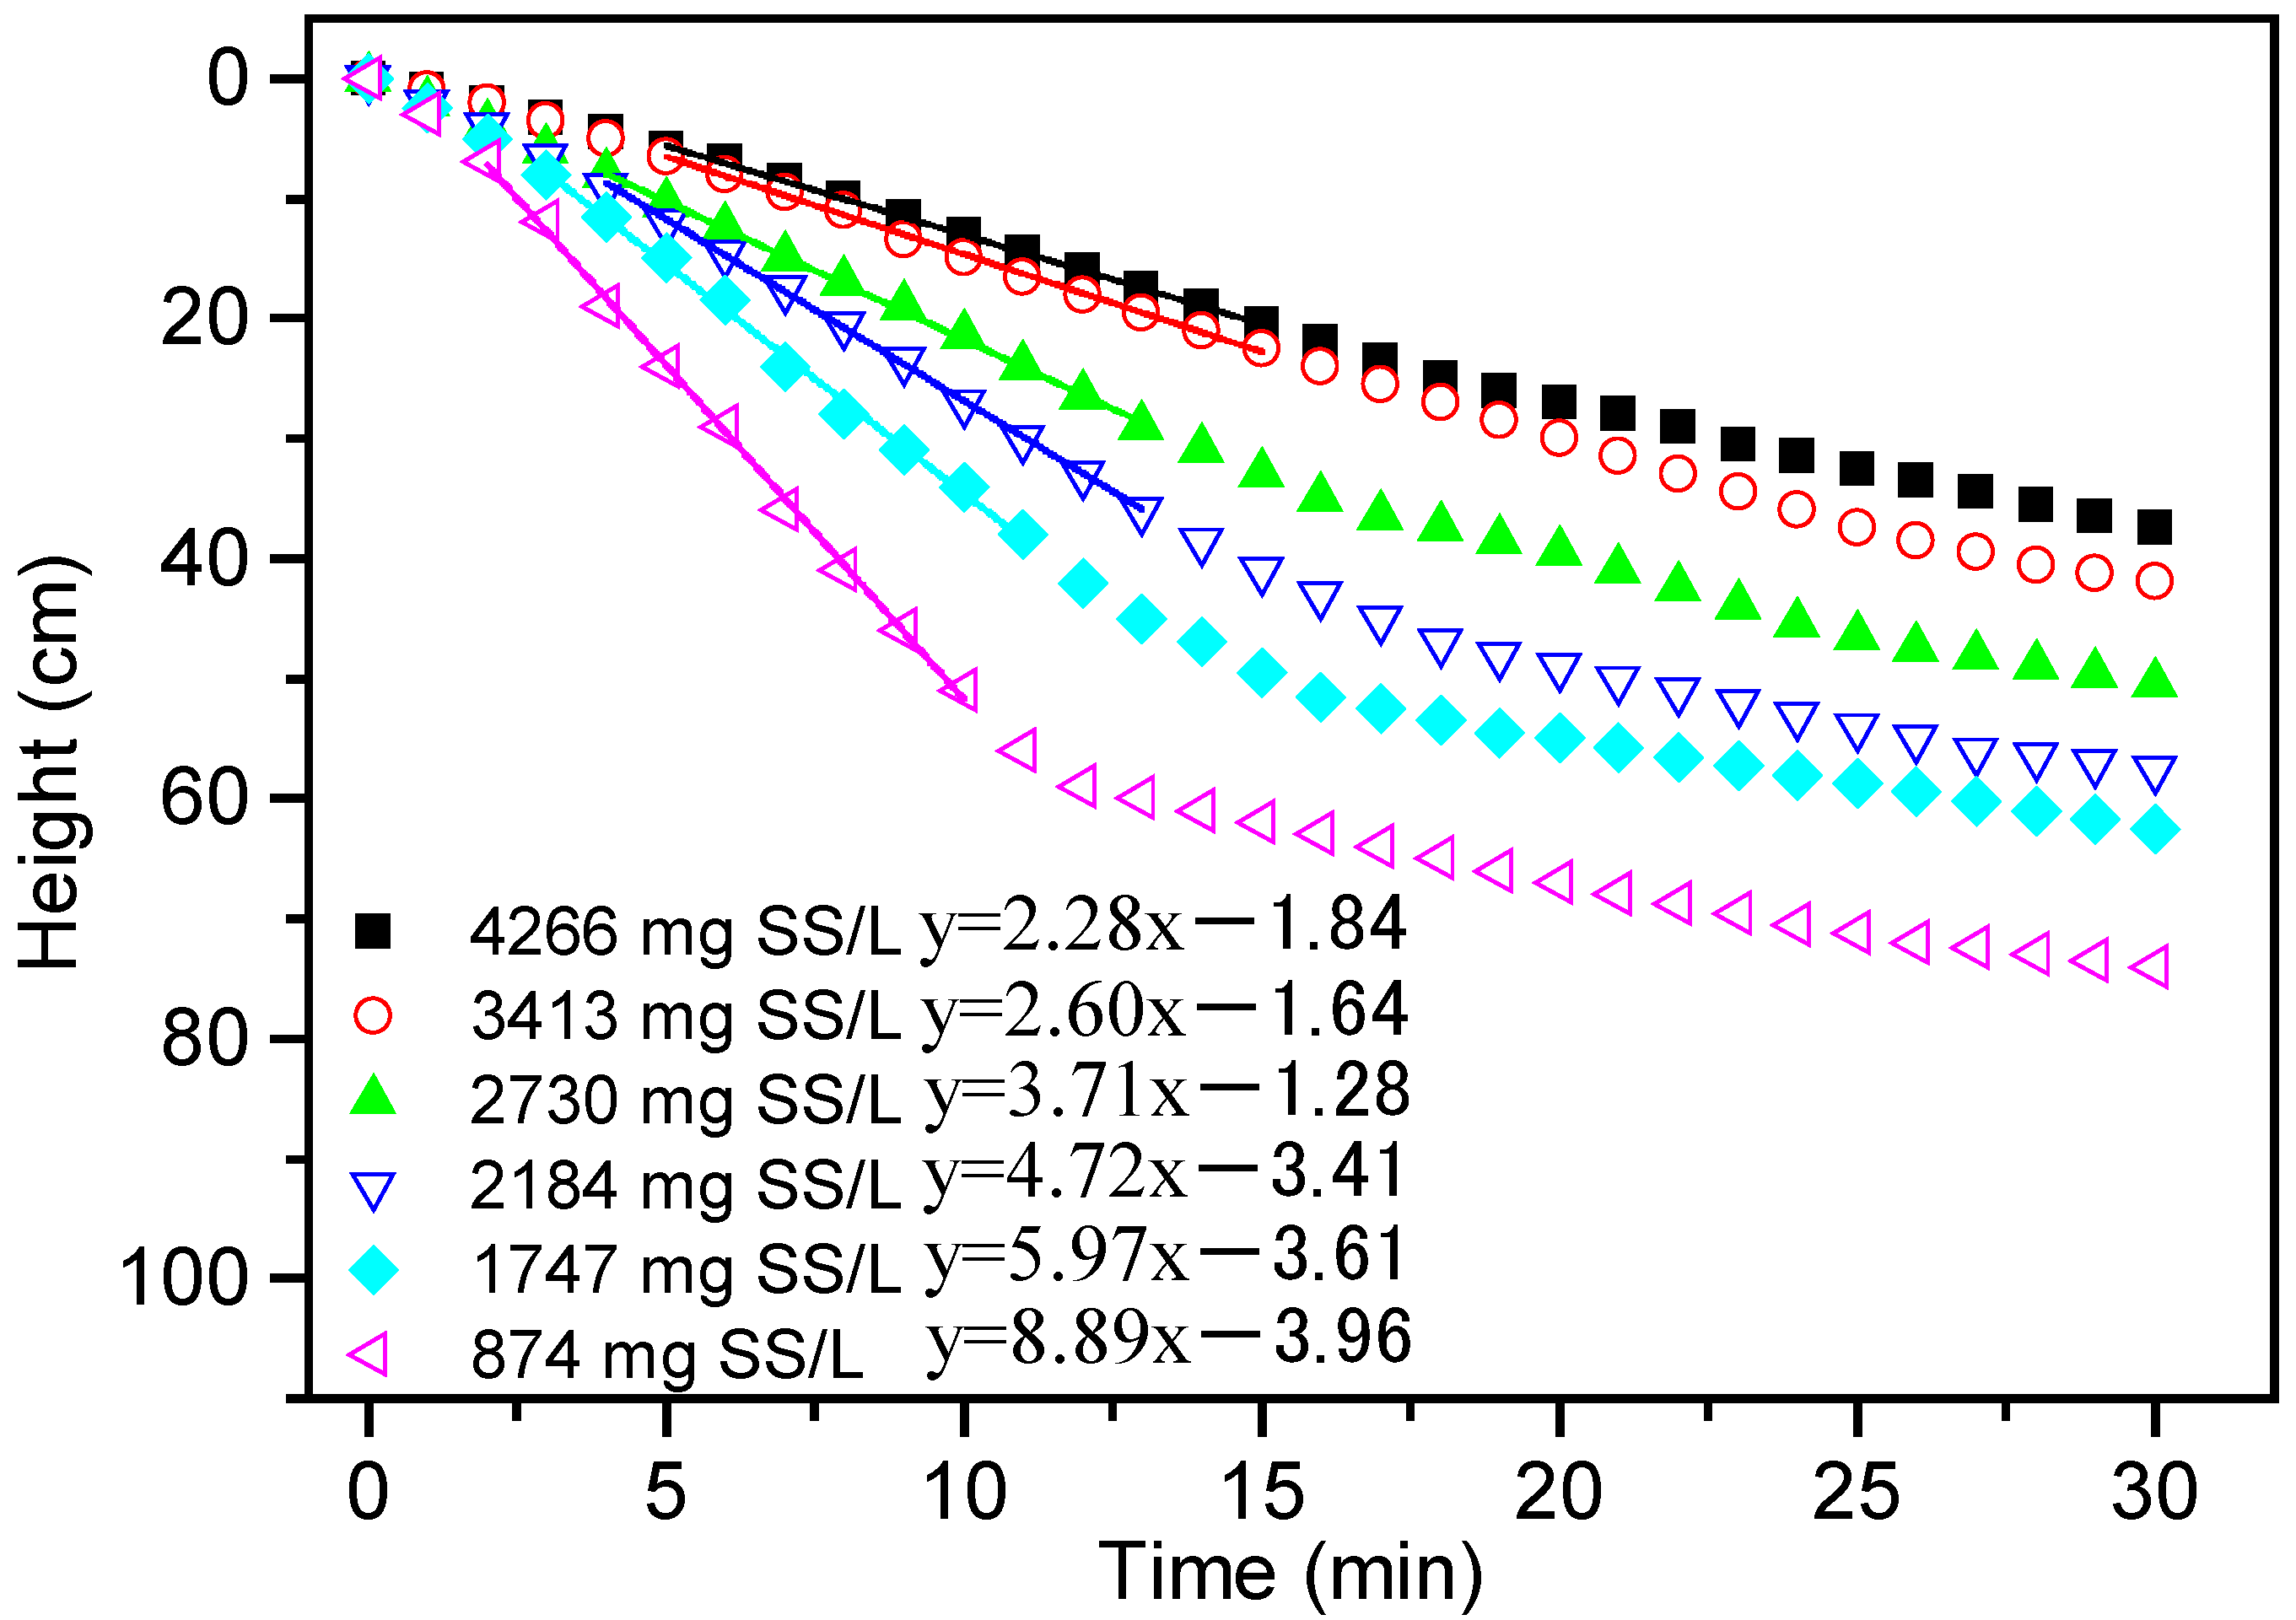
The SS settling process was described by applying the slip velocity function in the CFD model. The slip velocity function was defined by the Takács double exponential equation [39,47,48]. The bench-scale experiment was carried out to obtain the specific SS settling velocity for the CFD model [41]. The stirred cylinders were used for the experiment to get the SS settling velocity. The experiment measured the variations of the interface heights between the liquid phase and solid phase in the stirred cylinders. Then, the SS settling curves of the different SS concentrations were shown in Figure 3. The original fluid of the wastewater and flocs was taken from the full-scale high-rate clarifier. Furthermore, the mixtures of wastewater and flocs with different SS concentrations were carried out by mixing the original fluid with tap water. As shown in Table 1, the SS settling velocities with different SS concentrations were calculated by the slopes in Figure 3 [41].
Therefore, the Takács double exponential equation could be fitted (R = 0.9947) and presented as follows:
V = 0 . 00133 × ( e 0 . 4516 × X e 36 . 9 × X )
where V—SS settling velocity (m/s);
X—SS concentration (mg/L).

2.2.3. Boundary Conditions

The two-phase model selected the SS of the user-defined phase and water-liquid as the inputs. The liquid phase of water and the solid phase of SS were the main and secondary phases, respectively. The samples were collected and measured for the SS density, flocs particle size, and viscosity in the full-scale high-rate clarifier according to our previous study [39,41,49]. Their values in the model were set to 1020 kg/m3, 90 μm, and 3.08 mPa∙s, respectively. The slip velocity between the liquid phase and solid phase was introduced through the user-defined function. The SS settling velocities were described by Equation (6) (Takács double exponential equation) in the CFD model for the two-phase flow. On the one hand, the velocity inlet was applied and calculated according to the treatment capacity and cross-sectional area at the inlet. As such, the inlet was set to 0.614 m/s. On the other hand, the wastewater outlet and the sludge outlet were set as pressure outlet boundary conditions of 0 Pa in the settling tank. The approach of MRF (multiple reference frames) was introduced for the rotation of stirred paddle simulation [50,51]. The static walls, including the external wall and central hollow cylinder with four baffles, were defined. However, the moving walls of the rotational paddles were defined and simulated at 1.466 rad/s based on the local operational conditions in WWTP.

2.3. Experimental Measurements

2.3.1. Flow Field Measurements

The three directions of velocities were tested by an acoustic doppler velocimeter (Flow Tracker, measurement range: 0.001–4.5 m/s, SonTek/YSI Inc., San Diego, CA, USA) with a 3-D probe. Because of the limitation of inclined tube sedimentation, the actual flow velocities were only measured at 14 different sampling sites of the reaction tank and part of the settling tank as shown in Figure 4. The coordinates of the 14 different sampling sites (R1 to R8 in the reaction tank and the S1 to S6 in the settling tank) are shown in Table 2. The three depths of the top layer, middle layer, and bottom layer (6.0, 4.0, and 2.6 m above the bottom, respectively) were applied for the flow velocity measurements [41].

2.3.2. Other Measurements

The viscosity and the particle sizes of the SS were determined by an NDJ-8S viscometer (Shanghai Scientific Instrument, Shanghai, China) and a BT-9300ST laser particle size analyzer (Bettersize Instruments, Liaoning, China), respectively [41].

2.4. Statistical Analysis

The normalized standard error was applied in the subsequent data analysis for more effective comparison of measured data and simulation results [36], presented as follows:
NSE = 1 n ( n 1 ) i = 1 n ( X si X mi ) 2 1 n i = 1 n X mi
where NSE—normalized standard error;
n—number of experimental samples;
Xsi—the simulated result of the i-th parameter;
Xmi—experimental data of the i-th parameter.

3. Results and Discussion

3.1. Comparison of the Simulated and the Measured Flow Velocities

3.1.1. Comparison of the Simulated and the Measured Flow Velocities in the Reaction Tank

The comparisons of the simulated and the measured flow velocities in the reaction tank are shown in Figure 5. The simulated results by the solid-liquid model revealed good agreement with the measured flow velocities under the normalized standard error below 7.66%. It is generally considered to be a good simulation of the normalized standard error between the simulated results of CFD models and the experimental data below 10% [29]. An upward sloping flow (the positive Z-direction) was shown in sampling site R1 which was at the center of the reaction tank (Figure 5a). In contrast, a downward sloping flow (the negative Z-direction) was shown in sampling sites R7 and R8 which were near the external wall of the reaction tank (Figure 5g,h). This phenomenon demonstrated that a vertical micro-circulation flow was prone to occur in the reaction tank because of the influence of the baffle.
The sampling sites R1, R2, R3, and R4 are four sampling sites evenly distributed around the periphery area of the central hollow cylinder. Therefore, the hydraulic characteristics of the sampling sites R2, R3, and R4 were similar to that of the R1 in Figure 5a–d. Because the measuring location R5 is close to the external wall of the reaction tank parallel to the X-axis, the velocity of the R5 in the Y-axis direction was fairly low in Figure 5e. The overall velocity of the R5 was larger than that of the sampling sites R1 to R4 near the peripheral area of the central hollow cylinder, and the fluid at the R5 flowed downward (toward the bottom area of the pool) due to being close to the external wall of the reaction tank. It can be determined that a circulation flow was formed between the sampling sites R1 and R5 compared with the flow field distribution of the upward flow of the fluid at the sampling site R1. It would help the mixing effect of the coagulant and the wastewater in the reaction tank.
In summary, the simulated results were in good agreement with the measured results combined with the comprehensive analysis of the eight sampling sites of the reaction tank. The sampling sites R5, R6, R7, and R8 are close to the external wall of the reaction tank. The fluids flowed downward of all the sampling sites in the reaction tank except for the upper and middle area of sampling site R6. It can be found that the flow in the reaction tank formed a circulation by comparing with the velocity results of sampling sites R1, R2, R3, and R4.

3.1.2. Comparison of the Simulated and the Measured Flow Velocities in the Settling Tank

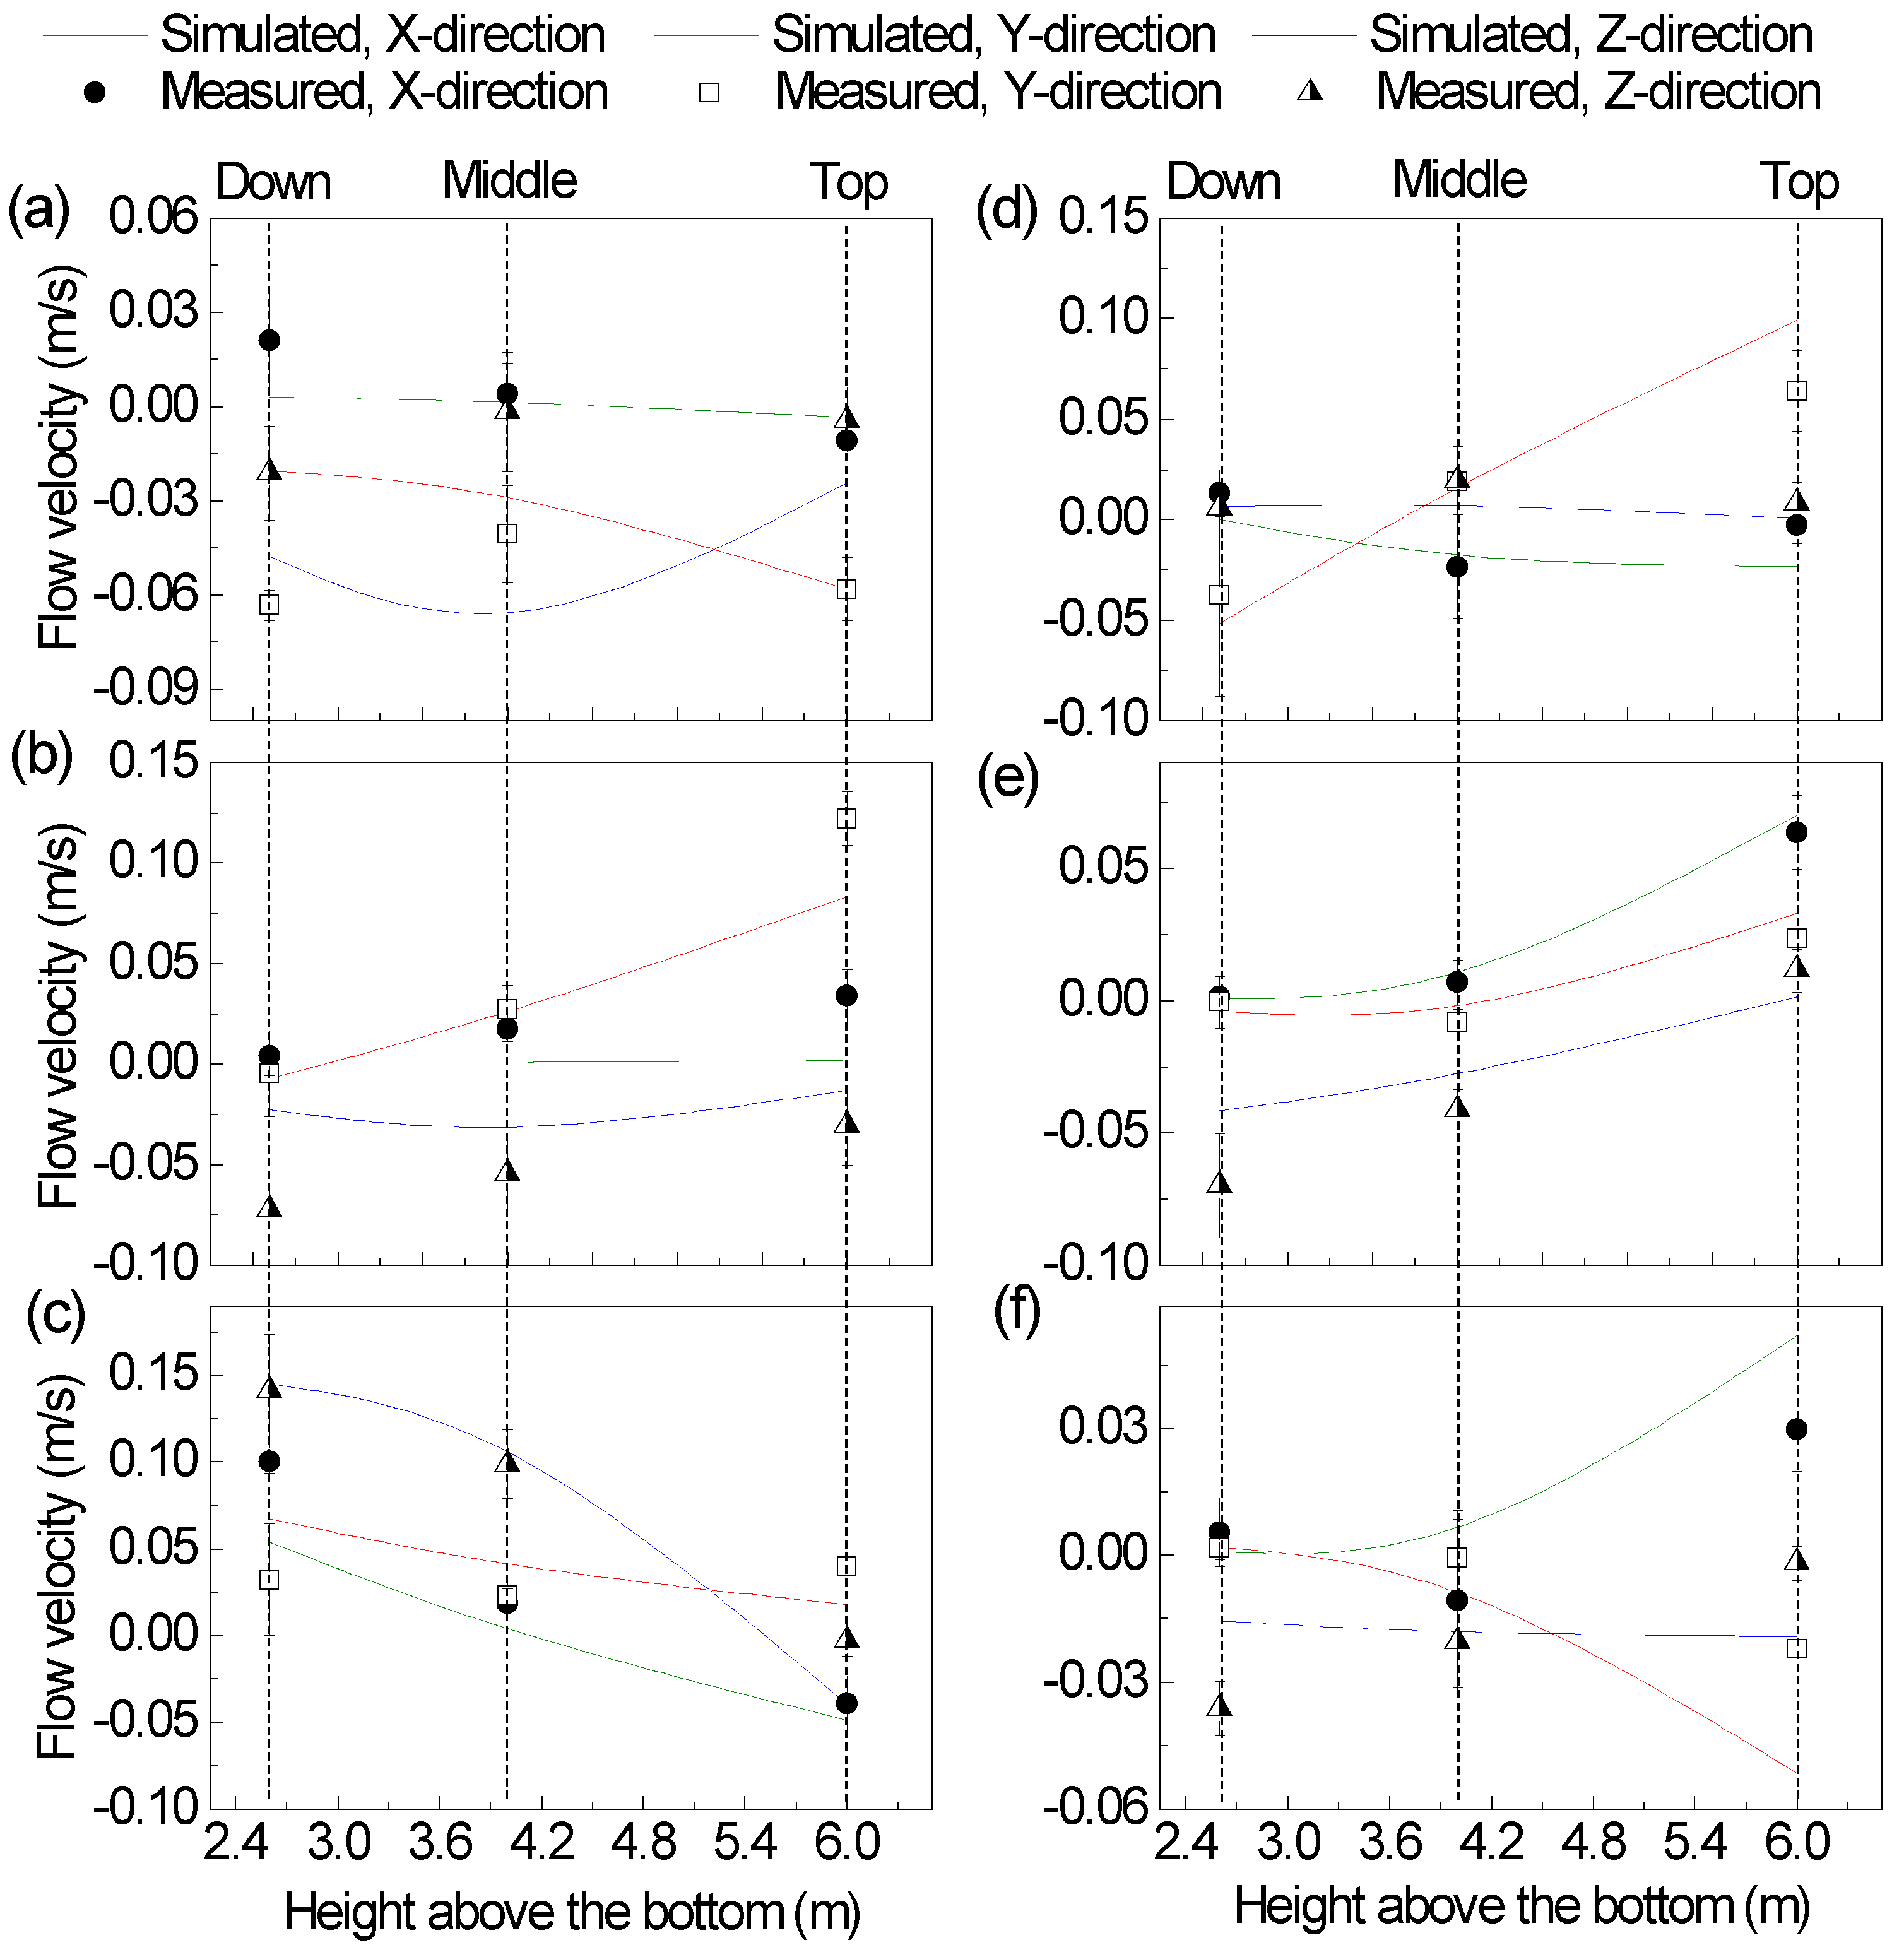
The comparisons of the simulated and the measured flow velocities in the settling tank are shown in Figure 6. Moreover, it can be found that the velocities at sampling site S1 were negative (Y-direction) (Figure 6a). The reason is that the reaction tank’s width (8.2 m) was much smaller than the width of the settling tank (16 m). As such, a large diffusion to the edge of the settling tank appeared in the Y-direction. Furthermore, the velocities at sampling site S1 were negative in the Z-direction, probably because of the downstream location of the overflow wall for sampling site S1. As the same, the velocities presented both upward and downward sloping flows in the Z-direction (Figure 6a,c), from which it can be inferred that a vertical micro-circulation flow was prone to occur.
The sampling sites S2 and S1 are symmetrical based on the central axis of the high-rate clarifier (Y = 0 mm). Therefore, the flow velocity of the S2 (Figure 6b) in the Y-axis direction presented the opposite direction to that of the S1. However, the flow field distributions of the S1 and S2 were consistent. In the same way, the sampling sites S4 and S3 are symmetrical based on the central axis (Y = 0 mm). The flow field distributions at the S4 (Figure 6d) were consistent with that at the S3.
As shown in Figure 6e,f, sampling sites S5 and S6 were at locations that are far away from the overflow wall in the settling tank. The velocities at sampling sites S5 and S6 were negative in the Z-direction because of natural gravity settling. The results of Kulkarni and Patwardhan [50] supported these findings that the circulation flows easily happen in various rotational reactors.

3.2. Contour Profiles of Velocities and SS Concentrations of the High-Rate Clarifier

3.2.1. Contours of Velocity Profiles of the High-Rate Clarifier Simulated by the Two-Phase Model

To further analyze the simulated hydrodynamic characteristics, five sections were selected in the high-rate clarifier (Figure 7). The four horizontal sections were named as top layer, middle layer, bottom layer, bottom, and one Y = 0 mm vertical section.
The contours of velocity profiles at the top layer, middle layer, and bottom layer (6.0, 4.0, and 2.6 m above the bottom, respectively) of the high-rate clarifier are shown in Figure 8. The contours of velocity profiles at the Y = 0 mm section are shown in Figure 9. It is noted that the overall flow velocities in the settling tank were much smaller than that in the reaction tank, possibly because the mechanical agitation of stirred paddle improved the kinetic energy of the fluid [52]. Moreover, the volume of the settling tank was seriously bigger than that of the reaction tank. When the kinetic energy was constant, the velocities decreased as the volume of reactors increased. Therefore, the fluid with the same kinetic energy would flow more slowly in the settling tank. After the fluid passed through the diversion effect of the overflow wall and the under-through channel, the overall kinetic energy loss was relatively large. Meanwhile, the residence time of fluid in the settling tank was relatively longer than that in the reaction tank.

3.2.2. Contours of SS Concentration Profiles of the High-Rate Clarifier Simulated by the Two-Phase Model

The contours of SS concentration profiles at the top layer, middle layer, bottom layer (6.0, 4.0, and 2.6 m above the bottom, respectively), and the bottom of the high-rate clarifier are shown in Figure 10. The contours of SS concentration profiles at the Y = 0 mm section of the high-rate clarifier are shown in Figure 11. It is noted that the SS concentrations close to the bottom were higher than that near the top layer of the tank. Meanwhile, the overall SS concentration in the settling tank was higher than that in the reaction tank, which was consistent with the results shown in Figure 8 and Figure 9.
It can be found that the contour profiles of SS concentrations at the top layer of the 16 overflow weirs were affected by the uneven flow velocities of the outlet, showing a corrugated shape in Figure 10. Moreover, the SS concentrations were relatively high on the right edge of the lower position of the settling tank in Figure 10. Because of the geometric structure of the high-rate clarifier, the sludge sedimentation would be happened at the edge of the settling tank due to the vertical angle between the plug-flow fluid and the outlet.
In summary, the successful construction of the CFD model which was validated with measured data demonstrated that hydraulic characteristics of the high-rate clarifier could be simulated and studied at a low cost and in a short time. This could be an insight into the sedimentation process and pollutant removal mechanism in-depth and lay the foundation for the next step of the high-rate clarifier optimization operation and research on pollutant removal. All these would contribute to efficient pollutant removal and stable operation in the high-rate clarifier, which would help the advanced wastewater treatment in WWTPs to improve the water environment.

4. Conclusions

The whole process CFD numerical simulation of flow velocities and SS distribution in a full-scale high-rate clarifier in a wastewater treatment plant has been studied by a developed solid-liquid two-phase CFD model. The main conclusions from this study are as follows:
(1)
The simulated results of the developed CFD model were in good agreement with the experimental data obtained in the high-rate clarifier. The normalized standard error was less than 7.66%. The consistency between the simulated results and the measured data further proved that the flow field could be accurately simulated by the CFD model.
(2)
Through the analysis of the flow field distribution in the five typical sections, it was found that the overall flow velocities in the settling tank were much smaller than that in the reaction tank. After the fluid passed through the diversion effect of the overflow wall and the under-through channel, the overall kinetic energy loss was relatively large.
(3)
Through the analysis of the SS concentration distribution in the five typical sections, the sludge sedimentation happened at the edge of the settling tank due to the vertical angle between the plug-flow fluid and the outlet.
(4)
The successful construction of the CFD model demonstrated that hydraulic characteristics of the high-rate clarifier could be simulated and studied at a low cost and in a short time. This could be an insight into the sedimentation process and pollutant removal mechanism in-depth and lay the foundation for the next step of the high-rate clarifier optimization operation and research on pollutant removal.

Author Contributions

Conceptualization, Q.X., C.X. and Y.W.; validation, G.X., Q.Z. and D.Y.; formal analysis, X.L. (Xi Luo); investigation, X.L. (Xiang Li); writing—original draft preparation, Q.X.; writing—review and editing, Q.X. and X.L. (Xi Luo); visualization, H.C.; supervision, Y.L. and H.L.; project administration, Q.X. All authors have read and agreed to the published version of the manuscript.

Funding

China Postdoctoral Science Foundation (2021M692753), Postdoctoral Innovative Practice Position Project of Hubei Province (265306), and Natural Science Foundation of Hubei Province (2021CFB159).

Institutional Review Board Statement

Not applicable.

Informed Consent Statement

Not applicable.

Data Availability Statement

All data generated or analyzed during this study are included in this published article.

Conflicts of Interest

The authors declare no conflict of interest.

References

  1. Zhang, Q.H.; Yang, W.; Ngo, H.H.; Guo, W.S.; Jin, P.K.; Dzakpasu, M.; Yang, S.; Wang, Q.; Wang, X.; Ao, D. Current Status of Urban Wastewater Treatment Plants in China. Environ. Int. 2016, 92, 11–22. [Google Scholar] [CrossRef] [PubMed]
  2. Xiong, X.; Wu, C.; Elser, J.J.; Mei, Z.; Hao, Y. Occurrence and Fate of Microplastic Debris in Middle and Lower Reaches of the Yangtze River – From Inland to the Sea. Sci. Total Environ. 2019, 659, 66–73. [Google Scholar] [CrossRef] [PubMed]
  3. He, D.; Chen, X.; Zhao, W.; Zhu, Z.; Qi, X.; Zhou, L.; Chen, W.; Wan, C.; Li, D.; Zou, X.; et al. Microplastics Contamination in the Surface Water of the Yangtze River from Upstream to Estuary Based on Different Sampling Methods. Environ. Res. 2021, 196, 110908. [Google Scholar] [CrossRef] [PubMed]
  4. Feng, S.; Lu, H.; Yao, T.; Liu, Y.; Tian, P.; Lu, J. Microplastic Footprints in the Qinghai-tibet Plateau and Their Implications to the Yangtze River Basin. J. Hazard. Mater. 2021, 407, 124776. [Google Scholar] [CrossRef]
  5. Fan, J.; Zou, L.; Zhao, G. Microplastic Abundance, Distribution, and Composition in the Surface Water and Sediments of the Yangtze River Along Chongqing City, China. J. Soils Sediments. 2021, 21, 1840–1851. [Google Scholar] [CrossRef]
  6. Qu, J.H.; Wang, H.C.; Wang, K.J.; Yu, G.; Ke, B.; Yu, H.Q.; Ren, H.Q.; Zheng, X.C.; Li, J.; Li, W.W.; et al. Municipal Wastewater Treatment in China: Development History and Future Perspectives. Front. Env. Sci. Eng. 2019, 13, 7. [Google Scholar] [CrossRef]
  7. Luo, Y.; Yao, J.; Wang, X.; Zheng, M.; Guo, D.; Chen, Y. Efficient Municipal Wastewater Treatment by Oxidation Ditch Process at Low Temperature: Bacterial Community Structure in Activated Sludge. Sci. Total Environ. 2020, 703, 135031. [Google Scholar] [CrossRef]
  8. Xu, Q.; Xiao, K.; Wang, H.; Wu, Q.; Liang, S.; Yu, W.; Hou, H.; Liu, B.; Hu, J.; Yang, J. Insight into Effects of Organic and Inorganic Phosphorus Speciations on Phosphorus Removal Efficiency in Secondary Effluent. Environ. Sci. Pollut. Res. 2020, 27, 11736–11748. [Google Scholar] [CrossRef]
  9. Teh, C.Y.; Budiman, P.M.; Shak, K.P.Y.; Wu, T.Y. Recent Advancement of Coagulation–flocculation and Its Application in Wastewater Treatment. Ind. Eng. Chem. Res. 2016, 55, 4363–4389. [Google Scholar] [CrossRef]
  10. Fu, Y.; Wang, Y.Z. An Organic-inorganic Hybrid Coagulant Containing al, zn and fe (hoazf): Preparation, Efficiency and Mechanism of Removing Organic Phosphorus. J. Water Reuse Desalin. 2018, 8, 202–213. [Google Scholar] [CrossRef] [Green Version]
  11. Ma, B.; Xue, W.; Ding, Y.; Hu, C.; Liu, H.; Qu, J. Removal Characteristics of Microplastics by fe-Based Coagulants During Drinking Water Treatment. J. Environ. Sci. 2019, 78, 267–275. [Google Scholar] [CrossRef] [PubMed]
  12. Wang, J.P.; Chen, Y.Z.; Wang, Y.; Yuan, S.J.; Yu, H.Q. Optimization of the Coagulation-flocculation Process for Pulp Mill Wastewater Treatment Using a Combination of Uniform Design and Response Surface Methodology. Water Res. 2011, 45, 5633–5640. [Google Scholar] [CrossRef]
  13. Liu, Y.Y.; Zhang, W.J.; Yang, X.Y.; Xiao, P.; Wang, D.S.; Song, Y. Advanced Treatment of Effluent from Municipal wwtp with Different Metal Salt Coagulants: Contaminants Treatability and Floc Properties. Sep. Purif. Technol. 2013, 120, 123–128. [Google Scholar] [CrossRef]
  14. Ebeling, J.M.; Welsh, C.F.; Rishel, K.L. Performance Evaluation of an Inclined Belt Filter Using Coagulation/Flocculation Aids for the Removal of Suspended Solids and Phosphorus from Microscreen Backwash Effluent. Aquac. Eng. 2006, 35, 61–77. [Google Scholar] [CrossRef]
  15. Pavlova, S.; Dobrevsky, I. Modified Sirofloc Process for Natural Water Treatment. Desalination 2005, 173, 55–59. [Google Scholar] [CrossRef]
  16. Pukkella, A.K.; Vysyaraju, R.; Tammishetti, V.; Rai, B.; Subramanian, S. Improved Mixing of Solid Suspensions in Stirred Tanks with Interface Baffles: Cfd Simulation and Experimental Validation. Chem. Eng. J. 2019, 358, 621–633. [Google Scholar] [CrossRef]
  17. Wu, B. Cfd Simulation of Gas and Non-newtonian Fluid Two-phase Flow in Anaerobic Digesters. Water Res. 2010, 44, 3861–3874. [Google Scholar] [CrossRef]
  18. Goula, A.M.; Kostoglou, M.; Karapantsios, T.D.; Zouboulis, A.I. The Effect of Influent Temperature Variations in a Sedimentation Tank for Potable Water Treatment--a Computational Fluid Dynamics Study. Water Res. 2008, 42, 3405–3414. [Google Scholar] [CrossRef]
  19. Brannock, M.; Wang, Y.; Leslie, G. Mixing Characterisation of Full-scale Membrane Bioreactors: Cfd Modelling with Experimental Validation. Water Res. 2010, 44, 3181–3191. [Google Scholar] [CrossRef]
  20. Le Moullec, Y.; Gentric, C.; Potier, O.; Leclerc, J.P. Cfd Simulation of the Hydrodynamics and Reactions in an Activated Sludge Channel Reactor of Wastewater Treatment. Chem. Eng. Sci. 2010, 65, 492–498. [Google Scholar] [CrossRef]
  21. Guimet, V.; Savoye, P.; Audic, J.; Do-Quang, Z.; Van Loosdrecht, M.; Clement, J. Advanced cfd tool for wastewater: Today complex modelling and tomorrow easy-to-use interface. In Proceedings of the 2nd IWA Leading-Edge Conference on Water and Wastewater Treatment Technologies, Prague, Czech Republic, 1–4 June 2004; Guimet, V., Savoye, P., Audic, J., Do-Quang, Z., Van Loosdrecht, M., Clement, J., Eds.; IWA Publishing: London, UK, 2005; Volume 4, pp. 1–4. [Google Scholar]
  22. Zhang, J.; Chen, X.; Liu, J.; Huang, B.; Xu, M. Structural Characteristics of a Spiral Symmetry Stream Anaerobic Bioreactor Based on Cfd. Biochem. Eng. J. 2018, 137, 50–61. [Google Scholar] [CrossRef]
  23. Fayolle, Y.; Gillot, S.; Cockx, A.; Roustan, M.; Héduit, A. In Situ Local Parameter Measurements for Cfd Modeling to Optimize Aeration. Proc. Water Environ. Fed. 2006, 2006, 3314–3326. [Google Scholar] [CrossRef]
  24. Fayolle, Y.; Cockx, A.; Gillot, S.; Roustan, M.; Héduit, A. Oxygen Transfer Prediction in Aeration Tanks Using Cfd. Chem. Eng. Sci. 2007, 62, 7163–7171. [Google Scholar] [CrossRef]
  25. Lakghomi, B.; Lawryshyn, Y.; Hofmann, R. A Model of Particle Removal in a Dissolved Air Flotation Tank: Importance of Stratified Flow and Bubble Size. Water Res. 2014, 68, 262–272. [Google Scholar] [CrossRef] [PubMed]
  26. Sanchez, F.; Viedma, A.; Kaiser, A.S. Hydraulic Characterization of an Activated Sludge Reactor with Recycling System by Tracer Experiment and Analytical Models. Water Res. 2016, 101, 382–392. [Google Scholar] [CrossRef] [PubMed]
  27. Sánchez, F.; Rey, H.; Viedma, A.; Nicolás-Pérez, F.; Kaiser, A.; Martínez, M. Cfd Simulation of Fluid Dynamic and Biokinetic Processes Within Activated Sludge Reactors Under Intermittent Aeration Regime. Water Res. 2018, 139, 47–57. [Google Scholar] [CrossRef] [PubMed]
  28. Littleton, H.X.; Daigger, G.T.; Strom, P.F. Application of Computational Fluid Dynamics to Closed-loop Bioreactors: Ii. Simulation of Biological Phosphorus Removal Using Computational Fluid Dynamics. Water Environ. Res. 2007, 79, 613–624. [Google Scholar] [CrossRef]
  29. Littleton, H.X.; Daigger, G.T.; Strom, P.F. Application of Computational Fluid Dynamics to Closed-loop Bioreactors: I. Characterization and Simulation of Fluid-flow Pattern and Oxygen Transfer. Water Environ. Res. 2007, 79, 600–612. [Google Scholar] [CrossRef]
  30. Li, Z.-l.; Guo, L.-s.; Zhang, D.-j.; Xu, D.-y. Simulation of Liquid-gas Flow in Full-scale Caroussel Oxidation Ditch with Surface aeration. J. Cent. South Univ. 2012, 19, 1615–1621. [Google Scholar] [CrossRef]
  31. Song, T.; Jiang, K.; Zhou, J.; Wang, D.; Xu, N.; Feng, Y. Cfd Modelling of gas–Liquid Flow in an Industrial Scale Gas-stirred Leaching Tank. Int. J. Miner. Process. 2015, 142, 63–72. [Google Scholar] [CrossRef]
  32. Aubin, J.; Xuereb, C. Design of Multiple Impeller Stirred Tanks for the Mixing of Highly Viscous Fluids Using Cfd. Chem. Eng. Sci. 2006, 61, 2913–2920. [Google Scholar] [CrossRef]
  33. Achouri, R.; Dhaouadi, H.; Mhiri, H.; Bournot, P. Numerical and Experimental Investigation of the Self-inducing Turbine Aeration Capacity. Energy Conv. Manag. 2014, 83, 188–196. [Google Scholar] [CrossRef]
  34. Patziger, M. Computational Fluid Dynamics Investigation of Shallow Circular Secondary Settling Tanks: Inlet Geometry and Performance Indicators. Chem. Eng. Res. Des. 2016, 112, 122–131. [Google Scholar] [CrossRef]
  35. Valle Medina, M.E.; Laurent, J. Incorporation of a Compression Term in a Cfd Model Based on the Mixture Approach to Simulate Activated Sludge Sedimentation. Appl. Math. Model. 2020, 77, 848–860. [Google Scholar] [CrossRef]
  36. Lei, L.; Ni, J. Three-dimensional Three-phase Model for Simulation of Hydrodynamics, Oxygen Mass Transfer, Carbon Oxidation, Nitrification and Denitrification in an Oxidation Ditch. Water Res. 2014, 53, 200–214. [Google Scholar] [CrossRef]
  37. Fan, L.; Xu, N.; Wang, Z.; Shi, H. Pda Experiments and Cfd Simulation of a Lab-scale Oxidation Ditch with Surface Aerators. Chem. Eng. Res. Des. 2010, 88, 23–33. [Google Scholar] [CrossRef]
  38. Hribersek, M.; Zajdela, B.; Hribernik, A.; Zadravec, M. Experimental and Numerical Investigations of Sedimentation of Porous Wastewater Sludge Flocs. Water Res. 2011, 45, 1729–1735. [Google Scholar] [CrossRef] [PubMed]
  39. Xie, H.; Yang, J.; Hu, Y.; Zhang, H.; Yang, Y.; Zhang, K.; Zhu, X.; Li, Y.; Yang, C. Simulation of Flow Field and Sludge Settling in a Full-scale Oxidation Ditch by Using a Two-phase Flow Cfd Model. Chem. Eng. Sci. 2014, 109, 296–305. [Google Scholar] [CrossRef]
  40. Patziger, M.; Kainz, H.; Hunze, M.; Jozsa, J. Influence of Secondary Settling Tank Performance on Suspended Solids Mass Balance in Activated Sludge Systems. Water Res. 2012, 46, 2415–2424. [Google Scholar] [CrossRef]
  41. Xu, Q.; Xiao, K.; Wu, Q.; Wang, H.; Liang, S.; Yu, W.; Tao, S.; Hou, H.; Liu, B.; Hu, J. The Optimization on Distributions of Flow Field and Suspended Solids in a Full-scale High-rate Clarifier Using Computational Fluid Dynamics. Biochem. Eng. J. 2020, 155, 107489. [Google Scholar] [CrossRef]
  42. Lapointe, M.; Brosseau, C.; Comeau, Y.; Barbeau, B. Assessing Alternative Media for Ballasted Flocculation. J. Environ. Eng-ASCE. 2017, 143, 4017071. [Google Scholar] [CrossRef]
  43. Imasuen, E.; Judd, S.; Sauvignet, P. High-rate Clarification of Municipal Wastewaters: A Brief Appraisal. J. Chem. Technol. Biotechnol. 2004, 79, 914–917. [Google Scholar] [CrossRef]
  44. Bridgeman, J.; Jefferson, B.; Parsons, S.A. Computational Fluid Dynamics Modelling of Flocculation in Water Treatment: A Review. Eng. Appl. Comp. Fluid Mech. 2014, 3, 220–241. [Google Scholar] [CrossRef]
  45. Bridgeman, J.; Jefferson, B.; Parsons, S. Assessing Floc Strength Using Cfd to Improve Organics Removal. Chem. Eng. Res. Des. 2008, 86, 941–950. [Google Scholar] [CrossRef]
  46. Xu, Q.; Yang, J.; Hou, H.; Hu, Y.; Liang, S.; Xiao, K.; Wu, X.; Liu, B.; Hu, J.; Hu, J. Simulation on Flow Field and Gas Hold-up of a Pilot-scale Oxidation Ditch by Using Liquid-gas Cfd Model. Water Sci. Technol. 2018, 78, 1956–1965. [Google Scholar] [CrossRef] [PubMed]
  47. Gao, H.; Stenstrom, M.K. Evaluation of Three Turbulence Models in Predicting the Steady State Hydrodynamics of a Secondary Sedimentation Tank. Water Res. 2018, 143, 445–456. [Google Scholar] [CrossRef]
  48. Takács, I.; Patry, G.G.; Nolasco, D. A Dynamic Model of the Clarification-thickening Process. Water Res. 1991, 25, 1263–1271. [Google Scholar] [CrossRef]
  49. Xu, Q.; Wan, Y.; Wu, Q.; Xiao, K.; Yang, J. An Efficient Hydrodynamic-biokinetic Model for the Optimization of Operational Strategy Applied in a Full-scale Oxidation Ditch by Cfd Integrated with Asm2. Water Res. 2021, 193, 116888. [Google Scholar] [CrossRef]
  50. Kulkarni, A.L.; Patwardhan, A.W. Cfd Modeling of Gas Entrainment in Stirred Tank Systems. Chem. Eng. Res. Des. 2014, 92, 1227–1248. [Google Scholar] [CrossRef]
  51. Villiger, T.K.; Neunstoecklin, B.; Karst, D.J.; Lucas, E.; Stettler, M.; Broly, H.; Morbidelli, M.; Soos, M. Experimental and Cfd Physical Characterization of Animal Cell Bioreactors: From Micro- to Production Scale. Biochem. Eng. J. 2018, 131, 84–94. [Google Scholar] [CrossRef]
  52. Ding, J.; Wang, X.; Zhou, X.-F.; Ren, N.-Q.; Guo, W.-Q. Cfd Optimization of Continuous Stirred-tank (cstr) Reactor for Biohydrogen Production. Bioresour. Technol. 2010, 101, 7005–7013. [Google Scholar] [CrossRef] [PubMed]
Figure 1. The schematic diagram of the high-rate clarifier (a), sectional diagram 1-1 of the central line along the reaction tank (b), and sectional diagram 2-2 of the effluent along the overflow wall (c) (Unit: mm).
Sustainability 14 10624 g001
Figure 2. The three-dimensional geometry model of the high-rate clarifier in WWTP.
Sustainability 14 10624 g002
Figure 3. The SS settling curves of the different SS concentrations.
Sustainability 14 10624 g003
Figure 4. The schematic diagram of the eight sampling sites in the reaction tank and the six sampling sites in the settling tank (Unit: mm).
Sustainability 14 10624 g004
Figure 5. Comparisons of the simulated and measured flow velocities of eight sampling sites in the reaction tank: (a) R1, (b) R2, (c) R3, (d) R4, (e) R5, (f) R6, (g) R7, and (h) R8 at the top layer, middle layer, and bottom layer (6.0, 4.0, and 2.6 m above the bottom, respectively).
Sustainability 14 10624 g005
Figure 6. Comparisons of the simulated and measured flow velocities of six sampling sites in the settling tank: (a) S1, (b) S2, (c) S3, (d) S4, (e) S5, and (f) S6 at the top layer, middle layer, and bottom layer (6.0, 4.0, and 2.6 m above the bottom, respectively).
Sustainability 14 10624 g006
Figure 7. The schematic diagram of representative sections.
Sustainability 14 10624 g007
Figure 8. The contours of velocity profiles at the top layer, middle layer, and bottom layer (6.0, 4.0, and 2.6 m above the bottom, respectively) of the high-rate clarifier simulated by the two-phase model.
Sustainability 14 10624 g008
Figure 9. The contours of velocity profiles at Y = 0 mm section of the high-rate clarifier simulated by the two-phase model.
Sustainability 14 10624 g009
Figure 10. The contours of SS concentration profiles at the top layer, middle layer, bottom layer (6.0, 4.0, and 2.6 m above the bottom, respectively), and the bottom of the high-rate clarifier simulated by the two-phase model.
Sustainability 14 10624 g010
Figure 11. The contours of SS concentration profiles at Y = 0 mm section of the high-rate clarifier simulated by the two-phase model.
Sustainability 14 10624 g011
Table 1. Settling velocities of SS with the different SS concentrations.
SS (mg/L)87417472184273034134266
Settling velocity (×10−4 m/s)8.895.974.723.712.602.28
Table 2. The coordinates of the sampling sites.
RegionsSampling Sites *Coordinates (mm)
Reaction tankR1(−3000, −1080)
R2(−3000, 1080)
R3(3000, −1080)
R4(3000, 1310)
R5(−1750, −4000)
R6(−3800, −1080)
R7(−3800, 1080)
R8(3200, −3800)
Settling tankS1(4700, −3500)
S2(4700, 3500)
S3(5600, −1100)
S4(5600, 1330)
S5(7300, −1100)
S6(7300, 1330)
* The center point of the reaction tank was set to (0, 0).
Publisher’s Note: MDPI stays neutral with regard to jurisdictional claims in published maps and institutional affiliations.