Article

Framework for Spatio-Temporal Distribution of Disasters and Influencing Factors: Exploratory Study of Tianjin, China

1
Tianjin Key Laboratory of Soft Soil Characteristics & Engineering Environment, Tianjin Chengjian University, Tianjin 300384, China
2
State Key Laboratory of Hydraulic Engineering Simulation and Safety, Tianjin University, Tianjin 300350, China
3
Zhonghuan Information College, Tianjin University of Technology, Tianjin 300380, China
4
Tianjin Dongfang Tairui Technology Co., Ltd., Tianjin 300110, China
*
Author to whom correspondence should be addressed.
Sustainability 2022, 14(17), 10488; https://doi.org/10.3390/su141710488
Submission received: 18 July 2022 / Revised: 17 August 2022 / Accepted: 18 August 2022 / Published: 23 August 2022
(This article belongs to the Section Hazards and Sustainability)

Abstract

:
Facing the increased frequency of disasters and resulting massive damages, many countries have developed their frameworks for disaster risk management (DRM). However, these frameworks are highly regional and few of them suggest corresponding methods for specific analysis content, which makes them less practical and operational. In this paper, we investigate an exploratory framework for spatio-temporal distribution of disasters and analysis of influencing factors, including suggested methods for all the content. Time series analysis, geographical difference analysis, direction distribution analysis, and spatial autocorrelation analysis are selected as the content of spatio-temporal distribution of disasters part. Mann–Kendall test method, Lorentz curve, standard deviation ellipse method, and exploratory spatial data analysis method are introduced to analyze them. The impact analysis part was carried out on individual disaster and multiple disasters, which are suggested as the two aspects of influencing factors analysis, by means of a geographic detector and a novel comprehensive impact evaluation model that was developed. Then, the framework is applied to analyze disasters including flood, storm surge, and earthquake in Tianjin of China. The research results help to understand the spatial and temporal distribution of disasters and the disaster mechanism in Tianjin. Further, the superiority and limitations of the framework are discussed. Finally, the framework developed is expected to be widely applied in other districts for better DRM in the future.
1. Introduction

Frequent disasters have posed great challenges to urban security. Disaster is a kind of complicated random event, which is formed under the joint action of multiple conditions [1,2,3,4]. Cities are susceptible to the comprehensive effects of multiple disasters [5]. Disasters in cities have a high intensity of damage, demanding the formulation and implementation of innovative advanced prevention strategies for disaster risk management (DRM) and disaster risk reduction (DRR) [6].
National frameworks for disaster management have been developed in many states around the word, like United States of America [7] and Germany [8], which have regulated the response to all types of disasters. In the same regard, some regional frameworks have been proposed and applied in the Andean countries [9]. Europe also has made great progress in establishing a legal framework for better DRM [10]. In recent years, simulation-based disaster frameworks that consider the spatial and temporal aspects of the problem have gradually been paid attention to by scholars [11,12,13,14], which is a useful supplement to the research of disaster prevention and mitigation framework.
However, each of these frameworks is usually regional, and different frameworks have different analytical priorities. Few of these frameworks suggest corresponding methods for specific analysis content, which makes them less practical and operational. In addition, few frameworks emphasize the content of spatial and temporal distribution and influencing factors of disasters. In fact, understanding these two aspects is the foundation of disaster management. Therefore, it is of great significance to establish an analysis framework for temporal and spatial distribution and influencing factors of disasters, including content dimensions and suggested methods. The following is a review of the spatial and temporal distribution rules and influencing factors of disasters, laying a foundation for the framework proposed in this paper.
At present, the research on the temporal and spatial distribution of disasters mainly focuses on the specific disaster in specific regions, providing a relatively macro analysis of the spatial distribution of local disasters. Some progress has been made in the study of temporal and spatial distribution of flood disasters. Llasat et al. (2014) statistically analyzed the spatial and inter-annual distribution laws of mountain flood disasters in Catalonia during 1981 and 2010 and the evolution laws of rainfall trends in this region [15]. Saharia et al. (2017) divided the United States into six climatic zones and discussed the temporal and spatial distribution of flood disasters in each climatic zone [16]. Based on multi-criteria analysis and artificial neural network (ANN) technology, Kourgialas and Karatzas (2017) studied the distribution of flash flood on a nationwide scale and predicted the trend of the disaster [17]. According to the national disaster database in China, Li et al. (2016) analyzed the spatial and temporal distribution of mountain flood disasters in Africa and studied the spatial distribution pattern of average annual flood frequency, total death toll, total affected people, and losses [18]. Taking New Orleans as an example, Masozera et al. (2007) studied the impact of the distribution of disasters on income groups, showing that Hurricane Katrina caused severe flooding in most communities of New Orleans. The spatial and temporal distribution of earthquake and storm surge disasters has also been well studied [19]. Shi et al. (2015) analyzed the annual variation and geographical distribution of the direct economic losses and casualties of storm surges in China’s coastal areas [20].
In terms of the research on influencing factors of disasters, scholars have made big positive progress. Here, we will carry out a literature review from the research on the influencing factors of flood disaster, earthquake disaster, and storm surge disaster. In terms of flood disasters, Groisman et al. (2004) argued that hydrological and meteorological conditions and social and economic development are the main factors that induce mountain flood disasters, pointing out that climate change and economic development will increase the frequency and severity of flash flood [21]. Pande (2010) found that the formation mechanism of a flash flood is complex, and the rainstorm is the main inducer of the outbreak of a flash flood [22]. Zielinski. (2003) found that heavy rainfall with a maximum intensity of 25 mm/h was the main inducer of floods by studying floods in a specific research area for 2 consecutive years [23]. Based on the study of typical mountain flood disasters in southern France near the Mediterranean Sea, Vinet (2008) pointed out that the maximum precipitation of more than 500 mm within 24 h was the main reason for mountain flood disasters [24]. In the aspect of the research on the influence factors of earthquake disaster, Zhuang et al. (2019) proposed a risk assessment method for seismic disasters based on peak ground acceleration (PGA), earthquake-induced landslides, and their impact on population. Meanwhile, a quantitative map of seismic hazard risk in the study area was established based on the values of seismic factors, population, and landslide hazard risk factors [25]. You and Jiang. (2013) used the systematic clustering method to analyze the main impact factors of storm surge, including beach width, slope, sand, tidal levels, elevation, typhoon frequency, and land use to complete the risk zoning of storm surge [26]. According to the characteristics of storm surge disaster in the coastal plain, Chen et al. (2019) used a refined numerical model of flood plain, which combines typhoon, flood, astronomical tide, and wave, to simulate the inundation process. The model also takes into account the impact of levee breaches, micro-topography, and buildings [27].
The above literature review is helpful for the content of our new framework and corresponding suggested methods. Our work is devoted to solving two problems: one is to provide a framework for spatio-temporal distribution and influencing factors; the other is to improve the universality and operability of the framework, providing the specific content and suggested analysis methods. Our work is developed as follows: In Section 2, we introduce in detail the process of building the framework, including spatial and temporal distribution of disasters and impact analysis on disasters from factors. In Section 3, the framework is applied to a case city to reveal its spatial-temporal distribution of multiple disasters, the driving force of factors on each disaster, and the comprehensive impacts on multiple disasters. In Section 4, the rationality and superiority of the comprehensive impact evaluation model (CIEM) proposed is tested and explained. Meanwhile, the superiority and limitation of the framework are discussed. Finally, the conclusions are presented.

2. Framework Development

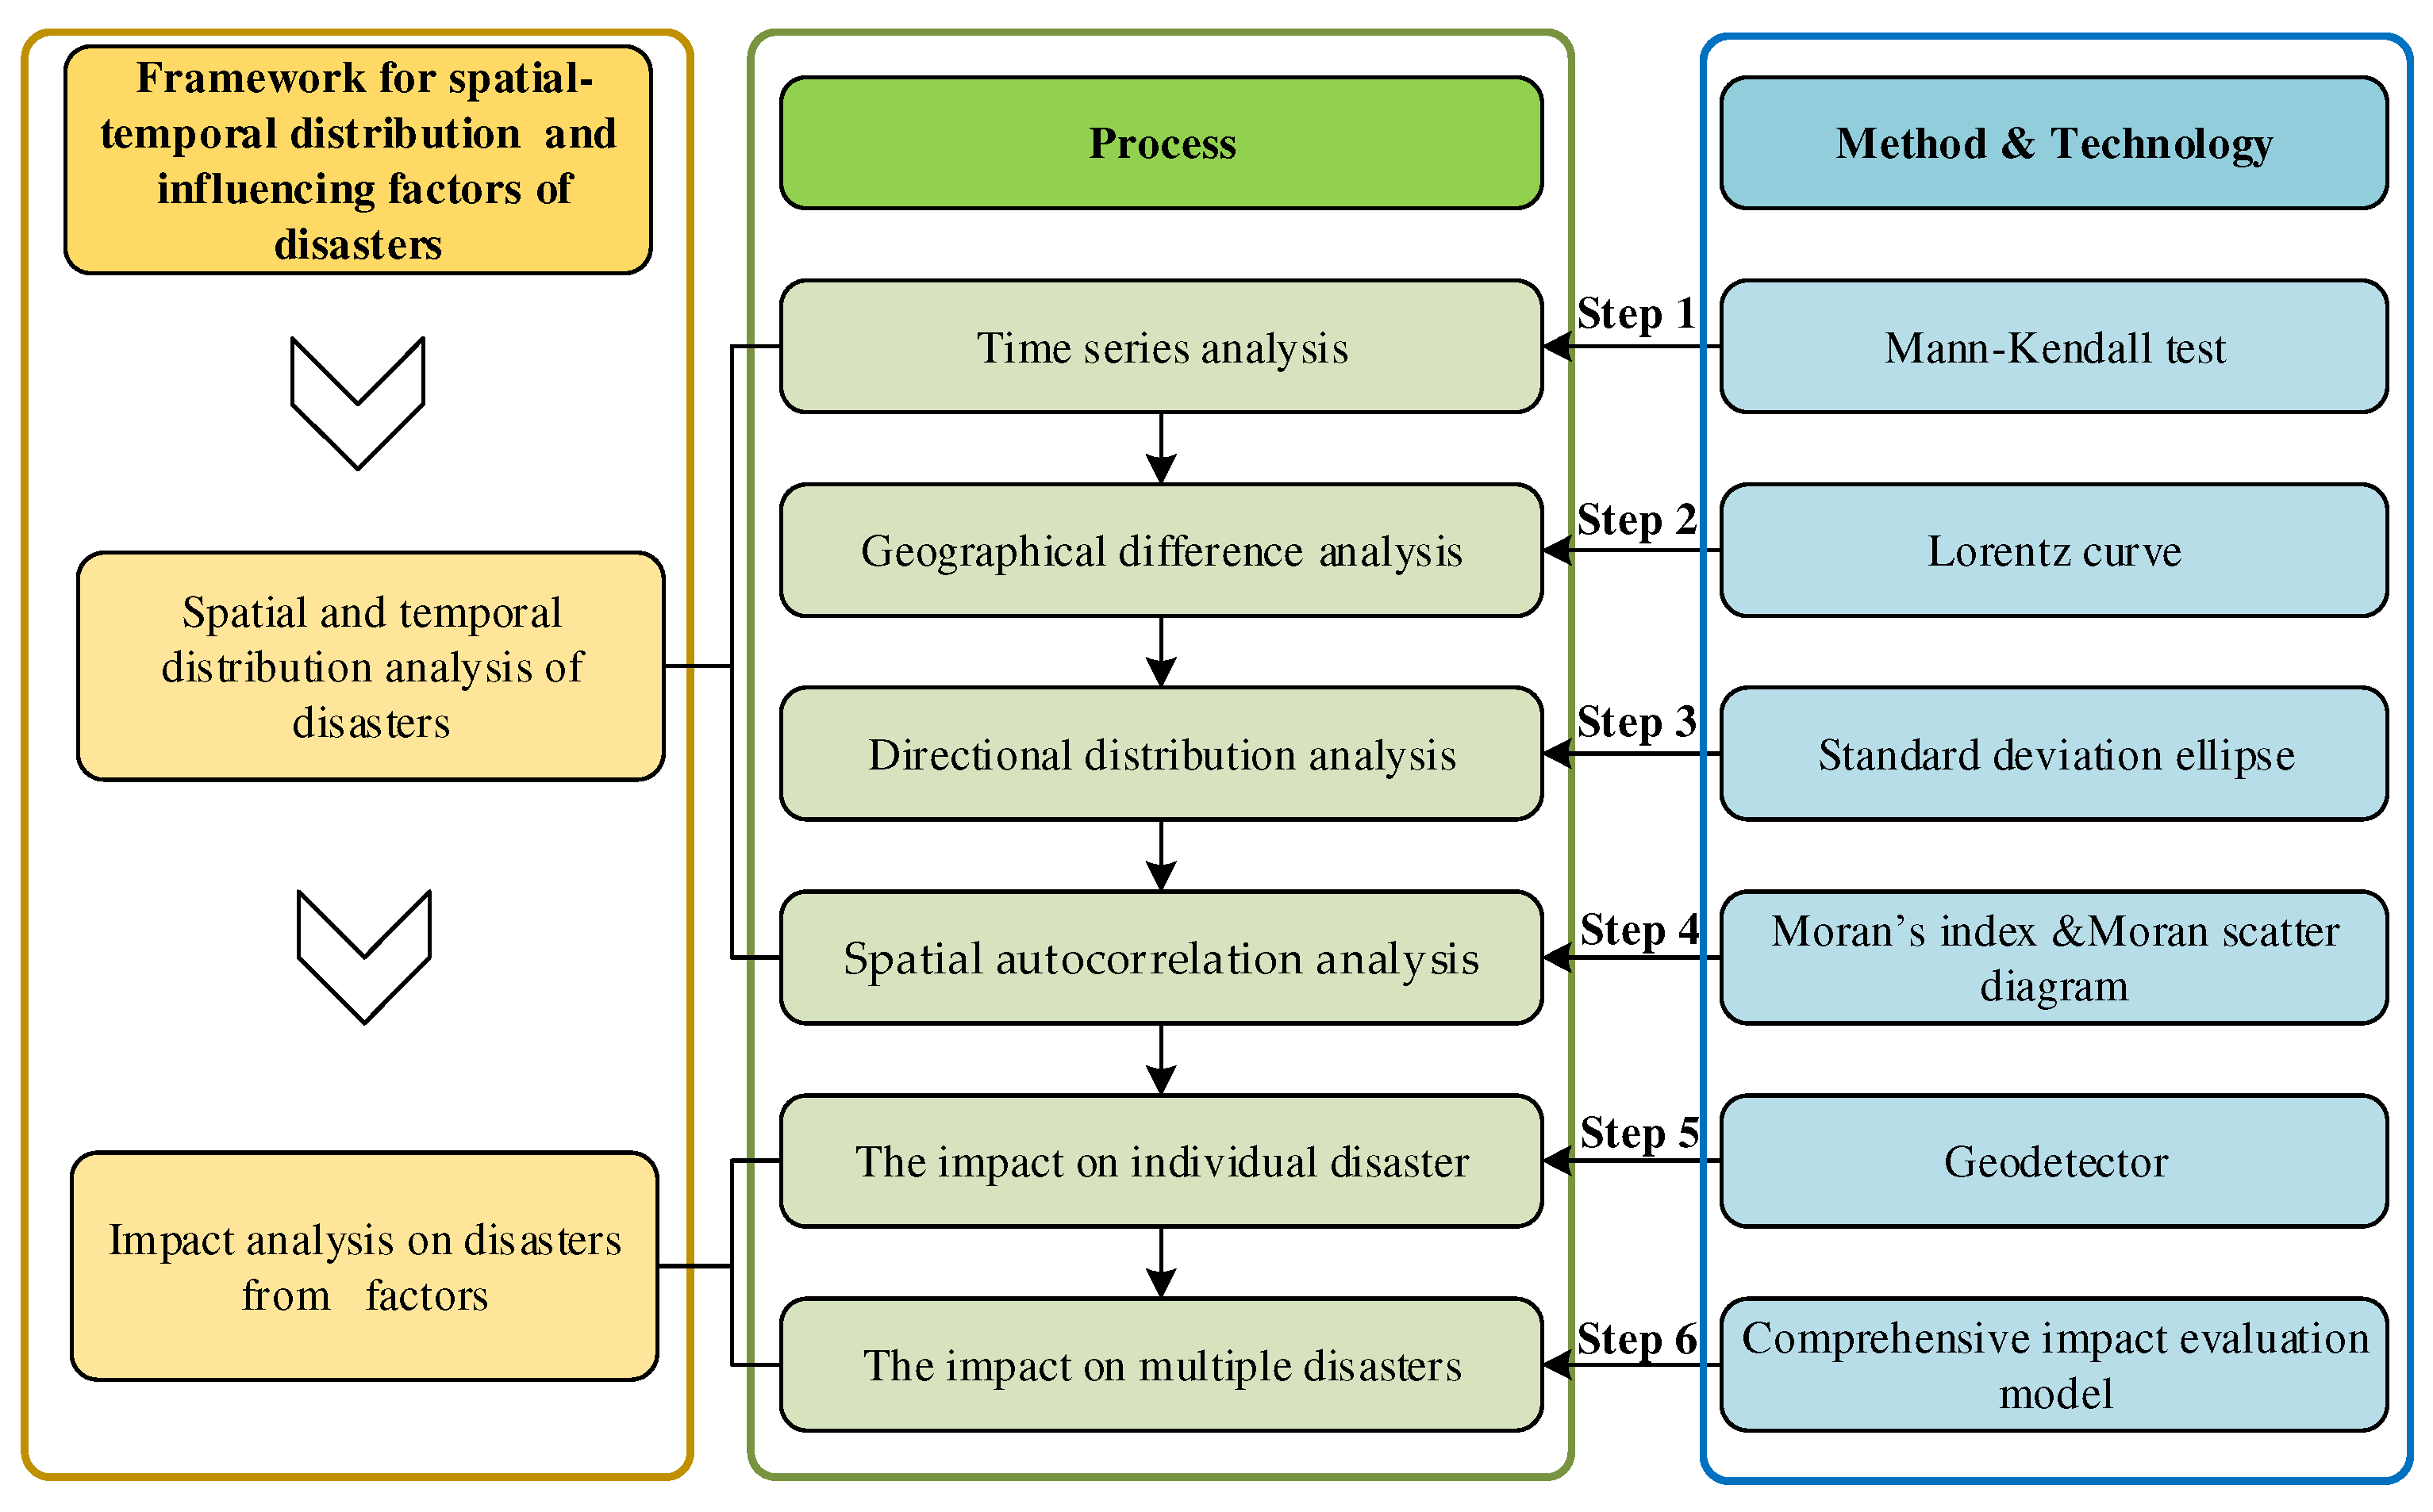
To solve the problem of spatio-temporal distribution and influencing factors analysis of disasters, a universal and novel framework for the content is developed. The framework consists of two modules like spatial and temporal distribution of disasters and impact analysis on disasters from factors (Figure 1), which gives the analysis content and the corresponding suggested method, contributing to good practicability and maneuverability. Based on the literature summary, time series analysis, geographical difference analysis, direction distribution analysis, and spatial autocorrelation analysis are selected as the content of first module. Meanwhile, an impact analysis is carried out on individual disaster and multiple disasters, which are introduced as the two aspects of the second part. Moreover, the corresponding methods for the relevant content are suggested. The framework is described in detail as follows.

2.1. Spatial and Temporal Distribution of Disasters

2.1.1. Step 1: Time Series Analysis

It is of great significance for disaster risk management to explore the evolution of disasters over time and whether there are sub-stages with distinct trends in one overall stage. Mann–Kendall test is a widely used non-parametric method in analyzing the trend of time series data [28]. Therefore, this method is introduced for time series analysis of disasters in this study. The specific quantification process is as follows:
X (x1, x2, …, xn) is the temporal distribution of disaster. A statistical parameter Sk is defined as:
S k = i = 1 k r i k = 1 , 2 , , n  
r i = 1 , x i > x j 0 , x i < x j j = 1 , 2 , , i  
Under the assumption of random independence of time series, the mean and variance of Sk can be calculated by Equations (3) and (4), respectively.
E S k = k ( k 1 ) / 4
var S k = k ( k 1 ) ( 2 k + 5 ) / 72 , 1 k n
The standardized statistic UFk is calculated as Equation (5)
U F k = ( S k E S k ) var S k
where n is the number of time series data. The above method refers to the opposite sequence, making UBk = −UFk. The null hypothesis of no trend is rejected if |UFk| > 1.96 at 5% significance level. If the value of UFk is greater than 0, it indicates that the sequence has an upward trend; less than 0 indicates a downward trend. When it exceeds a critical straight line, it indicates a significant upward or downward trend. An intersection of two curves (UFk and UBk) located within confidence intervals indicates a significant mutation point.

2.1.2. Step 2: Geographical Difference Analysis

It is of important reference value for the formulation of regional disaster risk management policies to understand the difference rules of spatial distribution of disasters among different analysis objects and clarify the balance of spatial distribution of historical disasters in different analysis units.
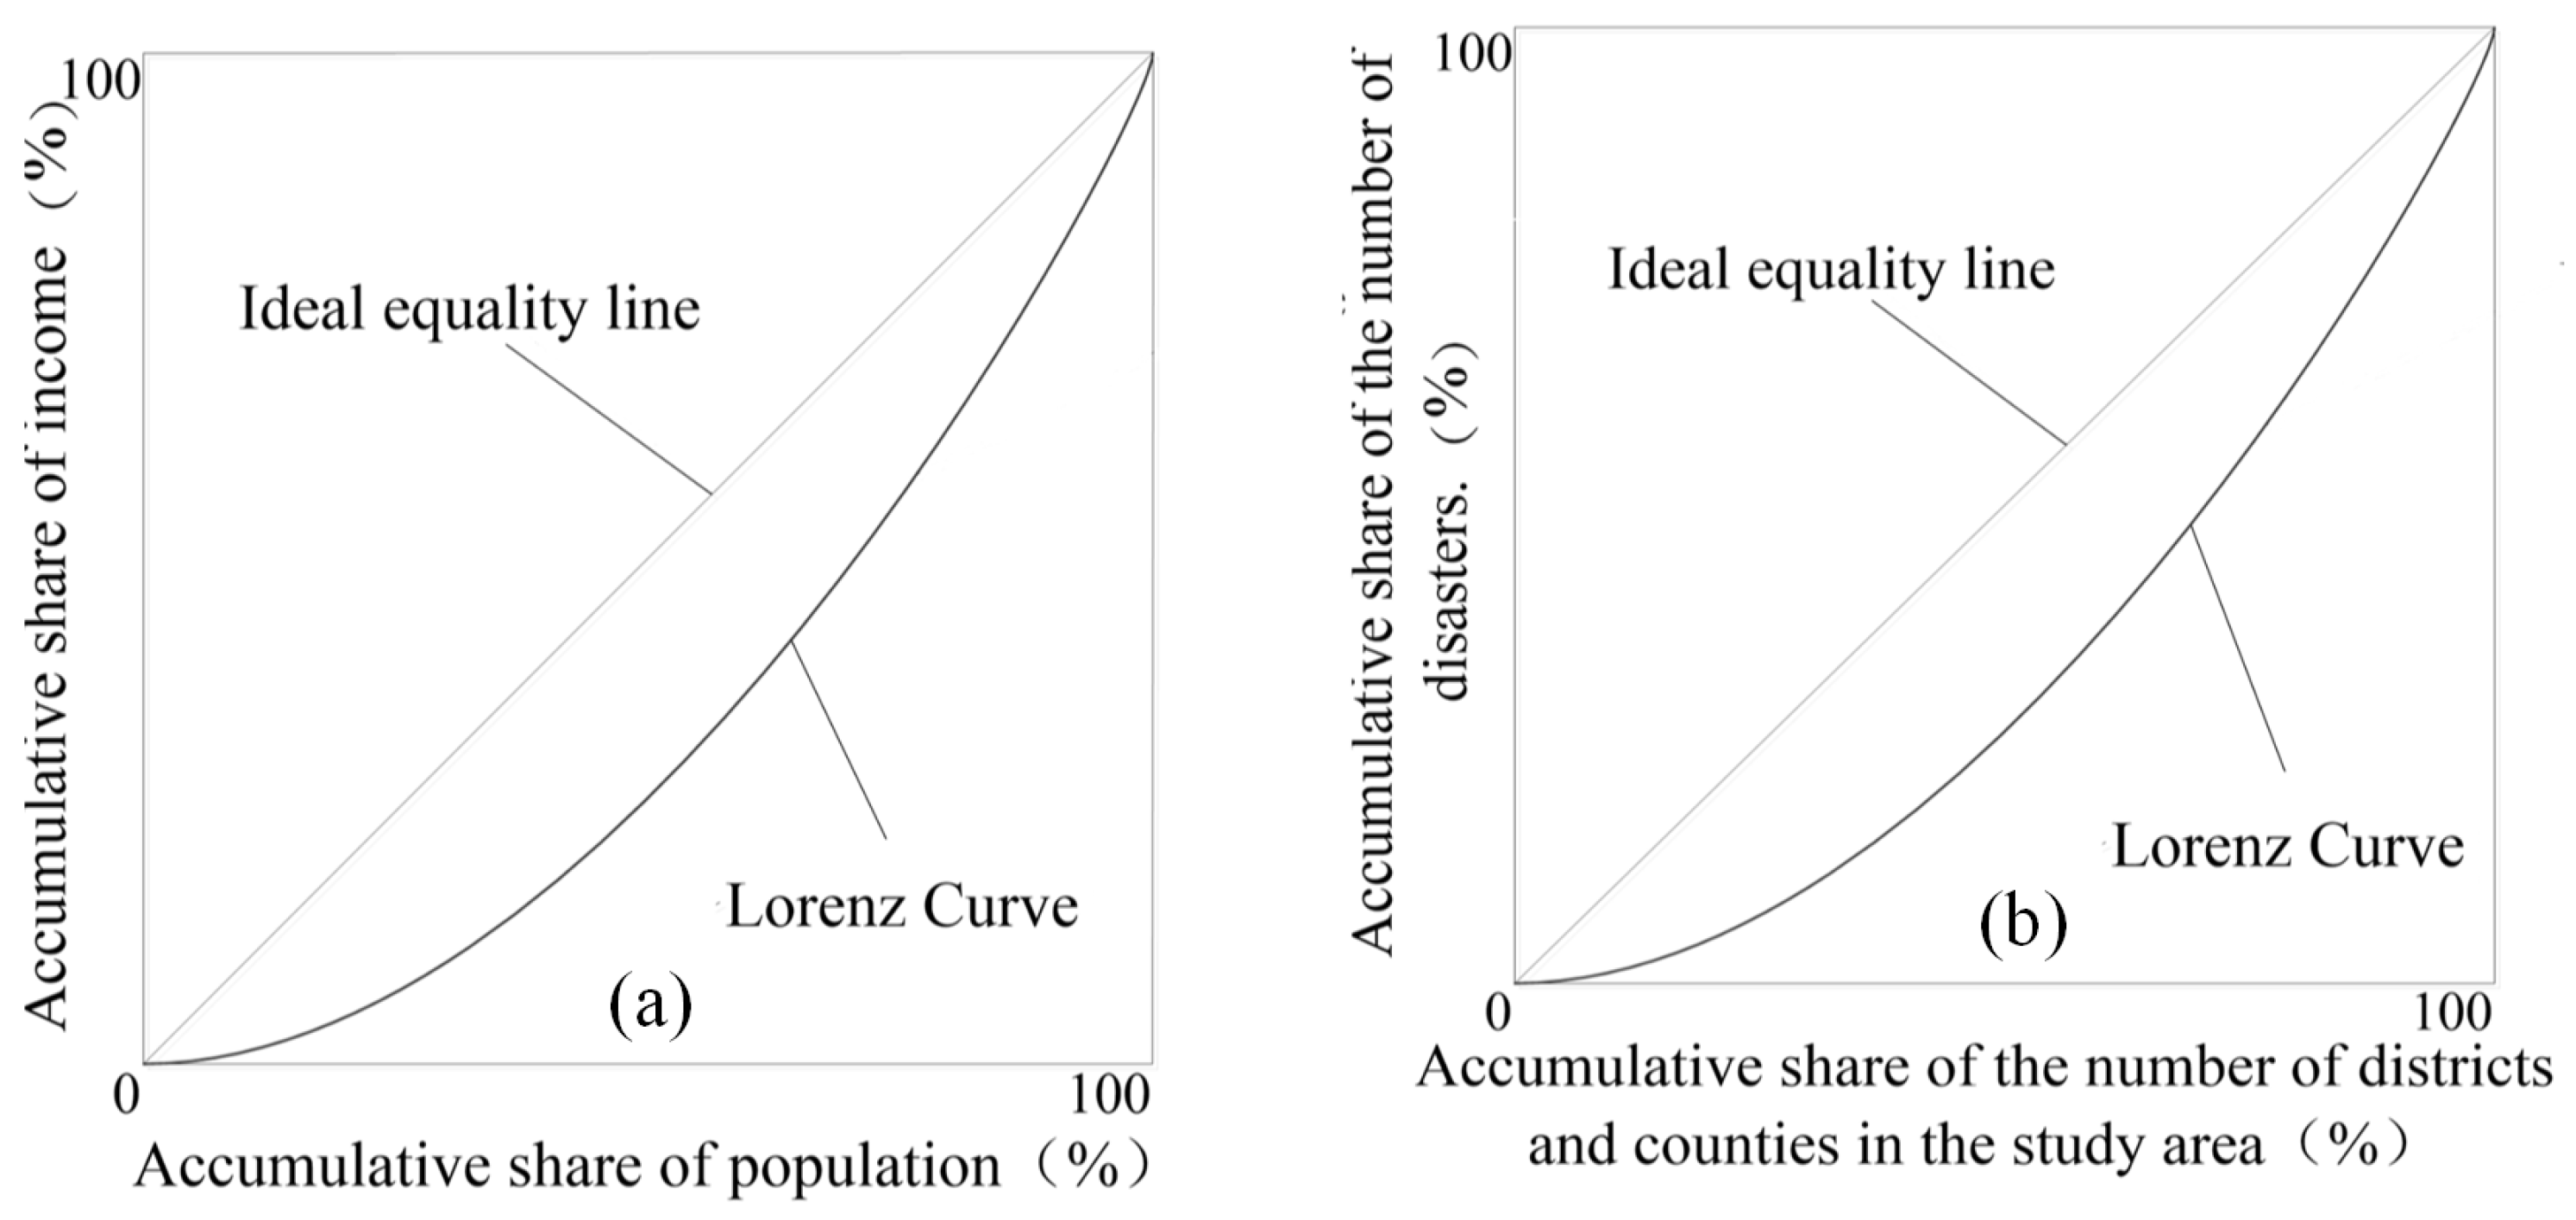
Inspired by the fact that the gap between the rich and the poor in economics can reflect the balance of economic development in different regions, this study introduces a Lorenz curve in economics to represent the balance of spatial distribution of historical disasters. Lorenz curve is used to compare and analyze the wealth inequality of a country in different times or different countries at the same time [29]. It has a curve of the percentage of the population from poorest to richest corresponding to the income percentage of each percentage of the population (Figure 2), which directly tells the status of equal or unequal income distribution in a country. The greater curvature implies less equilibrium of income distribution and vice versa. In this study, a Lorenz curve is introduced into the analysis of the distribution equilibrium of disasters. The horizontal axis is the cumulative frequency of the number of districts in the study area, and the vertical axis is the cumulative frequency of the number of disasters. Then, the Lorenz curves for various disasters can be obtained.

2.1.3. Step 3: Direction Distribution Analysis

For a specific study area, identifying the main distribution direction trend and distribution range of disasters can provide valuable reference information for disaster risk management in this region. Therefore, it is necessary to analyze the direction distribution of disasters. The standard deviation ellipse method can be used to explain the spatial characteristics of central, discrete, and directional trends of disaster events [30], which is introduced to the framework. The methods are described as follows: The standard deviation of the long axis, the standard deviation of the short axis, and the rotation angle θ are the basic elements of the standard deviation ellipse. In general, the long axis of an ellipse represents the direction of its maximum dispersion, while the short axis represents the direction of its minimum dispersion. The standard deviation ellipse method is introduced to do the direction distribution analysis here. The specific quantification process is as follows:
The standard deviation ellipse center is calculated as Equations (6) and (7):
S D E x = i = 1 n ( x i X ¯ ) 2 n
S D E y = i = 1 n ( y i Y ¯ ) 2 n
where, xi and yi represent the spatial coordinates of the disaster location i, respectively; X ¯ , Y ¯ represents the weighted mean center of the spatial data set of disaster location; and n represents the total number of analytical units.
The rotation angle is calculated as:
tan θ = A + B C
A = ( i = 1 n x ˜ i 2 i = 1 n y ˜ i 2 )
B = ( i = 1 n x ˜ i 2 i = 1 n y ˜ i 2 ) 2 + 4 ( i = 1 n x ˜ i y ˜ i ) 2
C = 2 i = 1 n x ˜ i y ˜ i
where x ˜ i and y ˜ i are the coordinate deviation from the spatial coordinates of disasters to the mean center.
The standard deviation of the X-axis:
σ x = 2 i = 1 n ( x ˜ i cos θ y ˜ i sin θ ) 2 n
The standard deviation of the Y-axis:
σ y = 2 i = 1 n ( x ˜ i sin θ + y ˜ i cos θ ) 2 n

2.1.4. Step 4: Spatial Autocorrelation Analysis

Spatial autocorrelation expresses the interdependence of different variables in the same region, through which reveal the spatial correlation of disasters. Exploratory spatial data analysis is a collection of a series of spatial analysis tools [31]. In this framework, the tools of exploratory spatial data analysis are suggested as the methods of spatial autocorrelation analysis of disasters.
By describing and visualizing the spatial distribution pattern of things or phenomena, it explores spatial agglomeration and spatial anomaly. Meanwhile it can explain the mechanism of spatial interaction among research objects. Exploratory spatial data analysis includes global and local spatial autocorrelation.
Global spatial autocorrelation is able to reflect the degree of correlation and difference of the whole study area in space. This study suggested Moran’s index of global space as the indicator for analyzing the spatial distribution of multiple disasters, and the formula is shown as Equation (14).
I = n i = 1 n j = 1 n w i j ( x i x ¯ ) ( x j x ¯ ) i = 1 n j = 1 n w i j i = 1 n ( x i x ¯ ) 2
where, I represents the Moran’s index, n represents the number of spatial analysis units, xi represents the disaster intensity value in spatial position i, xj represents the disaster intensity value in spatial position j, x ¯ represents the average value of disaster intensity in all spatial positions, and wij is the spatial weight matrix. The value range of I is [−1, 1]. When I is less than 0, it means that the spatial data is negatively correlated. When greater than 0, it means positive correlation. If it is equal to zero, it is irrelevant.
Moran’s index often uses standardized statistics Z to test whether spatial data (disaster intensity values) have spatial autocorrelation. The expression of Z is
Z = I E ( I ) V A R ( I )
where, Z is the statistical test quantity, E(I) represents the expected value, and VAR(I) represents the standard variance. When Z is greater than 0, this indicates that similar disaster intensity values tend to cluster in space. If Z is less than 0, this indicates that similar disaster intensity values tend to disperse in space. If Z is equal to 0, the disaster intensity value is spatially independent and randomly distributed.
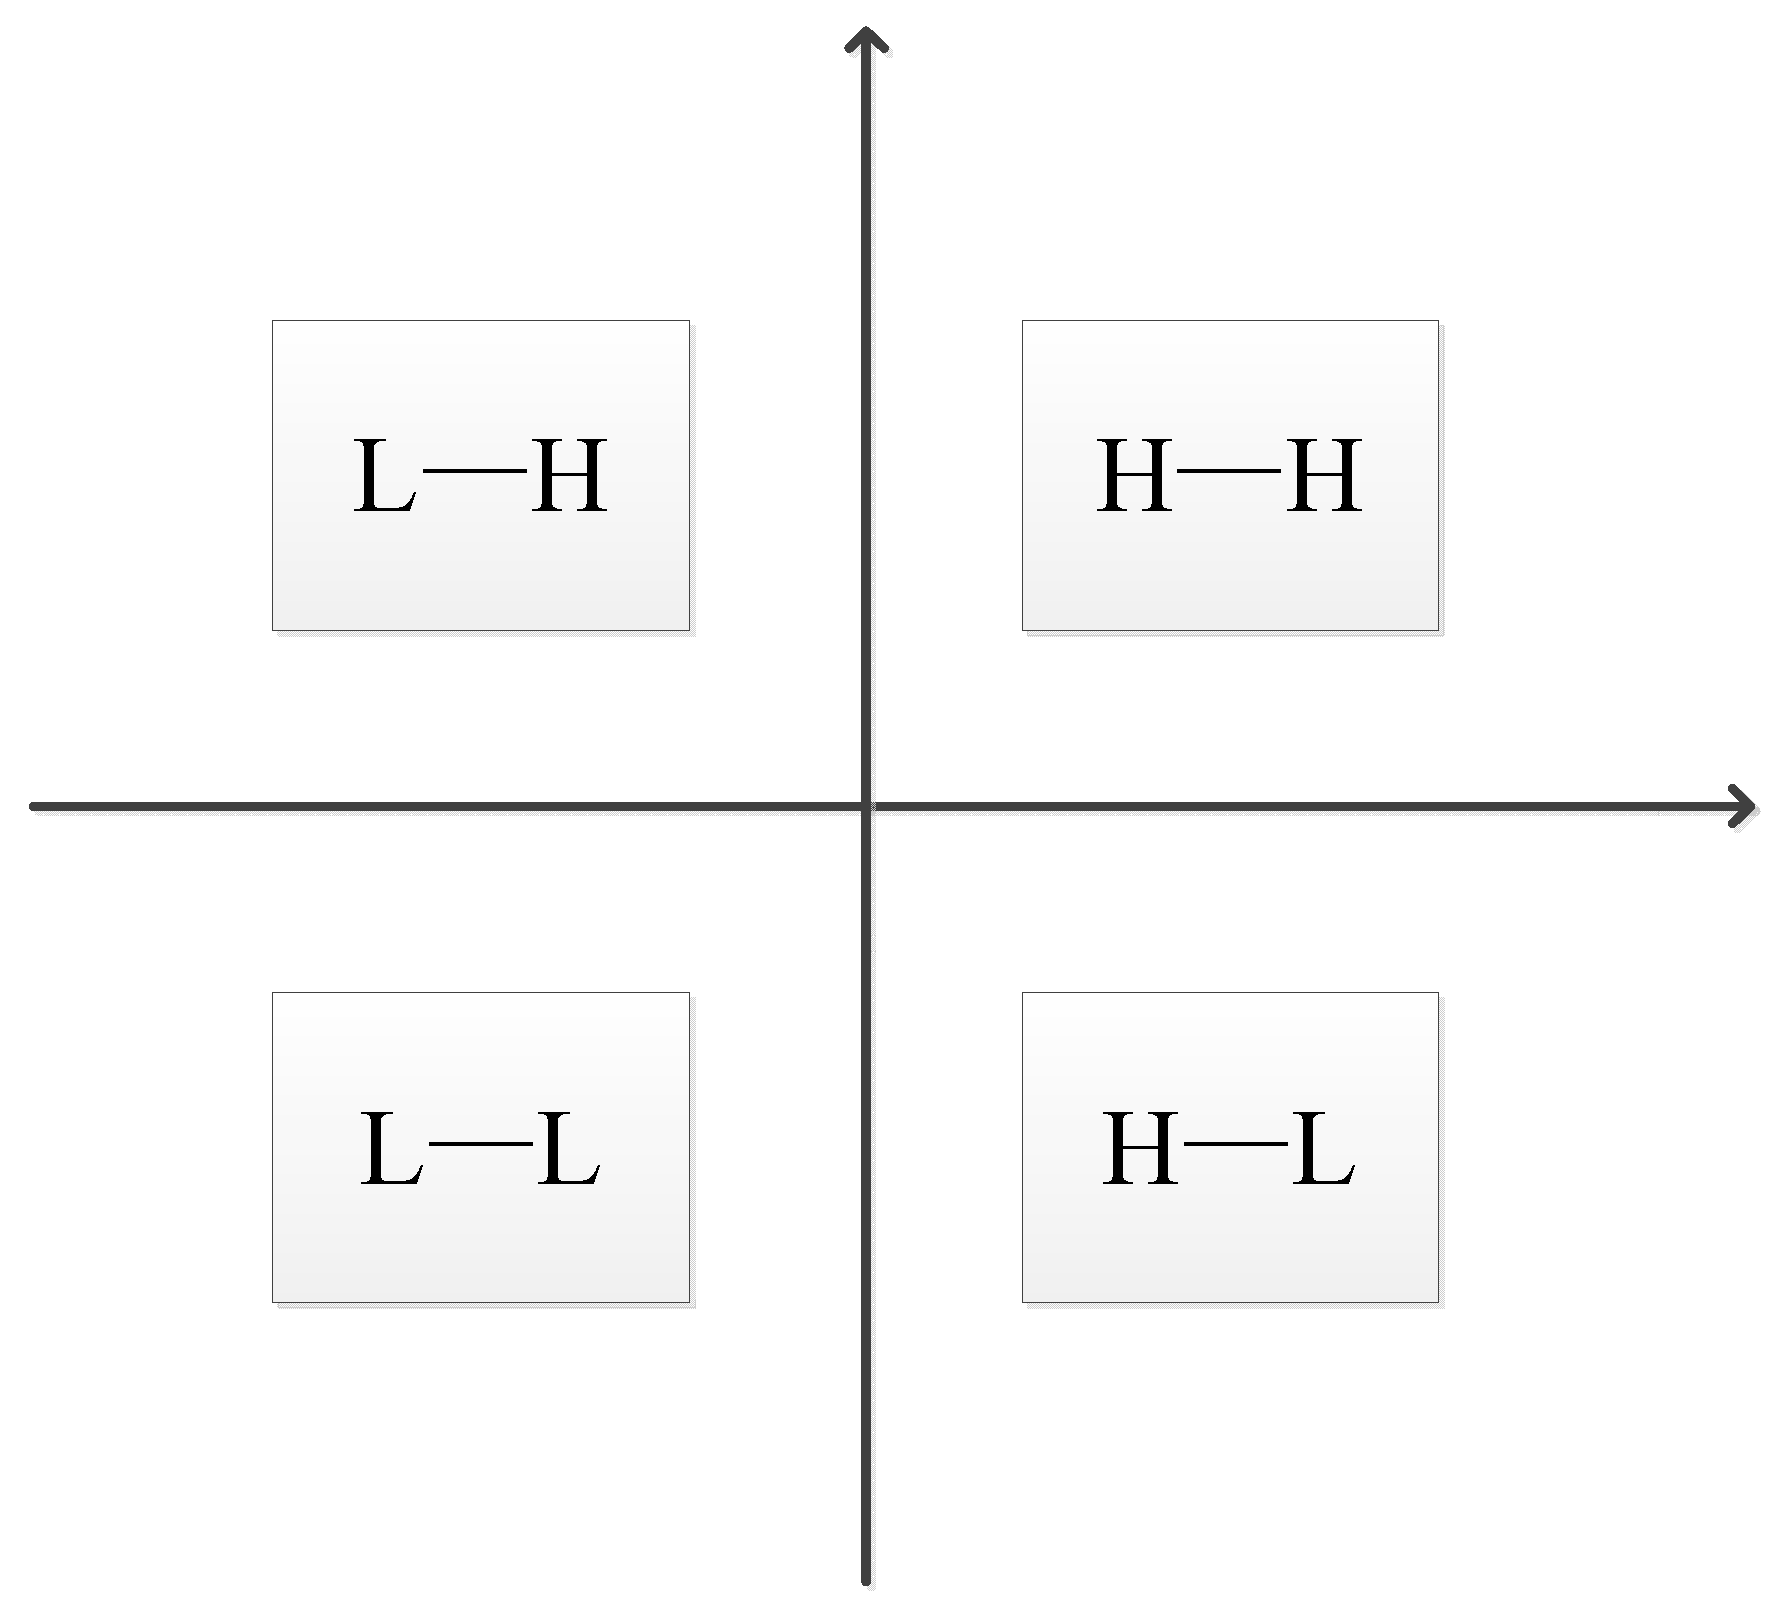
Global autocorrelation reveals regional global spatial dependence on the whole, while local spatial autocorrelation reflects the degree of correlation between adjacent regions around the local region. In this study, Moran scatter diagram was selected to conduct local autocorrelation analysis in the study area. Moran scatter graph represents the correlation between an attribute variable Z and its spatial lag vector wZ in the form of a scatter graph (Figure 3). The horizontal axis is Z, and the vertical axis is wZ. The Moran scatter diagram can be divided into four quadrants. The first quadrant represents the high-high correlation clustering pattern, indicating the distribution pattern in which high disaster intensity values are surrounded by high disaster intensity values. The second quadrant represents the spatial aggregation pattern of low-high correlation, which represents the distribution pattern of low disaster intensity surrounded by high disaster intensity. The third quadrant represents the low-low correlation spatial aggregation pattern, which represents the distribution pattern of low disaster intensity surrounded by low disaster intensity values. The fourth quadrant represents the high-low aggregation pattern, indicating the distribution pattern in which high disaster intensity values are surrounded by low disaster intensity values.

2.2. Impact Analysis on Disasters from Factors

The spatial and temporal distribution pattern of disasters provides decision-makers with a necessary reference for disaster prevention management, but the cause mechanism behind it will be more conducive to give decision-makers more accurate policy guidance. In recent years, the research on the cause mechanism of disasters has gradually become a hot spot. A series of methods have been developed and applied to explore the influence on disasters from factors, and many meaningful achievements have been achieved. However, in most of these studies, the methods to discuss the influence on disasters from factors involve some subjectivity. There are few researches on the cause mechanism of disaster by purely objective and quantitative methods.
In addition, most of these studies only judge the impact of each factor on a single disaster and rarely analyze the joint impact of each factor on multiple disasters from an overall perspective. As a matter of fact, multiple disasters often occur in the same region, and full discussion of the joint impact of various factors on multiple disasters is more conducive to the formulation of disaster-prevention policies. Therefore, we analyze the impact on individual disaster and the joint impact on multiple disasters from factors through objective assessment method.

2.2.1. Step 5: The Impact Analysis on Individual Disaster

In order to objectively reveal the impact of different factors on individual disaster, this paper introduces geographic detector to our work. Geographic detector is a new statistical method that can detect spatial heterogeneity and reveal the driving force behind a phenomenon. It is a spatial variance analysis tool first developed by Wang et al. (2010) [32]. It is first used to assess the relationship between risk factors and human diseases. The tool’s core idea is the assumption that if one variable has a significant effect on a dependent variable, then the two variables will have a similar spatial distribution. Factor detector and interaction detector are two tools in the geographical detector. The factor detector can be used to detect the driving force of disaster from each factor. The principle is to compare the sum of dispersion variance from every sub-region with that of the entire region, while the interaction detector is able to identify the total contribution of two variables to the distribution of the dependent variable.
In this study, the following two detectors were introduced to reveal the influence on individual disasters from factors.
(1) Factor detector: to detect the spatial differentiation of Y and probing to what extent a factor X explains the spatial differentiation of the attribute Y. The q value is proposed to measure correlation results. The q-statistic is calculated as Equations (16) and (17):
q = 1 h = 1 L N h σ h 2 N σ 2 = 1 S S W S S T
where the within sum of squares and the total sum of squares is calculated as Equation (17).
S S W = h = 1 L N h σ h 2 ,   S S T = N σ 2
where h = 1, 2, …, L is the stratification of impact factor X; Nh is the number of analysis units of layer h; N is the number of analysis units in the whole research area; σ h 2 is the variance of disaster intensity in layer h; and σ2 is the global variance of disaster intensity in the study area. The range of q is [0, 1]. The larger the value of q, the stronger the explanatory power of the impact factor X on the spatial distribution of disaster intensity Y is, and vice versa.
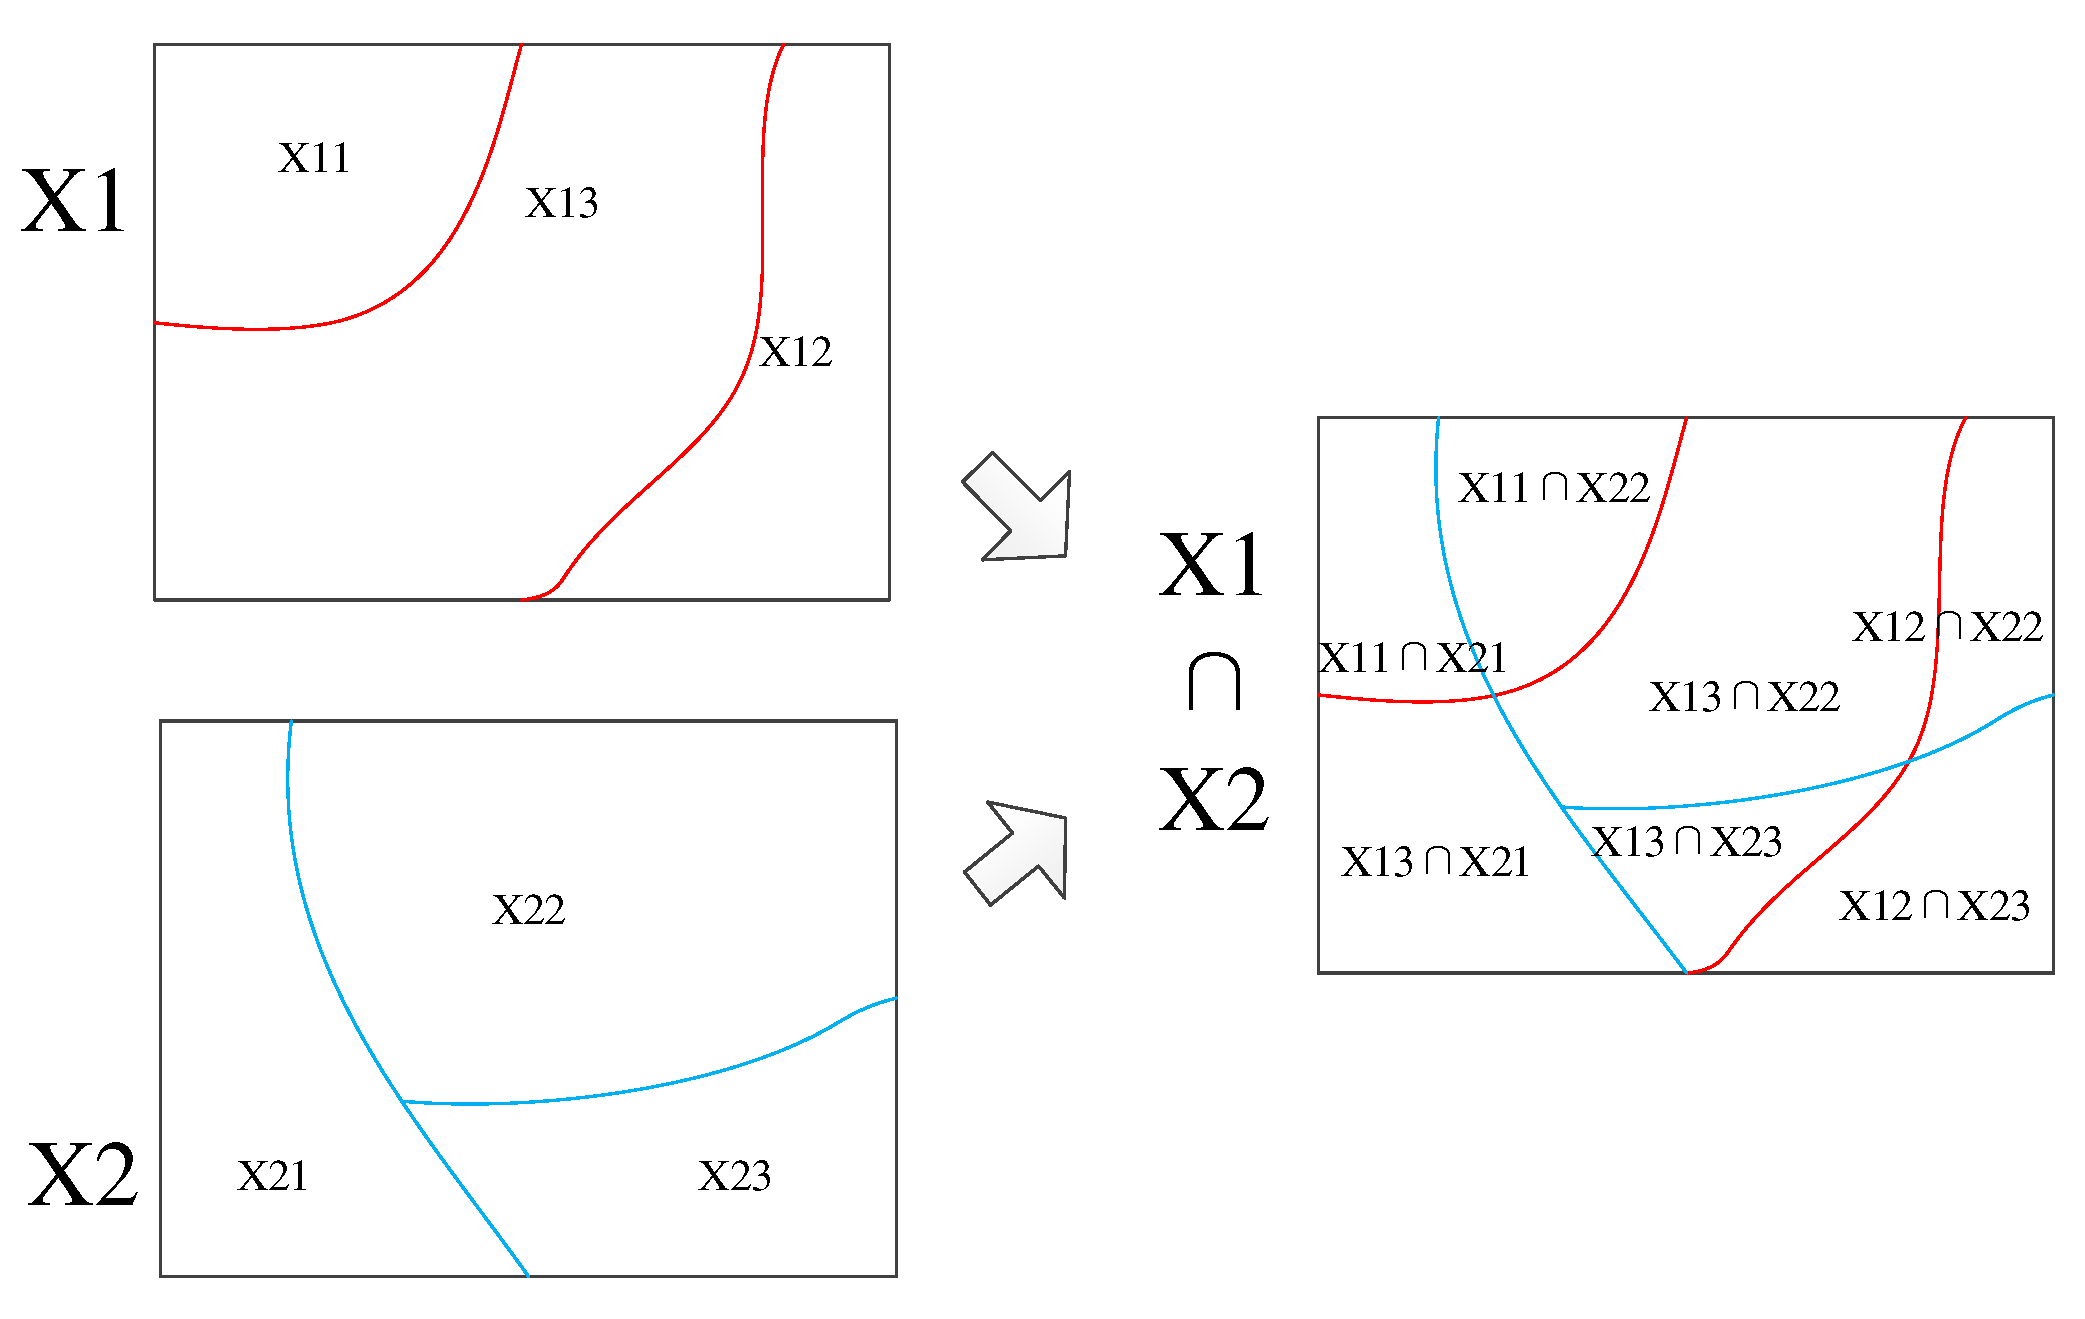
(2) Interaction detector: it is able to identify the interaction between various factors, whether the combined action of impact factors X1 and X2 will increase or weaken the explanatory power of the spatial distribution of disaster intensity Y, or whether the effects of these factors on Y are independent of each other can be explained by the interaction detector. Its specific principle is shown in Figure 4.The interaction types are as follows: if q(X1X2) < min(q(X1),q(X2)), the interaction results show nonlinear weakening; if min(q(X1),q(X2)) < q(X1X2) < max(q(X1),q(X2)), the interaction results show a single factor nonlinear weakening; if q(X1X2) > max(q(X1),q(X2)), it shows a two-factor enhancement; if q(X1X2) = q(X1) + q(X2), the two independent variables are independent; and if q(X1X2) > q(X1) + q(X2), it shows nonlinear enhancement.

2.2.2. Step 6: The Impact Analysis on Multiple Disasters

Since multiple disasters often occur in one region, it is of great significance to study the combined effects of various factors on multiple disasters. The traditional comprehensive effect evaluation only carries on the simple weighted sum. In fact, the barrel theory argued that how much water a bucket can hold depends on its shortest piece of board [33]. Similarly, the comprehensive impact of the same factor on multiple disasters should fully consider the different impacts of the factor on different disasters. Here, we introduce an inhomogeneity coefficient to characterize the short board effect of each factor on multiple disasters. A comprehensive impact evaluation model is proposed based on the barrel theory. The specific quantification process is as follows:
H i j = C i j i = 1 n U i j
C i j = 1 + 1 i = 1 n U i j i = 1 n U i j n n n
where Hij is the comprehensive impact index corresponding to the category j impact factors of the category i disaster. Cij is the comprehensive impact coefficient corresponding to the category j impact factors of the category i disaster. The value of the Cij is between [1, 2]. When the value of Cij is 1, it indicates that the influence degree of this impact factors on various disasters is balanced. The greater the value of Cij, the more uncoordinated the influence on various disasters. Uij represents the standardized weight value corresponding to the influence factors of category j of category i disaster.

3. Framework Application

3.1. Study Area

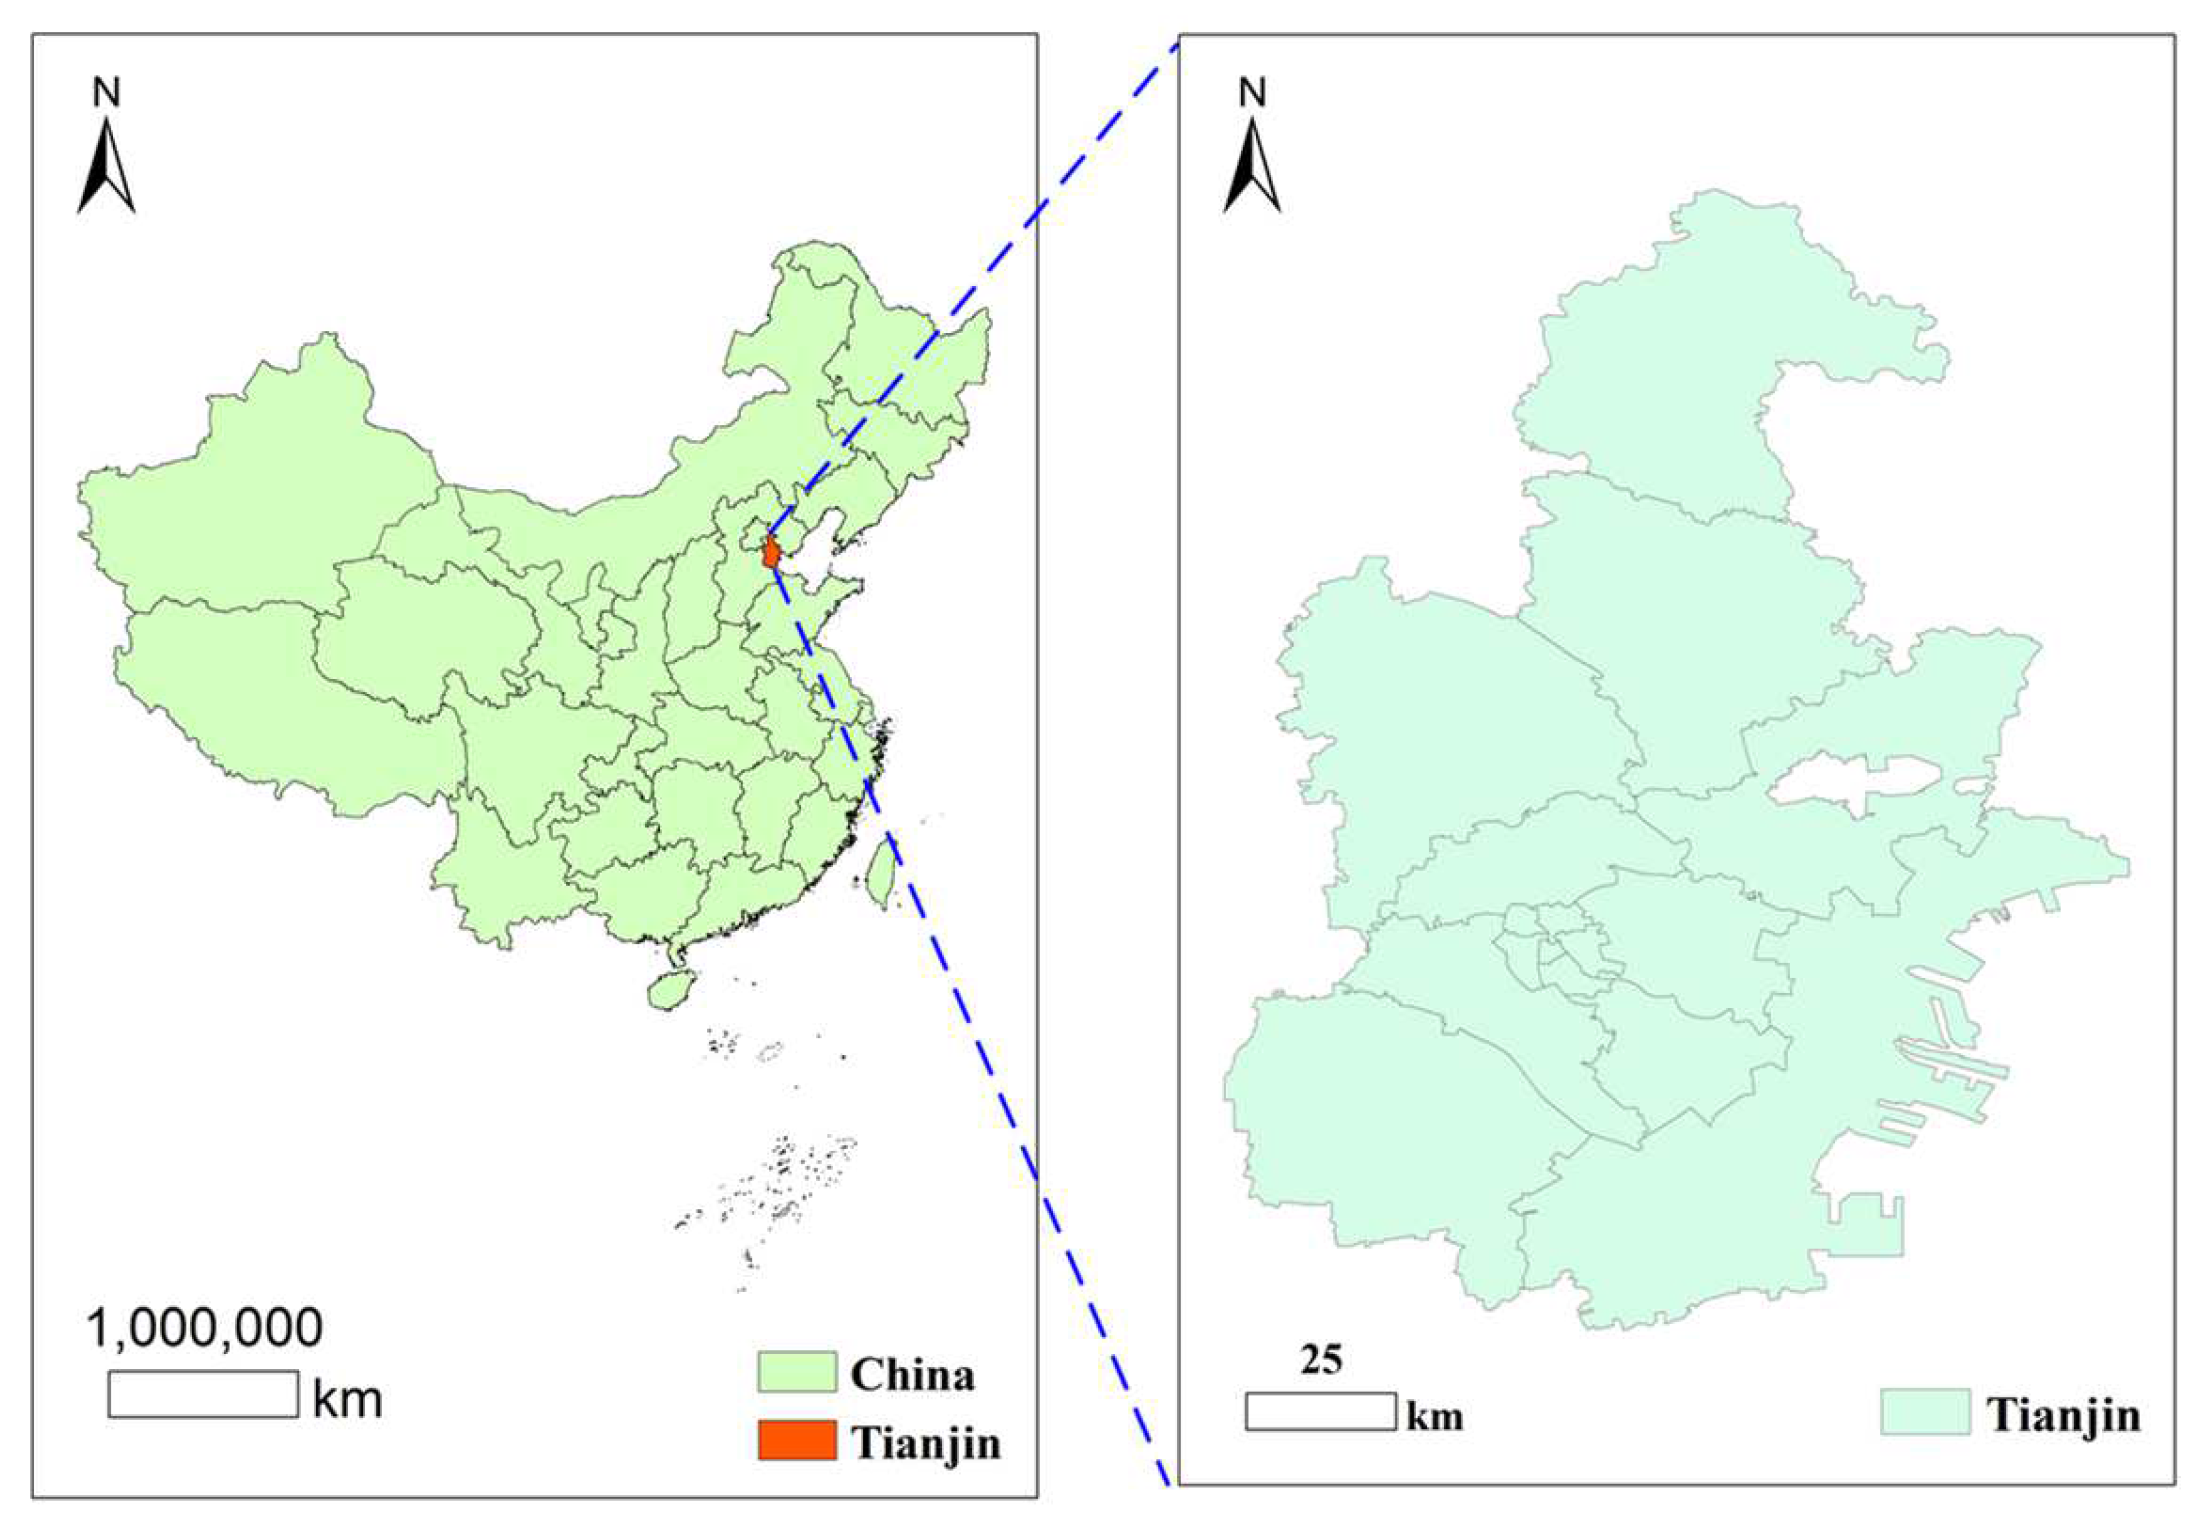
Tianjin is the largest port city in northern China (Figure 5). It is the economic center of Bohai Rim region with superior geographical location and huge development potential. However, the disasters like flood, earthquake, and storm surge disaster in this region have caused huge damage to facilities and human life. In 2016, flood disasters caused 143,000 people to be affected, 16,000 houses collapsed, and 250 million yuan economic losses. A 7.8-magnitude earthquake hit Tianjin in 1976, killing more than 110,000 people and causing economic losses of 7.5 billion yuan. In 2004, the storm surge disaster affected more than 500 people and caused economic losses of more than 10 million yuan. Consequently, it is of great significance for disaster prevention and mitigation here to fully understand the spatio-temporal distribution of disasters and the related impact factors. Consequently, the framework developed above is applied to the study area.

3.2. Input Data

Due to the abundant disaster-causing factors, Tianjin has many disasters, especially like floods, earthquakes, and storm surges. Based on literature summary [34,35,36,37], the relevant influencing factors of the above three disasters were preliminarily selected, and considering the availability of data in the study area, the analysis indexes of flood, earthquake, and storm surge were finally selected.
Rainfall, elevation, slope, soil type, land use type (LU), vegetation cover (VC), drainage density (DD), population (POP) and gross domestic product (GDP) were selected as the impact factors of flood disaster. Population (POP), elderly population, thousand hospital beds (THB), gross domestic product (GDP), secondary geological disasters (SGD), elevation, slope, soil type, and land use type (LU) were selected to analyze the impact factors of earthquake disaster events [34,35,36,37]. Based on previous research on storm surge disaster [34,35,36,37], the coastal storm surge disaster in Tianjin is mainly related to meteorology, astronomical tide (AT), geographical location (GL), elevation, slope, soil type, land use type (LU), population (POP) and gross domestic product (GDP). Data sources and explanations are shown in Table 1.

3.3. Results

3.3.1. Spatial and Temporal Distribution of Disasters Results

Time Series Analysis of Disasters

Based on the historical disaster data of floods, earthquakes, and storm surges in Tianjin, a statistical comparison was made according to their occurrence months. The temporal variation of each disaster is shown in Figure 6. The comparison results showed that the flood disasters mainly occurred in June to August, and the most flood disasters occurred in July. The occurrence of earthquake disasters is relatively random, without obvious periodic change. Storm surge disasters mainly occur in spring, summer, and autumn.
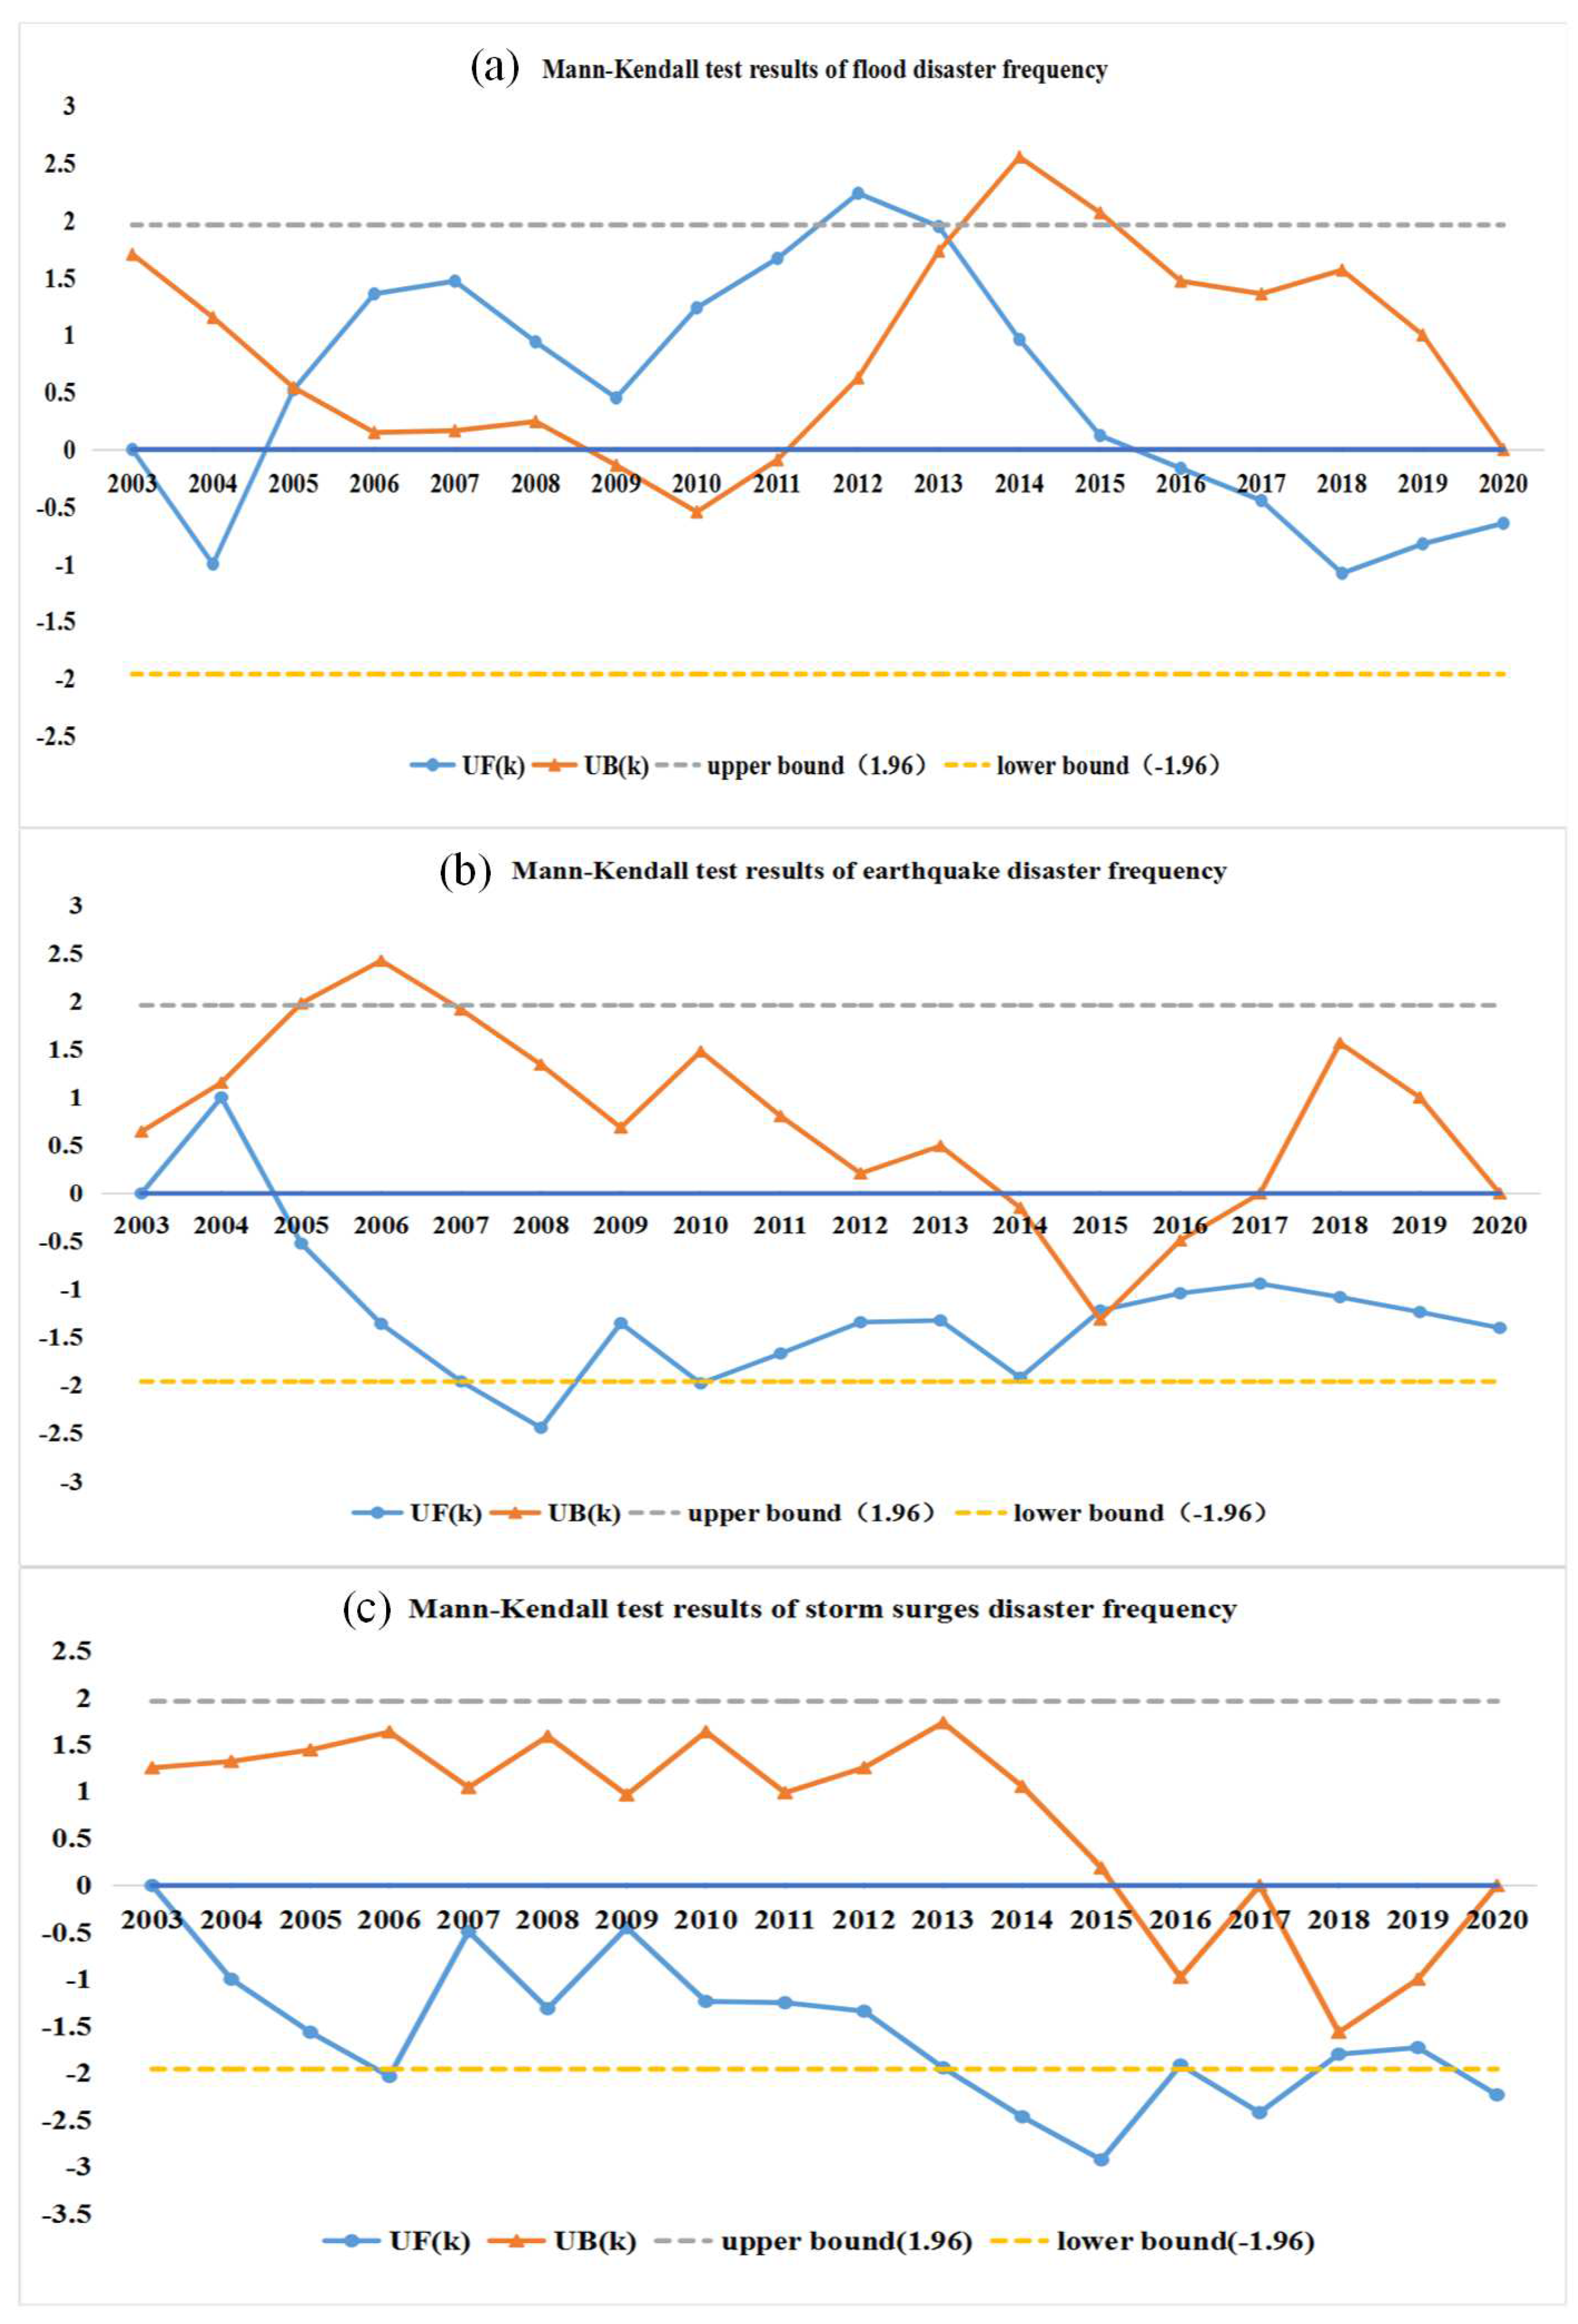
According to the number of disasters (flood, earthquake, and storm surge) in Tianjin from 2003 to 2020, Mann–Kendall test method was adopted to analyze the change trend, and the trend test results are shown in Figure 7. The UFk of flood disasters were all greater than 0 from 2005 to 2015, indicating an upward trend during the decade. In 2012, the upward trend passed the significance test of 0.05 (U0.05 = 1.96), showing a very significant upward trend in this year. After 2016, UFk began to be less than 0, showing a downward trend. The UFk and UBk curves intersect at two points within the confidence interval. The first intersect point is 2005, indicating that the number of flood disaster outbreaks began to mutate from 2005 and then showed a significant upward trend. The second intersection occurred between 2013 and 2014, and there was a second mutation here. The number of earthquake disasters has been on a downward trend since 2005, and the UFk in 2008 exceeded the critical lower bound, indicating that the decline was very obvious in that year. The trend of storm surge disasters is in a state of decline, and most years are below the critical value after 2013, reflecting a very significant decline trend during this period.

Geographical Difference Analysis of Disasters

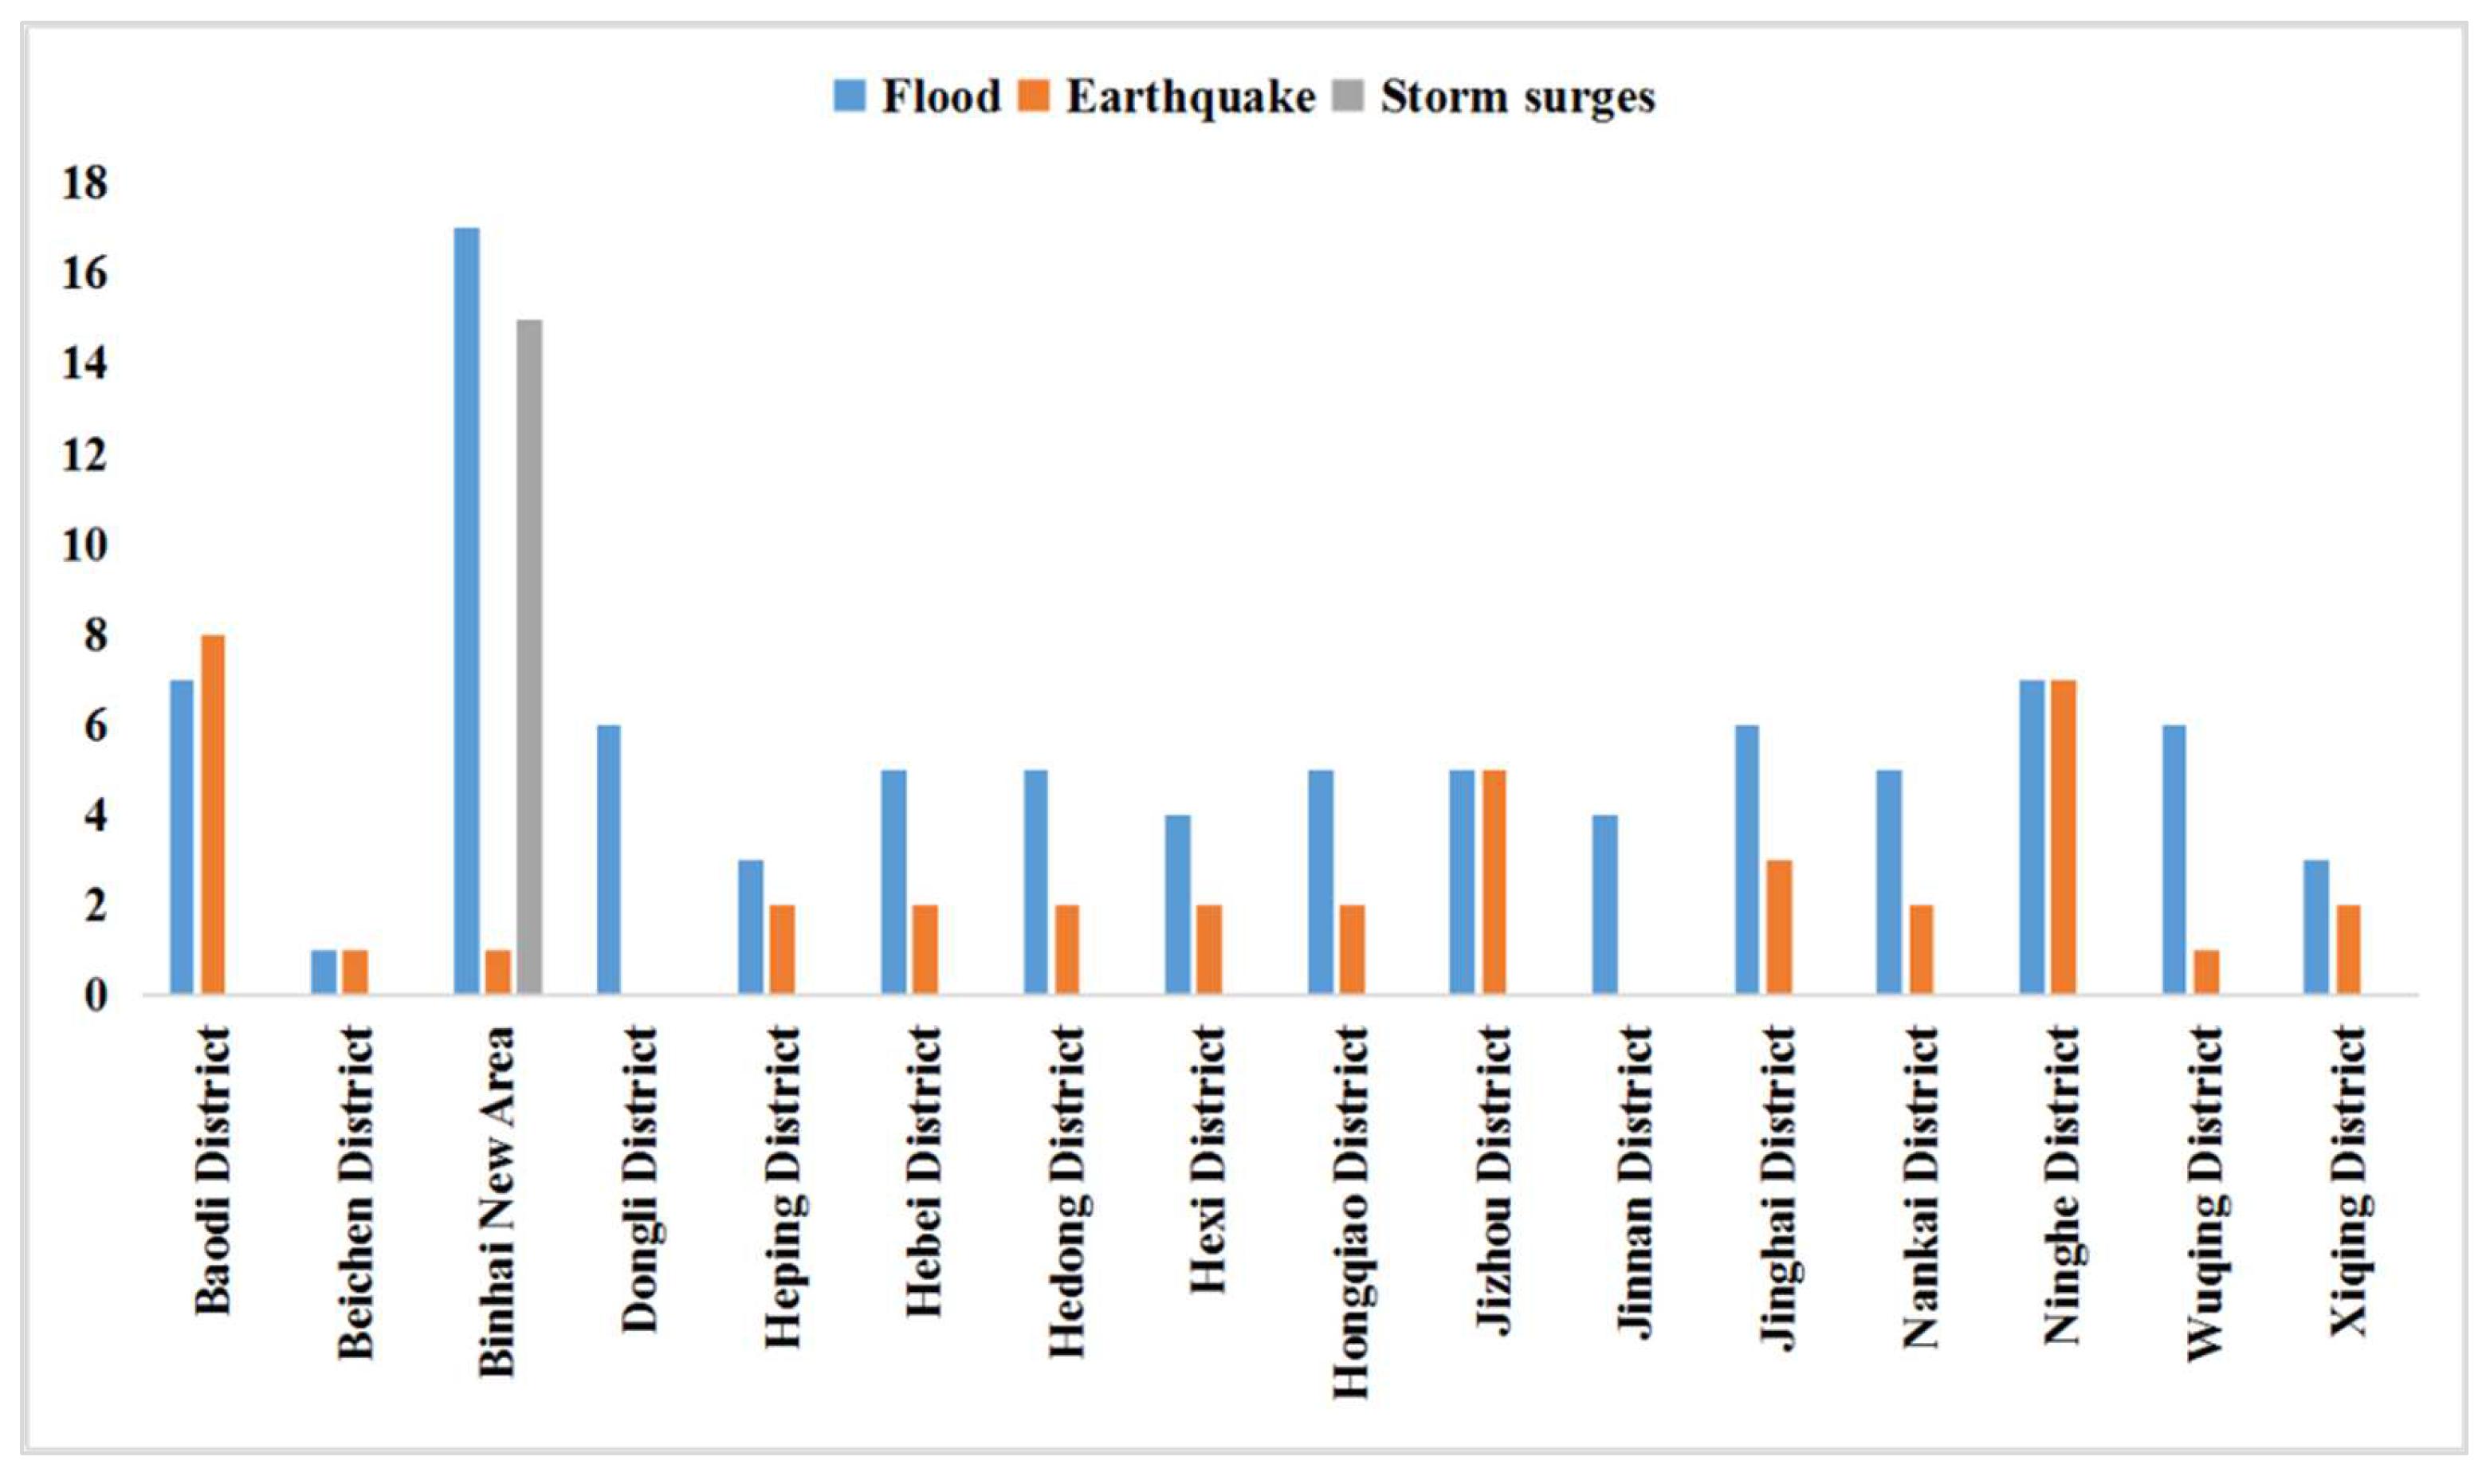
The occurrence of disasters in various districts of Tianjin is shown in Figure 8. It can be seen that the spatial distribution law of various disasters is different. The maximum number of flood disasters was 17 in the Binhai New Area, while the lowest number was only one in Beichen District. The earthquake disaster occurred frequently in Baodi District, Ninghe District, and Jizhou District in the north-central area of Tianjin, accounting for 50% of the earthquake disasters. The Binhai New Area is more vulnerable to storm surges because it faces the Bohai Sea to the east. ArcGIS software is further used to visualize the spatial distribution of various disasters in Tianjin (as shown in Figure 9), so that the specific spatial distribution of each disaster can be seen more clearly and intuitively.
Further, a Lorenz curve was used to analyze the equilibrium of disaster distributions in Tianjin, as shown in Figure 10, which shows a greater disequilibrium of storm surge disaster than earthquake and flood disasters. It can be seen that the distribution of flood disasters is relatively average on the spatial distribution of street scale and they are with little regional difference. The results show that the spatial distribution of flood disasters in Tianjin presents a relatively common phenomenon. The spatial distribution of storm surge disaster is the most unbalanced, which shows that less than 10% of the area accounts for all disasters. The spatial distribution equilibrium of earthquake disasters is between flood disasters and storm surge disasters. Due to the random occurrence of earthquake disasters in Tianjin, the spatial distribution is relatively average.

Direction Distribution Analysis of Disasters

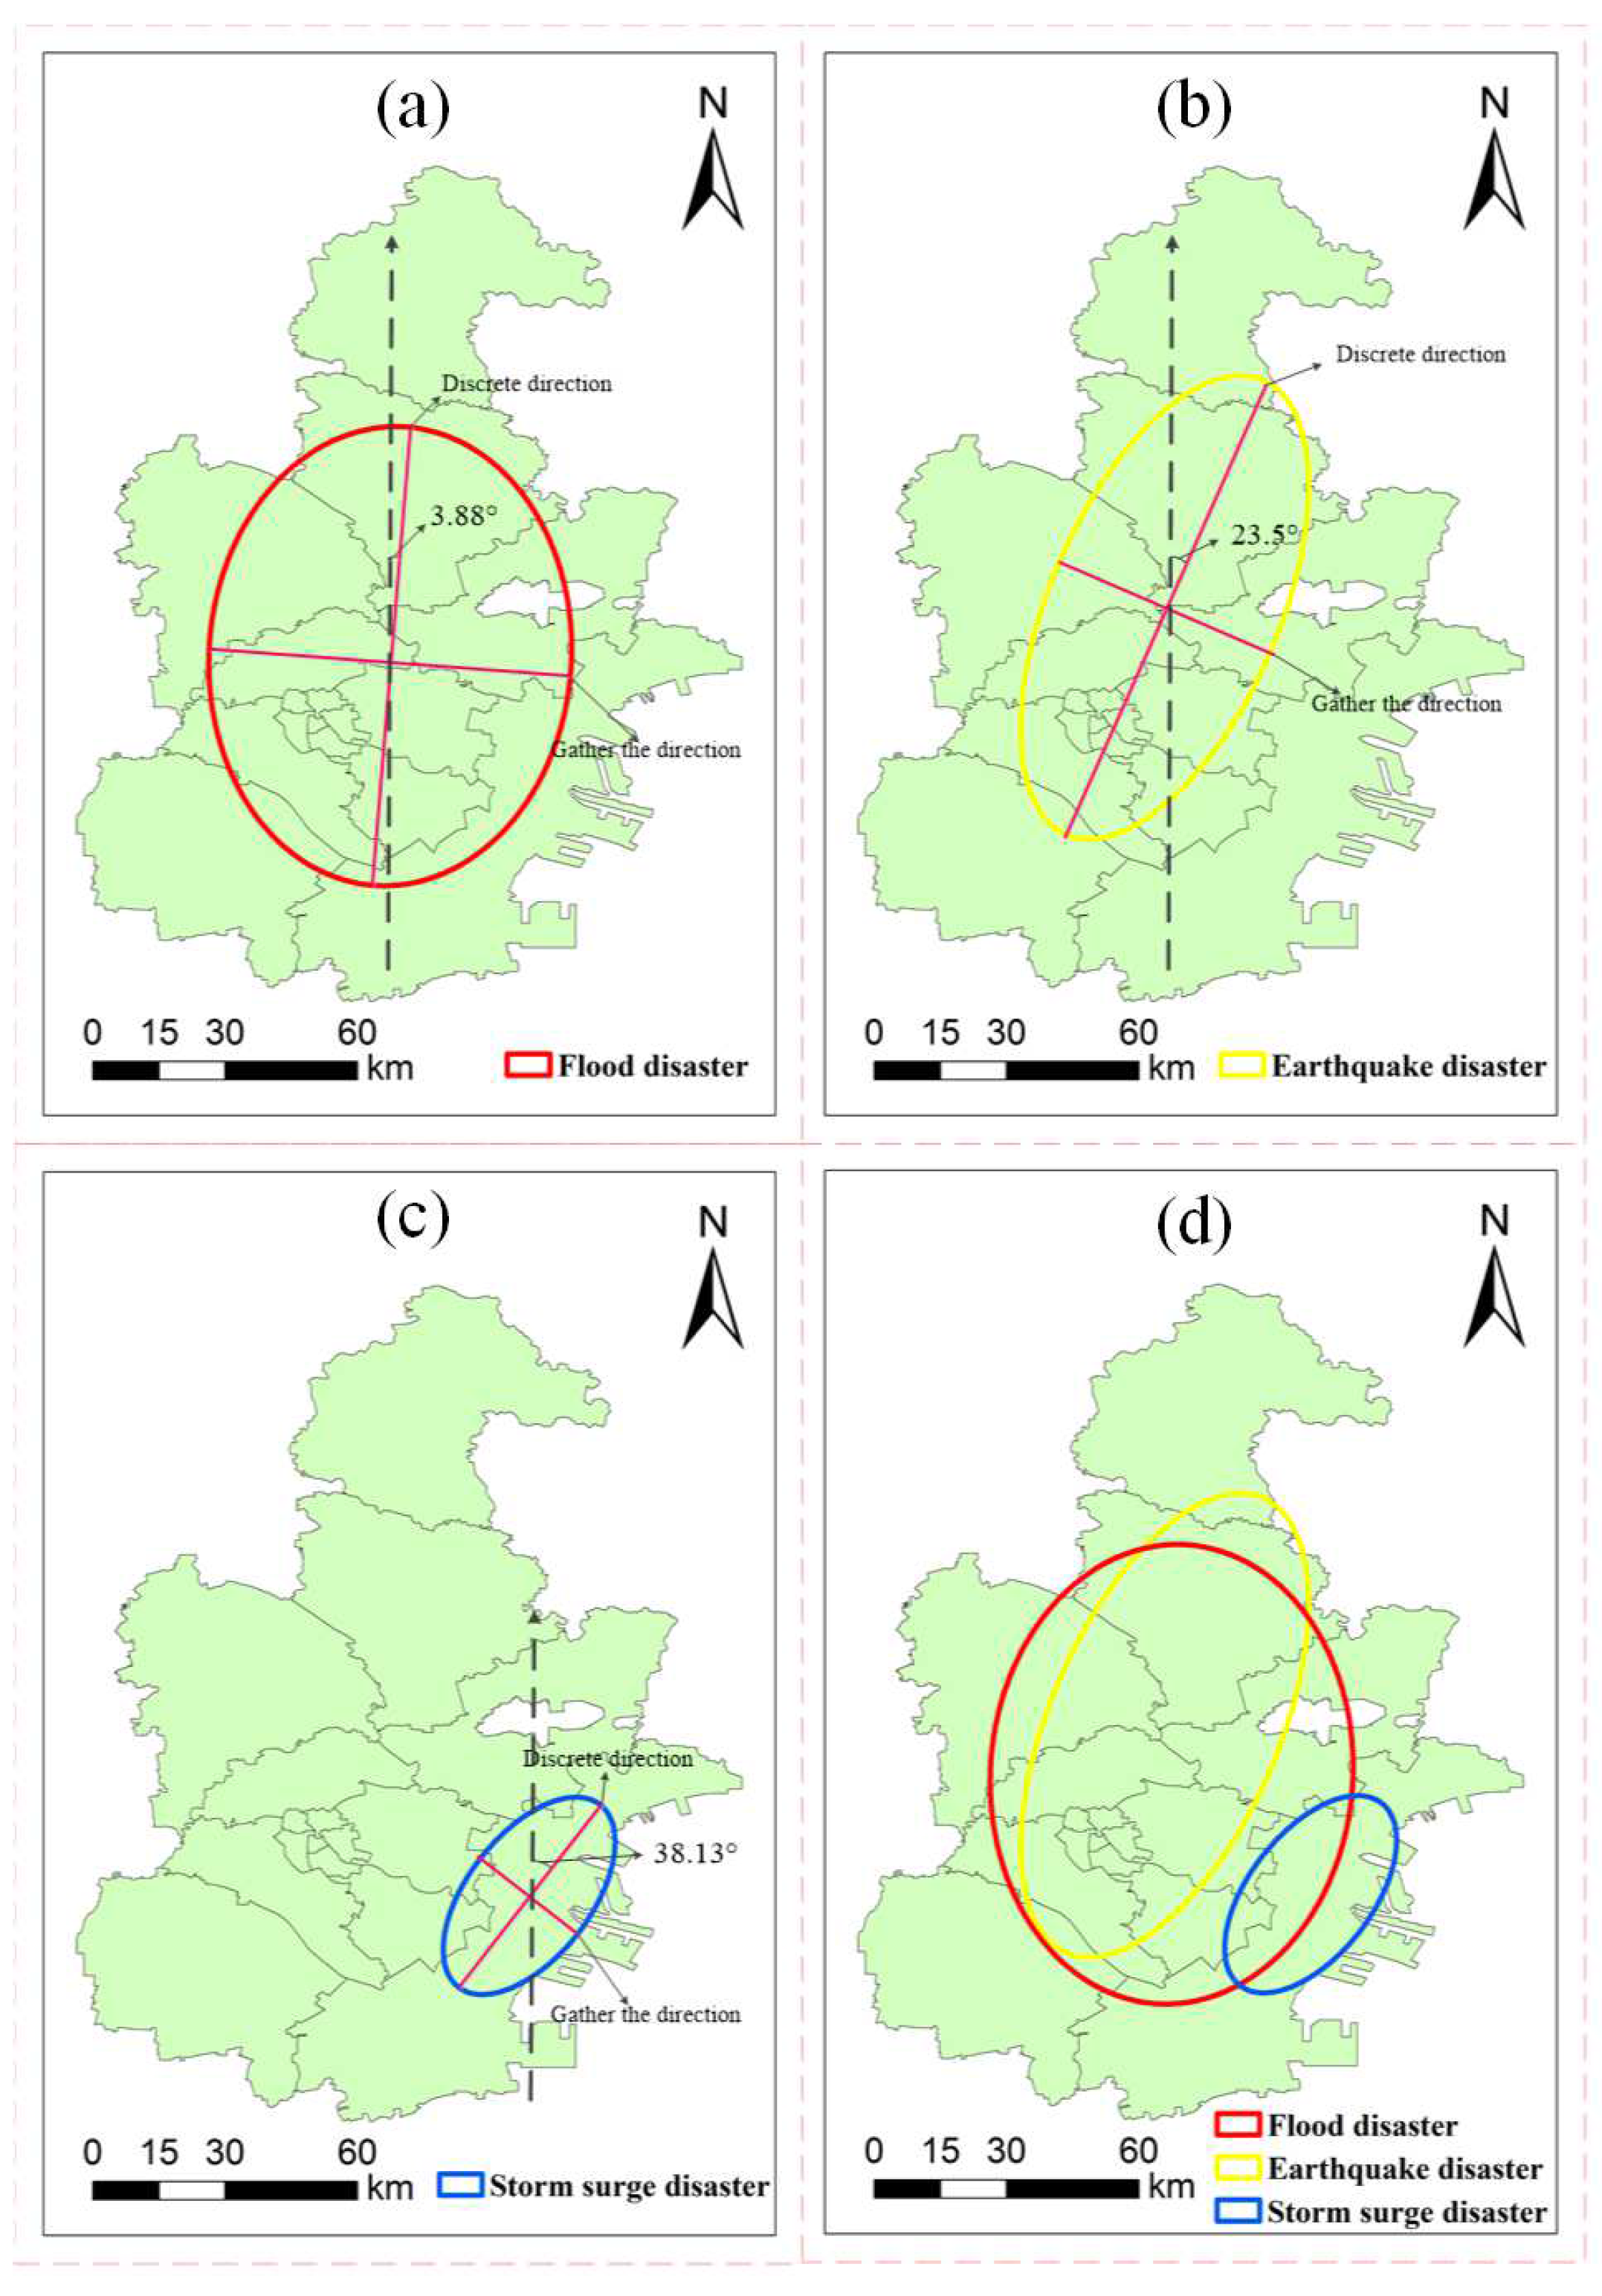
The “Direction Distribution Tool” in ArcGIS software was used to calculate the deviation of spatial distribution of disasters, and the results are shown in Figure 11. The results indicated that the spatial distribution of flood disasters was more random in the north-south direction and more uniform in the east-west direction. The direction angle was only 3.88°, which means that the directionality is not obvious. The spatial distribution pattern of earthquakes and storm surges was “dispersed from southwest to northeast and concentrated from northwest to southeast”. The direction angle of storm surge disaster was 38.13°, which was larger than that of earthquake disaster. The direction of storm surge disaster was more obvious. The long axis of storm surge disaster direction distribution was obviously shorter than that of earthquake disaster direction distribution, indicating that the spatial aggregation of storm surge disaster was stronger than that of earthquake disaster.

Spatial Autocorrelation Analysis of Disasters

Table 2 summarizes the global Moran’s index for the three disasters. Among them, the Moran’s index of earthquake disasters is the largest and the degree of spatial positive correlation is the highest, which indicates that the distribution has obvious spatial agglomeration. The Moran’s index of flood disaster is in the second, which shows a significant positive spatial correlation. The Moran’s index of storm surge disaster is less than 0, indicating a negative spatial correlation and a large spatial difference. Nevertheless, it showed a random spatial pattern according to the significance test of Z-score and p-value.
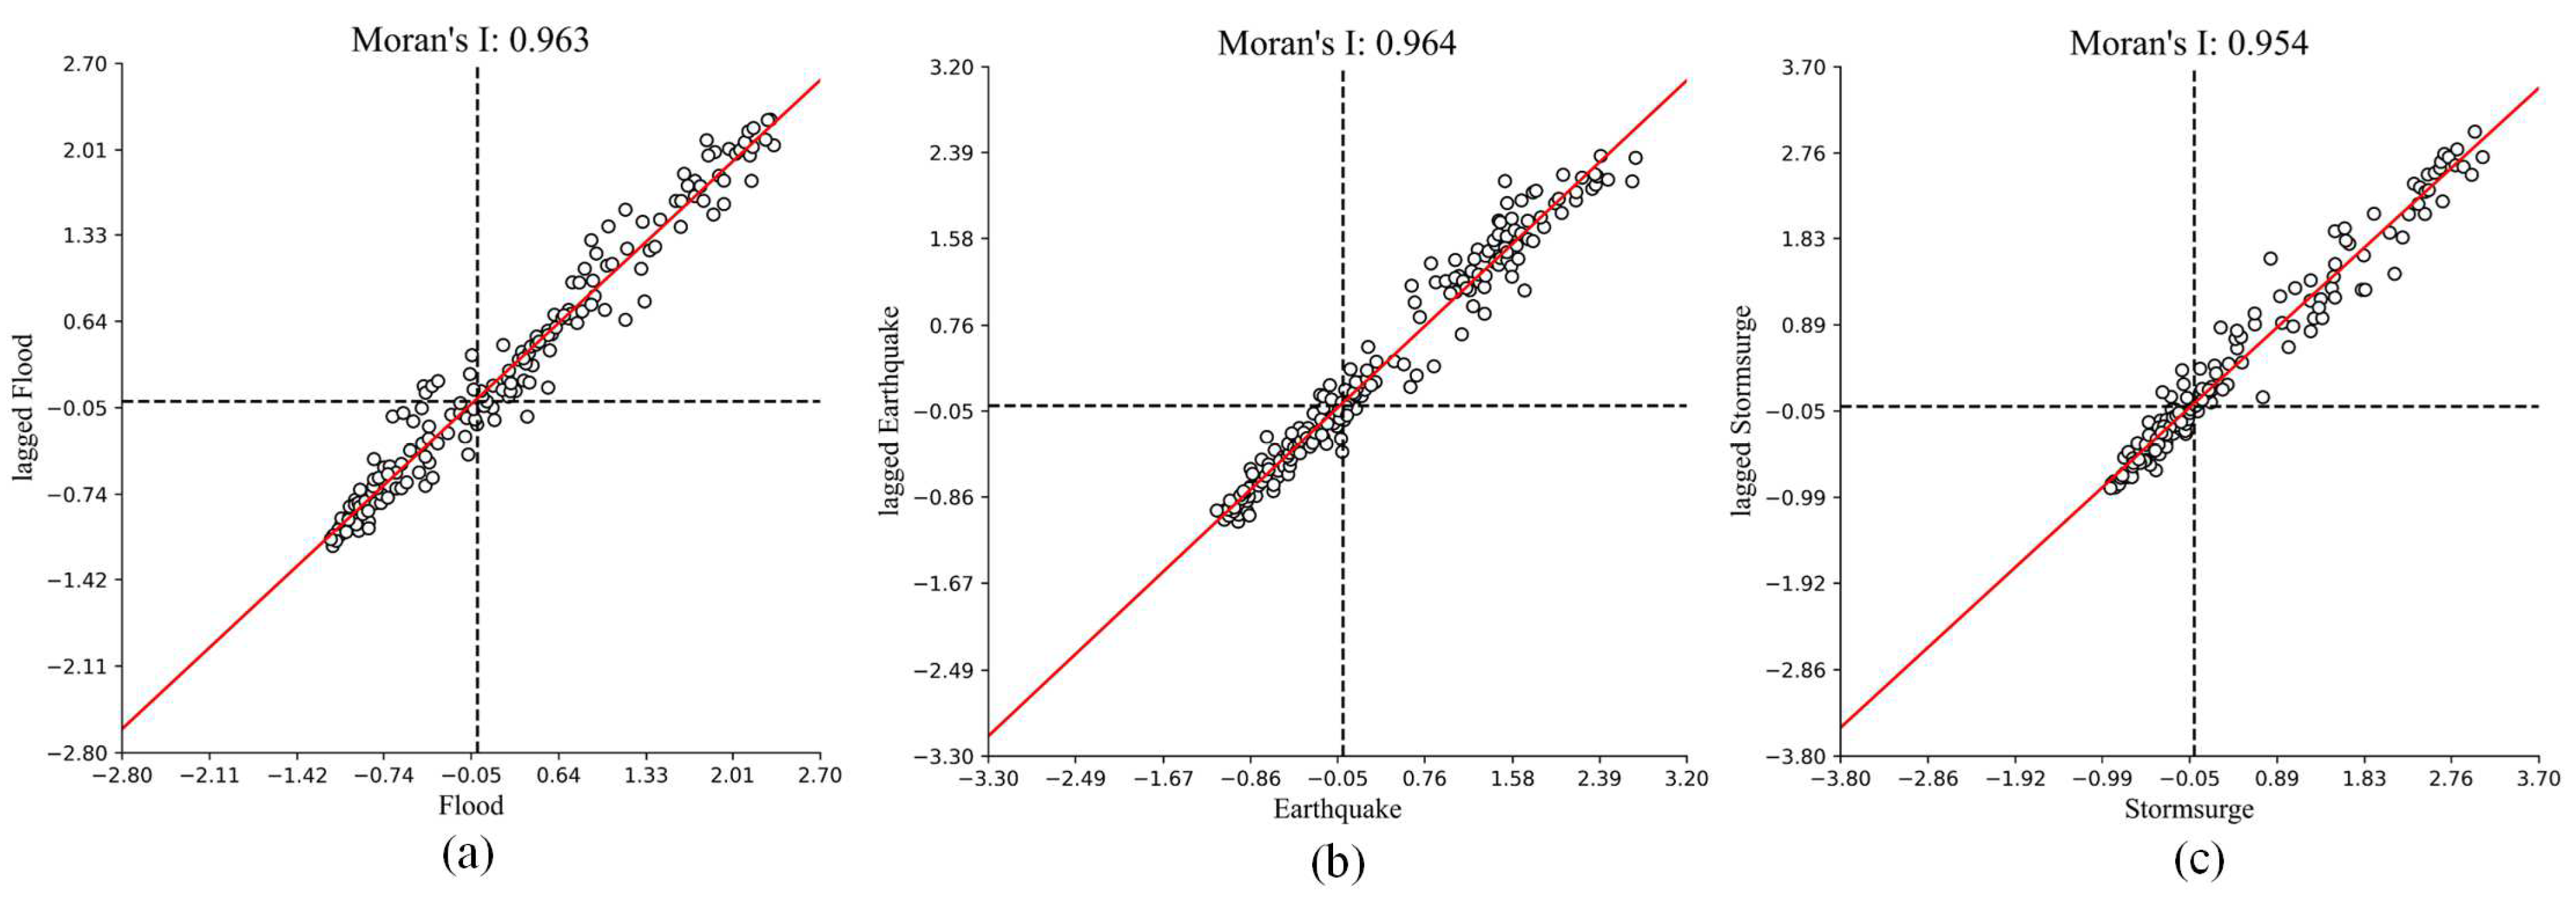
Moran scatter diagram is used to further measure the local spatial correlation between each region and its surrounding areas, as shown in Figure 12. It can be seen that most areas are located in the first and third quadrants, showing obvious “high-high” agglomeration or “low-low” agglomeration, showing significant local spatial agglomeration.
Local spatial analysis (Figure 13) shows that 95%, 96%, and 97% of the spatial correlations for flood, earthquake, and storm surge disasters are positive, respectively. Among them, 49% of the areas of flood disaster show a high-high aggregation state, and 46% of the areas show a low-low aggregation state. In terms of earthquake, 61% of the areas present the state of high-high accumulation, and 35% is in the state of low-low accumulation. For storm surge disaster, 72% of the areas present a high-high aggregation state, and 25% are in a low-low aggregation state. In general, the areas of positive and negative spatial correlation of the three disasters are basically the same, but there are differences in specific regions.
ArcGIS software was further used to visualize the aggregation and distribution patterns of various disasters in spatial geography, and the results are shown in Figure 14. The flood disasters in the northern part of Tianjin and Binhai New Area showed a “high-high” clustering state, while the flood disasters in the central part showed a "low-low" clustering state. Most of the earthquake disasters in the northeast and a small part in the southwest showed “high-high” agglomeration, and the rest were “low-low” agglomeration. The location of storm surge disaster in coastal areas was in obviously “high-high” agglomeration state, and the local spatial correlation is strong.

3.3.2. Impact Analysis on Disasters Results

Impact on Individual Disaster from Factors

(1)
Impact analysis on flood
The results of flood disaster in Tianjin by factor detector are shown in Table 3. It can be seen that the order of the driving factors for the flood disaster is Rainfall (0.732) > Soil type (0.451) > Population (0.425) > GDP (0.317) > Land use type (0.233) > Vegetation coverage (0.214) > Elevation (0.167) > Slope (0.158) > Drainage density (0.081). It is easy to find that the flood disaster is most affected by rainfall. Tianjin city is located in the temperate monsoon climate zone of the North China Plain. In summer, it is affected by the warm and humid air flow of the southeast monsoon and the westerly system, resulting in rainstorm weather. Moreover, the flat terrain, tidal soil, and the pipes network with insufficient drainage capacity aggravate the occurrence of flood disaster here. In recent years, with the improvement of Haihe River Basin and the construction of a large number of reservoirs, the inflow from the middle and upper reaches decreased, and the flood disasters rarely occurred. Therefore, the river network density has the least correlation with the flood disasters in Tianjin. According to the interaction results, the interaction between any two impact factors on flood disaster events is greater than that of single impact factors. The maximum explanatory power was 0.93 after the interaction between rainfall and population factors.
(2)
Impact analysis on earthquake
The results of GeoDetector for earthquake disasters are shown in Table 4. It can be seen that the correlation degrees of the impact factors on earthquake disasters are shown as follows: Population (0.652) > GDP (0.624) > Thousand hospital beds (0.503) > Land use type (0.371) > Soil type (0.193) > Secondary geological disasters (0.185) > Elderly population (0.172) > Elevation (0.063) > Slope (0.004). The earthquake disaster in Tianjin is most related to population. Earthquake is a disaster with great destructive power, and the more densely populated the place is, the greater the impact of disaster losses will be. The second is GDP. Earthquake disasters have high correlation with the economic level. Places with higher economic density have higher vulnerability, although they have strong resilience to disasters. In addition, the terrain of Tianjin is relatively flat, so the elevation and slope have the lowest impact on the earthquake disaster.
When the influence factors are combined in pairs, the maximum explanatory power is 0.842, between GDP and thousand hospital beds. Among them, EPOP∩THB, EPOP∩GDP, EPOP∩Slope, and EPOP∩Soil are non-linear strengthening, representing a more obvious increase in explanatory power to earthquake disasters. In addition, the interaction between slope and thousand hospital beds, soil type, and land use type are also non-linear strengthening. The interaction of other factors shows double factor enhancement.
(3)
Impact analysis on storm surge
A system of 1–9 scores was used to indicate the importance of each indicator to storm surge disaster, and the judgment matrix was established through expert scoring, as shown in Table 5. The eigenvector of the judgment matrix was calculated, and the eigenvector represented the weight of the influence degree of each impact factor on the storm surge disaster. Then the driving force of these factors was calculated through Analytic Hierarchy Process method. The results are shown as follows: Meteorology (0.246) > Astronomical tide (0.151) = Population (0.151) = GDP (0.151) > Geographical location (0.09) = Elevation (0.09) > Slope (0.057) > Land use type (0.038) > Soil type (0.027). Meteorological factors have the greatest influence on storm surge disaster. Because of typhoons in summer and early autumn, it brings a large increase of rain and forming typhoon storm surge. Temperate storm surge occurred more frequently in spring and autumn, and strong cold air caused storm water increase. In addition, astronomical tides occur frequently in Tianjin. When the astronomical tide high tide occurs, meeting the increasing tidal water caused by meteorological factors, it will produce the storm surge at the high tide. Once the storm surge disaster occurs, the life and property of coastal residents will suffer serious losses, so the population and GDP also affect the storm surge disaster to a certain extent. In addition, because the coastal areas are low-lying and gentle and the beach area is large, it is not conducive to the water backflow in the water-increasing areas, leading to the rise of the water level and the prolongation of the duration of the storm surge. The land settlement is caused by the increase of ground load, and the tidal level rises accordingly. The tidal breakwater also falls along with the ground, which results in the decrease of elevation and the weakening of defense ability.

The Comprehensive Impact on Multiple Disasters Results

From previous discussion, the common factors for multiple disasters in this study are elevation, slope, soil type, land use type, population, and GDP. Here, the comprehensive impact results of the common factors on multiple disasters are calculated based on the comprehensive impact evaluation model. The weights of impact factors of various disasters are standardized, and then substituted into Formula (18) and (19) to obtain the comprehensive impact index of single factor to multiple disasters. The results are shown in Table 6. After integrating various disaster impact factors, it can be seen from Figure 15. The comprehensive impact coefficient of slope is the largest, which indicates that the influence of slope on various disasters varies greatly, increasing the comprehensive influence of this factor on multiple disasters to a certain extent. It also shows that the comprehensive impact coefficient of population is the smallest, while the comprehensive impact index is the largest, indicating that the difference in the impact degree of population on each disaster is small, while populations have a high impact on each disaster. The same is true of GDP. The above results indicate that the densely populated and economic areas are more vulnerable to disasters. Consequently, the protection of population and economic property should be strengthened for a better prevention and control of disasters.

4. Discussion

4.1. Model Rationality and Superiority Explanation

In the part of impact analysis on multiple disasters in the framework above, the comprehensive impact evaluation model (CIEM) is proposed, which fully considers the short-board effect and is different from the traditional superposition model (TRSM). In order to illustrate the rationality and superiority of CIEM, we take Tianjin as an example to calculate the comprehensive impact of single factor on multiple disasters by using two methods above and make a comparative analysis of the results. Here we mainly analyze the ranking of the comprehensive impact of each factor on the three disasters and the proportion of the number of streets for the biggest driving factor.
The results of comprehensive impact on multiple disasters from factors based on the TRSM and CIEM are shown in Table 7. It is easy to find that the evaluation score of each factor by CIEM is higher than that obtained by TESM. The ranking results of each factor are presented as a whole consistency according to the two models. Factors like elevation, soil POP and GDP rank identically in both methods, while the rankings of slope and LU were swapped. The consistency of the scores of most of the impact factors indicates the scientificity of CIEM to a certain extent.
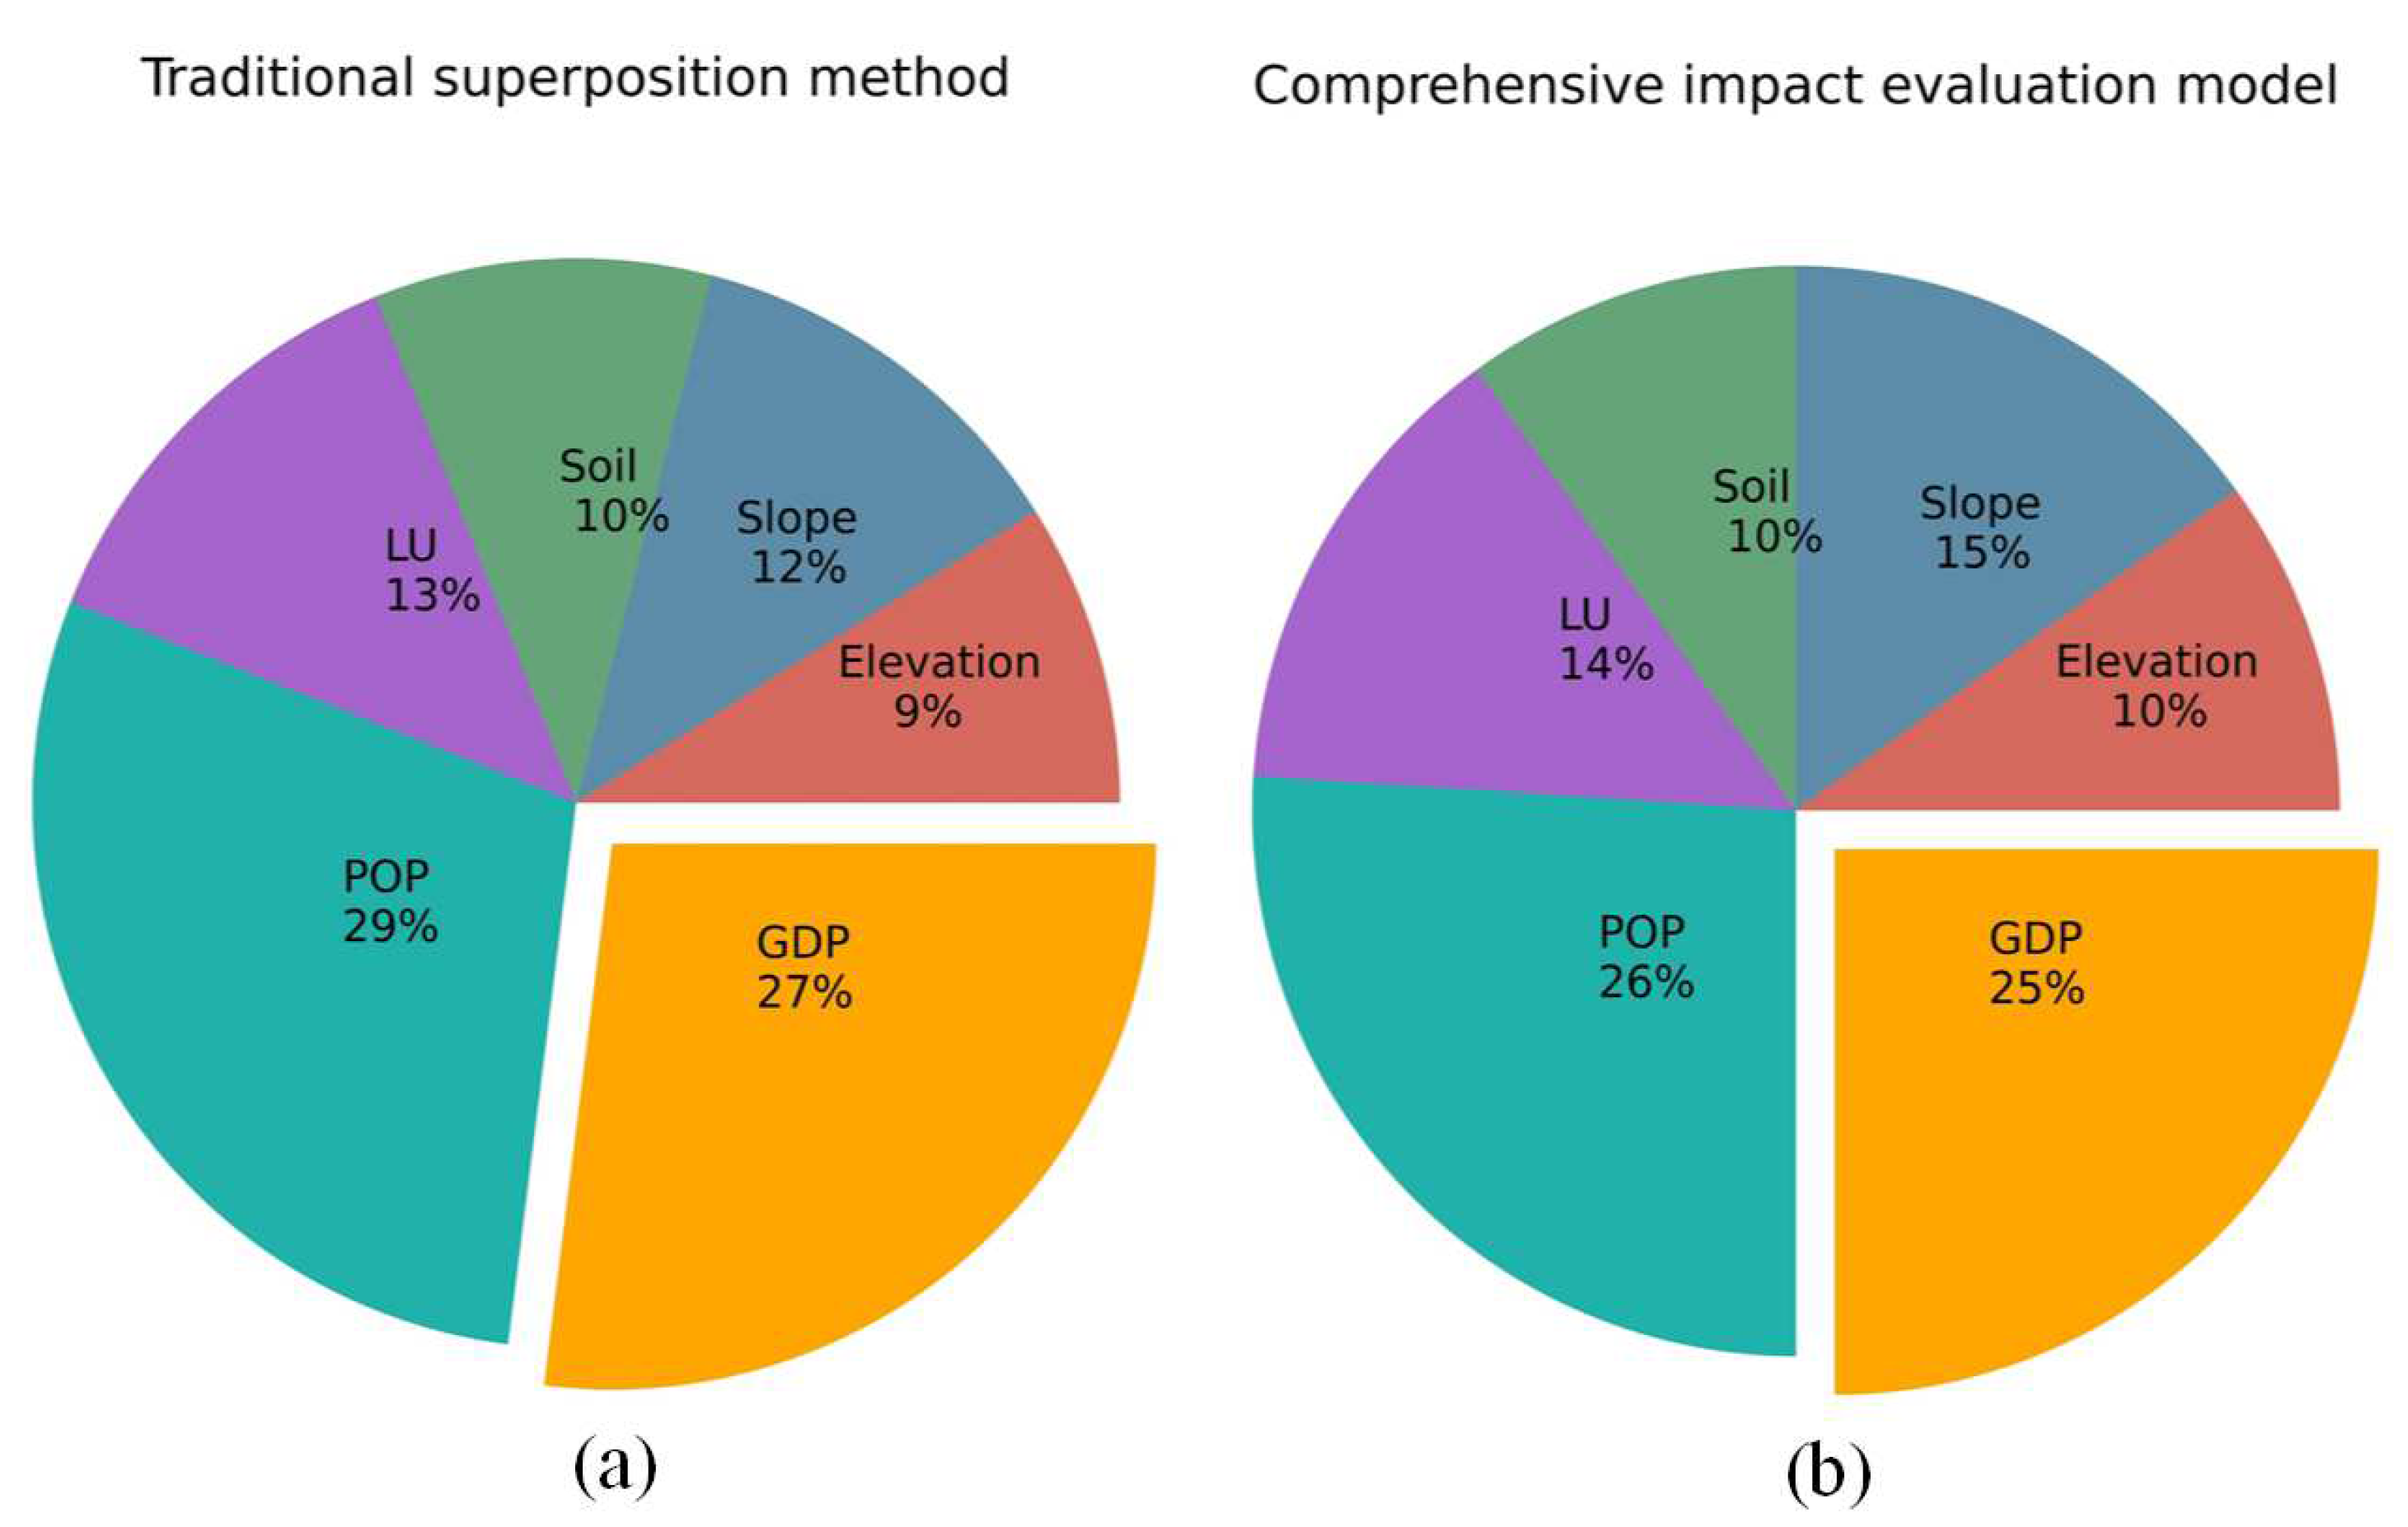
The proportion results of the number of streets for the biggest driving factors are shown in Figure 16. Population factor as the main driving factor among all the streets has the highest proportion in both models, while the proportion by CIEM is 3% lower than that by TRSM. The second-place GDP factor is also 2% lower than that of the traditional method. It indicates that the comprehensive impact value of population and GDP factors is the largest, but because the impact degree on various disasters is relatively balanced, the influence value after the comprehensive impact is less than that of the direct superposition method. Similarly, the proportion of elevation, slope, and land use type by CIEM is increased compared with that obtained by TRSM due to the large difference in the influence degree of various disasters. Due to considering the heterogeneity of effects of various factors on multiple disasters, CIEM is more consistent with the reality than TRSM. Furthermore, the more different the driving force results of disasters from factors are, the more obvious the superiority of CIEM will be.

4.2. Framework Rationality and Superiority Explanation

The framework developed presents an analysis of the spatio-temporal distribution of disasters and the impact on them from influencing factors for better disaster risk management. In this framework, multiple dimensions of spatial and temporal distribution of disasters are given in detail, including time series analysis, geographical difference analysis, direction distribution analysis, and spatial autocorrelation analysis. In the impact analysis on disasters part, the analysis dimensions for individual disaster and multiple disasters are proposed. Moreover, a new method like GeoDetector is introduced to study the impact analysis on disaster and a novel model as CIEM is developed to reveal the comprehensive impact on multiple disasters from influencing factors.
As for the verification of the overall framework, further in-depth research is still needed. In fact, the framework developed provides analysis dimensions and suggested methods for the spatio-temporal distribution of disasters. In fact, the authors quite agree with the view that more than one method can be adopted for each analysis content in the framework. Here we suggested some widely applied methods, which can provide the desired analysis results more conveniently and intuitively in the field. What is more, the methods selected were proved to be scientific and reasonable in many previous studies, which also shows the reliability of our framework to some extent. The framework proposed in this paper is not only an accumulation of methods, but its main contribution is to provide a general direction for researchers to analyze the content and influencing factors of spatio-temporal distribution of disasters, and to suggest operable methods to facilitate the research on disaster prevention and mitigation. Of course, The analytical aspects in each dimension of the framework can still be extended, and the suggested methods can be more selective, which can be the next step of our study.
Previously proposed national frameworks for disaster management are often highly regional, and different frameworks have different analytical priorities. Few of these frameworks suggest corresponding methods for specific analysis content, which makes them less practical and operational. The framework developed in our work is very specific to give the analysis content dimension and the corresponding calculation method for the spatio-temporal distribution of disasters and analysis of influencing factors, which makes it have good operation. At the same time, the framework is very friendly to new researchers in this field. They can directly use the framework to analyze the content through methods suggested for the region they want to analyze, so as to quickly obtain the spatial and temporal distribution law of disasters and the comprehensive impact of different factors on a single disaster and multiple disasters. Moreover, the framework developed is expected to be widely applied in other districts for better DRM in the future.
4.3. Limitations and Future Work

This framework provides two dimensions for the analysis of the spatio-temporal distribution of disasters and the influencing factors on disasters. The corresponding methods for specific analysis content were also suggested. In fact, the analytical aspects in each dimension can still be extended, and the suggested methods can be more selective. In the future, the content and method refinement for analytical dimensions will be the further research direction. Meanwhile, in the influencing factors analysis section, governmental or nongovernmental disaster policies/policy tools or responses should be considered for further study. This framework has only been tested in Tianjin and has not been applied to other regions. Therefore, the universality of the framework needs to be further verified and improved in the future. In addition, how this study can help other disaster risk management strategies, including response strategies like evacuation planning, is worth studying in the future.

5. Conclusions

A framework for spatio-temporal distribution of disasters and analysis of influencing factors is developed in this work. Key outcomes of the study are as follows:
Firstly, the framework proposed, different from previous regional ones, covers the analysis content and the corresponding methods, having good practicability and operability. Secondly, time series analysis, geographical difference analysis, direction distribution analysis, and spatial autocorrelation analysis are selected as the content of spatio-temporal distribution of disasters part, and the impact analysis on individual disaster and multiple disasters are suggested as the aspects of influencing factors analysis. Thirdly, Mann–Kendall test method, Lorenz curve, standard deviation ellipse method, exploratory spatial data analysis method, geographic detector, and CIEM are introduced to improve the operability of the framework. Then the framework is applied to analyze disasters including flood, storm surge, and earthquake in Tianjin of China, proving the practicability of the framework. Finally, the framework developed is expected to be widely applied in other districts for better DRM in the future.
Author Contributions

Conceptualization, W.Y. and X.J.; methodology, X.D.; software, D.H.; validation, W.Y., X.J. and R.Z.; formal analysis, C.Z.; investigation, C.C.; resources, X.D.; data curation, B.H.; writing—original draft preparation, X.D.; writing—review and editing, W.Y.; visualization, D.H.; supervision, X.J.; project administration, W.Y.; funding acquisition, W.Y. All authors have read and agreed to the published version of the manuscript.

Funding

The research was supported by the Natural Science Foundation of Tianjin Education Commission (2019KJ108).

Acknowledgments

The authors acknowledge the assistance of anonymous reviewers.

Conflicts of Interest

The authors declare no conflict of interest.

References

  1. Fernandez, P.; Mourato, S.; Moreira, M.; Pereira, L. A new approach for computing a flood vulnerability index using cluster analysis. Phys. Chem. Earth Parts A/B/C 2016, 94, 47–55. [Google Scholar] [CrossRef]
  2. Yang, W.; Xu, K.; Lian, J.; Ma, C.; Bin, L. Integrated flood vulnerability assessment approach based on TOPSIS and Shannon entropy methods. Ecol. Indic. 2018, 89, 269–280. [Google Scholar] [CrossRef]
  3. Zhang, R.; Chen, Y.; Zhang, X.; Ma, Q.; Ren, L. Mapping homogeneous regions for flash floods using machine learning: A case study in Jiangxi province, China. Int. J. Appl. Earth Obs. 2022, 108, 102717. [Google Scholar] [CrossRef]
  4. Sajjad, M.; Chan, J.C.L.; Chopra, S.S. Rethinking disaster resilience in high-density cities: Towards an urban resilience knowledge system. Sustain. Cities Soc. 2021, 69, 102850. [Google Scholar] [CrossRef]
  5. Xiong, X.; Lu, Y.; Li, Q. A Study of Urban Natural Disaster Vulnerability Assessment Based on PCA-TOPSIS Method, Singapore; Xu, J., Hajiyev, A., Nickel, S., Gen, M., Eds.; Springer: Singapore, 2017; pp. 49–60. [Google Scholar]
  6. Ghawana, T.; Pashova, L.; Zlatanova, S. Geospatial Data Utilisation in National Disaster Management Frameworks and the Priorities of Multilateral Disaster Management Frameworks: Case Studies of India and Bulgaria. ISPRS Int. J. Geo-Inf. 2021, 10, 610. [Google Scholar] [CrossRef]
  7. Homeland Security. National Response Framework; Homeland Security: Washington, DC, USA, 2019; p. 57. [Google Scholar]
  8. Marx, S.; Barbeito, G.; Fleming, K.; Petrovic, B.; Pickl, S.; Thieken, A.; Zeidler, M. Synthesis Report on Disaster Risk Reduction and Climate Change Adaptation in Germany. In DKKV-Schriftenreihe, Enhancing Synergies for Disaster Prevention in the European Union; German Committee for Disaster Reduction Enhancing Synergies for Disaster Prevention in EurOpean Union: Bonn, Germany, 2017; p. 76. ISBN 978-3-00-058657-6. [Google Scholar]
  9. Molina, M.; Bayarri, S. A multinational SDI-based system to facilitate disaster risk management in the Andean Community. Comput. Geosci. 2011, 37, 1501–1510. [Google Scholar] [CrossRef] [Green Version]
  10. Sparf, J.; Migliorini, M.E. Socioeconomic and Data Challenges Disaster Risk Reduction in Europe; United Nations Office for Disaster Risk Reduction: Geneva, Switzerland, 2019; Volume 16, p. 33. [Google Scholar]
  11. Burton, H.V.; Deierlein, G.; Lallemant, D.; Lin, T. Framework for Incorporating Probabilistic Building Performance in the Assessment of Community Seismic Resilience. J. Struct. Eng. 2016, 142, 1–11. [Google Scholar] [CrossRef] [Green Version]
  12. Sediek, O.A.; El-Tawil, S.; McCormick, J. Integrating Household Decisions in Quantifying the Seismic Resilience of Communities. In Proceedings of the 17th World Conference on Earthquake Engineering (17WCEE), Sendai, Japan, 13–18 September 2020. [Google Scholar]
  13. Burton, H.V.; Deierlein, G.; Lallemant, D.; Singh, Y. Measuring the Impact of Enhanced Building Performance on the Seismic Resilience of a Residential Community. Earthq. Spectra. 2017, 33, 1347–1367. [Google Scholar] [CrossRef]
  14. Sediek, O.A.; El-Tawil, S.; McCormick, J. Quantifying the Seismic Resilience of Communities: A Distributed Computing Framework. In Proceedings of the International Conference in Commemoration of 20th Anniversary of the 1999 Chi-Chi Earthquake, Taipei, Taiwan, 13 May 2019. [Google Scholar]
  15. Llasat, M.C. Flash flood evolution in North-Western Mediterranean. Atmos. Res. 2014, 149, 230–243. [Google Scholar] [CrossRef] [Green Version]
  16. Saharia, M.; Kirstetter, P.; Vergara, H.; Gourley, J.J.; Hong, Y. Characterization of floods in the United States. J. Hydrol. 2017, 548, 524–535. [Google Scholar] [CrossRef]
  17. Kourgialas, N.N.; Karatzas, G.P. A national scale flood hazard mapping methodology: The case of Greece—Protection and adaptation policy approaches. Sci. Total Environ. 2017, 601–602, 441–452. [Google Scholar] [CrossRef] [PubMed]
  18. Li, C.; Chai, Y.; Yang, L.; Li, H. Spatio-temporal distribution of flood disasters and analysis of influencing factors in Africa. Nat. Hazards 2016, 82, 721–731. [Google Scholar] [CrossRef]
  19. Masozera, M.; Bailey, M.; Kerchner, C. Distribution of impacts of natural disasters across income groups: A case study of New Orleans. Ecol. Econ. 2007, 63, 299–306. [Google Scholar] [CrossRef]
  20. Shi, X.; Liu, S.; Yang, S.; Liu, Q.; Tan, J.; Guo, Z. Spatial–temporal distribution of storm surge damage in the coastal areas of China. Nat. Hazards 2015, 79, 237–247. [Google Scholar] [CrossRef]
  21. Julia, A.J.; Irena, F.C.; Kendra, L.H.; Robert, J.W.; Mary, B.A.; Melinda, H.B.; Emery, B.; Warren, A.B.; John, L.C.; Alan, C.; et al. Ecosystem Processes and Human Influences Regulate Streamflow Response to Climate Change at Long-Term Ecological Research Sites. Bioscience 2012, 62, 390–404. [Google Scholar]
  22. Pande, R.K. Flash flood disasters in Uttarakhand. Disaster Prev. Manag. 2010, 19, 565–570. [Google Scholar] [CrossRef]
  23. Zielinski, T. Catastrophic flood effects in alpine/foothill fluvial system (a case study from the Sudetes Mts, SW Poland). Geomorphology 2003, 54, 293–306. [Google Scholar] [CrossRef] [Green Version]
  24. Vinet, F. Geographical analysis of damage due to flash floods in southern France: The cases of 12–13 November 1999 and 8–9 September 2002. Appl. Geogr. 2008, 28, 323–336. [Google Scholar] [CrossRef]
  25. Zhuang, J.; Peng, J.; Zhu, X.; Huang, W. Scenario-Based Risk Assessment of Earthquake Disaster Using Slope Displacement, PGA, and Population Density in the Guyuan Region, China. Int. J. Geo-Inf. 2019, 8, 85. [Google Scholar] [CrossRef] [Green Version]
  26. You, Z.; Jiang, Q. The Study on Land Use Disaster Prevention Plan Based on Storm Surge Risk Regionalization in Jiangsu Coastal. Adv. Mater. Res. 2013, 33, 836–840. [Google Scholar] [CrossRef]
  27. Chen, F.; Yu, P.; Wu, X.; Zhu, Y. Refined risk assessment of storm surge disaster in coastal plain: A case study of pingyang county. J. Trop. Meteorol. 2019, 25, 304–311. [Google Scholar]
  28. Zhao, G.; Tian, P.; Mu, X.; Jiao, J.; Wang, F.; Gao, P. Quantifying the impact of climate variability and human activities on streamflow in the middle reaches of the Yellow River basin, China. J. Hydrol. 2014, 519, 387–398. [Google Scholar] [CrossRef]
  29. Dong, L.; Liang, H. Spatial analysis on China’s regional air pollutants and CO2 emissions: Emission pattern and regional disparity. Atmos. Environ. 2014, 92, 280–291. [Google Scholar] [CrossRef]
  30. Peng, J.; Chen, S.; Lü, H.; Liu, Y.; Wu, J. Spatiotemporal patterns of remotely sensed PM2.5 concentration in China from 1999 to 2011. Remote Sens. Environ. 2016, 174, 109–121. [Google Scholar] [CrossRef]
  31. Liu, Y.; Liu, J.; Zhou, Y. Spatio-temporal patterns of rural poverty in China and targeted poverty alleviation strategies. J. Rural Stud. 2017, 52, 66–75. [Google Scholar] [CrossRef]
  32. Wang, J.; Zhang, T.; Fu, B. A measure of spatial stratified heterogeneity. Ecol. Indic. 2016, 67, 250–256. [Google Scholar] [CrossRef]
  33. Lazear, E.P. The Peter Principle: A Theory of Decline. J. Polit. Econ. 2004, 112, S141–S163. [Google Scholar] [CrossRef] [Green Version]
  34. Yang, W.; Xu, K.; Lian, J.; Bin, L.; Ma, C. Multiple flood vulnerability assessment approach based on fuzzy comprehensive evaluation method and coordinated development degree model. J. Environ. Manage. 2018, 213, 440–450. [Google Scholar] [CrossRef]
  35. Diakakis, M.; Deligiannakis, G.; Pallikarakis, A.; Skordoulis, M. Factors controlling the spatial distribution of flash flooding in the complex environment of a metropolitan urban area. The case of Athens 2013 flash flood event. Int. J. Disast. Risk. Reduct. 2016, 18, 171–180. [Google Scholar] [CrossRef]
  36. Chatterjee, K.; Choudhury, D. Variations in shear wave velocity and soil site class in Kolkata city using regression and sensitivity analysis. Nat. Hazards 2013, 69, 2057–2082. [Google Scholar] [CrossRef]
  37. Wang, S.; Mu, L.; Qi, M.; Yu, Z.; Yao, Z.; Zhao, E. Quantitative risk assessment of storm surge using GIS techniques and open data: A case study of Daya Bay Zone, China. J. Environ. Manage. 2021, 289, 112514. [Google Scholar] [CrossRef] [PubMed]
Figure 1. Analysis framework of spatial-temporal distribution and influencing factors of disasters.
Sustainability 14 10488 g001
Figure 2. (a) Schematic Lorenz curve, (b) schematic Lorenz curve of disaster.
Sustainability 14 10488 g002
Figure 3. Moran scatter plot.
Sustainability 14 10488 g003
Figure 4. Principle diagram of interaction detector.
Sustainability 14 10488 g004
Figure 5. Location map of Tianjin.
Sustainability 14 10488 g005
Figure 6. Monthly statistical chart of disasters in Tianjin.
Sustainability 14 10488 g006
Figure 7. Mann–Kendall test for (a) flood disaster, (b) earthquake disaster, (c) storm surge disaster.
Sustainability 14 10488 g007
Figure 8. Disaster statistics in urban areas of Tianjin.
Sustainability 14 10488 g008
Figure 9. Distribution map for (a) flood disaster, (b) earthquake disaster, and (c) storm surge.
Sustainability 14 10488 g009
Figure 10. Lorenz curve of each disaster.
Sustainability 14 10488 g010
Figure 11. Direction distribution map for (a) flood disaster, (b) earthquake disaster, (c) storm surge disaster, (d) multi-disaster.
Sustainability 14 10488 g011
Figure 12. Moran scatter plot of (a) flood disaster, (b) earthquake disaster, and (c) storm surge disaster.
Sustainability 14 10488 g012
Figure 13. Agglomeration ratio of (a) flood, (b) earthquake, (c) storm surge.
Sustainability 14 10488 g013
Figure 14. (a) Geo-spatial distribution of flood disaster Moran scatter map, (b) geo-spatial distribution of earthquake disasters Moran scatter map, (c) geo-spatial distribution of storm surge disaster Moran scatter map.
Sustainability 14 10488 g014
Figure 15. Comprehensive influence coefficient and comprehensive influence index of each factor.
Sustainability 14 10488 g015
Figure 16. The proportion of each influence factor by (a) TRSM and (b) CIEM.
Sustainability 14 10488 g016
Table 1. Data sources and descriptions.
CategoryFactorData TypeData Sources
Disaster dataHistorical flood disastersNumerical valueChina Meteorological Disaster Yearbook, Tianjin Oceanic Bureau, Tianjin Seismological Bureau official website (http://www.tjdzj.gov.cn, accessed on 15 March 2022)
Historical earthquake disasters
Historical storm surge disasters
Influence factorsRainfallRaster dataCenter for Resources and Environmental Science and Data, Chinese Academy of Sciences (http://www.resdc.cn, accessed on 15 March 2022)
Elevation
Slope
Soil type
Land use type (LU)
Vegetation coverage (VC)
Drainage density (DD)
Population (POP)
Gross Domestic Product (GDP)
Secondary geological disasters (SGD)AtlasRegional atlas of geological hazard susceptibility in China
Elderly populationNumerical valueTianjin Statistical Yearbook
Thousand hospital beds (THB)
Table 2. Global Moran’s I index results of various disasters in Tianjin.
Disaster TypesMoran’s IndexZ-Scorep-Value
Flood 0.0635092.0568210.039703
Earthquake 0.2661785.2116360.000014
Storm surge −0.0010581.0456040.295744
Table 3. Flood disaster GeoDetector results.
TypeRainfallElevationSlopeSoilLUVCDDPOPGDP
Rainfall0.732
Elevation0.7480.167
Slope0.7660.1690.158
Soil0.8020.4650.4710.451
LU0.8810.3300.3390.6120.233
VC0.8710.3140.3270.5710.3920.214
DD0.8030.2240.2340.5310.4120.3600.081
POP0.9300.4410.4620.6330.5540.5310.6100.425
GDP0.9260.3400.3500.6110.5490.5050.4500.7890.317
Table 4. Seismic disaster GeoDetector results.
TypePOPEPOPTHBGDPSGDElevationSlopeSoilLU
POP0.652
EPOP0.7910.172
THB0.7890.7570.503
GDP0.7720.8210.8420.624
SGD0.6790.3200.5240.7420.185
Elevation0.6670.2210.5310.6530.1910.063
Slope0.6570.2050.5370.6280.1890.0690.004
Soil0.7190.4310.6280.7150.2950.1970.2030.193
LU0.7160.5420.6540.7010.4740.4220.4170.5100.371
Table 5. The judgment matrix of storm surge disaster impact factors.
TypeMeteorologyATGLElevationSlopeSoilLUPOPGDP
Meteorology123346522
AT1/212235411
GL1/31/2112431/21/2
Elevation1/31/2112431/21/2
Slope1/41/31/21/21321/31/3
Soil1/61/51/41/41/311/21/51/5
LU1/51/41/31/31/2211/41/4
POP1/212235411
GDP1/212235411
Table 6. Comprehensive effect of common factors on multiple disasters.
TypeFloodEarthquakeStorm SurgeCijHij
Elevation0.0570.0230.0901.7060.289
Slope0.1620.0010.0571.9880.438
Soil0.0840.0700.0271.6560.298
LU0.0770.1340.0381.6820.419
POP0.1530.2360.1511.4010.756
GDP0.1140.2250.1511.4820.727
Table 7. Factor scoring and ranking based on TRSM and CIEM.
ModelTypeElevationSlopeSoilLUPOPGDP
TRSMScore0.1690.2210.180.2490.5390.49
Rank645312
CIEMScore0.2890.4380.2980.4190.7560.727
Rank635412
Publisher’s Note: MDPI stays neutral with regard to jurisdictional claims in published maps and institutional affiliations.