Article

The Curvilinear Relationship between Employee Voice and Managers’ Performance Evaluations: The Moderating Role of Voice Consensus

School of Management, Xi’an Jiaotong University, No.28, West Xianning Road, Xi’an 710049, China
*
Author to whom correspondence should be addressed.
Sustainability 2022, 14(16), 9970; https://doi.org/10.3390/su14169970
Submission received: 2 June 2022 / Revised: 1 August 2022 / Accepted: 9 August 2022 / Published: 12 August 2022

Abstract

:
In the rapidly changing business environment, employee voice can be a key driver of organizations’ sustainable development. However, how can employees ensure that they receive a positive response from their managers? To what extent do the voice patterns within the team influence managers’ reactions to one employee’s voice behaviors? To address these questions, we draw on the antecedent–benefit–cost framework (ABC framework) and knowledge management literature to investigate the inverted U-shaped relationship between employee voice and managers’ performance evaluations and the role of voice consensus (i.e., the extent to which the frequency of an employee’s voice is dissimilar to that of his/her coworkers) in shaping this relationship. The results of a field study of 173 employees in 37 groups show that employees who engage in moderate levels of voice are rated as better performers than those who rarely voice or voice very frequently, especially when the frequency of employees’ voice deviates from the voice frequency of their coworkers (i.e., low consensus). These findings highlight that it is not only important to explore the frequency of voice when studying managerial responses to employee voice but to also examine other dimensions of the voice behavior (such as voice consensus).

1. Introduction

In order to achieve long-term success in uncertain and complex environments, organizations are forced to think and work in more creative and agile ways to maintain sustainability. Organizational sustainability is an organization’s capability to achieve sustainable development by delivering simultaneously economic, social, and environmental benefits (i.e., the triple bottom line) [1,2]. Employee voice, i.e., employees’ discretionary upward expression of challenging but constructive ideas or concerns on work-related issues [3,4], can serve as a crucial driver of organizations’ sustainable success and organizational resilience. For example, research indeed indicates that employee voice enables organizations to enhance team performance [5] and stimulate team innovation [6], which are relevant to the economic dimension of organizational sustainability. Moreover, employee voice can improve employees’ engagement with their work [7], which is a key aspect of the human dimension (i.e., social dimension) of organizational sustainability [8]. Furthermore, the knowledge and the diagnostic information shared by the voicing employee help create a cognitive resource that can enhance organizational resilience [9]. Consequently, both researchers [10,11] and practitioners have highlighted the importance of encouraging employee voice. However, recent research has shown that managers’ responses are vital for voice to improve organizational effectiveness [12] and stimulate employees’ subsequent voice behavior [13,14]. As a result, some researchers have started paying attention to how employees can receive positive responses from their managers [15,16,17,18]. Although their findings are enlightening, our theoretical understanding of the relationship between employee voice and managerial responses is limited in two important ways.
First, the effect of employee voice on managerial responses is mixed and warrants more investigation. Some research has shown that employees who voice may be seen as better performers [18,19], but other research has indicated that employee voice diminishes one’s chances to be promoted and receive a salary raise [20]. These inconsistent findings may be due, in part, to the fact that past research mainly focuses on the desirable immediate outcomes (i.e., benefits) or the undesirable immediate outcomes (i.e., costs) only. However, employee voice is a constructive but challenging behavior [12], and when expressed, it simultaneously creates benefits and costs for the voicers. As such, to develop a comprehensive understanding of the consequences of employee voice, it is important to take into account the potential benefits and costs of voice. According to the antecedent–benefit–cost framework (ABC framework) [21], by conceptually analyzing the underlying cost and benefit functions, the too-much-of-a-good-thing (TMGT) effect can be predicted. Hence, we simultaneously take into account both the potential benefits (knowledge-sharing perspective [22]) and costs (psychological-threat perspective [23]) of employee voice to explore whether there is a nonlinear relationship between the frequency of employee voice and managers’ performance evaluations. The frequency of employee voice is defined as how often an employee proactively speaks up about various work-related issues to his/her supervisors [17]. It ranges from voicing rarely to voicing very frequently.
Second, to manage business complexity, organizations are increasingly designed around teams and interdependent tasks. Thus, employee voice does not take place in just a dyadic context. Managers can observe voice behaviors of different team members, which may serve as standards for comparison in determining managers’ reactions to the focal employee [24]. While extant research about voice behavior in workgroup contexts has examined the effect of mean or average levels of voice across all members [25], this line of research implicitly assumes that voice is equally distributed among team members. However, this is rarely so, and the distribution patterns of employee voice might impact the outcomes of employee voice [26]. Thus, we focus on another dimension of voice patterns—voice consensus—to explicitly capture the difference in voice frequency between an employee and his/her coworkers and examine how it interacts with voice frequency to influence manager-rated overall performance.
Taken together, the above-mentioned research gap motivates the origin of this paper, which is focused on the following research questions:
RQ1. How much voice is optimal for employees to receive the highest performance evaluations?
RQ2. Does voice consensus buffer or enhance the effect of employee voice on performance evaluations?
To address these questions, we based on the ABC framework and conducted a field study of 173 employees in 37 groups to theoretically develop and empirically test the inverted U-shaped relationship between employee voice and managers’ performance evaluations and the role of voice consensus in shaping this relationship. The findings of this research advance organizational sustainability, proactivity, and voice literature in two ways. First, by theorizing the benefit of employee voice from the knowledge-sharing perspective in the context of organizational sustainability, our research breaks the traditional top-down approach, which focuses on the role of human resource management and leadership. Second, our conceptualization of voice consensus (i.e., the extent to which an employee’s voice frequency is similar/dissimilar to that of his/her coworkers) advances voice research within the workgroup context, which assumes that voice is equally distributed among team members and could also be meaningfully extended to other forms of proactive behavior. Third, our research pinpoints voice consensus as an important condition under which the inverted U-shaped relationship between employee voice and managers’ performance evaluations can be observed.
In what follows, we give a detailed introduction of voice consensus. Then, we briefly describe the ABC framework as the theoretical foundation for our arguments and explain why employees who voice at a moderate level can receive the highest performance evaluations from their managers. We add further nuance by positioning voice consensus as a moderator of the relationship between employee voice and managers’ performance evaluations. We empirically test these ideas with a field study of 173 employees in 37 groups.

2. Theory and Hypotheses

2.1. Voice Consensus

Kelley [27] indicated that supervisors use three important cues to evaluate employees’ behavior: (1) consensus information, or the extent to which other employees also behave in the same way; (2) consistency information, which reflects the extent to which the employee tends to behave this way in other situations; and (3) distinctiveness information, or the extent to which an employee tends to behave this way toward only one specific target rather than different targets.
To date, research has primarily focused on the role of the frequency of employee voice (or consistency) in shaping managers’ responses to employee voice [3,18], showing mixed results as we mentioned before. However, it remains undetermined how other information cues conveyed by voice behavior shape managerial responses. Moving beyond leaders’ effects and including another contextual element (i.e., coworkers), we begin to fill this gap by examining how voice consensus may shape the employee voice–overall performance relationship. Voice consensus is defined as the extent to which an employee is similar/dissimilar to his/her coworkers in terms of voice frequency. Different from team voice, which captures the total amount of voice of all team members, voice consensus is an individual-within-group construct that captures the absolute separation between an employee and his or her coworkers in terms of voice frequency. High voice consensus suggests that an employee’s voice frequency is similar to that of his/her coworkers. For example, an employee voices very frequently, and his/her coworkers also voice very frequently. Low voice consensus indicates that an employee’s voice frequency is dissimilar to that of his/her coworkers. For example, an employee rarely voices his/her ideas, but other team members voice frequently.

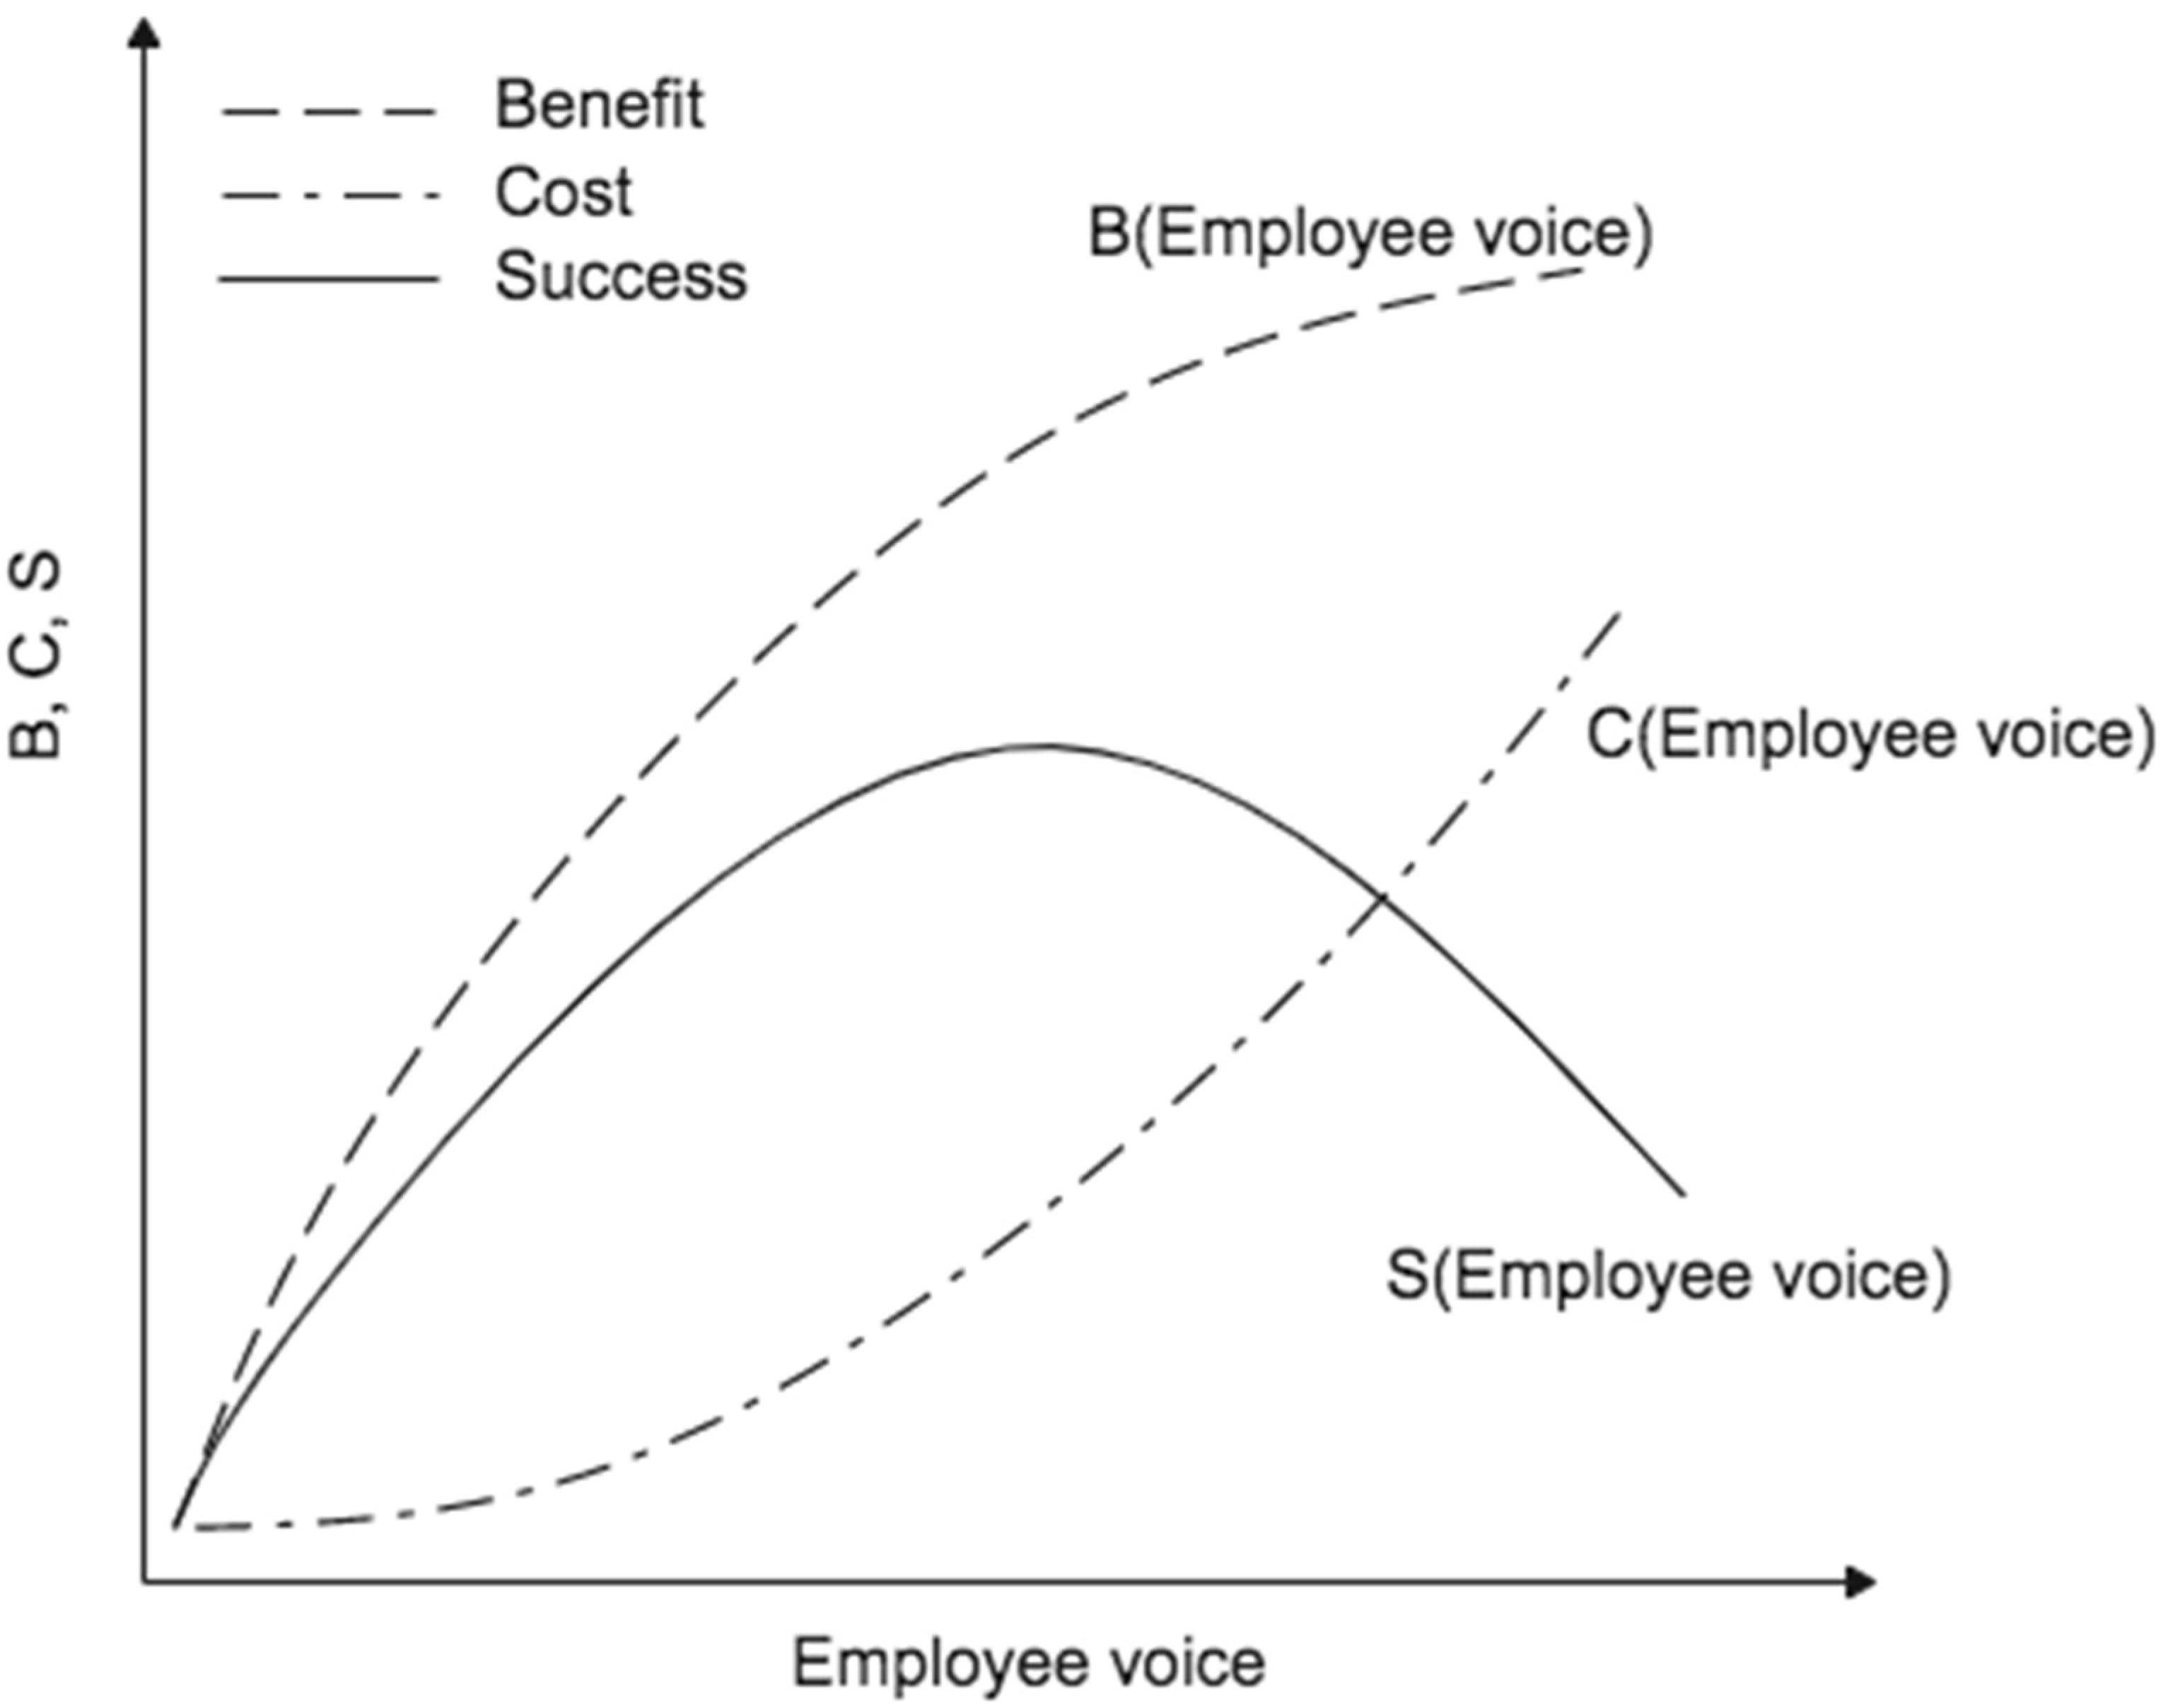
2.2. The ABC Framework

According to the ABC framework [21], we propose that by conceptually analyzing the desirable immediate outcomes (i.e., benefits) and the undesirable immediate outcomes (i.e., costs), the too-much-of-a-good-thing (TMGT) effect can be predicted.
The benefit of employee voice can be explained from the knowledge-sharing perspective in the context of sustainable organizations. From this perspective, employee voice can be seen as a kind of knowledge-sharing behavior. Through upward expression of challenging but constructive ideas or concerns on work-related issues, employees share their personalized information about facts, procedures, observations, and judgments (i.e., knowledge) [28]. Knowledge is an important resource in organizations, and knowledge sharing is a fundamental process of knowledge management that can help the achievement of organizational goals and support the sustainable development of organizations [22]. Accordingly, employee voice signals to managers that they are willing to share their knowledge and exert effort to help the organization. Thus, managers might respond positively to employee voice and give them high performance evaluations.
The cost of employee voice can be explained from the psychological sustainable threat perspective. Psychological-threat perspective indicates that employee voice challenges managers’ competence, status, and authority, drawing managers’ attention to their shortcomings and making them feel threatened [23]. Thus, managers might respond defensively to employee voice and lower their evaluation of employee performance.

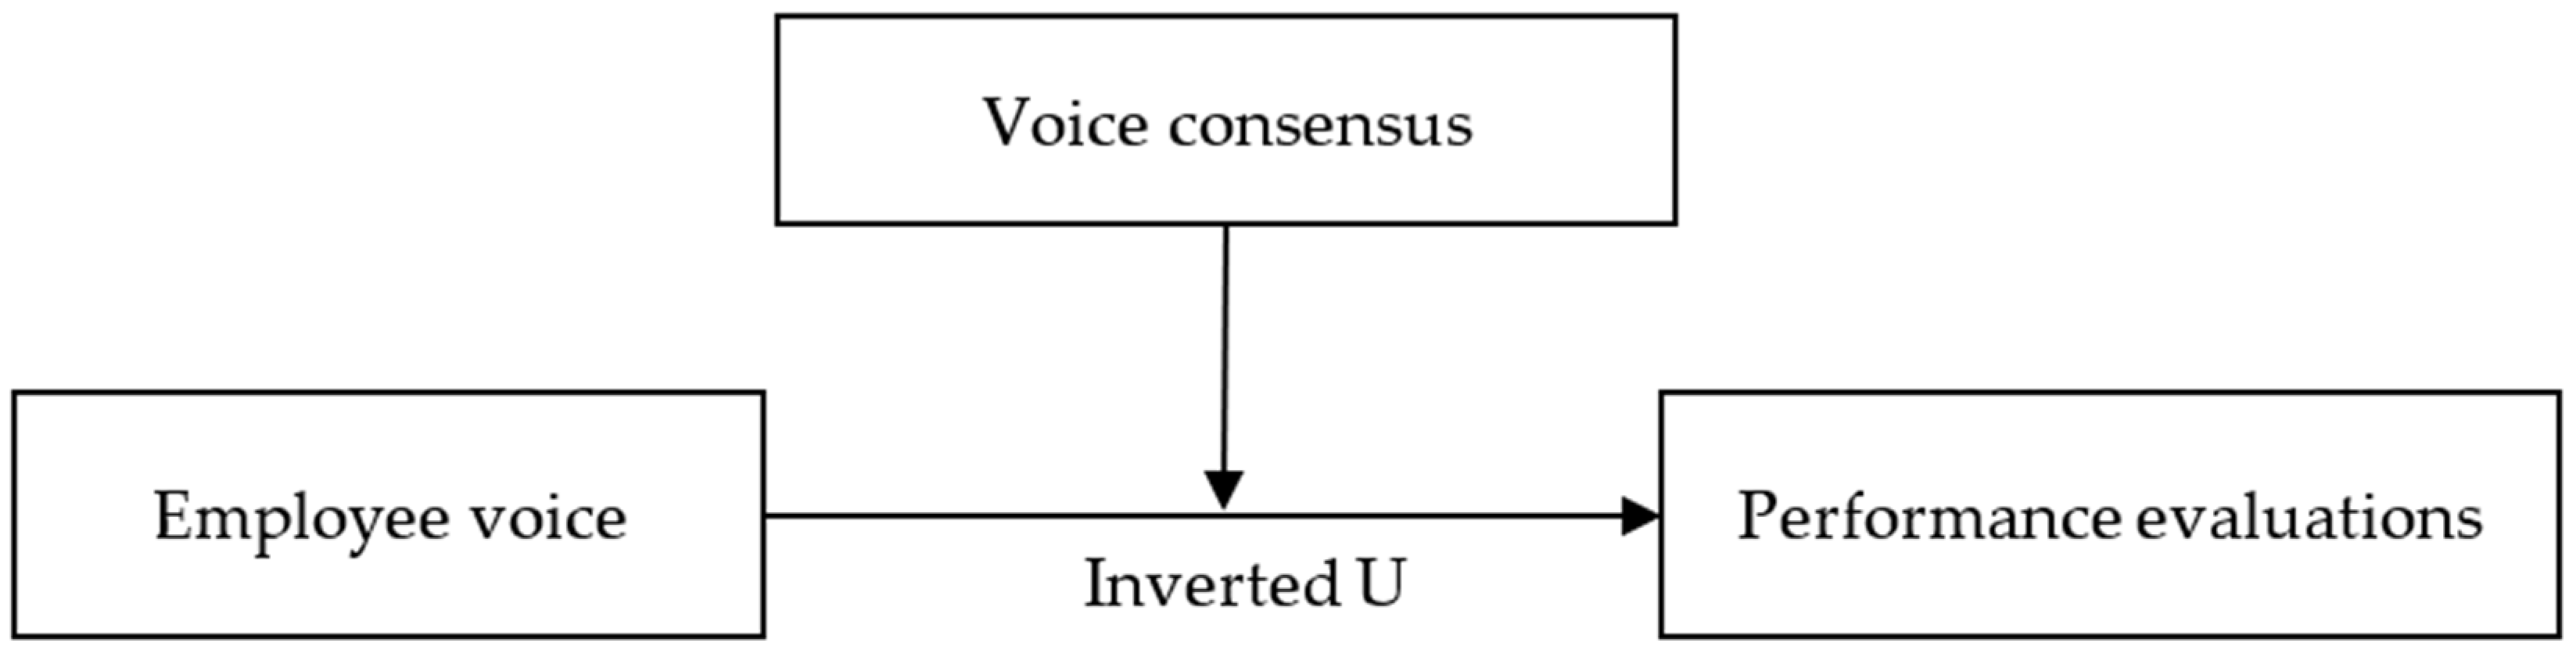
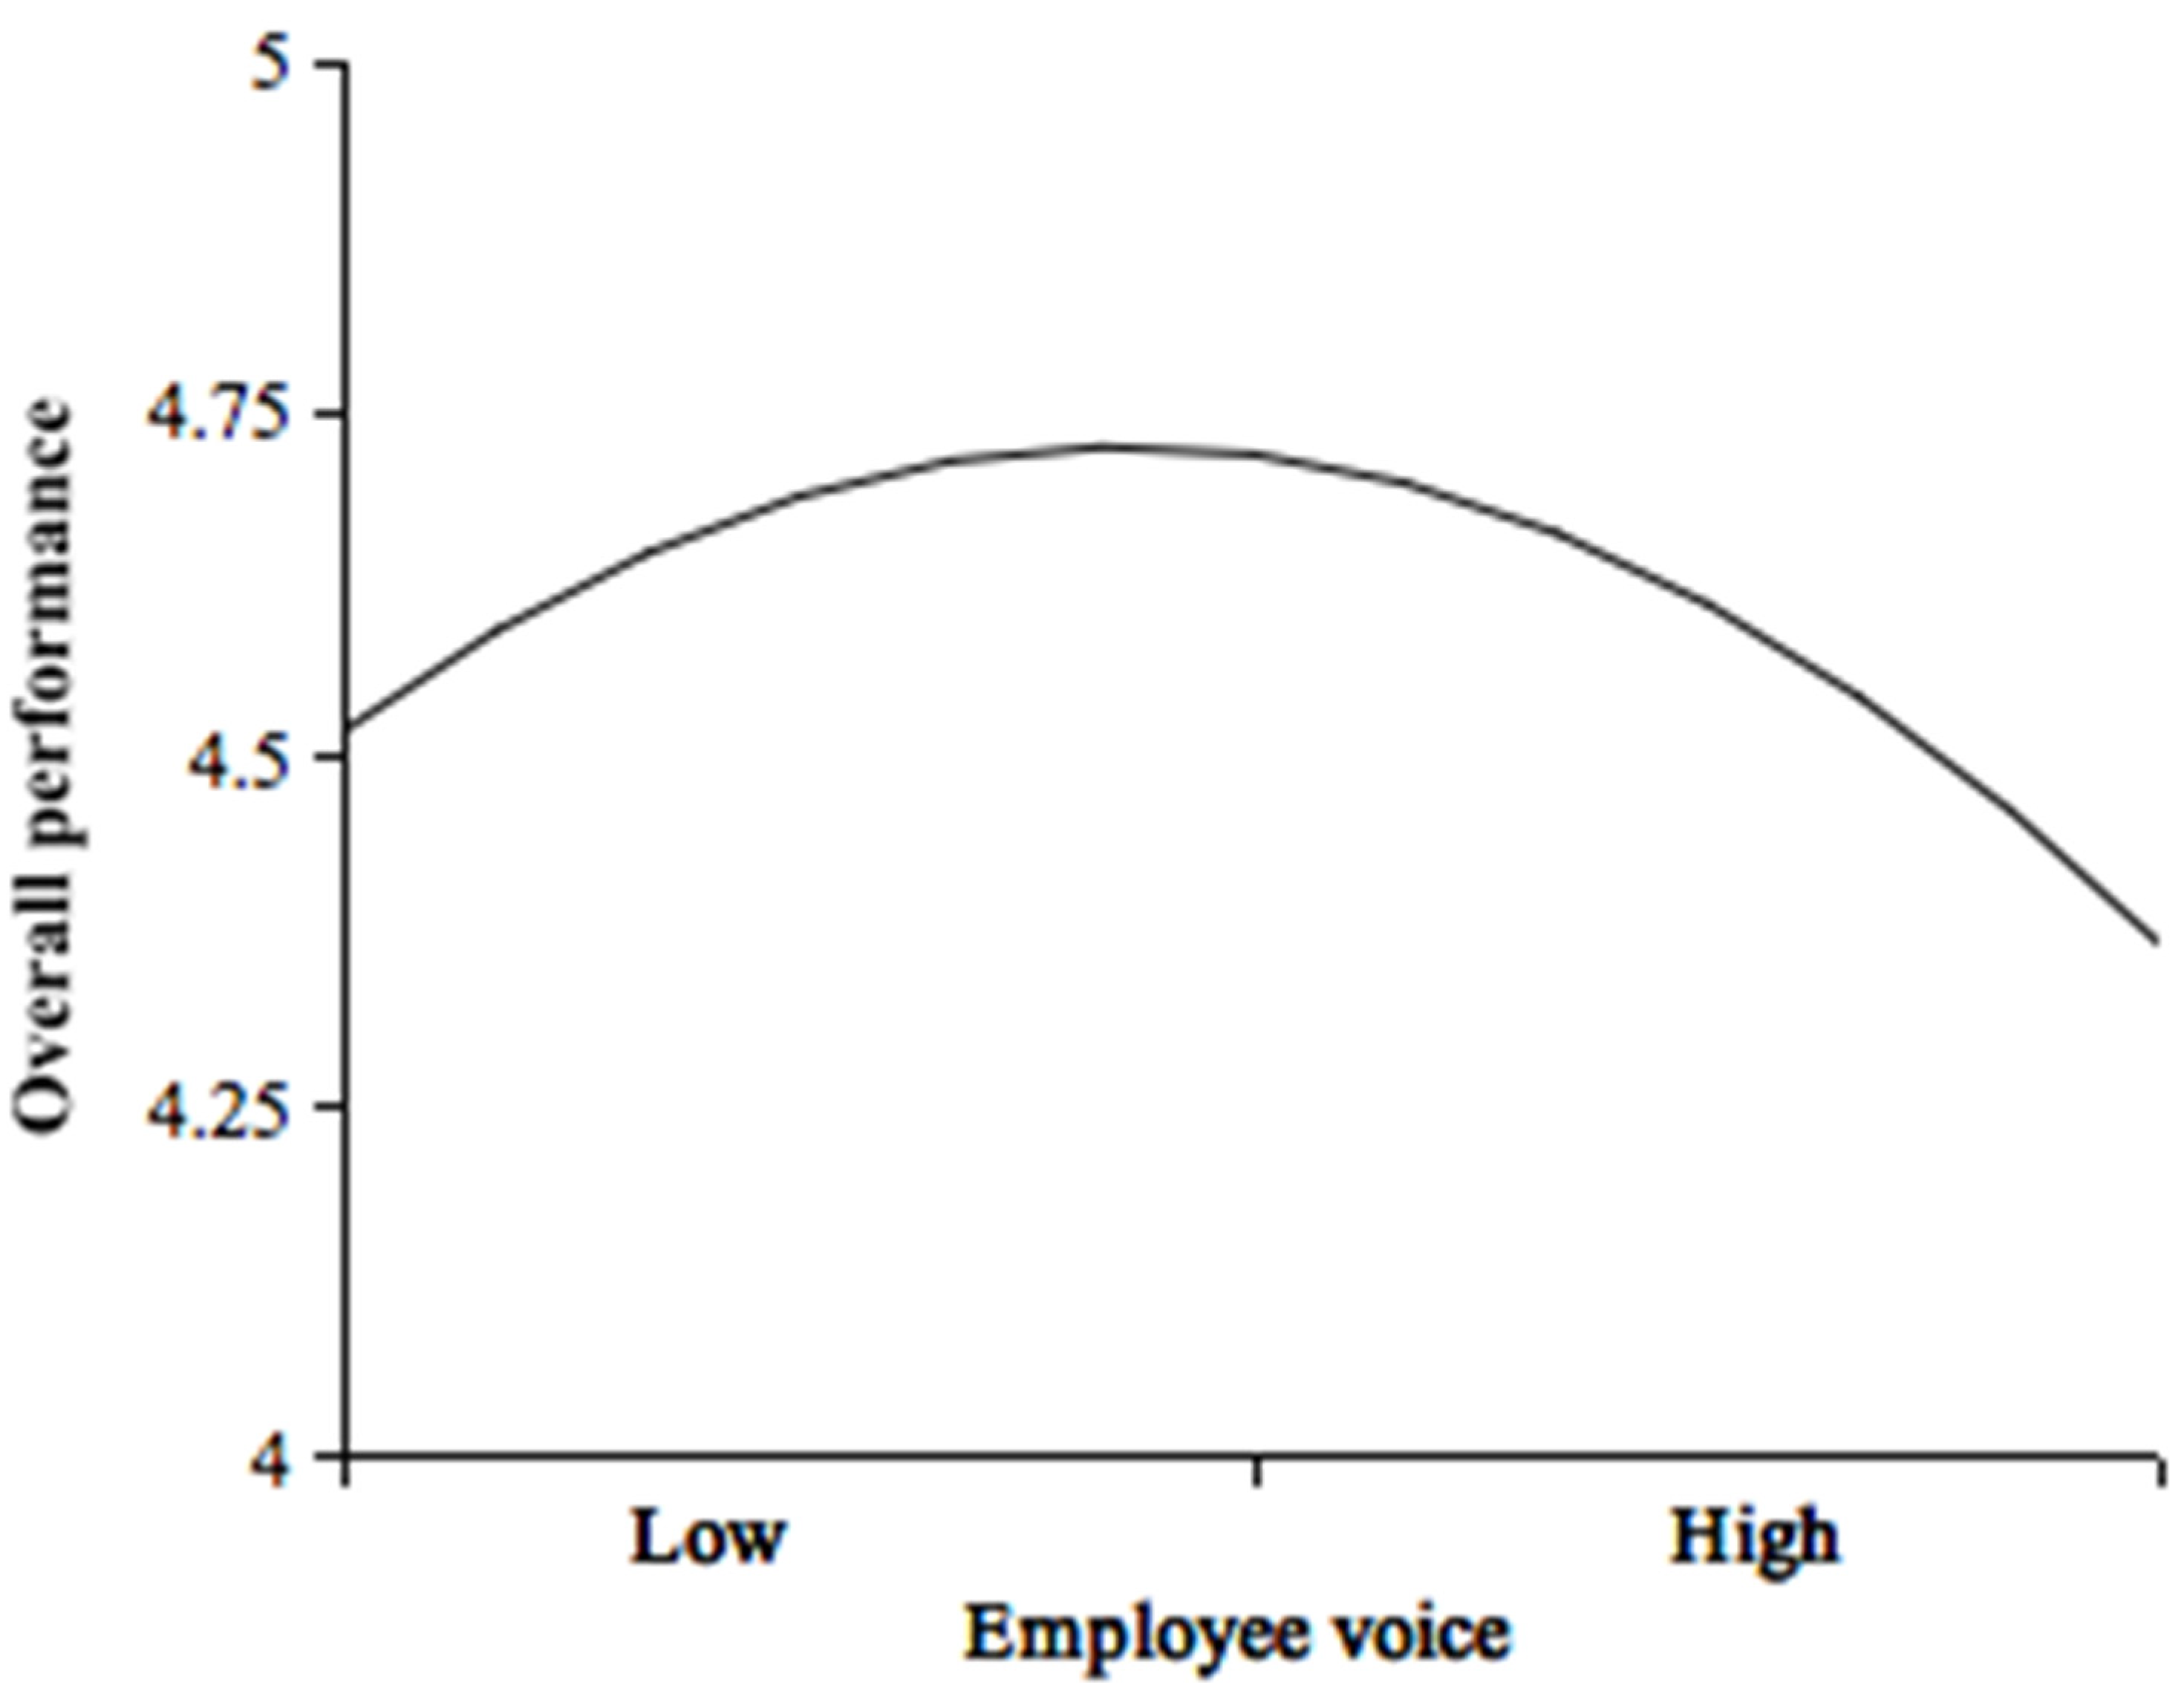
2.3. The Inverted U-Shaped Relationship between Employee Voice and Overall Performance

Employee voice is a constructive but challenging behavior, and when expressed, it simultaneously creates benefits and costs for the voicer. The benefits and costs work as two latent functions that jointly make up the inverted U-shaped relationship between employee voice and manager-rated overall performance.
Specifically, employee voice can elicit managers’ perception of loyalty and commitment as a benefit in a concave pattern (B (employee voice) in Figure 1). From the knowledge-sharing perspective [22], when employees voice at a lower frequency, increased voice frequency signals to managers that the voicing employee is willing to share his/her knowledge and exert more effort to help managers and improve organizational effectiveness [23]. Consequently, managers may perceive this employee as loyal and committed to the organization and thereby evaluate his/her performance more positively. However, when employees voice too much, managers may perceive these employees as being relatively more forceful in their efforts to challenge the status quo [17]. Such feelings may lead managers to question the loyalty and commitment of the voicing employee and refrain from giving the employee a higher performance evaluation [12,29].
Alternatively, employee voice may lead to managers’ perception of threat as a cost in a convex pattern (C (employee voice) in Figure 1). From the psychological-threat perspective [23], managers may take the voice behavior personally and regard employee voice as criticisms [30], as employee voice challenges the status quo, which is often designed or overseen by managers [23,31]. Specifically, when employees voice at a lower frequency, the manager may feel motivated rather than forced to make the change. Thereby, the manager will not form a strong perception of threat. In contrast, when managers already receive a high frequency of voice from an employee, they may view the employee’s persistent and frequent voice as implicit or explicit personal criticisms [30] and regard the employee as frequently challenging their authority and competence, which will trigger feelings of embarrassment or vulnerability [23]. Further, managers may devalue this employee’s voice, as they may think that this employee has not given sufficient thought to the voiced issues [17]. As a result, high voice frequency may spark strong feelings of threat and result in managers evaluating the voicing employee negatively.
Altogether, at lower levels of voice frequency, the incremental benefits from managers’ perception of loyalty and commitment outweigh the incremental costs of managers’ perception of threat, leading to higher performance evaluations. At higher levels of voice frequency, the incremental costs of employee voice outweigh the incremental benefits, leading to lower performance evaluations (S (employee voice) in Figure 1). Accordingly, the voicing employee can receive the highest performance evaluations from their managers only when they voice at a moderate level. Hence, we propose:
Hypothesis 1.
There is an inverted U-shaped relationship between employee voice and manager-rated overall performance.

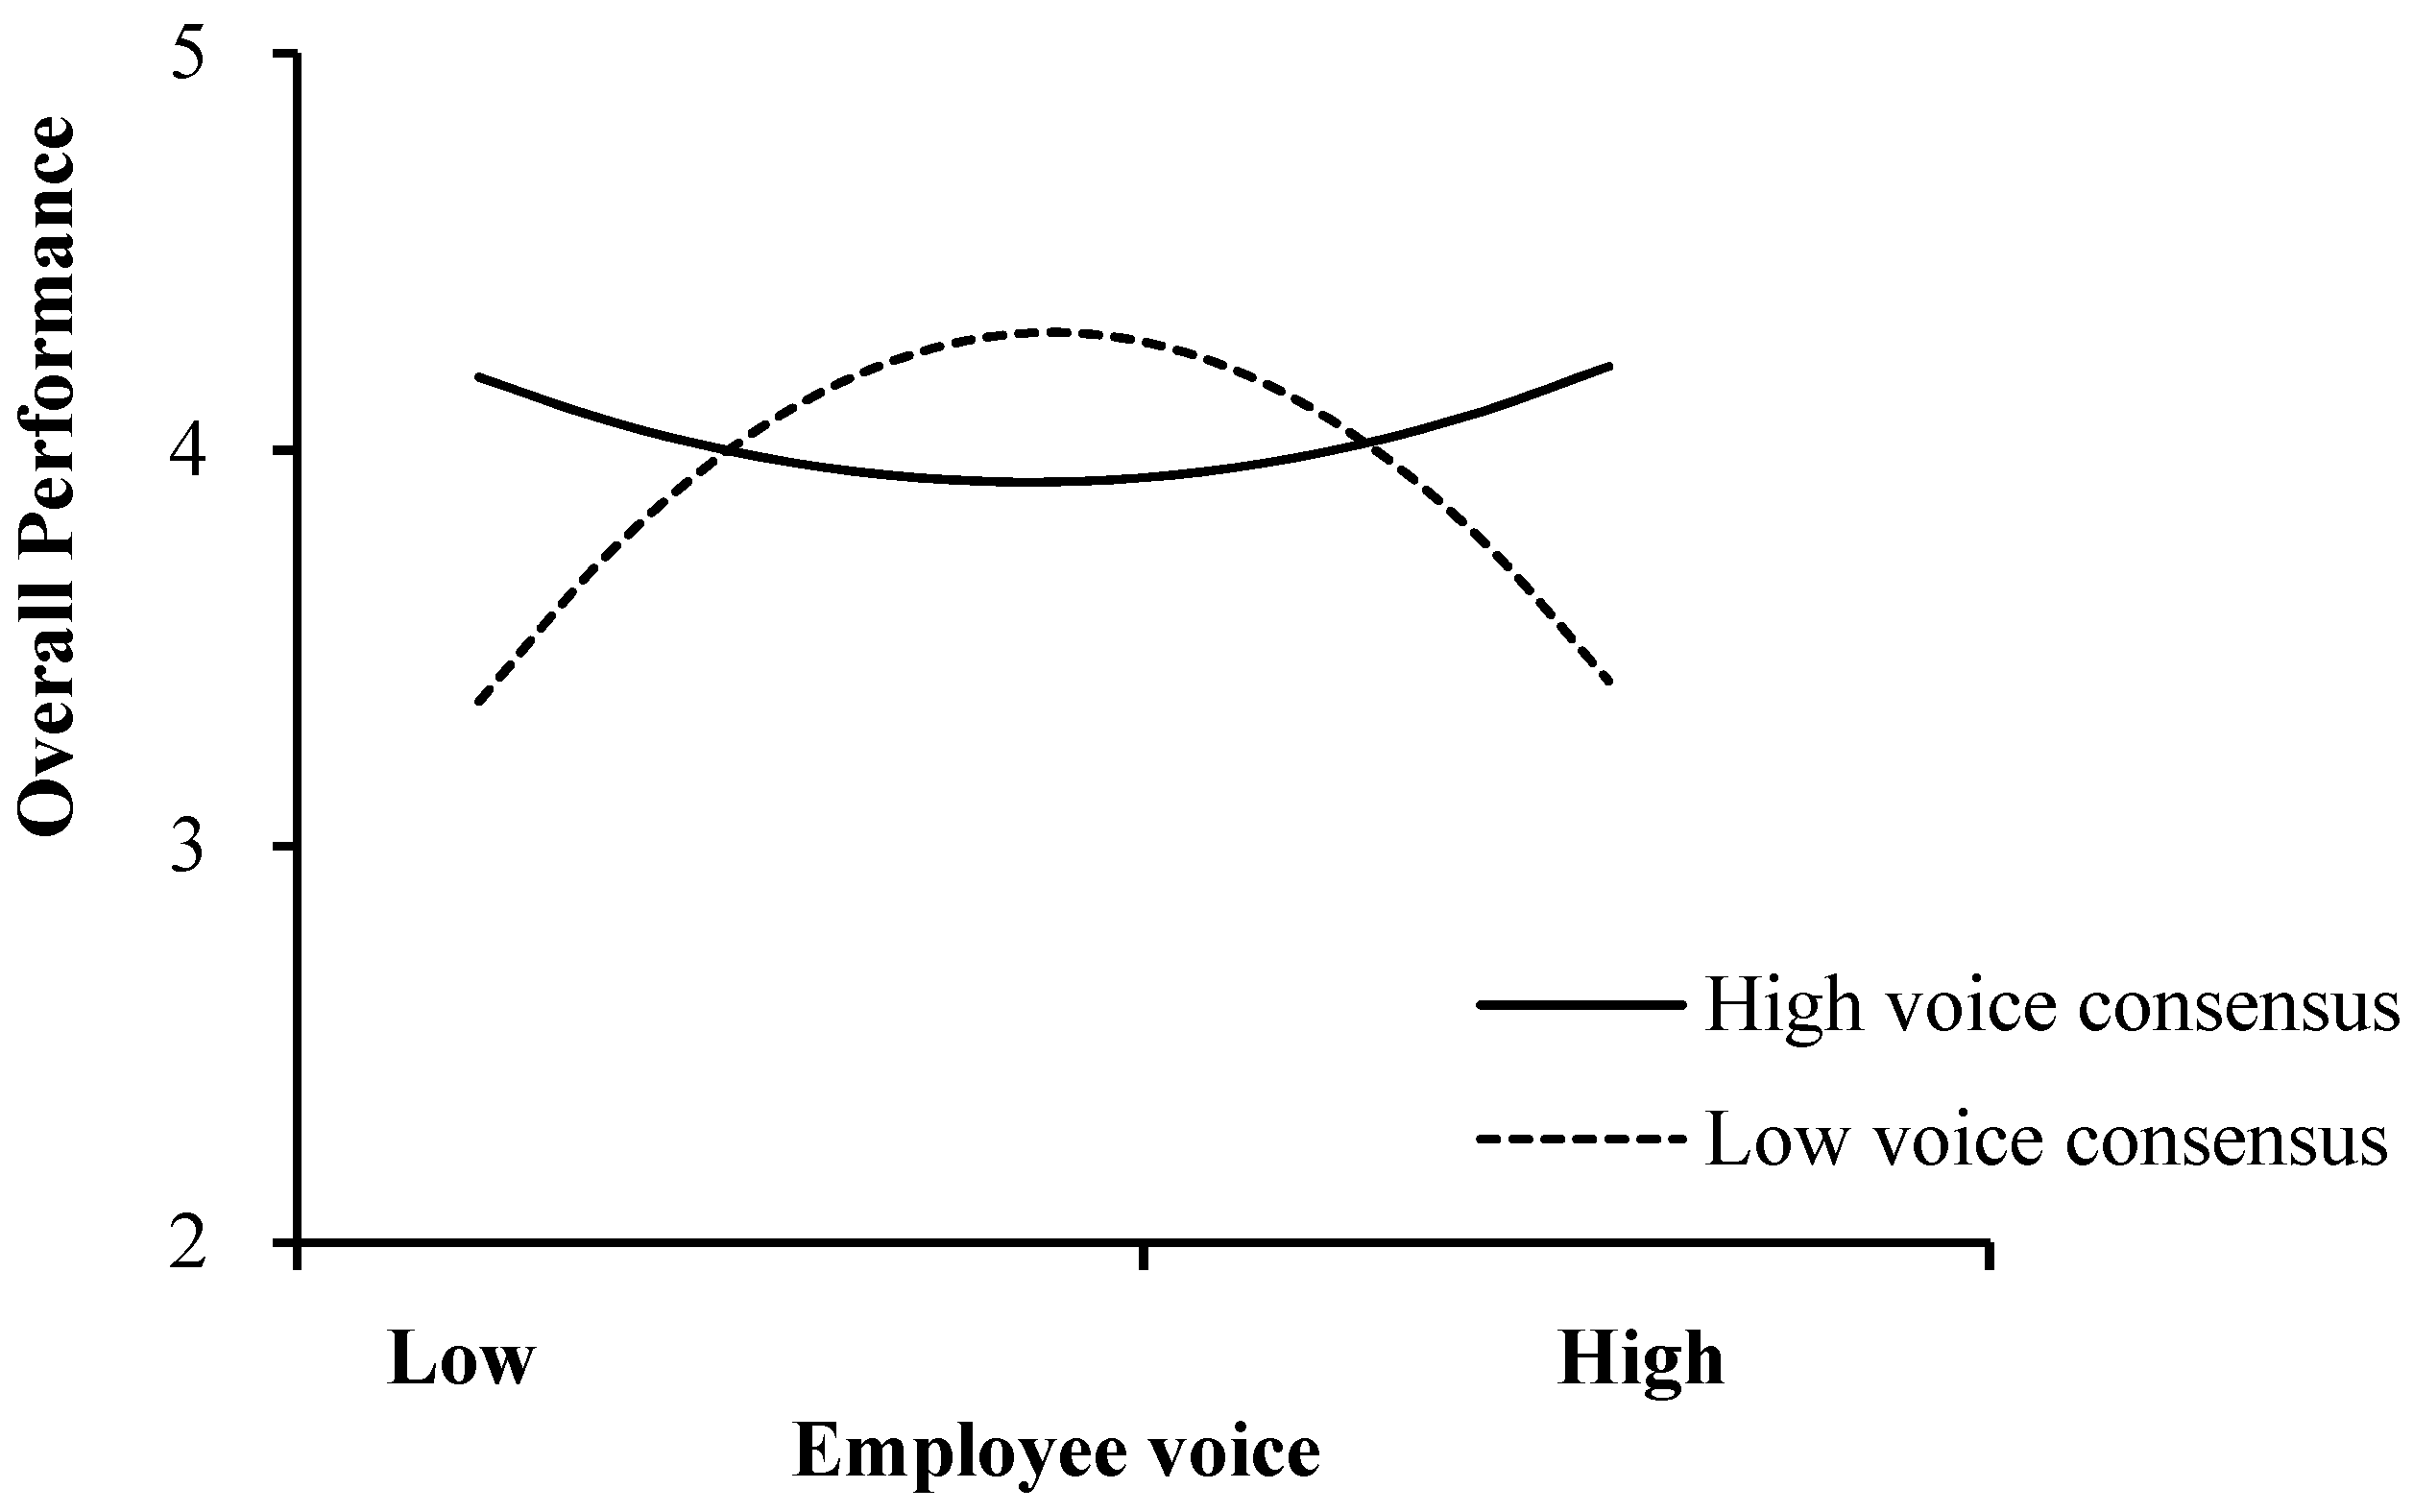
2.4. The Moderating Role of Voice Consensus
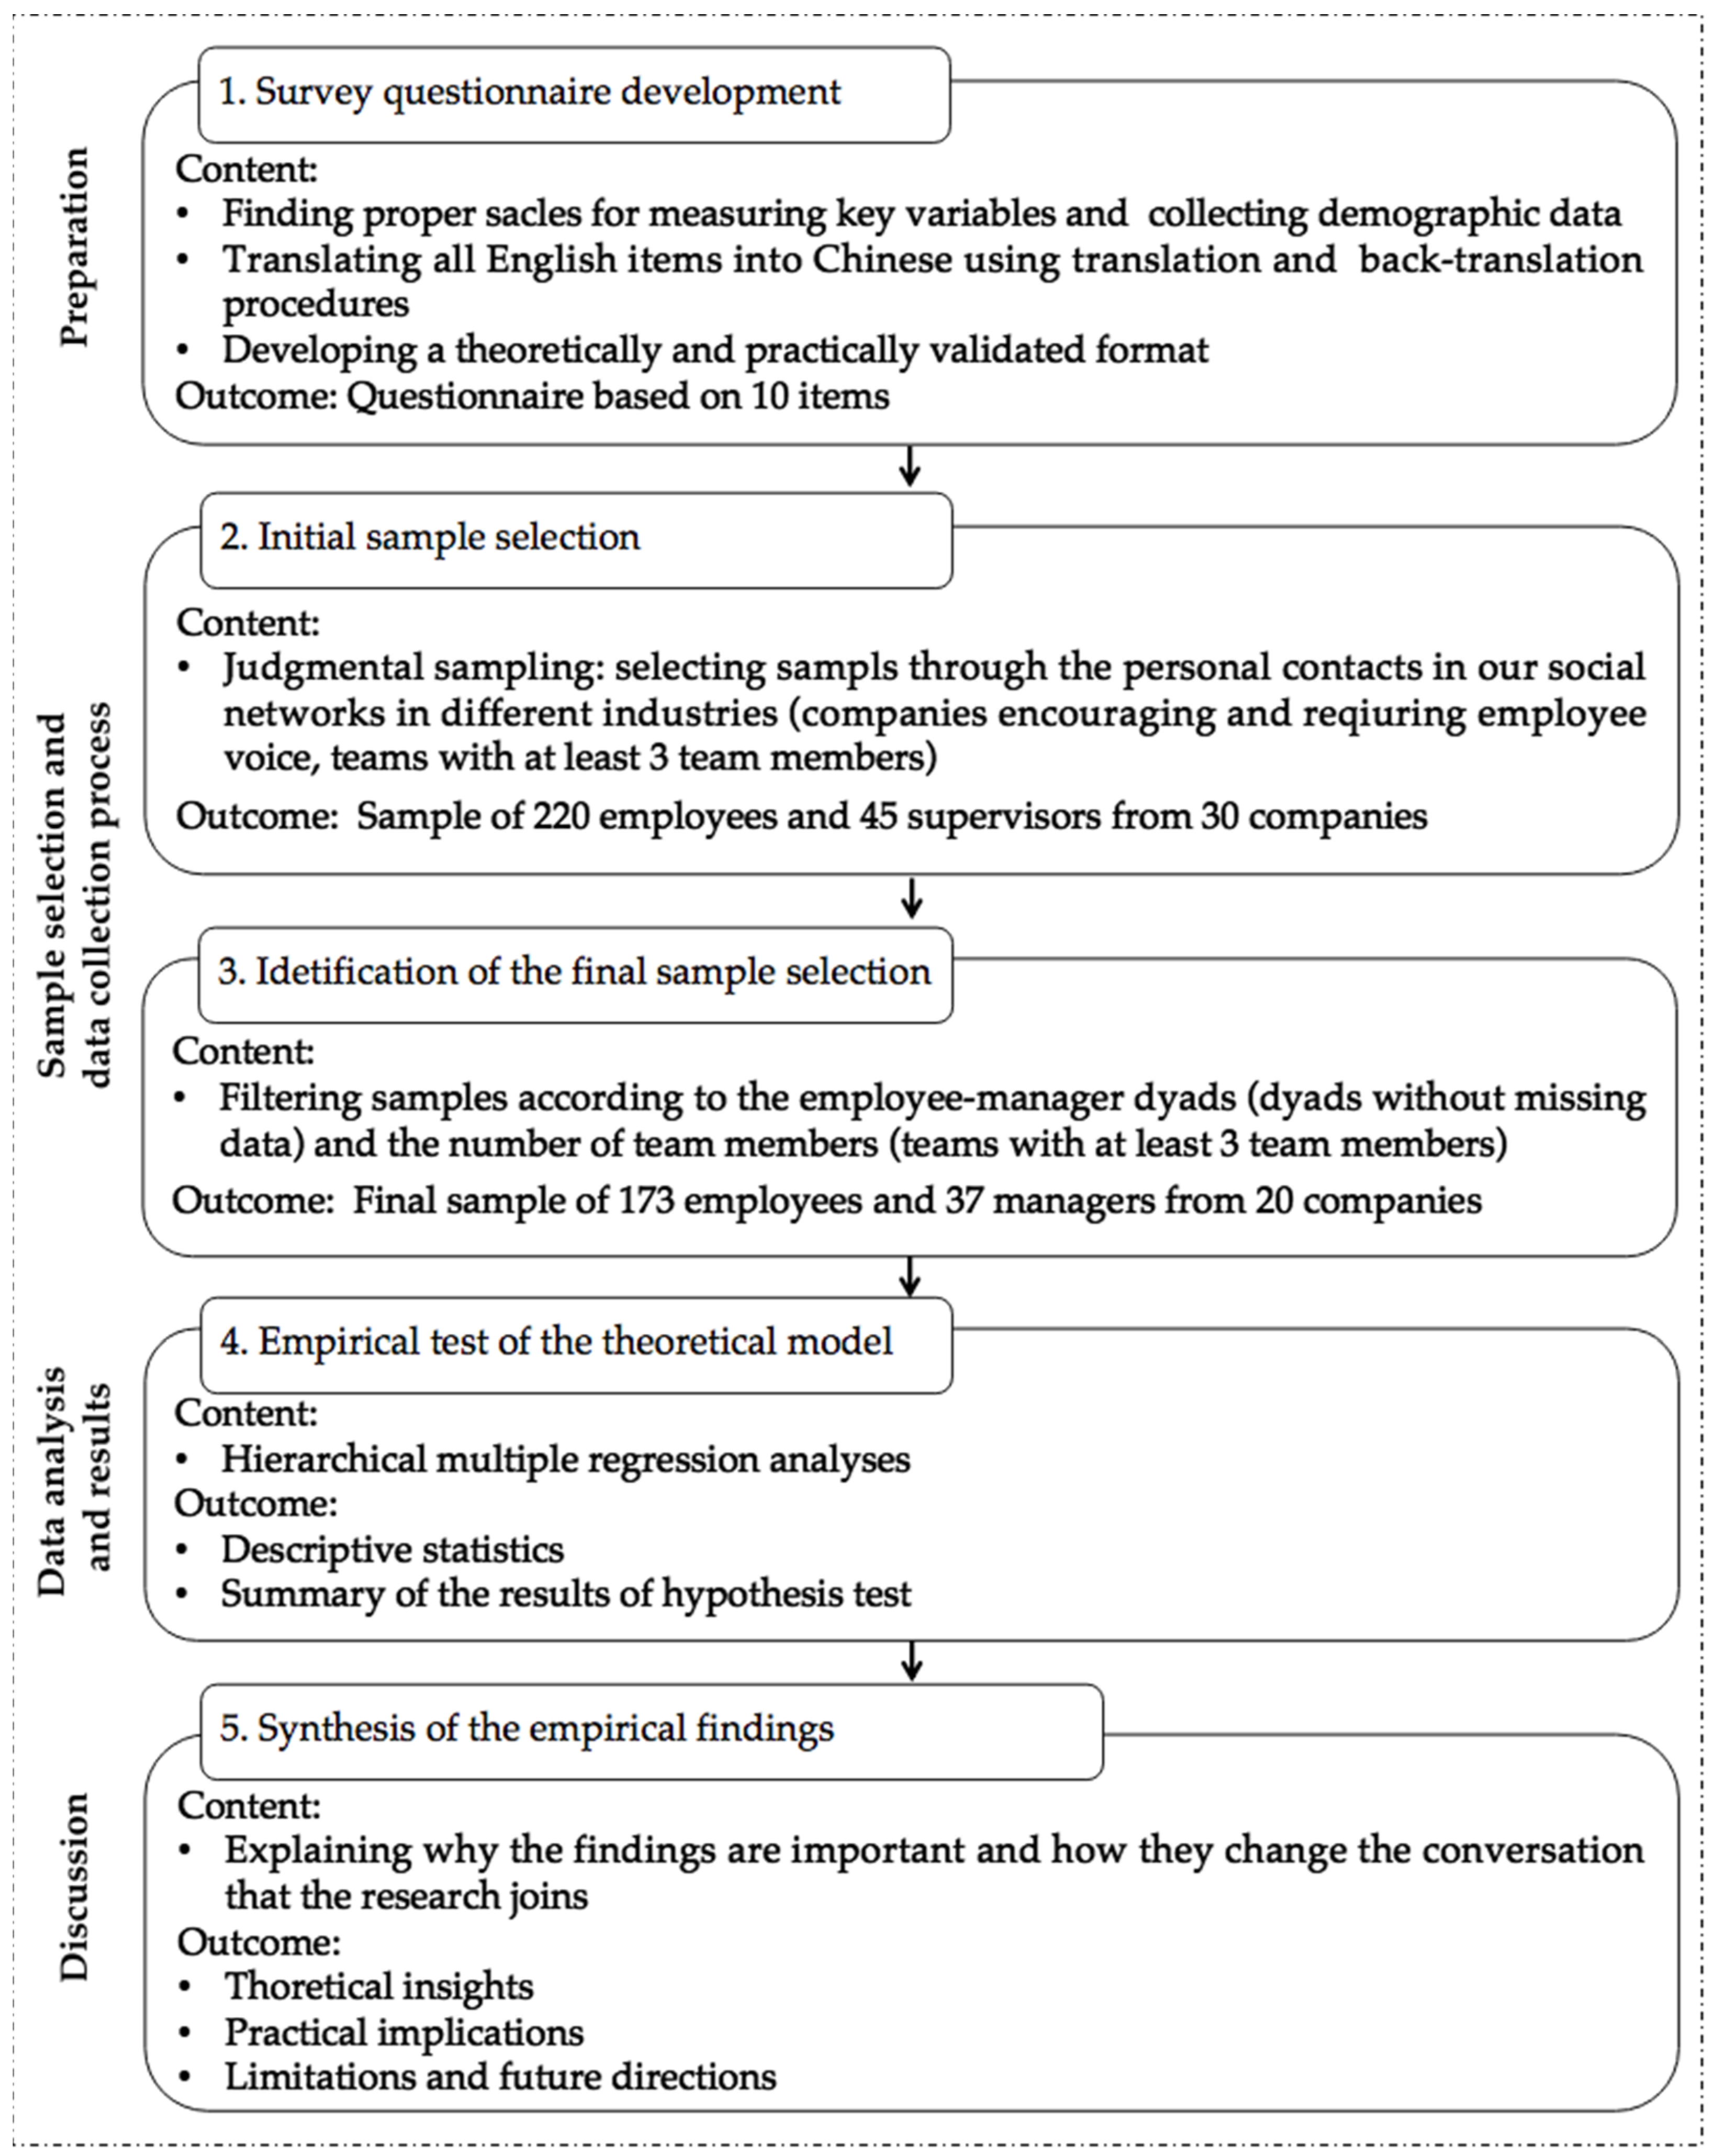
Research on proactive behavior indicates that situational characteristics influence the consequences of proactive behaviors, such as voice behavior in work groups [32]. Employee voice does not take place in a vacuum, and coworkers’ voice behaviors may serve as standards for comparison in determining managers’ reactions to the focal employee [20]. Thus, we introduce the term voice consensus to take into account coworkers, an important but neglected contextual element. We theorize that voice consensus, which captures an employee’s overall similarity/dissimilarity with his/her coworkers with respect to voice frequency, moderates the inverted U-shaped relationship between voice frequency and manager-rated overall performance.
When an employee’s voice frequency is similar to that of his/her coworkers (high voice consensus), managers have a high base-rate expectation that most team members behave in the same way [33]. In this situation, the focal employee’s voice behavior is externally justified and appropriate [34]. Consequently, managers’ perceptions of threats will be alleviated. Therefore, in high-voice-consensus contexts, regardless of whether employees’ voice frequency is low or high, managers tend to view their voice in a positive light and reward them with favorable evaluations.
When an employee’s voice frequency is dissimilar to that of his/her coworkers (low voice consensus), the focal employee’s voice behavior departs from managers’ expectations about voice behavior in the team [27]. Thus, managers may see him/her as out of synch with the organization [35]. In particular, when the focal employee voices at high frequencies, the contrast effect between this employee’s voice behavior and that of his/her coworkers will make the voice behavior more striking [24]. Consequently, the influence of the threatening nature of voice behavior will be enhanced. Hence, we propose:
Hypothesis 2.
Voice consensus moderates the inverted U-shaped relationship between employee voice and manager-rated overall performance, in that the positive link between voice frequency and manager-rated overall performance is more likely to become negative at high voice frequencies when an employee’s voice frequency is dissimilar to that of his/her coworkers.
The proposed research model is presented in Figure 2.

3. Method

3.1. Sample Selection

In this research, we wanted to collect data to examine whether there is an inverted U-shaped relationship between employee voice and manager-rated performance, as well as the moderating role of voice consensus in this relationship. In order to ensure that employee voice can be an important factor that influences manager-rated performance, we need to select samples from professional environments where employee voice is encouraged and required [23]. Thus, following other researchers’ strategy [36,37], a judgmental sampling method was used to recruit respondents in China from industries such as information technology and Internet, consulting, pharmacy, financing, and so on. In addition, as voice consensus is an individual-within-group construct, we need to choose teams with at least three team members.

3.2. Procedures

Multisource data were collected from 30 companies selected through the personal contacts in our social networks in different industries. We first approached the company’s human resources department through invitation emails that explained our study goals and design and obtained a letter of support from them. Then, we invited managers and their employees to complete online surveys, as these companies are located in different cities. Upon accessing the online survey system, participants first read an overview of the study. Then, they were led to an initial survey that contained measures of demographics. After that, employees were led to the measures of their voice behavior, and managers were led to the measure of performance evaluations for each employee. All these employees and supervisors were informed that participation was voluntary, and confidentiality was ensured. To provide the readers with a clear view of the whole process of sample selection, data collection, and the results, Figure 3, reworked from Hristov, Cimini, and Cristofaro [36], systematically reports the research methodology steps.
Initially, we sent invitation emails to 30 companies, of which 220 employees and 45 supervisors agreed to take part in the survey. On average, the managers’ span of control was five people (ranging from three to ten). As we focused on employee–manager dyads as the unit of analysis, any dyads with missing data were removed. Additionally, teams with less than three team members were excluded. The final sample consisted of 173 employees and 37 managers from 20 companies (i.e., response rates of 78.6% and 82.2%, respectively). On average, the employees had worked with their supervisors for 6.0 years, and 76.9% of them were male. The distribution of employee age was as follows: 26–30 years (2.3%), 31–35 years (18.5%), 36–40 years (21.4%), and more than 40 years (57.8%).

3.3. Measures

As all participants were Chinese, we employed translation and back-translation procedures to translate all English items into Chinese.

3.3.1. Employee Voice

Employee voice was rated by employees using three items from Van Dyne and LePine [3]. A sample item is “I speak up with new ideas or changes in procedures” (1 = never, 5 = always). Cronbach’s alpha for this scale was 0.61.

3.3.2. Voice Consensus

Voice consensus is an individual-within-group construct. It captures employees’ similarity/dissimilarity in terms of voice frequency to their coworkers. Thus, we used a similarity equation presented by Zenger and Lawrence [38] to transform individual voice scores into a measure that reflects individual-level dissimilarity in employee voice:
Voice   C i G = [ 1 n 1   j i G ( x i x j ) 2 ] 1 2
where individual-level voice   C i G is the extent to which a team member i within team G differs from his or her team members j with respect to voice frequency, n is the number of members within team G, and x is the individual voice score. The voice   C i G scores were computed for each participant. A voice   C i G score of zero indicates perfect high consensus, whereas a high voice   C i G score indicates low consensus.

3.3.3. Overall Performance

Overall performance was rated by supervisors using two items adapted from Mackenzie, Podsakoff, and Fetter [39]. The two items are “This employee is outstanding” and “This employee is one of the best members of my unit” (1 = strongly disagree, 5 = strongly agree). Cronbach’s alpha of this scale was 0.84.

3.3.4. Control Variables

Following previous research [17], we controlled for the effects of employees’ demographic variables (i.e., age, gender, and dyadic tenure).

3.4. Data Analysis

Although employees are nested within supervisors, a one-way random-effects analysis of variance (ANOVA) model revealed that there was no group difference in manager-rated overall performance. Thus, following Xu et al. [40], we applied hierarchical multiple regression analyses to test our hypotheses using SPSS 25. All independent variables were centered at their grand mean [41].

4. Results

Table 1 presents the means, standard deviations, and correlations of all variables.
Table 2 shows the regression results of the models using overall performance as a dependent variable.
Hypothesis 1 proposed that the frequency of employee voice has an inverted U-shaped relationship with managers’ performance evaluations. To examine the inverted U-shaped relationship, we employ the quadratic specification that could quantitatively capture the predictions of Hypothesis 1, which is frequently used in similar studies (e.g., [17,37,42]). Specifically, we regressed the dependent variable overall performance on the independent variable employee voice and its square. It is essential to include the first order in the regression equation [41], as leaving it out is tantamount to assuming that the turning point is at employee voice = 0. As shown in model 3 of Table 2, the quadratic term of voice is negatively related to performance evaluations (β = −0.41, p < 0.05). Consistent with Hypothesis 1, the simple slopes of the regression line at the very low (2 SD below the mean), low (1 SD below the mean), medium, high (1 SD above the mean), and very high (2 SD above the mean) frequencies of voice (β = 0.81, p < 0.05; β = 0.36, p < 0.05; β = −0.09, n.s.; β = −0.54, p < 0.05; β = −0.99, p < 0.05) showed that a moderate frequency of employee voice positively affects overall performance but that very high frequencies of employee voice degrade overall performance. Taken together, the coefficient of the quadratic term of voice is significant and of the expected sign (negative for inverted U). At the same time, the slope of the curve is sufficiently steep at both ends of the voice range. These results indicate that there is an inverted U-shaped relationship between employee voice and overall performance [17,43,44]. Thus, Hypothesis 1 is supported, as shown in Figure 4.
Model 6 of Table 2 shows that the quadratic-by-linear interaction of employee voice and voice consensus was significantly related to overall performance (β = −1.12, p < 0.05). Thus, we further performed simple slope tests to test Hypothesis 2 [42]. As shown in Table 3, in the case of low voice consensus, the simple slopes of the regression lines at the very low, low, medium, high, and very high frequencies of voice (β = 0.90, p < 0.05; β = 0.34, n.s.; β = −0.22, n.s.; β = −0.78, p < 0.01; β = −1.34, p < 0.01) indicated that the positive relationship between voice frequency and overall performance became negative at high frequencies of voice. In contrast, in the case of high voice consensus, the effect of voice frequency became positive at very high frequencies of voice (see Figure 5). Overall, these results support Hypothesis 2.

5. Discussion

Based on the ABC framework [21], the present research examined the inverted U-shaped relationship between employee voice and managers’ performance evaluations and the role of voice consensus in shaping this relationship. As expected, our findings reveal that there is an inverted U-shaped relationship between employee voice and manager-rated overall performance, that is, employees who engage in moderate levels of voice are rated as better performers than those who rarely voice or voice very frequently. Hypothesis 1 was supported. Additionally, the results show that voice consensus moderates the inverted U-shaped relationship between employee voice and manager-rated overall performance, in that the positive link between voice frequency and manager-rated overall performance is more likely to become negative at high voice frequencies when an employee’s voice frequency is dissimilar to that of his/her coworkers. Hypothesis 2 was supported.

5.1. Theoretical Implications

Our research contributes to organizational sustainability, proactivity, and voice literature in three ways. First, by integrating voice research within knowledge-management literature in the context of organizational sustainability (i.e., knowledge-sharing perspective) [22] and psychological-threat perspective [23], we build a more well-rounded understanding of managerial responses to employee voice by exploring the curvilinear relationship between the frequency of employee voice and overall performance. Our findings indicate that employees who engage in moderate levels of voice are rated as better performers than those who rarely voice or voice very frequently (RQ1). These findings extend research that mainly focuses on the benefits or the costs of employee voice only. In addition, by theorizing the benefit of employee voice from the knowledge-sharing perspective in the context of organizational sustainability, our research shows that employees as primary stakeholders [45] can contribute to the sustainable development of the organizations through their proactive behavior. This bottom-up approach breaks the traditional top-down approach, which focuses on the role of human resource management and leadership. These findings also enrich organizational sustainability literature by showing the role of knowledge management in the context of sustainability, which has been little explored [22].
Second, we expand voice research within the workgroup context by shifting its focus from discussions of “How much member voice exists in a team?” to “To what extent is an employee’s voice frequency similar/dissimilar to that of his/her coworkers?” Most of the studies conducted at the group level implicitly assume that voice is equally distributed among team members [6]. However, voice is rarely equally distributed. By considering another dimension of voice patterns (i.e., voice consensus), we answer the question of how employees’ similarity/dissimilarity in voice frequency to their coworkers shapes the consequences of their voice. Our findings show that the positive relationship between voice frequency and manager-rated overall performance is more likely to become negative at high frequencies of voice when the frequency of an employee’s voice is dissimilar to that of his/her coworkers (RQ2). Thus, our research pinpoints an important condition under which the inverted U-shaped relationship between employee voice and managers’ performance evaluations can be observed.
Third, our conceptualization of voice consensus might be meaningfully extended to other forms of proactive behavior [46]. For example, when employees seek feedback, do they keep their frequency of feedback seeking similar or dissimilar to that of their coworkers? In response to such different behavior patterns, do the recipients react positively or negatively? Our research on voice consensus helps advance these conversations beyond discussing the frequency of these behaviors to address more general patterns of proactive behaviors. Further, by considering an employee’s dissimilarity to his/her coworkers in terms of voice frequency (i.e., voice consensus), we highlight the need to move beyond considering only leaders but also other contextual elements (e.g., coworkers) to investigate the consequences of proactive behaviors.

5.2. Practical Implications

Our findings have meaningful implications for management practices. For employees, our findings point to novel strategies for obtaining positive responses to their ideas. First, we highlight that it is wise for employees to speak up at moderate levels, because employees who engage in moderate levels of voice are rated as better performers than those who rarely voice or voice very frequently. It is especially important for employees whose voice frequency is dissimilar to that of their coworkers to refrain from speaking up very frequently because, in such a condition, the positive relationship between voice frequency and managers’ performance evaluations tends to become negative at high frequencies of voice. Second, managers may learn from our research that they tend to devalue the ideas of an employees whose voice frequency is dissimilar to that of his/her coworkers. Thus, managers may inadvertently discourage those employees from speaking up proactively and miss important opportunities to identify constructive ideas and suggestions that may allow employees to make a meaningful and sustainable contribution to the organization.

5.3. Limitations and Future Directions

Despite these contributions, our research has several limitations, some of which suggest directions for future research. First, we did not incorporate voice quality into our model. In reality, managers’ time and attention are limited, and despite their prosocial motives, employees’ ideas can be of limited value [47]. Thus, it would not be practical to act on every suggestion made by employees. Operationalized in terms of the strength of the issue-relevant arguments, the quality of messages has been widely used in experimental settings to predict message receivers’ reactions to persuasion attempts [48]. Therefore, we encourage researchers to theorize and investigate how voice quality plays a role in shaping managerial responses to employee voice.
Second, to avoid common method bias, we used self-reported measures of employee voice in the field study. However, this approach remains problematic because managers’ perceptions of employee voice might not be identical to employee self-ratings, and managers’ observations of employees’ voice frequency are of great importance for understanding managerially controlled outcomes [15]. To accurately measure employee voice while avoiding common method bias, we encourage future research to collect both employees’ and managers’ ratings of voice frequency or use experimental studies to manipulate voice frequency.
Third, in this research, we focused on the relationship between employee voice and managers’ performance evaluations of the voicing employee, from the perspective of organizational sustainability. Although manager-rated performance can be a key component of the economic dimension of organizational sustainability, we did not directly measure and examine organizational sustainability in this study. Thus, future research should consider measuring the concept of organizational sustainability. Furthermore, future research could extend our research by exploring the relationship between employee voice and organizational sustainability not only in terms of the economic dimension but also in terms of the environmental and human dimensions of organizational sustainability. Additionally, research on organizational resilience indicates that the process and dynamics that create or retain a cognitive resource can enhance organizational resilience [9]. Employee voice offers diagnostic information that can identify, resolve, and prevent workgroup problems [3], which is a kind of cognitive resource. Thus, future research can investigate how employee voice influences organizational resilience.

6. Conclusions

Drawing on the ABC framework, our research extends sustainability, proactivity, and voice literature by introducing voice consensus as a novel influence on managerial responses to employee voice. Moving beyond leaders and including another contextual element (i.e., coworkers), our findings indicate that the positive relationship between employee voice and manager-rated overall performance is more likely to become negative at high frequencies of voice, especially when an employee’s voice frequency is dissimilar to that of his/her coworkers. We hope that our conceptualization of voice consensus could encourage future research into how other forms of proactive behaviors might be performed at different levels of consensus, as well as why these different levels of consensus information conveyed by proactive behaviors matter for organizations.

Author Contributions

Conceptualization, Z.Z.; formal analysis, Z.Z.; investigation, Z.Z., Q.L. and J.L.; methodology, Z.Z.; project administration, Z.Z. and J.L.; writing—original draft, Z.Z.; writing—review and editing, Z.Z., Q.L. and J.L. All authors have read and agreed to the published version of the manuscript.

Funding

This research received no external funding.

Institutional Review Board Statement

Not applicable.

Informed Consent Statement

Informed consent was obtained from all subjects involved in the study.

Data Availability Statement

The data presented in this study are available upon request from the corresponding author.

Conflicts of Interest

The authors declare no conflict of interest.

References

  1. Spreitzer, G.; Porath, C.L.; Gibson, C.B. Toward human sustainability: How to enable more thriving at work. Organ. Dyn. 2012, 41, 155–162. [Google Scholar] [CrossRef]
  2. Hart, S.L.; Milstein, M.B. Creating sustainable value. Acad. Manag. Exec. 2003, 17, 56–67. [Google Scholar] [CrossRef]
  3. Van Dyne, L.; LePine, J.A. Helping and voice extra-role behaviors: Evidence of construct and predictive validity. Acad. Manag. J. 1998, 41, 108–119. [Google Scholar] [CrossRef]
  4. Sherf, E.N.; Tangirala, S.; Venkataramani, V. Why managers do not seek voice from employees: The importance of managers’ personal control and long-term orientation. Organ. Sci. 2019, 30, 447–466. [Google Scholar] [CrossRef]
  5. Li, A.N.; Liao, H.; Tangirala, S.; Firth, B.M. The content of the message matters: The differential effects of promotive and prohibitive team voice on team productivity and safety performance gains. J. Appl. Psychol. 2017, 102, 1259–1270. [Google Scholar] [CrossRef]
  6. Liang, J.; Shu, R.; Farh, C.I.C. Differential implications of team member promotive and prohibitive voice on innovation performance in research and development project teams: A dialectic perspective. J. Organ. Behav. 2019, 40, 91–104. [Google Scholar] [CrossRef]
  7. Weiss, M.; Zacher, H. Why and when does voice lead to increased job engagement? The role of perceived voice appreciation and emotional stability. J. Vocat. Behav. 2022, 132, 103662. [Google Scholar] [CrossRef]
  8. Kim, W.; Khan, G.F.; Wood, J.; Mahmood, M.T. Employee engagement for sustainable organizations: Keyword analysis using social network analysis and burst detection approach. Sustainability 2016, 8, 631. [Google Scholar] [CrossRef]
  9. Sutcliffe, K.M.; Vogus, T.J. Organizing for resilience. In Positive Organizational Scholarship; Cameron, K., Dutton, J.E., Quinn, R.E., Eds.; Berrett-Koehler: San Francisco, CA, USA, 2003; pp. 94–110. [Google Scholar]
  10. Paolillo, A.; Sinval, J.; Silva, S.A.; Scuderi, V.E. The relationship between inclusion climate and voice behaviors beyond social exchange obligation: The role of psychological needs satisfaction. Sustainability 2021, 13, 10252. [Google Scholar] [CrossRef]
  11. Silla, I.; Gracia, F.J.; Peiró, J.M. Upward voice: Participative decision making, trust in leadership and safety climate matter. Sustainability 2020, 12, 3672. [Google Scholar] [CrossRef]
  12. Bashshur, M.R.; Oc, B. When voice matters: A multilevel review of the impact of voice in organizations. J. Manag. 2015, 41, 1530–1554. [Google Scholar] [CrossRef]
  13. King, D.D.; Ryan, A.M.; Van Dyne, L. Voice resilience: Fostering future voice after non-endorsement of suggestions. J. Occup. Organ. Psychol. 2019, 92, 535–565. [Google Scholar] [CrossRef]
  14. Lee, W.R.; Choi, S.B.; Kang, S.-W. How leaders’ positive feedback influences employees’ innovative behavior: The mediating role of voice behavior and job autonomy. Sustainability 2021, 13, 1901. [Google Scholar] [CrossRef]
  15. Burris, E.R.; Detert, J.R.; Romney, A.C. Speaking up vs. Being heard: The disagreement around and outcomes of employee voice. Organ. Sci. 2013, 24, 22–38. [Google Scholar] [CrossRef]
  16. Howell, T.M.; Harrison, D.A.; Burris, E.R.; Detert, J.R. Who gets credit for input? Demographic and structural status cues in voice recognition. J. Appl. Psychol. 2015, 100, 1765–1784. [Google Scholar] [CrossRef]
  17. Huang, X.; Xu, E.; Huang, L.; Liu, W. Nonlinear consequences of promotive and prohibitive voice for managers’ responses: The roles of voice frequency and lmx. J. Appl. Psychol. 2018, 103, 1101–1120. [Google Scholar] [CrossRef] [PubMed]
  18. Whiting, S.W.; Podsakoff, P.M.; Pierce, J.R. Effects of task performance, helping, voice, and organizational loyalty on performance appraisal ratings. J. Appl. Psychol. 2008, 93, 125–139. [Google Scholar] [CrossRef] [PubMed]
  19. Chamberlin, M.; Newton, D.W.; Lepine, J.A. A meta-analysis of voice and its promotive and prohibitive forms: Identification of key associations, distinctions, and future research directions. Pers. Psychol. 2017, 70, 11–71. [Google Scholar] [CrossRef]
  20. Seibert, S.E.; Kraimer, M.L.; Crant, J.M. What do proactive people do? A longitudinal model linking proactive personality and career success. Pers. Psychol. 2001, 54, 845–874. [Google Scholar] [CrossRef]
  21. Busse, C.; Mahlendorf, M.D.; Bode, C. The abc for studying the too-much-of-a-good-thing effect: A competitive mediation framework linking antecedents, benefits, and costs. Organ. Res. Methods 2016, 19, 131–153. [Google Scholar] [CrossRef]
  22. Castaneda, D.I.; Ramírez, C.A. Cultural values and knowledge sharing in the context of sustainable organizations. Sustainability 2021, 13, 7819. [Google Scholar] [CrossRef]
  23. Burris, E.R. The risks and rewards of speaking up: Managerial responses to employee voice. Acad. Manag. J. 2012, 55, 851–875. [Google Scholar] [CrossRef]
  24. Markman, K.D.; McMullen, M.N. A reflection and evaluation model of comparative thinking. Pers. Soc. Psychol. Rev. 2003, 7, 244–267. [Google Scholar] [CrossRef] [PubMed]
  25. Lam, C.F.; Mayer, D.M. When do employees speak up for their customers? A model of voice in a customer service context. Pers. Psychol. 2014, 67, 637–666. [Google Scholar] [CrossRef]
  26. Liu, W.; Tangirala, S.; Lee, C.; Parker, S.K. New directions for exploring the consequences of proactive behaviors: Introduction to the special issue. J. Organ. Behav. 2019, 40, 1–4. [Google Scholar] [CrossRef]
  27. Kelley, H.H. Attribution theory in social psychology. In Nebraska Symposium on Motivation; Levine, D., Ed.; University of Nebraska Press: Lincoln, NV, USA, 1967; Volume 15, pp. 192–238. [Google Scholar]
  28. Alavi, M.; Leidner, D.E. Review: Knowledge Management and Knowledge Management Systems: Conceptual Foundations and Research Issues. MIS Q. 2001, 25, 107–110. [Google Scholar] [CrossRef]
  29. Morrison, E.W. Employee voice behavior: Integration and directions for future research. Acad. Manag. Ann. 2011, 5, 373–412. [Google Scholar] [CrossRef]
  30. Morrison, E.W.; Milliken, F.J. Organizational silence: A barrier to change and development in a pluralistic world. Acad. Manag. Rev. 2000, 25, 706–725. [Google Scholar] [CrossRef]
  31. Fast, N.J.; Burris, E.R.; Bartel, C.A. Managing to stay in the dark: Managerial self-efficacy, ego defensiveness, and the aversion to employee voice. Acad. Manag. J. 2014, 57, 1013–1034. [Google Scholar] [CrossRef]
  32. Griffin, M.A.; Neal, A.; Parker, S.K. A new model of work role performance positive behavior in uncertain and interdependent contexts. Acad. Manag. J. 2007, 50, 327–347. [Google Scholar] [CrossRef]
  33. Kelley, H.H.; Michela, J.L. Attribution theory and research. Annu. Rev. Psychol. 1980, 31, 457–501. [Google Scholar] [CrossRef]
  34. Frazier, M.L.; Fainshmidt, S. Voice climate, work outcomes, and the mediating role of psychological empowerment. Group Organ. Manag. 2012, 37, 691–715. [Google Scholar] [CrossRef]
  35. Dutton, J.E.; Ashford, S.J. Selling issues to top management. Acad. Manag. Rev. 1993, 18, 397–428. [Google Scholar] [CrossRef]
  36. Hristov, I.; Cimini, R.; Cristofaro, M. Assessing stakeholders’ perception influence on companies’ profitability: Evidence from Italian companies. Prod. Plan. Control, 2022; 1–15, ahead-of-print. [Google Scholar] [CrossRef]
  37. Lovallo, D.; Brown, A.L.; Teece, D.J.; Bardolet, D. Resource re-allocation capabilities in internal capital markets: The value of overcoming inertia. Strateg. Manag. J. 2020, 41, 1365–1380. [Google Scholar] [CrossRef]
  38. Zenger, T.R.; Lawrence, B.S. Organizational demography: The differential effects of age and tenure. Acad. Manag. J. 1989, 32, 353–376. [Google Scholar] [CrossRef]
  39. MacKenzie, S.B.; Podsakoff, P.M.; Fetter, R. Organizational citizenship behavior and objective productivity as determinants of managerial evaluations of salespersons’ performance. Organ. Behav. Hum. Decis. Process 1991, 50, 123–150. [Google Scholar] [CrossRef]
  40. Xu, E.; Huang, X.; Ouyang, K.; Liu, W.; Hu, S. Tactics of speaking up: The roles of issue importance, perceived managerial openness, and managers’ positive mood. Hum. Resour. Manag. 2020, 59, 255–269. [Google Scholar] [CrossRef]
  41. Aiken, L.S.; West, S.G. Multiple Regression: Testing and Interpreting Interactions; Sage: Newbury Park, CA, USA, 1991. [Google Scholar]
  42. Li, J.; Zajac, Z.E.J. Control, collaboration, and productivity in international joint ventures: Theory and evidence. Strateg. Manag. J. 2010, 30, 865–884. [Google Scholar] [CrossRef]
  43. Haans, R.; Pieters, C.; He, Z.L. Thinking about U: Theorizing and testing U- And inverted U-shaped relationships in strategy research. Strateg. Manag. J. 2015, 37, 1177–1195. [Google Scholar] [CrossRef]
  44. Lind, J.T.; Mehlum, H. With or without U? The appropriate test for a U-shaped relationship. Oxf. Bull. Econ. Stat. 2010, 72, 109–118. [Google Scholar] [CrossRef]
  45. Garvare, R.; Johannsson, P. Management for sustainability—A stakeholder theory. Total Qual. Manag. Bus. Excell. 2010, 21, 737–744. [Google Scholar] [CrossRef]
  46. Grant, A.M.; Ashford, S.J. The dynamics of proactivity at work. Res. Organ. Behav. 2008, 28, 3–34. [Google Scholar] [CrossRef]
  47. Ng, T.W.H.; Wang, M.; Hsu, D.Y.; Su, C. Voice quality and ostracism. J. Manag. 2020, 48, 281–318. [Google Scholar] [CrossRef]
  48. Briñol, P.; Petty, R.E. Source factors in persuasion: A self-validation approach. Eur. Rev. Soc. Psychol. 2009, 20, 49–96. [Google Scholar] [CrossRef]
Figure 1. Combination of benefits and costs of employee voice resulting in an inverted U-shaped relationship (B (employee voice) = benefit; C (employee voice) = cost; S (employee voice) = combination of benefits and costs (i.e., benefits minus costs)).
Sustainability 14 09970 g001
Figure 2. The proposed research model.
Sustainability 14 09970 g002
Figure 3. Research methodological approach.
Sustainability 14 09970 g003
Figure 4. The quadratic effect of employee voice on overall performance.
Sustainability 14 09970 g004
Figure 5. The quadratic-by-linear interactive effects of employee voice and voice consensus on overall performance.
Sustainability 14 09970 g005
Table 1. Means, standard deviations, and correlations (n = 173).
VariablesMeanSD123456
1. Age a3.350.86
2. Gender b0.230.420.00
3. Dyadic tenure6.004.940.22 **−0.08
4. Employee voice3.900.55−0.12−0.04−0.13 (0.61)
5. Voice consensus0.670.300.03−0.07−0.07−0.18 *
6. Overall performance3.960.78−0.06−0.080.12−0.02−0.05(0.84)
Notes: SD = standard deviation.  p < 0.10, * p < 0.05, ** p < 0.01; two-tailed tests. a 0 = 21–25, 1 = 26–30, 2 = 31–35, 3 = 36–40, 4 = > = 40; b 0 = male, 1 = female. Cronbach’s alpha is along the diagonal in parentheses.
Table 2. Results of hierarchical regression analyses predicting overall performance.
VariablesOverall Performance
Model 1Model 2Model 3Model 4Model 5Model 6
Intercept4.13 *** (0.24)4.26 *** (0.52)4.62 *** (0.53)4.45 *** (0.56)4.47 *** (0.61)4.10 *** (0.61)
Age a −0.08 (0.07)−0.08 (0.07)−0.07 (0.07)−0.07 (0.07)−0.07 (0.07)−0.07 (0.07)
Gender b−0.13 (0.14)−0.13 (0.14)−0.13 (0.14)−0.12 (0.14)−0.12 (0.14)−0.14 (0.14)
Dyadic tenure0.02
(0.01)
0.02
(0.01)
0.02
(0.01)
0.02
(0.01)
0.02
(0.01)
0.02
(0.01)
Employee voice −0.03 (0.11)−0.09 (0.11)−0.09 (0.11)−0.09 (0.13)−0.07 (0.12)
Employee voice2 −0.41 * (0.15)−0.50 * (0.18)−0.50 * (0.19)−0.18 (0.23)
Voice consensus 0.23
(0.24)
0.23
(0.24)
0.58 * (0.28)
Employee voice × voice consensus 0.02
(0.32)
−0.51 * (0.38)
Employee voice2 × voice consensus −1.12 * (0.44)
R20.030.030.070.070.070.11
ΔR20.030.000.040.010.000.04
ΔF1.590.077.20 *0.890.016.52 *
Notes: N = 173. a 0 = 21–25, 1 = 26–30, 2 = 31–35, 3 = 36–40, 4 = > = 40; b 0 = male, 1 = female. * p < 0.05; *** p < 0.001; two-tailed tests.
Table 3. Tests of simple slopes for quadratic-by-linear interactions of employee voice and voice consensus for managerial endorsement.
Moderatorβ
X (2SD Low)X (1SD Low)X (Medium)X (1SD High)X (2SD High)
High voice consensus−0.26−0.090.080.260.43
Low voice consensus0.90 *0.34−0.22−0.78 **−1.34 **
Notes: * p < 0.05, ** p < 0.01.
Publisher’s Note: MDPI stays neutral with regard to jurisdictional claims in published maps and institutional affiliations.

