Abstract
Deficit irrigation or intentional under-irrigation offers the potential for sustainable water resources management. The DSSAT CERES-Maize and AquaCrop models were coupled to simulate the effects of deficit irrigation on corn yield and water productivity. The models were calibrated and validated using observed values of crop and biomass yield under 40%, 50%, 60%, 70%, and 80% depletion of the available soil water. Model simulation results showed that a 15% level of deficit irrigation results in maximum yield while a 60% level of deficit irrigation leads to maximum water productivity. Results suggest that it is not necessary to use large amounts of water in order to obtain high crop yield. The net irrigation application depths ranged from 60 mm to 134 mm, with a depth of 77 mm as optimum under 60% deficit irrigation when applied at the start of tasseling to grain filling. This study demonstrated the applicability of deficit irrigation as a water-saving management strategy for corn production systems. Crop models such as DSSAT CERES-Maize and AquaCrop proved to be viable tools to support decision making in corn production systems in the Philippines, especially when employing deficit irrigation.
1. Introduction
Water scarcity leads to water stress, which in turn affects crop growth and productivity in many ways. Inadequate irrigation water application leads to adverse physiological effects like stunted growth, poor quality, and reduce quantity of crop yield. Water scarcity problems also affect water productivity, which is basically defined as the ratio of the mass of crop yield to the amount of irrigation water consumed [1]. Determining crop yield response to irrigation is important for crop selection, economic analysis, and for practicing effective irrigation management strategies. If water is limited, it is important to know how to time irrigation application to optimize crop yield, water use efficiency and, ultimately, profits [2]. Water stress can affect growth, development, and physiological processes of crops, which can reduce biomass and yield [3,4,5]. Hence, innovations, strategies, and plans to increase water use efficiency in crop production systems are necessary.
To address the issues of water scarcity, a number of water saving technologies and management strategies have evolved through the years. These include an irrigation strategy called deficit irrigation, which is basically defined as the intentional under-irrigation of crops below full crop water requirements (crop evapotranspiration, ETc) [6]. Deficit irrigation is a well-accepted practice to optimize and increase water use by allowing crops to withstand mild water stress with none or only marginal decrease in yield and quality [4,5]. Yield reduction is generally expected when crops are subjected to deficit irrigation (DI) [7], yet a well-designed deficit irrigation regime can minimize the impact on yield and still lead to growers’ profitability [8,9]. Deficit irrigation, coupled with crop simulation models to investigate multiple alternatives, have a pivotal role to play in sustainable water development [6].
Yield prediction and process optimization are some of the horticultural parameters that requires modeling, yet until now, few of them have been modeled and efforts have focused on a limited number of processes of crop growth and development. Likewise, water balance of plants, the uptake of minerals, the interaction with pests, diseases and genetics, the interplant variability, and the formation of product quality are very important to model; yet, they have been poorly addressed [10]. In developing countries such as the Philippines, however, no study on deficit irrigation can be found in published peer-reviewed literature much less the application of crop models for quantifying the effects of deficit irrigation on crop yield and water productivity.
Crop simulation models are valuable tools in understanding crop growth in relation to water [11]. Crop simulation models have been used for many different applications in various countries around the world [12]. Among the widely used crop simulation models include the AquaCrop model developed by the Food and Agricultural Organization (FAO) of the United Nations. It is used for irrigation management, project planning, and scenario simulations at different scales. The model has the capability to simulate soil water balance at several soil horizons, crop growth and development in response to different water scenario, and water productivity (AquaCrop Reference Manual). Other widely used crop simulation models include those developed under the Decision Support System for Agrotechnology Transfer (DSSAT), which is a comprehensive decision support system [13,14] that includes the Cropping System Model (CSM) for over 42 crops. The model is capable of simulating soil water balance at different soil depths; hence, the model can evaluate potential yield reduction caused by soil water deficits.
Application of crop simulation models is unquestionably a sound approach in examining the effect of deficit irrigation on crop yield and water productivity [14], particularly for corn production systems in the Philippines. Corn, particularly sweet corn, is one of the most important crops that are produced perennially in the Philippines. However, sweet corn growers in the Philippines usually employ surface irrigation applied on a weekly basis if rainfall does not occur, and hence the soil moisture content is maintained near field capacity. Consequently, farmers tend to use large amount of irrigation water, which leads to huge water application losses and wastage.
In recent years, simulation modeling studies for corn have been conducted in the Philippines. For instance, Bondad et al. (2015) [15] simulated the impact of conservation agriculture on corn yield using the DSSAT CERES-Maize model, and their study showed that there is a reasonably fair to good match between observed and simulated values of silking and maturity dates, maximum leaf area index (LAI), yield, and above-ground biomass, as indicated by the various statistical criteria such as root mean square error (RMSE), relative root mean square error (RRMSE), and Nash–Sutcliffe model efficiency (NSE). Lansigan and Salvacion (2015) [16] made assessments of the impact of climate change on rice and corn yields using CERES-Maize and concluded that climatic change will surely affect corn productivity in the country, Painagan and Guiterrez (2014) [17] conducted a simulation study of corn yield using the Aquacrop model and concluded that the model can simulate the yield of corn with fair accuracy. However, to date, no study has been published in peer-reviewed literature on the application of both the FAO’s AquaCrop water productivity model and DSSAT CERES-Maize in simulating the impact of deficit irrigation system on corn yield and water productivity in the Philippines.
This study aimed to simulate and analyze the effect of deficit irrigation on corn yield and water productivity as water saving strategy to promote sustainable water resources management by coupling AquaCrop (4.7) and DSSAT CERES-Maize crop simulation models.
2. Materials and Methods
To serve as basis for model calibration and validation, field experiments were conducted at the University of the Philippines, Central Experimental Station, Los Baños, Laguna, Philippines (14.1800 N 121.2500 E), with an elevation of 21 m above sea level, from March to May 2018 and from October to December 2018 for the first and second cropping seasons, respectively.
The climate at the experimental site falls under Type I climate based on the Corona classification, with two pronounced seasons: dry from November to April, and wet during the rest of the year. This area has a tropical monsoon climate based on Koppen climate classification. It has an average annual precipitation and temperature of 1942 mm and 27.1 °C respectively. During the year 2018, the driest month was March with a total rainfall of only 22.5 mm, which occurred during the first cropping season. Most of the precipitation during this year fell in the month of December, averaging 450 mm due to the occurrence of strong typhoons. The soil at the experimental site is clay loam classified as Lipa clay loam for the upper 25 cm layer. The site is nearly flat, well drained, and has an average water content at field capacity and permanent wilting point of 0.32 and 0.14 m3/m3, respectively.
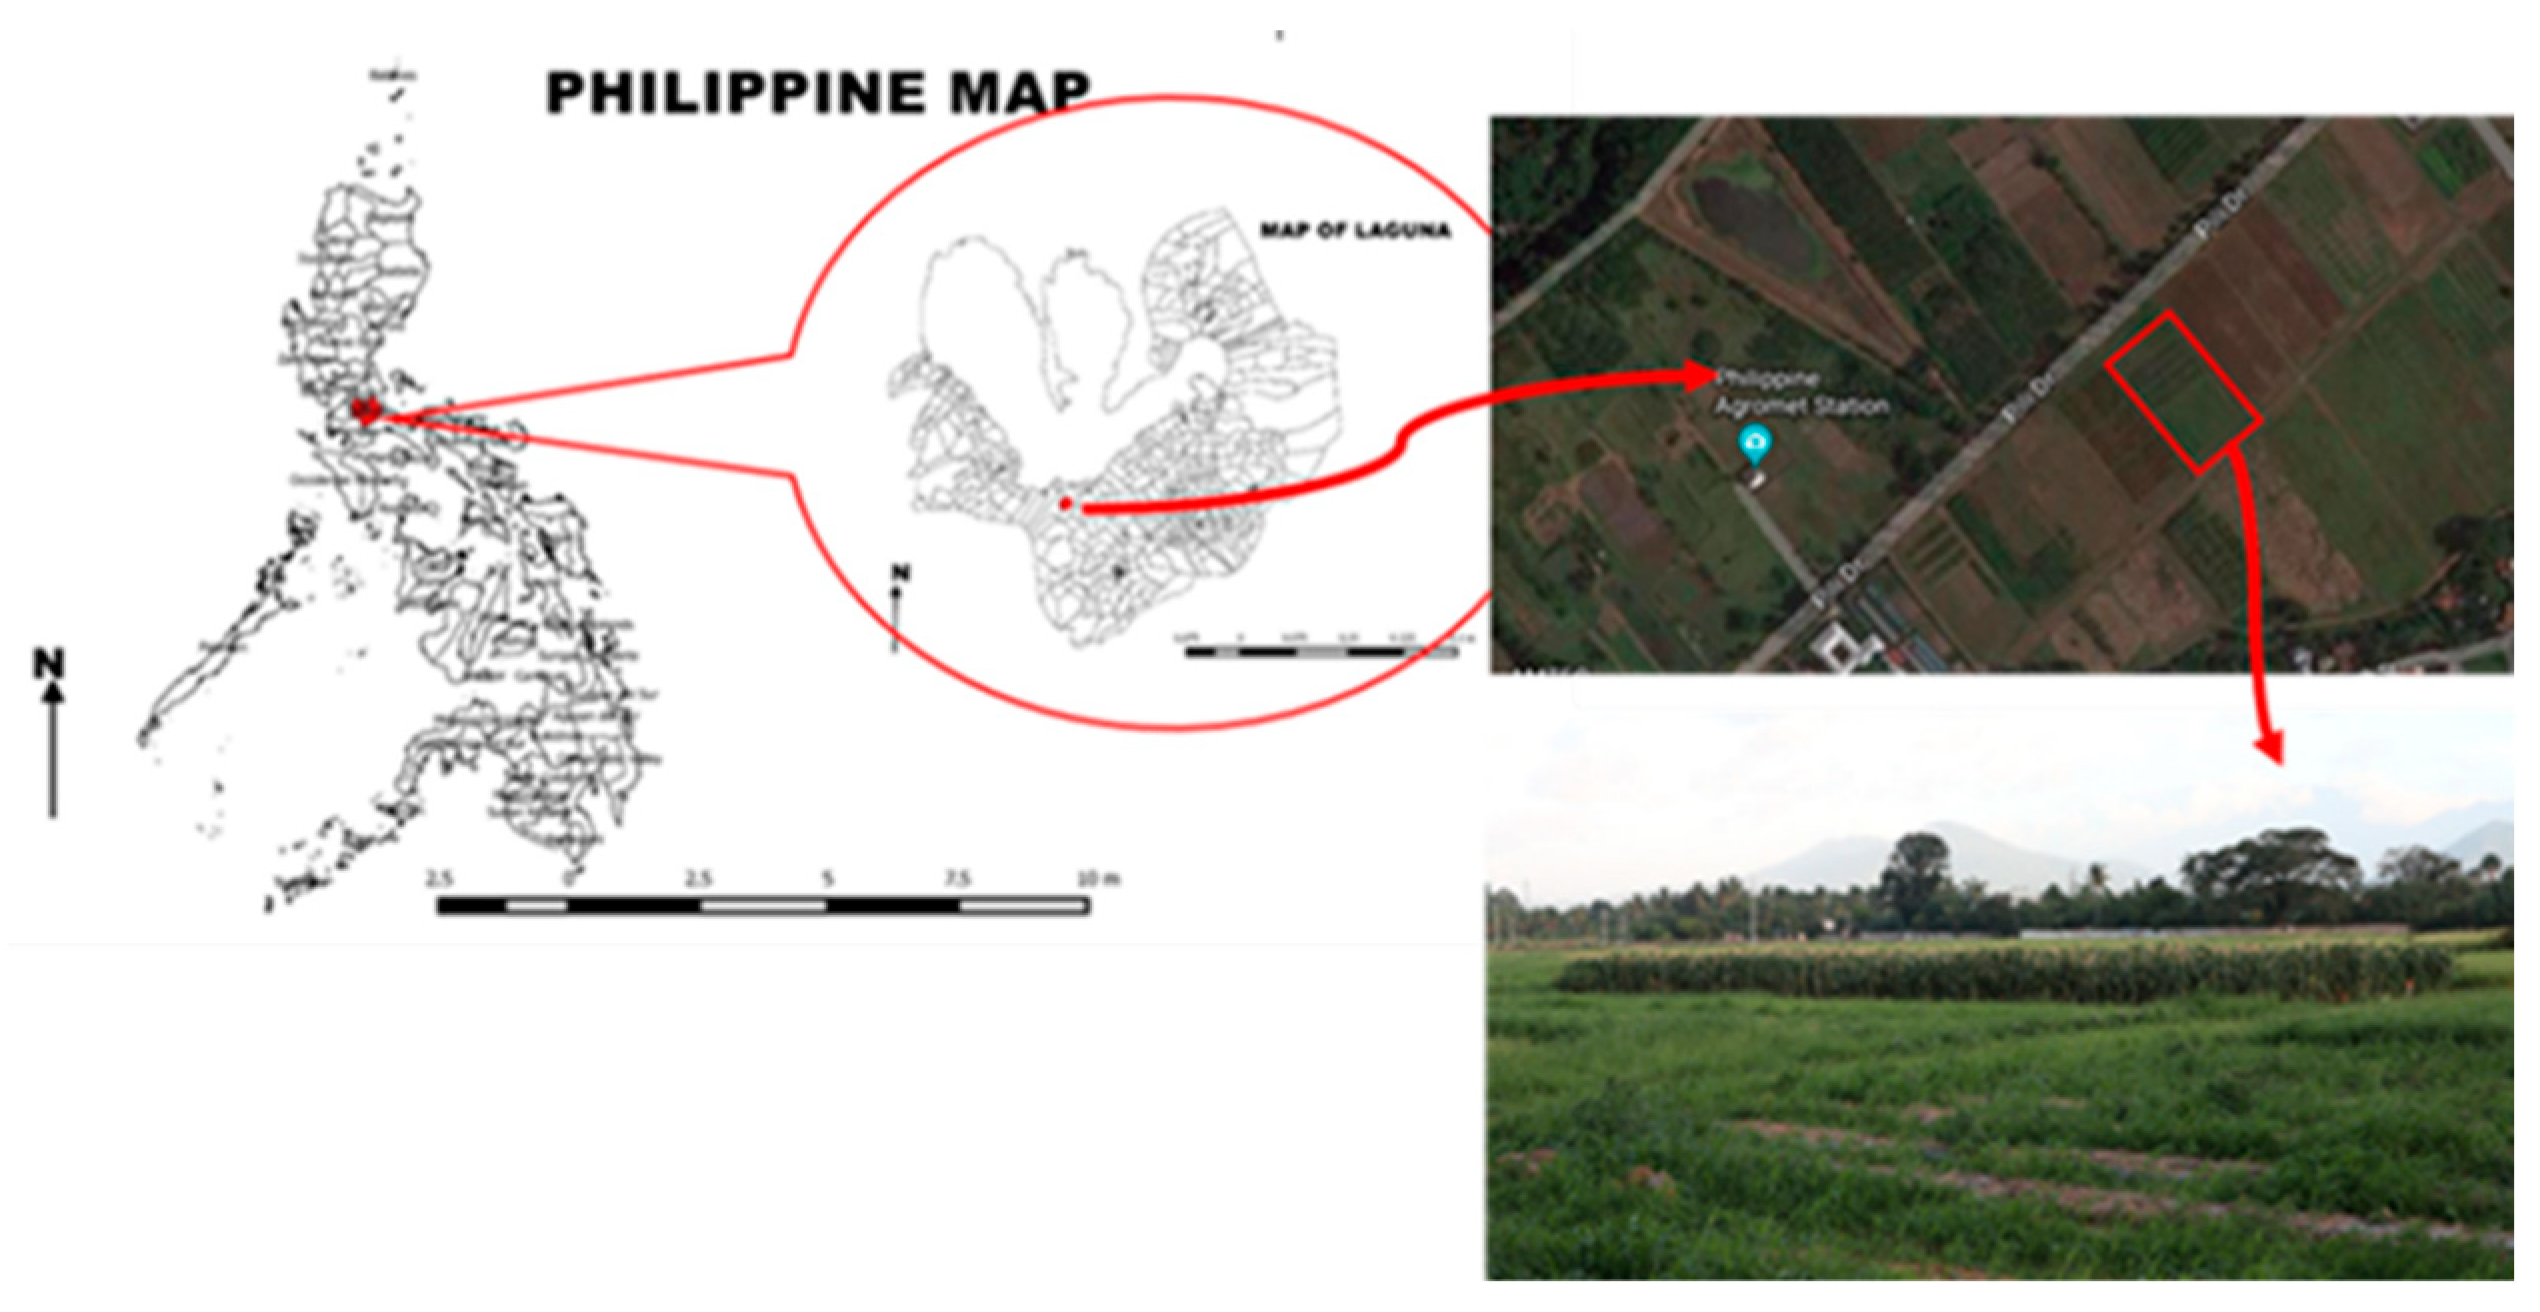
The climatological input data such as daily maximum and minimum temperature, rainfall, relative humidity, dry and wet bulb temperature, wind speed, sunshine duration, and vapor pressure were collected from the National Agrometeorological Station, University of the Philippines Los Baños, located about 500 m from the study area (Figure 1).
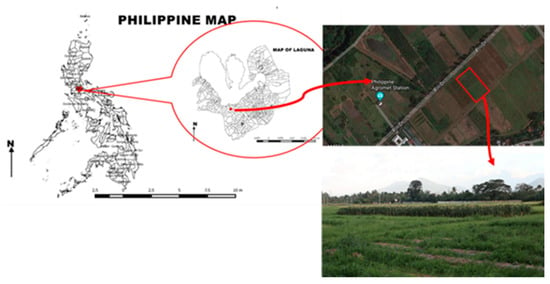
Figure 1.
Location of Philippine Agrometeorological Station and study area based on Google Earth map.
Soil data such as textural class, field capacity, permanent wilting point, and bulk density were obtained from the CHED-PCARI project [18]. Data for soil water content were collected along the depth of the rootzone along 0.25–0.5 cm depth. Collection was done at the start of the planting season, two days after every irrigation application and every after rainfall to account the presence of rainfall, and also during harvest through the gravimetric method, and were counterchecked using a soil moisture meter probe.
Crop management information, such as plant population, row spacing, seeding depth, application of fertilizer, and irrigation application were also recorded. Plant phenological growth parameters were also recorded. These included emergence date, anthesis date, plant height, maximum rooting depth, observation of maximum canopy expansion and dry above ground biomass which were measured through destructive sampling, harvest date and fresh sweet corn ear physical characteristics.
Five irrigation treatments were evaluated for the entire duration of the study, using randomized complete block design replicated three times, for a total of 15 experimental plots. Irrigation treatments were set in terms of percent depletion of the available soil water as follows:
Treatment 1: 40% depletion of the available soil water.
Treatment 2: 50% depletion of the available soil water.
Treatment 3: 60% depletion of the available soil water.
Treatment 4: 70% depletion of the available soil water.
Treatment 5: 80% depletion of the available soil water.
The various irrigation treatments essentially represent the management allowable depletion or deficit (MAD), which is used in irrigation water management as the basis for determining when and how much to replenish the depleted soil water to its field capacity.
2.1. Model Calibration
Calibration of the DSSAT CERES-Maize model was performed using the observed cultivar-specific coefficients of sweet corn under Los Baños, Laguna, condition using the localized model input data taken from the October to December 2018 cropping season, when soil water was optimal for crop growth. It was also the season when plants did not experience stress. For this study, the localized model input data included the following: daily weather data, parameters of the soil profile, local management condition, anthesis day which was measured in days after planting (DAP), physiological maturity day measured in DAP, stem mass at maturity having a unit of kilogram of dry matter per hectare (kg (dm) ha−1), leaf weight at maturity (kg (dm) ha−1), and emergence day measured in DAP. In order to fine-tune the crop model, a manual iterative process of adjusting crop genetic coefficient values of sweet corn was done until the simulated results corresponded to the observed data.
During model calibration, the genetic coefficients for maize were parameterized for local Philippine conditions (Table 1). These maize genetic coefficients were as follows: P1 is the thermal time from seedling emergence to the end of the juvenile phase; P2 is the extent to which development is delayed for each hour increase in photoperiod; P5 is the thermal time from silking to physiological maturity; G2 is the maximum possible number of kernels per plant; G3 is the kernel filling rate; and PHINT is the phylochron interval, the interval in thermal time between successive leaf tip appearances.

Table 1.
Estimated genetic coefficients of sweet corn under local Philippine conditions.
The AquaCrop (4.7) model was also calibrated for local conditions using data taken from the October to December 2018 cropping. Biomass was measured in tons per hectare (tons ha−1), and the percent soil water content for the first 0.25 m depth of the soil profile in which soil water absorption took place, was used for calibration. A trial-and-error approach was used in adjusting the non-conservative parameters to minimize the difference between the simulated and measured data.
The main parameters used to calibrate the AquaCrop (4.7) model under local conditions are shown in Table 2. It also shows the default values in the AquaCrop program files. The non-conservative parameters of the AquaCrop (4.7) were calibrated using the data collected during the October to December 2018 cropping season. Calibrated values are mostly lower than default values since the sweet corn variety of maize is a short-season crop.

Table 2.
Default and calibrated values of non-conservative parameters used during the calibration of the AquaCrop (4.7) model.
Calibrated parameters were based on observations during the actual field experiments. Maximum canopy cover was set at 70%, maximum rooting depth was set at 53 DAP, days from sowing to flowering was set at 52 DAP, building up of harvest index starting from flowering was set at 22 DAP as per observation when plant started to bear fruit. Number of plants per hectare was set at 25,000 based on planting density, days from sowing until the start of senescence was set at 70 DAP, and physiological maturity of sweet corn was set at 80 DAP.
For both models, the goodness of fit between simulated and observed data during model calibration was assessed using standard statistical indices such as root mean square error (RMSE), Normalized root mean square error (NRMSE), coefficient of determination R2, Willmott’s index of agreement (d-stat), and Nash–Sutcliffe model efficiency coefficient (NSE). These statistical indicators were calculated using the following equations:
where Si = simulated data, Oi = observed data n = number paired values, mean of observed data.
The model performance is considered as acceptable when RMSE is close to zero. On the other hand, the model performance is considered as perfect if NRMSE is less than 10%, acceptable when NRMSE is between 10% and 20%, fair when NRMSE is between 20% and 30%, and poor if NRMSE is greater than 30% [19]. The index of agreement (d) varies between 0 and +1. The closer the value of d to 1.0 the better is the model performance, with a d-value of 1.0 indicating that estimated and observed values are identical. NSE values range from minus infinity (−∞) to 1. The higher the NSE, the better is the model performance, with an NSE of 1.0 representing perfect prediction [20,21].
2.2. Crop Model Validation
Field data sets for all treatments from the March to May 2018 cropping season were used for model validation. Fresh ear mass having a unit of kilogram of fresh matter per hectare (kg (fm) ha−1) and leaf and stem mass having a unit of kilogram of dry matter per hectare (kg (dm) ha−1) were considered to validate the DSSAT CERES-Maize model, whereas the AquaCrop (4.7) model was validated using fresh ear mass (kg (fm) ha−1), dry above-ground biomass (ton ha−1), and percent soil water content data. Models were validated by simulating the biomass and fresh ear yield of sweet corn under different levels of deficit irrigation. The observed field experiment data from March to May 2018 cropping season was used to validate the crop simulation models.
The goodness of fit between simulated and observed data during model validation was similarly assessed using the same statistical indices used during model calibration.
2.3. Model Simulation
Several levels of deficit irrigation were simulated using the coupled DSSAT CERES-Maize and AquaCrop model, ranging from 10% to 100% allowable depletion of the available soil water content (ASWC). Several irrigation depths of the optimum deficit irrigation were also simulated using the coupled model. Climatological data and soil data of Los Baños, Laguna were used during simulation.
The AquaCrop model was used to simulate irrigation schedules as well as net irrigation depths. The generated irrigation depths and irrigation schedule from the AquaCrop model were then used as input data for the DSSAT CERES-Maize model. The DSSAT CERES-Maize model was then used to simulate the responses of a maize crop subjected to several deficit irrigation levels. Crop responses such as grain yield and dry above-ground biomass at several deficit irrigation levels were then determined.
Nineteen levels of deficit irrigation, or percent depletion between field capacity and permanent wilting point, with an interval of 5% were simulated using the calibrated and validated models. The depths of irrigation used in the simulations were generated using the AquaCrop model, which, in turn, were used to run the simulation using the DSSAT CERES-Maize model. In the simulation process, deficit irrigation was applied throughout the growing season.
2.4. Water Productivity
Water productivity is defined as the ratio of the mass of yield to the volume of water consumed by the crop usually expressed as kg m−3 [8]:
where , , .
In this study, water productivity was defined as the grain produced in kg. per m3 of water used. The numerator was expressed as the marketable yield, whereas the denominator was expressed as the amount of water applied (the sum of rainfall and irrigation).
3. Results
3.1. DSSAT CERES-Maize Model Calibration Results
During field experiments, occurrence of silk was observed during 50–52 days after planting, wherein 52 DAP presented the maximum occurrence of silk. P1 values of 154 to 174.59 with an average of 164.3 predicted anthesis day (52 DAP) yielded a minimum RMSE value of 0.8165 day and NRMSE value of 1.60% (Table 3). As a result, a P1 value of 164.0 GDD was used as the genetic coefficient of sweet corn.

Table 3.
Statistical measures of the goodness of fit between observed and simulated growth parameters during calibration of the DSSAT CERES-Maize model.
Moreover, the value of genetic coefficient P5, which is the thermal time from silking to physiological maturity, was estimated based on actual observation of maturity during field experiments. Maturity in sweet corn was referred to as the milk stage which occurs during 70 to 80 days after planting, based on sweet corn’s genetic characteristics. During field experiments, maturity stage (milk stage) was observed beginning 72 days after planting, as maturity progressed sugar will be converted into starch; therefore, sweet corn was harvested at 75 days after planting. P5 values of 463 to 481 degree days with an average of 472 degree days were the predicted physiological maturity with a minimum RMSE value of 2.2 days and NRMSE value of 24.44% (Table 3). As a result, a P5 value of 472.0 was used.
Mean leaf and stem dry mass obtained from the 15 experimental plots were 1364 kg ha−1 and 1283 kg ha−1, respectively. In the process of iteration, it was observed that a G2 (maximum possible number of kernels per plant) value of 550 and G3 (the kernel filling rate during linear fill stage under optimal conditions) value of 3 gave the minimum value of RMSE which is 115.8 and 118.61 kg ha−1 for leaf and stem dry mass, respectively (Table 3). Phylochron interval (PHINT) as well as P2 (extent to which development is delayed for each hour increase in photoperiod) were kept constant, since photoperiodism does not affect the crop’s development.
Calibrated genetic coefficients for sweet corn were compared with the genetic coefficients of GSS0966 sh2, Saturn sh2, and BSS0977 sh2. These sweet corn varieties were pre-calibrated by DSSAT and used as default sweet corn genetic coefficients of crop simulation model CERES-Maize. The genetic coefficient values of sweet corn calibrated under local conditions are within the range of the default values as shown in Table 1.
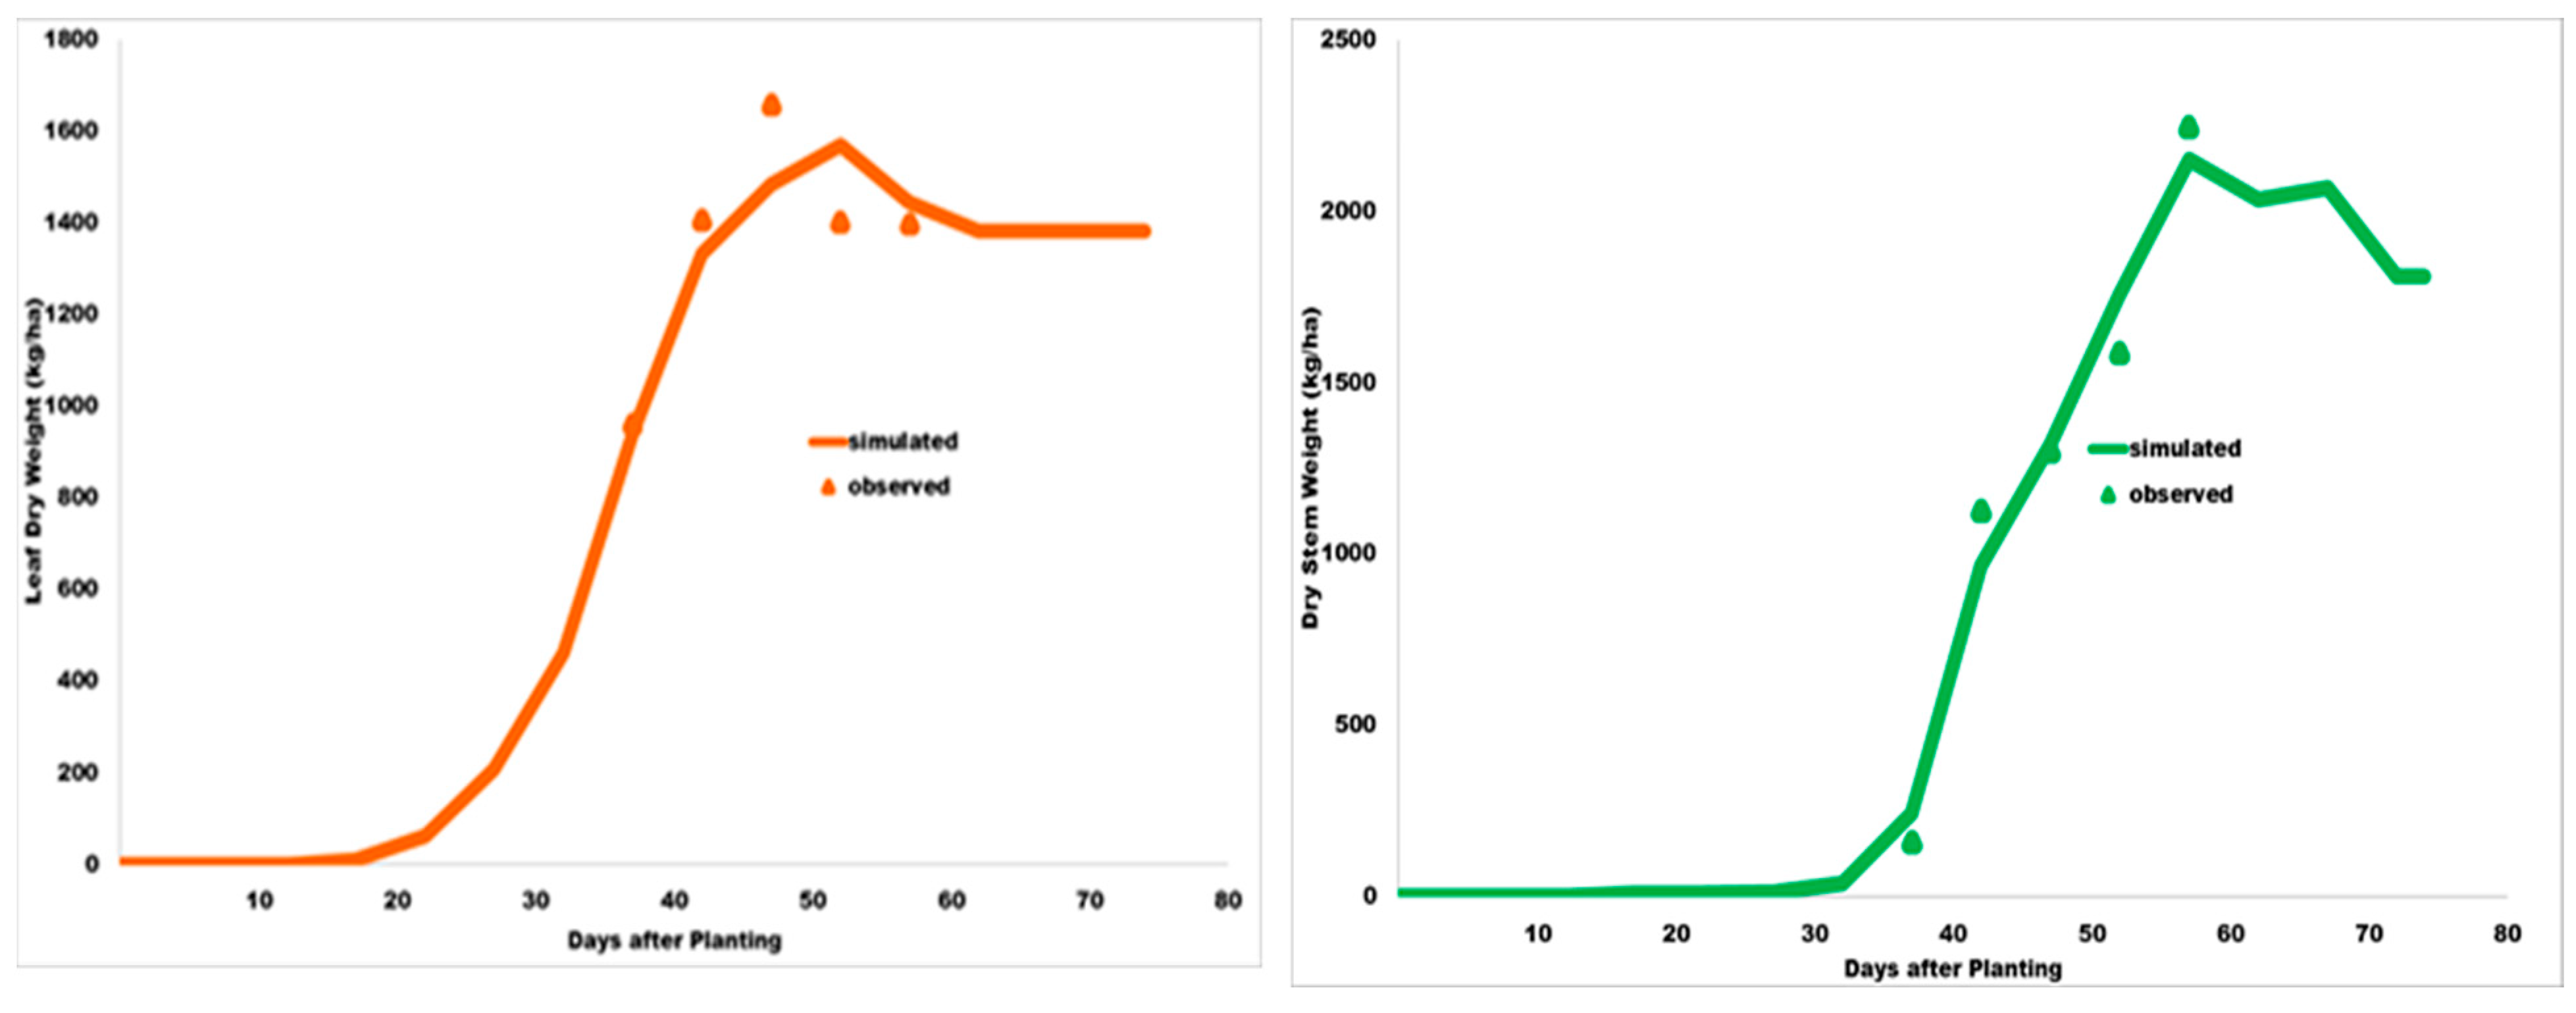
Results showed a high degree of goodness of fit between simulated and observed data. Dry mass of leaf and stem were predicted with R2 of 0.75 and 0.97, d value of 0.927 and 0.992, and NSE of 0.736 and 0.97, respectively, as shown in Table 3 and Figure 2.
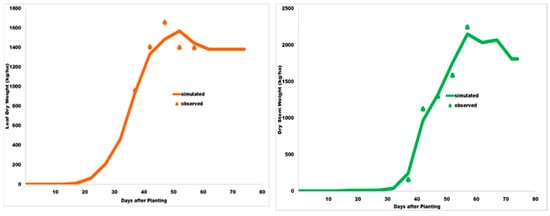
Figure 2.
Simulated and observed dry mass of leaf and stem during calibration of the DSSAT CERES-Maize model.
3.2. AquaCrop (4.7) Model Calibration Results
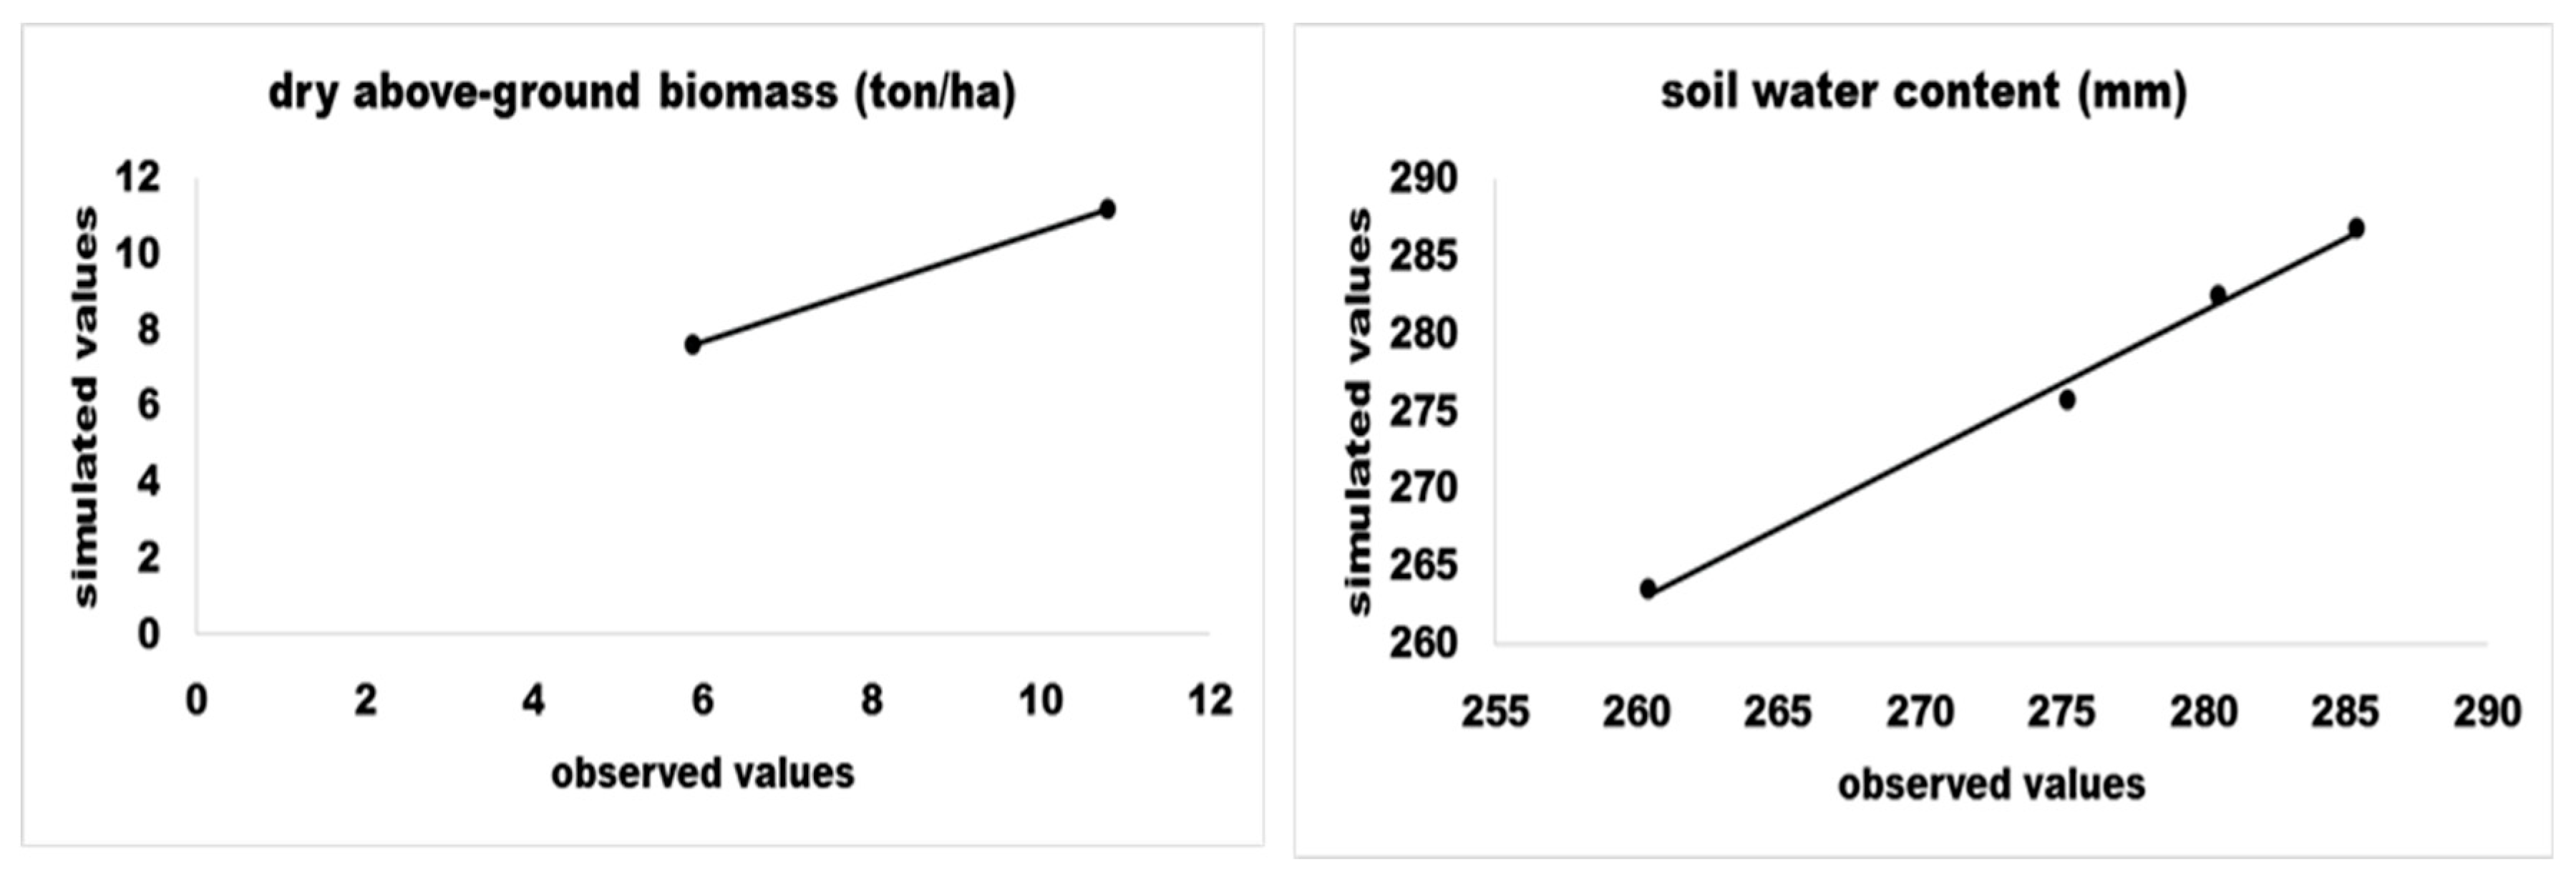
Results of model calibration are shown in Table 4 and Figure 3. Biomass observed values were taken during 50 and 70 DAP of October to December 2018 cropping season. A high goodness of fit between simulated and observed dry above-ground biomass and soil water content was obtained. Calibration based on dry above-ground biomass showed an R2 value of 0.901, d-stat value of 0.895, RMSE of 0.226 ton/ha, NRMSE of 5.1%, and NSE value of 0.98. On the other hand, calibration based on observed values of soil water content which were taken during 40, 50, 60, and 70 DAP of the same cropping season showed an R2 value of 0.897, RMSE of 5.2 mm, NRMSE of 1.9%, d-stat value of 0.845, and NSE value of 0.69.

Table 4.
Statistical measures of the goodness of fit between observed and simulated dry above-ground biomass and soil water content.
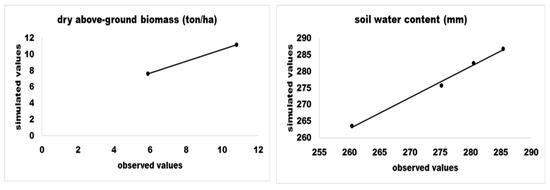
Figure 3.
Simulated and observed dry above-ground biomass and soil water content during calibration of the AquaCrop (4.7) model.
3.3. Results of the Validation of Calibrated Models
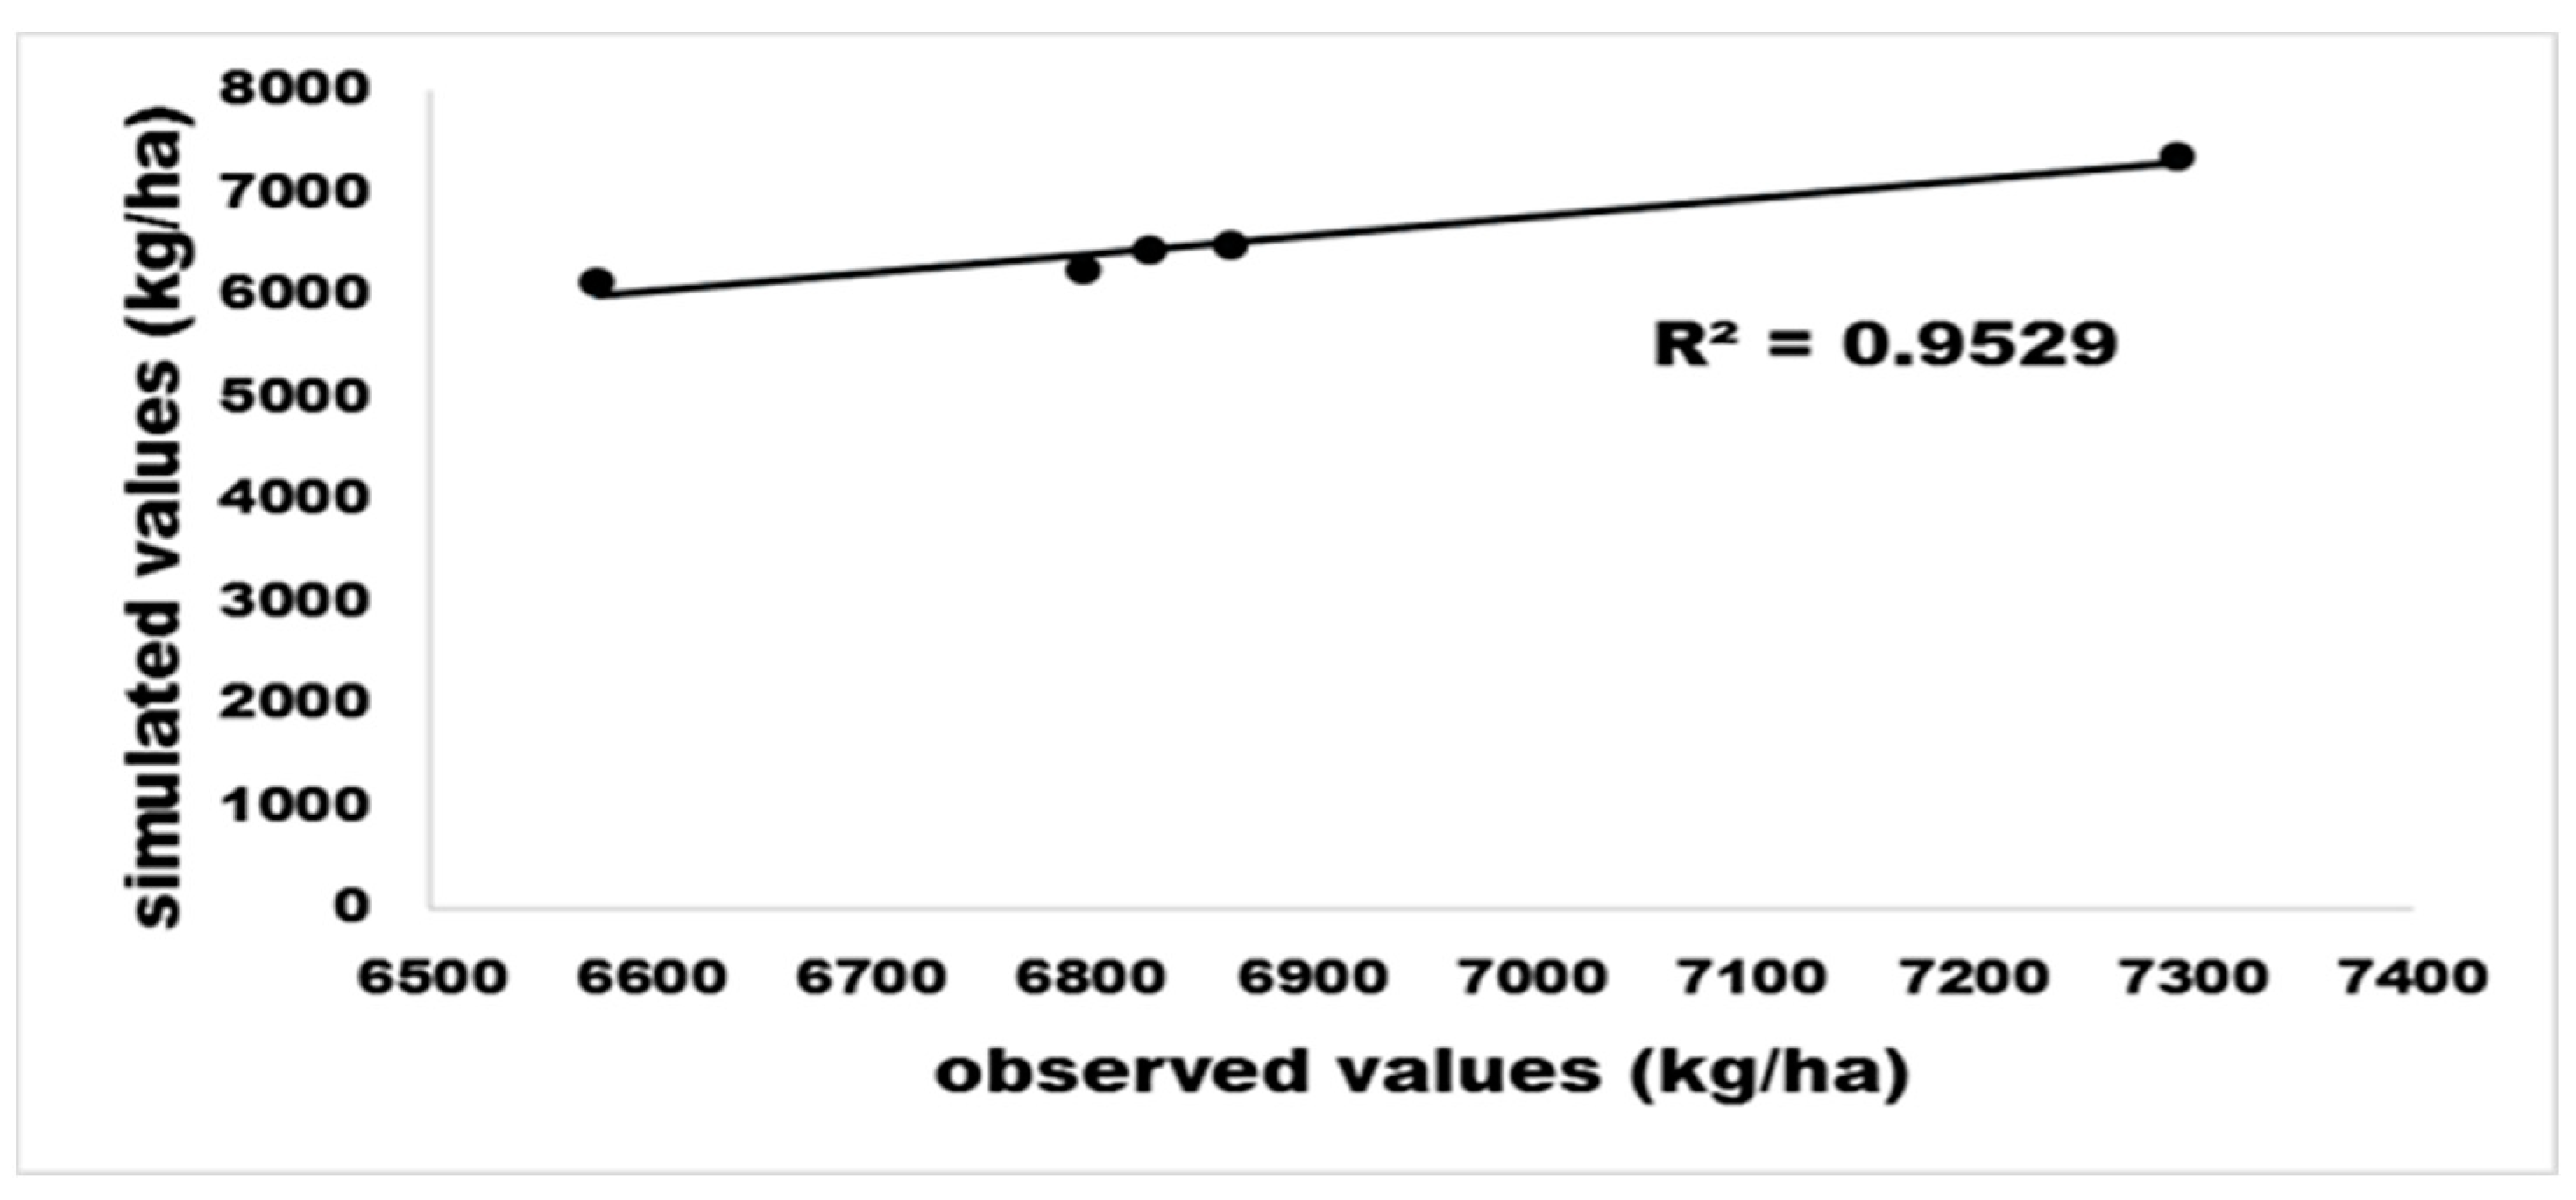
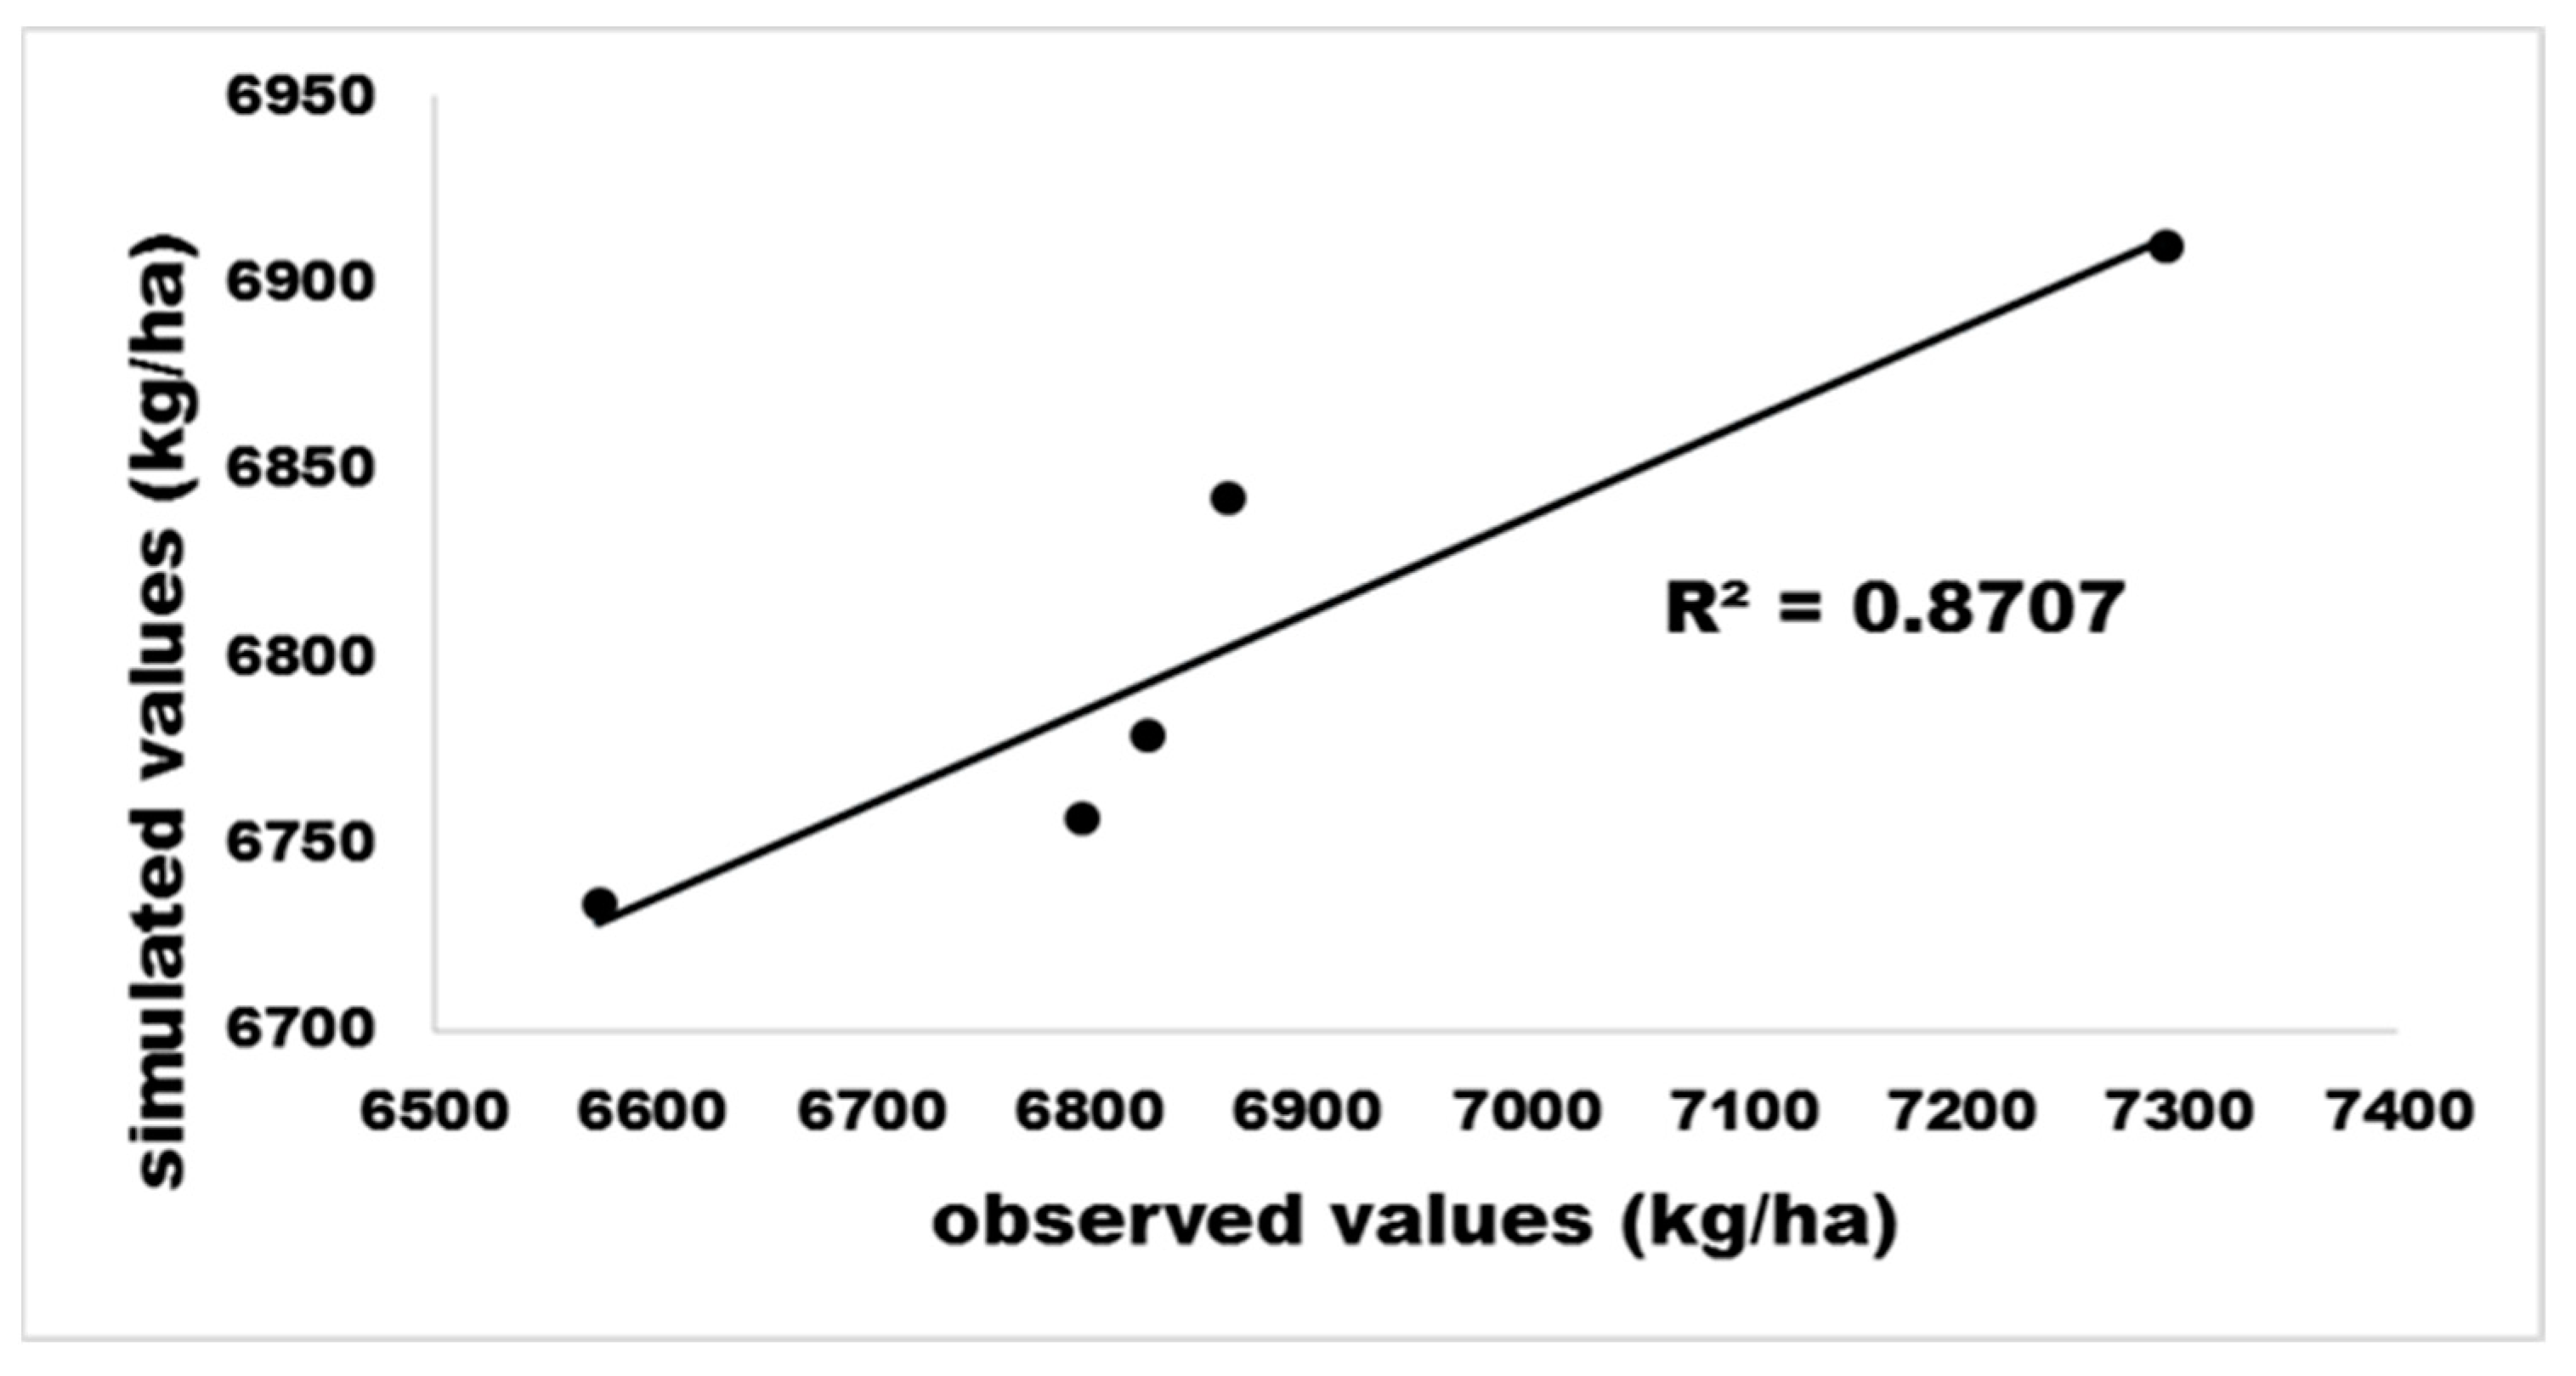
The simulation result of fresh fruit yield using DSSAT CERES-Maize and AquaCrop were shown at Table 5. Both DSSAT CERES-Maize and AquaCrop exhibited good performance in simulating the fresh fruit yield of sweet corn with R2 values of 0.9529 and 0.8707, respectively (Figure 4 and Figure 5).

Table 5.
Comparison of simulated and observed fresh ear mass during validation of the DSSAT and AquaCrop models during model validation.
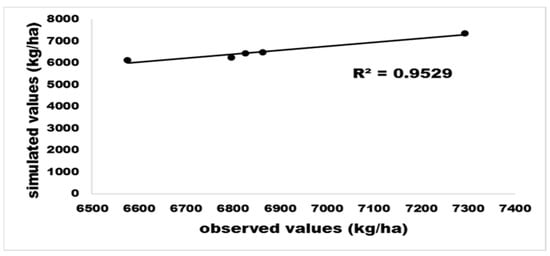
Figure 4.
Observed and simulated values of fresh sweet corn ear mass using the DSSAT CERES-Maize model during model validation.
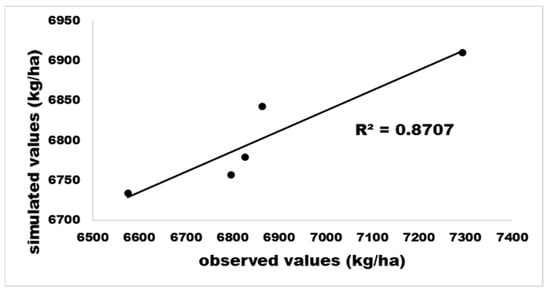
Figure 5.
Observed and simulated values of fresh sweet corn ear mass using the AquaCrop model during model validation.
3.4. Model Simulation Results
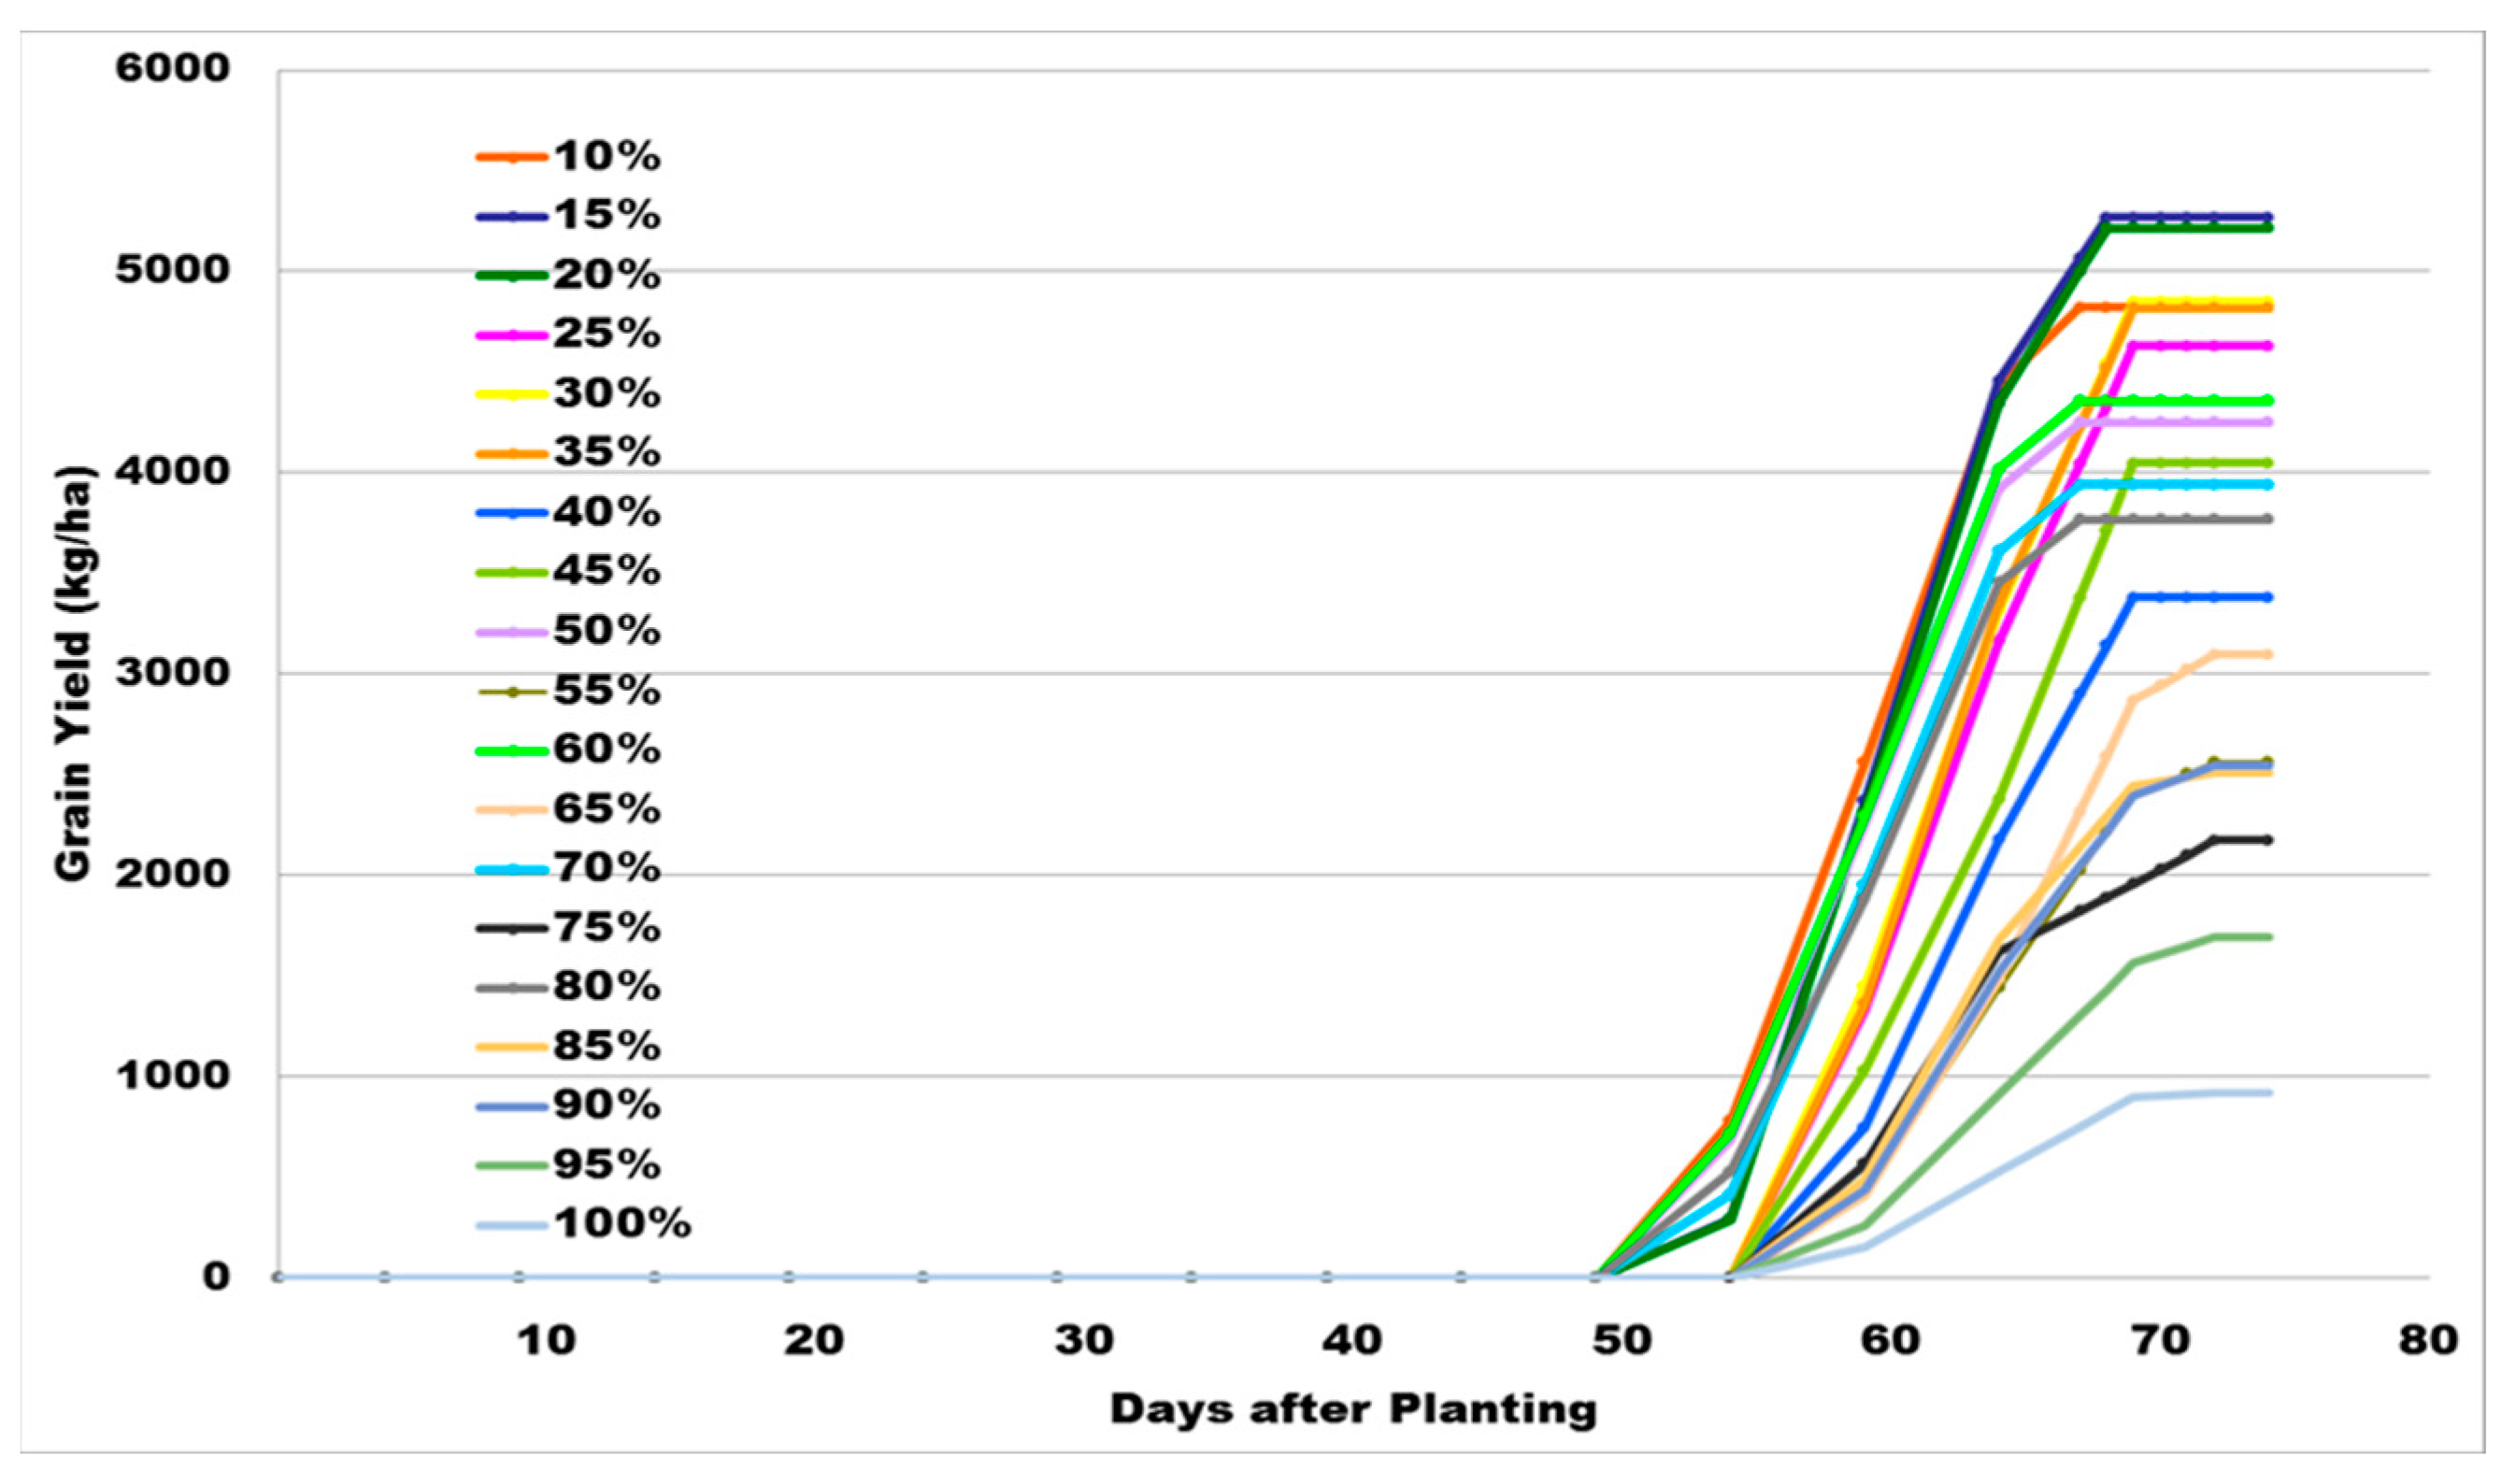
Simulation results for the various levels of DI are shown in Figure 6. Results showed that 15% DI and 20% DI gave the highest grain yield at an average yield of 5267 kg ha−1 and 5216 kg ha−1, respectively.
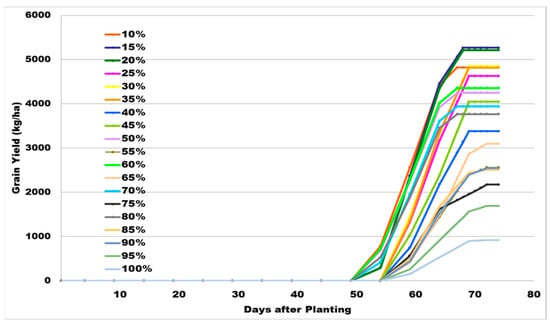
Figure 6.
Simulated grain yield at different levels of deficit irrigation using DSSAT CERES-Maize.
In terms of water productivity, model simulation results showed that 60% DI obtained the highest irrigation water productivity with 3.24 kg m−3. In this study, water productivity was measured as the ratio of marketable yield and the amount of water used by the crop throughout its growing season. Among all DI treatments, the 60% DI utilized the least amount of water and still obtained a high yield, making it the most productive in terms of water consumption. Moreover, 50% DI and 70% DI obtained the next highest irrigation water productivity with 2.51 kg m−3 and 2.50 kg m−3, respectively. On the other hand, 40% DI obtained the lowest irrigation water productivity with 1.50 kg m−3. These results showed that a small amount of irrigation water is capable of producing high yield.
Results also showed that there are phenological stages of crops wherein deficit irrigation has less impact on crop growth and yield. It was found that V3 to V6 stages of corn were not sensitive to water deficit. Furthermore, after the grain filling stage until harvest, corn crop is no longer sensitive to water deficit. These results are generally consistent with the findings of other studies (e.g., Denmead and Shaw, 1960) [22]. Under 60% deficit irrigation, different irrigation depths were applied at different phenological stage of corn. (Table 6).

Table 6.
Irrigation depths, grain yield, water productivity, and irrigation schedule under 60% deficit irrigation.
4. Discussion
The objective of this study was to simulate and analyze the effect of deficit irrigation on corn yield and water productivity using the AquaCrop (4.7) and DSSAT CERES-Maize crop simulation models.
Both DSSAT CERES-Maize and AquaCrop exhibited good performance in simulating the effect of deficit irrigation through the response variable fresh fruit yield of sweet corn with R2 values of 0.9529 and 0.8707, respectively. DSSAT CERES-Maize over-predicted the response variable fresh ear weight at high irrigation application (40% depletion of the Available Water). This result is also similar to the reported performance of CERES-Maize by Lizaso et al. (2007) [23]. The study reported that “the model consistently over-predicted fresh ear weight across the range of values examined”.
However, AquaCrop also over-predicted the response variable fresh ear weight at low irrigation application (80% depletion of the Available Water). This performance of AquaCrop is comparable to the study of Greaves and Wang (2016) [24], where they assessed AquaCrop in simulating maize growth and productivity under tropical environment, they reported that the model tended to overestimate the biomass accumulated, with the deviation becoming more distinct in the deficit irrigation treatments especially in water stress treatment, and therefore, they concluded that as water stress intensifies model reliability lessens [25].
Simulation results showed that a net irrigation of 77.3 mm that was scheduled during start of tasseling to grain filling stage produced the highest grain yield of 5009 kg ha−1. Furthermore, a 69.9 mm of net irrigation that was applied during tasseling to grain filling stage produced a grain yield of 5006 kg ha−1. In terms of water productivity, an irrigation depth of 6.3 mm that was applied at the end of tasseling stage to grain filling stage obtained the highest water productivity of 8.2 kg m−3. These results agree with previous studies that have shown that crop simulation models can predict yield accurately for a wide range of environmental conditions [26,27,28].
The effect of stress is more severe during the reproductive stages partially because evapotranspiration is usually the highest at that time. Stress during the vegetative stages reduces total plant dry matter, which has been shown to be linearly related to yield [29,30].
These results highlight the importance of considering the crop’s phenological stage when scheduling an irrigation. Results also showed that the tasseling stage, silking stage until grain filling stage are the stages that are most susceptible to water stress. Water stress can lower the crop’s yield at high level if it occurs during these stages.
5. Conclusions
Successful imposition of deficit irrigation strategy can be achieved if supported with a decision support system like crop simulation models. In terms of yield, model simulation results showed that 15% DI and 20% DI provide the highest grain yield at an average of 5267 kg ha−1 and 5216 kg ha−1, respectively. The 10% DI did not render any sign of water stress, and yet gave a relatively lower yield compared to 15% and 20% DI. Results suggest that maintenance of soil moisture very close to field capacity does not necessarily lead to increased crop yield. In terms of water productivity, model simulation results showed that 60% DI generate the highest water productivity at 3.24 kg m−3. Among all DI treatments, the 60% DI utilized the least amount of water and still obtained a high yield. Therefore, a small amount of irrigation application can still lead to increased water use efficiency and crop productivity, as long as it is being applied at the right phenological stage of a crop. Results also showed that there are phenological stages of crops wherein deficit irrigation has less impact on crop growth and yield. It was found out that V3 to V6 stages of corn were not sensitive to water deficit. Furthermore, results showed that growth stages after the grain filling stage until harvest corn crop are no longer sensitive to water deficit. Model simulation results also showed that the tasseling stage and silking stage until grain filling stage are the stages that are most susceptible to water stress, which consequently affects the quality and quantity of crop yield. This study demonstrated that deficit irrigation is a practical water saving management strategy that leads to the sustainable use of water resources. Furthermore, the use coupled crop simulation model (DSSAT CERES-Maize and AquaCrop) proved to be a viable tool to support decision making in corn production systems in the Philippines, especially when imposing deficit irrigation.
Author Contributions
Conceptualization, M.S.P. and V.B.E.; Methodology, M.S.P. and V.B.E.; software, M.S.P.; validation, M.S.P.; formal analysis, M.S.P.; investigation, M.S.P.; resources, M.S.P. and V.B.E.; data curation, M.S.P.; writing—original draft preparation, M.S.P.; writing—review and editing, M.S.P. and V.B.E.; visualization, M.S.P.; supervision and project administration, M.S.P. and V.B.E.; funding acquisition, M.S.P. and V.B.E. All authors have read and agreed to the published version of the manuscript.
Funding
This research was funded by the CHED-PCARI project entitled “Development of wireless sensor network-based water information system for efficient irrigation water management in the Philippines” and the Engineering Research and Development Technology (ERDT) under DOST-SEI.
Institutional Review Board Statement
The study was approved by the University of the Philippines Los Baῆos, Graduate School.
Informed Consent Statement
Not applicable in this manuscript.
Data Availability Statement
Not applicable here.
Acknowledgments
The authors would like to acknowledge the support of Aurelio A. Delos Reyes, Ronaldo B. Saludes, and Delfin Suministrado in this research study.
Conflicts of Interest
The authors declare no conflict of interest. The funders had no role in the design of the study; in the collection, analyses, or interpretation of data; in the writing of the manuscript, or in the decision to publish the results.
References
- Ertek, A.; Kara, B. Yield and quality of sweet corn under deficit irrigation. Agric. Water Manag. 2013, 129, 138–144. [Google Scholar] [CrossRef]
- English, M.J.; Solomon, K.H.; Hoffman, G.J. A paradigm shift in irrigation management. J. Irrig. Drain. Eng. 2002, 128, 267–277. [Google Scholar] [CrossRef]
- Traore, S.B.; Carlson, R.E.; Pilcher, C.D.; Rice, M.E. Bt and non-Bt maize growth and development as affected by temperature and drought stress. Agron. J. 2000, 92, 1027–1035. [Google Scholar] [CrossRef]
- Jama, A.O.; Ottman, M.J. Timing of the first irrigation in corn and water stress conditioning. Agron. J. 1993, 85, 1159–1164. [Google Scholar] [CrossRef]
- Gavloski, J.E.; Whitfield, G.H.; Ellis, C.R. Effect of restricted watering on sap flow and growth in corn (Zea mays L.). Can. J. Plant Sci. 1992, 72, 361–368. [Google Scholar] [CrossRef] [Green Version]
- Fereres, E.; Soriano, M.A. Deficit irrigation for reducing agricultural water use. Special issue on ‘Integrated approaches to sustain and improve plant production under drought stress’. J. Exp. Bot. 2007, 58, 147–159. [Google Scholar] [CrossRef] [Green Version]
- Costa, J.M.; Ortuño, M.F.; Chaves, M.M. Deficit irrigation as a strategy to save water: Physiology and potential application to horticulture. J. Integr. Plant Biol. 2007, 49, 1421–1434. [Google Scholar] [CrossRef]
- Geerts, S.; Raes, D. Deficit Irrigation as an on-farm strategy to maximize crop water productivity in dry areas. Agric. Water Manag. 2009, 96, 1275–1284. [Google Scholar] [CrossRef] [Green Version]
- Lamm, F.R.; Manges, H.L.; Stone, L.R.; Khan, A.H.; Rogers, D.H. Water requirement of subsurface drip-irrigated corn in Northwest Kansas. Trans. ASAE 1995, 38, 441–448. [Google Scholar] [CrossRef]
- Rodrigues, G.C.; Paredes, P.; Goncalves, J.M.; Alves, I.; Pereira, L.S. Comparing sprinkler and drip irrigation systems for full and deficit irrigated maize using multi criteria analysis and simulation modelling: Ranking for water saving vs. farm economic returns. Agric. Water Manag. 2013, 126, 85–96. [Google Scholar] [CrossRef]
- Wang, Y.-M.; Namaona, W.; Traore, S.; Zhang, Z. Seasonal temperature-based models for evapotranspiration estimation under semi-arid conditions of Malawi. Afr. J. Agric. Res. 2009, 4, 878–886. [Google Scholar]
- Gary, C.; Jones, J.W.; Tchamitchian, M. Crop modelling in horticulture: State of the art. Sci. Hortic. 1998, 74, 3–20. [Google Scholar] [CrossRef]
- Soler, C.M.T.; Sentelhas, P.C.; Hoogenboom, G. Application of the CSM-CERES-Maize model for planting date evaluation and yield forecasting for maize grown off-season in a subtropical environment. Eur. J. Agron. 2007, 27, 165–177. [Google Scholar] [CrossRef]
- Hoogenboom, G. Contribution of agrometeorology to the simulation of crop production and its applications. Agric. For. Meteorol. 2000, 103, 137–157. [Google Scholar] [CrossRef]
- Bondad, R.M.; Ella, V.B.; Saludes, R.B.; Reyes, M.R.; Mercado, A.R. Simulating the impact of conservation agriculture on corn yield in the Philippines using the DSSAT CERES-Maize model. Phil. Agric. Sci. 2015, 98, 190–201. [Google Scholar]
- Lansigan, F.P.; Salvacion, A.R. Assessing the Effect of Climate Change on Rice and Corn Yields in Selected Provinces in the Philippines. Int. J. Sci. Basic Appl. Res. 2015, 23, 54–68. [Google Scholar]
- Painagan, M.S.; Gutierrez, H.M. Simulation of Corn Yield in Carmen, North Cotabato Philippines, using AquaCrop Model. USM RD J. 2014, 2, 1–8. Available online: https://publications.waset.org/abstracts/search?q=Marilyn%20Painagan (accessed on 11 July 2022).
- Ella, V.B. Annual Report for the CHED-PCARI Project Entitled “Development of Wireless Sensor Network-Based Water Information System for Efficient Irrigation Water Management in the Philippines”. 01 June 2019. Available online: https://agris.fao.org/agris-search/search.do?recordID=PH2020000486 (accessed on 11 July 2022).
- Anothai, J.; Soler, C.M.T.; Green, A.; Trout, T.J.; Hoogenboom, G. Evaluation of two evapotranspiration approaches simulated with the CSM–CERES–Maize model under different irrigation strategies and the impact on maize growth, development and soil moisture content for semi-arid conditions. Agric. For. Meteorol. 2013, 176, 64–76. [Google Scholar] [CrossRef]
- Willmott, C.J. On the validation of models. Phys. Geogr. 1981, 2, 184–194. [Google Scholar] [CrossRef]
- Singh, J.; Knapp, H.V.; Demissie, M. Hydrologic modeling of the Iroquois river watershed using HSPF and SWAT. J. Am. Water Resour. Assoc. 2004, 41, 343–360. [Google Scholar] [CrossRef]
- Denmead, O.T.; Shaw, R.H. The effects of Soil Moisture Stress at Different Stages of Growth on the Development and Yield of Corn. Agron. J. 1960, 3064, 272–274. [Google Scholar] [CrossRef]
- Lizaso, J.I.; Boote, K.J.; Cherr, C.M.; Scholberg, J.M.S.; Casanova, J.J.; Judge, J.; Jones, J.W.; Hoogenboom, G. Developing a sweet corn simulation model to predict fresh market yield and quality of ears. J. Am. Soc. Hortic. Sci. 2007, 132, 415–422. [Google Scholar] [CrossRef] [Green Version]
- Greaves, G.E.; Wang, Y.-M. Assessment of FAO AquaCrop model for simulating maize growth and productivity under deficit irrigation in a tropical environment. Water 2016, 8, 557. [Google Scholar] [CrossRef]
- Greaves, G.E.; Wang, Y.-M. Effect of regulated deficit irrigation scheduling on water use of corn in southern Taiwan tropical environment. Agric. Water Manag. 2017, 188, 115–125. [Google Scholar] [CrossRef]
- Piper, E.L.; Weiss, A. Evaluating CERES-Maize for reduction in plant population or leaf area during the growing season. Agric. Syst. 1990, 33, 199–213. [Google Scholar] [CrossRef]
- Jagtap, S.S.; Mornu, M.; Kang, B.T. Simulation of growth, development, and yield of maize in the transition zone of Nigeria. Agric. Syst. 1993, 41, 215–229. [Google Scholar] [CrossRef]
- Ritchie, J.T.; Alagarswamy, G. Model concepts to express genetic differences in maize yield components. Agron. J. 2003, 95, 4–9. [Google Scholar] [CrossRef]
- Payero, J.O.; Tarkalson, D.D.; Irmak, S.; Davison, D.; Petersen, J.L. Effect of irrigation amounts applied with subsurface drip irrigation on corn evapotranspiration, yield, water use efficiency, and dry matter production in a semiarid climate. Agric. Water Manag. 2008, 95, 895–908. [Google Scholar] [CrossRef] [Green Version]
- Howell, T.A.; Schneider, A.D.; Evett, S.R. Subsurface and surface micro-irrigation of corn-Southern High Plains. Trans. ASAE 1997, 40, 635–641. [Google Scholar] [CrossRef]
Publisher’s Note: MDPI stays neutral with regard to jurisdictional claims in published maps and institutional affiliations. |
© 2022 by the authors. Licensee MDPI, Basel, Switzerland. This article is an open access article distributed under the terms and conditions of the Creative Commons Attribution (CC BY) license (https://creativecommons.org/licenses/by/4.0/).

