Article

Spatial Distribution and Invasion Potential of the Naturalized Downy Thorn Apple (Datura innoxia): Evidence from Classification and Ordination

1
College of General Education, University of Doha for Science and Technology, Al Tarafa, Jelaiah Street, Duhail North, Doha P.O. Box 24449, Qatar
2
Department of Botany, University of Malakand, Caldara, Dir Lower 18800, Khyber Pakhtunkhwa, Pakistan
3
College of Health Sciences, University of Doha for Science and Technology, Al Tarafa, Jelaiah Street, Duhail North, Doha P.O. Box 24449, Qatar
4
College of Engineering Technology, University of Doha for Science and Technology, Al Tarafa, Jelaiah Street, Duhail North, Doha P.O. Box 24449, Qatar
*
Author to whom correspondence should be addressed.
Sustainability 2022, 14(16), 10214; https://doi.org/10.3390/su141610214
Submission received: 3 July 2022 / Revised: 8 August 2022 / Accepted: 10 August 2022 / Published: 17 August 2022
(This article belongs to the Special Issue Biodiversity Conservation and Environmental Sustainability)

Abstract

:
The present study aimed to assess the spatial distribution and invasion potential of naturalized Datura innoxia Mill., a member of the family Solanaceae, across elevation, edaphic, and climatic gradients in invaded communities of semiarid regions in northern Pakistan. The species’ phytosociological attributes, diversity indices, and biotic and environmental factors were assessed in 21 sites (210 plots) and categorized into three elevation groups separated by Ward’s agglomerative cluster. The vegetation was dominated by annual species, which facilitated the naturalization and invasion of alien species. The groups were dominated by D. innoxia, having different codominant species Parthenium hysterophorus L. in Group I, Medicago denticulata in Group II, and Parthenium hysterophorus in Group III; however, the third codominant species of groups I and III were different. In addition, Canonical correspondence analysis (CCA) unveiled that abiotic factors such as elevation (r = −0.65), mean yearly temperature (r = 0.79), annual yearly humidity (r = 0.76), and day length in hours (r = 0.79) and biotic factors such as cultivated fields (r = −0.83) and traffic density (r = 0.70) were strongly correlated on canonical axes, revealing their vital importance in determining vegetation structure. The study concluded that this naturalized species propagated efficiently in the present environmental conditions and if these conditions prevailed, the species would be established as an invasive species. Therefore, control of this naturalized species is critically important, including their exploitation for medicinal and phytochemical utilization, which will enhance the protection of native populations.

1. Introduction

Human activities have resulted in significant changes to natural landscapes and new human-made habitat types over the last several decades [1]. Many studies have investigated the floristic composition of invaded areas in different geographies and at various scales [2,3]. These studies have provided a fundamental understanding of the primary factors influencing species richness and floristic composition in urban environments. However, nonnative plant species have dramatically affected native plant communities and ecological processes, having varying impacts on different habitats [4]. Although the establishment of plant alien species seldom results in biodiversity loss, several studies [5] have indicated significant biodiversity losses due to alien species establishment in an area [6]. Plant invasions may change an ecosystem’s biodiversity, speed up the nutrient cycle process, and impact the natural environment and human well-being [7]. The uniformity of plant ecosystems at different geographical scales has also been linked to alien species invasion [8].
Alien species must overcome obstacles, including abiotic and biotic barriers, to establish themselves properly in their new nonnative environments [9]. The most important abiotic filters include altitudinal gradients, topographic variables, and climatic conditions that impact diversification trends and community organization [10]. Moreover, the soil’s physicochemical properties influence plant population spread [11]. Soil type and drainage [12], or soil texture, sewerage, chemical, ion exchange capability, and pH [13], have been the factors most focused on in regard to species distribution and future trends to improve our understanding of the establishment and naturalization of nonnative species [14]. Naturalized species are aliens that have self-replacing populations for at least 10 years without human intervention, freely recruit new plants, and do not necessarily invade ecosystems [15]. Even though abiotic interactions have a role in determining where species may establish, biotic components such as grazing intensity, traffic density, and agricultural and cultivated land play a crucial, multifaceted role in shaping community structure [16].
The recent climate changes have facilitated the spread of naturalized species into high-altitudinal areas [17]. The variations in altitudes may be accompanied by various climatic changes, which directly affect the invasion process [10]. Areas with higher elevations may have lower population density, fewer resources available, shorter growing seasons, less microbial activity, and shorter growing seasons [18]. Additionally, for newly invading aliens, the environmental parameters of any place, notably temperature, relative humidity, and day length, operate as an abiotic filter [19]. The filter’s effectiveness is determined by how closely climatic conditions match the species’ native and invaded areas [20]. If the climate in the newly infested area is comparable to that of the native range, the propagation pattern of the alien species does not alter, and it propagates as it grows in its native range. Conversely, an alien species’s success is governed by a combination of climatic changes and the species’s inherent capabilities to reproduce and flower [21]. Consequently, considering these factors and their relative effects on a species’s community structure may provide insight into an alien species’s future under various environmental and climatic conditions [22].
Datura innoxia Mill., also known as “Wrejkae” in Pashto or "Dhutura" in Bengali, is a subshrubby plant of Solanaceae with spreading branches [23]. It is a perennial plant, pollinated by insects that may grow up to 1.5 meters in height, with dark green, simple, glabrous, alternating, shallowly lobed, and broadly ovate leaves and solitary, hermaphroditic flowers [24]. The trumpet-shaped flowers have a pleasant fragrance; various shades, ranging from light to dark purple and from white to yellow; and a capsule fruit with spines [25]. The species can grow in various soil types but favors wet, alkaline soil and does not thrive in the shade. It is found in warmer climates and favors a hot climate [26]. D. innoxia, a naturalized medicinal plant established in several areas of Khyber Pakhtunkhwa, threatens native biodiversity and crops. However, no attention has been paid to its community structure and associated environmental variables to evaluate the factors that facilitate its naturalization. Therefore, the present study documented the flora and floristic composition of D. innoxia communities and the environmental factors that impacted these communities. In this study, we (i) investigated the pattern of floristic composition and life forms associated with D. innoxia naturalized communities and their importance in propagation and future invasive behavior, (ii) organized the spatial distributions of D. innoxia-dominated communities and related environmental variables into groups to identify key environmental and climatic factors that maintained the communities, and (iii) predicted, on the basis of this information, the future propagation of this naturalized species and consequently its invasion in the selected region of Pakistan. These objectives were based on the hypotheses that D. innoxia-established populations had changed the structure of their communities and that diversity could be revealed from phytosociological attributes and species diversity indices. In addition, the naturalization of the species was assessed and supported by the environmental and biotic variables that progressively changed across the elevation gradient.

2. Materials and Methods
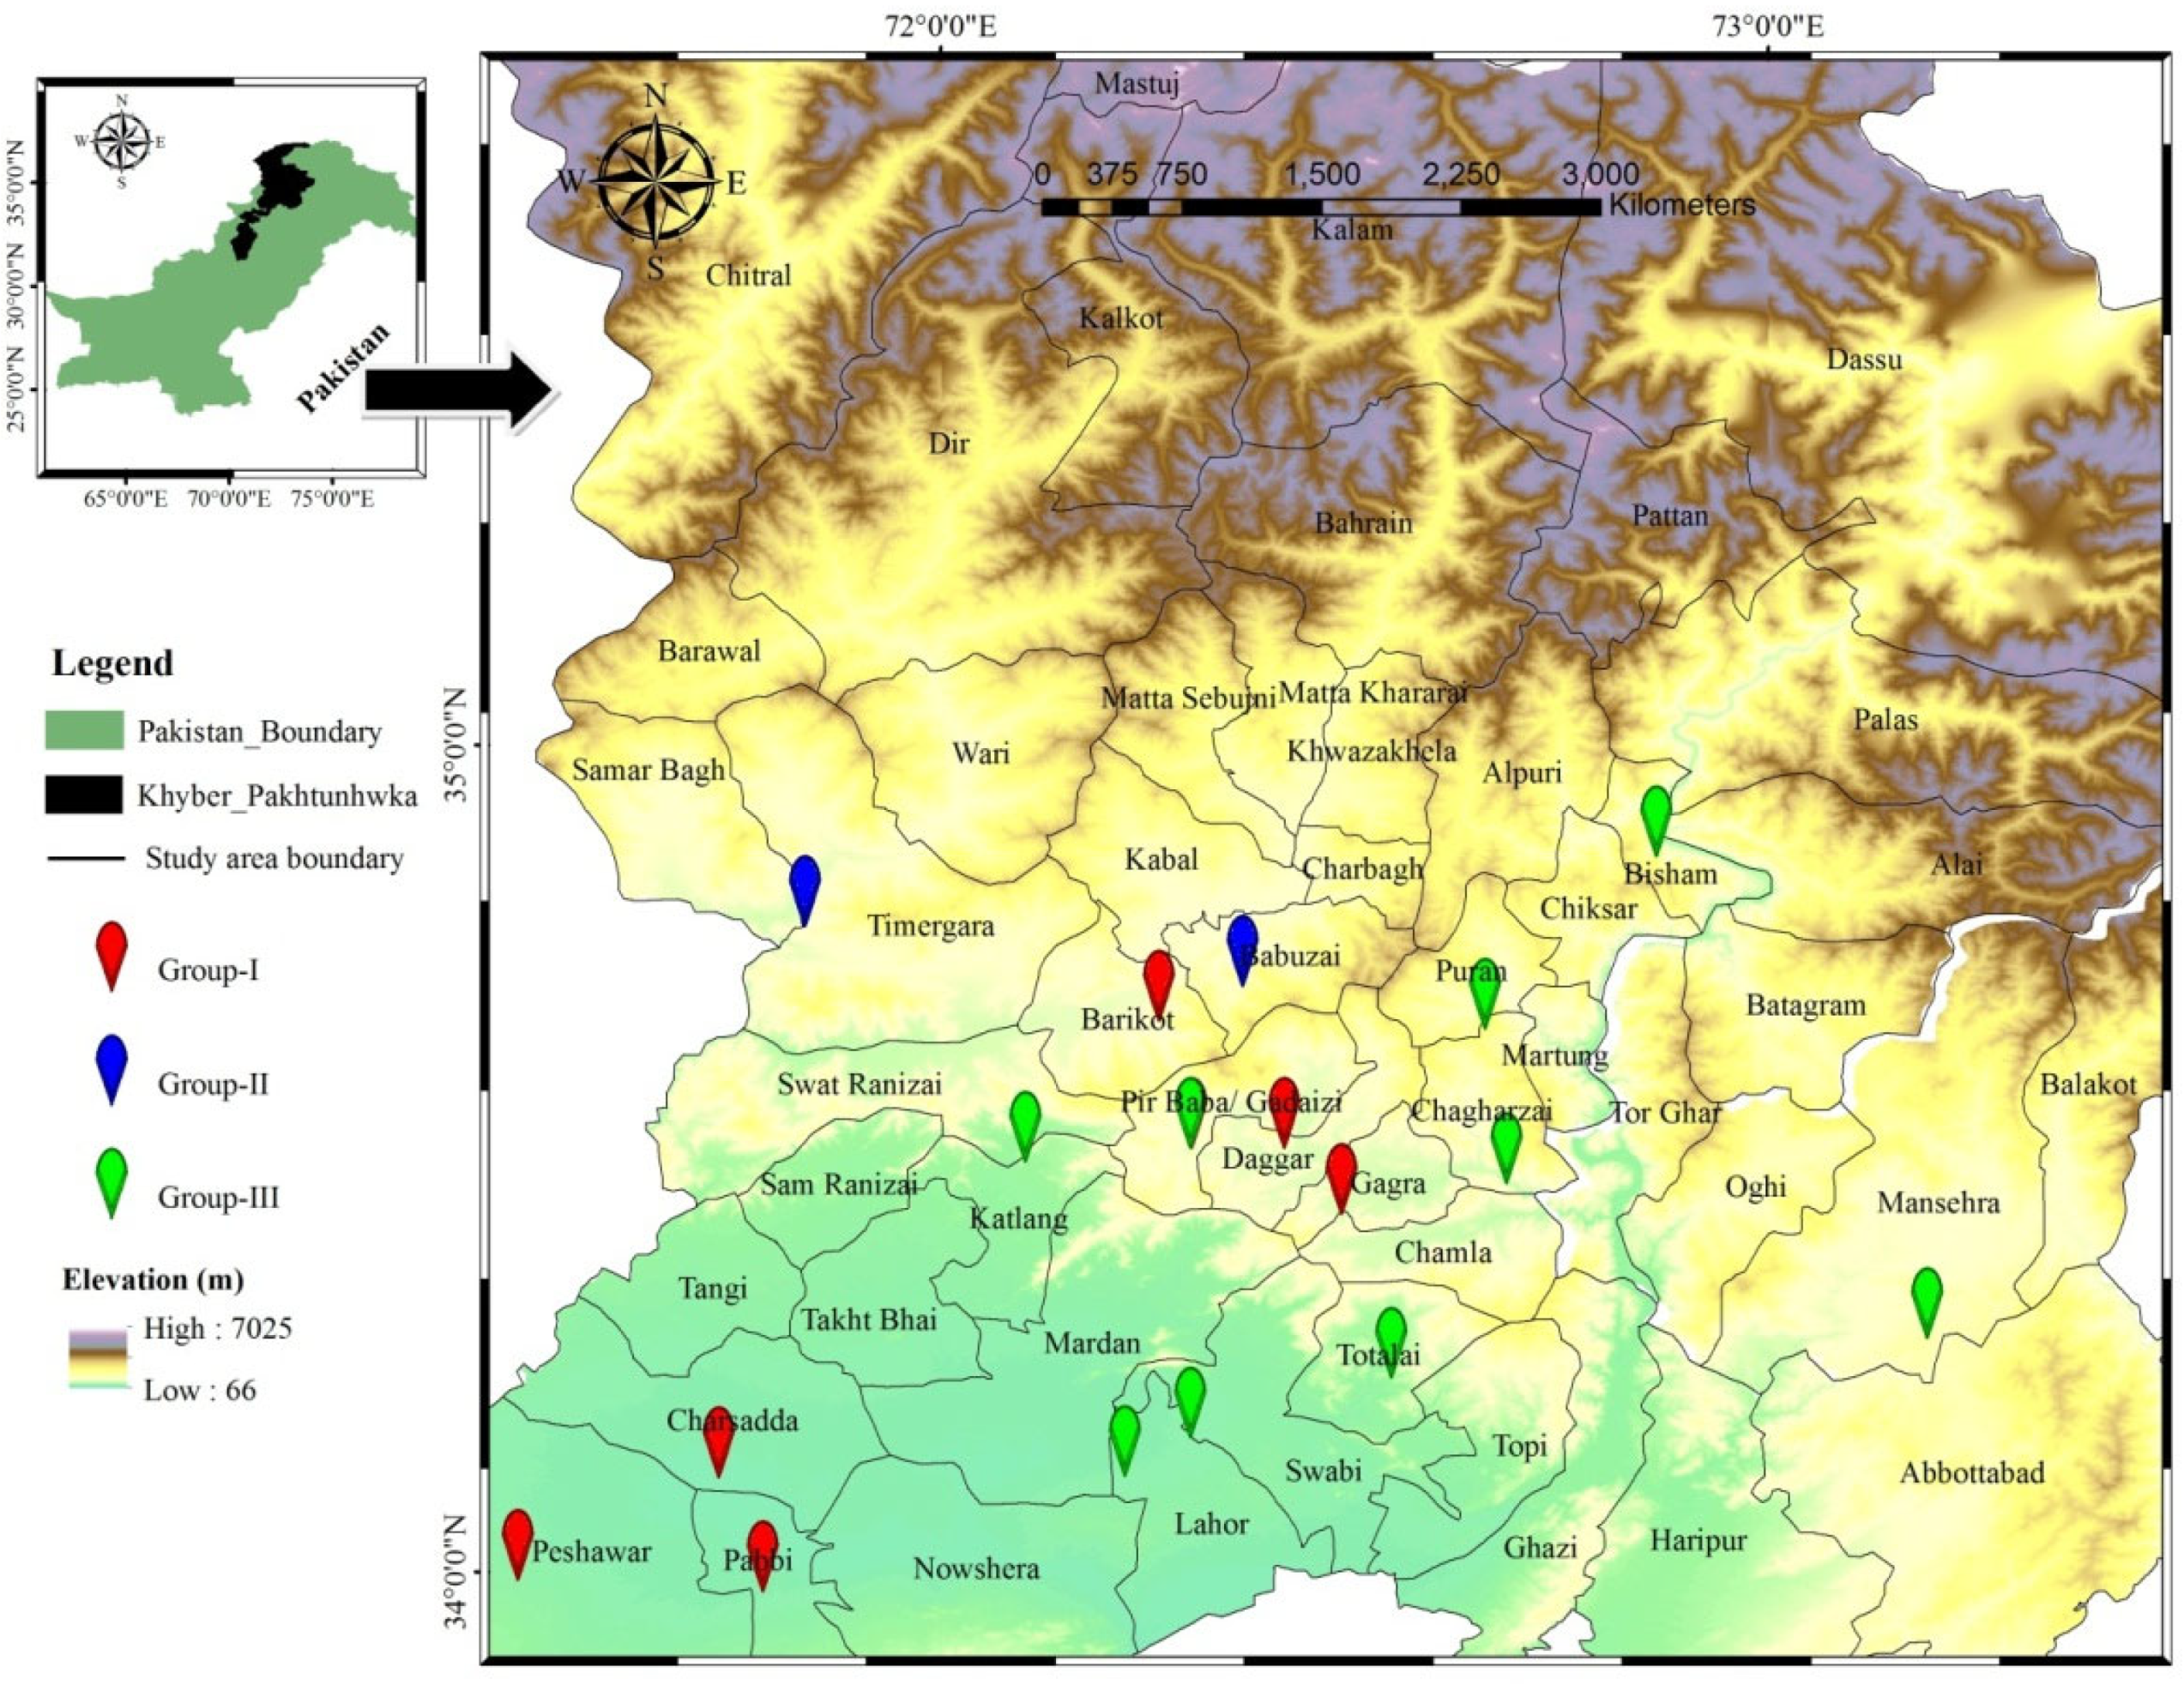
2.1. Study Area

The current study was conducted in Khyber Pakhtunkhwa, Pakistan, in areas where D. innoxia communities prevailed. Khyber Pakhtunkhwa is one of Pakistan’s five administrative provinces in the country’s northwestern region. It is bordered on the east by Punjab, on the south by Baluchistan province, on the northeast by Azad Jammu and Kashmir (AJK), and on the west by Afghanistan and the Federally Administered Tribal Areas (FATA) [27]. Mountain ranges, including the Himalayan, Hindukush, and Karakorum, form the province’s northern and eastern boundaries. In the Hindukush range, the province’s elevation ranges from plains (327 m in Peshawar) to mountains (7708 m in Tirch Mir) [28]. The study region (Figure 1) was between 34.59 and 34.85 degrees north latitude and 71.44 and 72.82 degrees east longitude, with elevations ranging from 360 to 1200 meters above sea level.
The province is characterized by high mountains that significantly influence the area’s climate along the elevation gradient from south to north and northwest with a discernible rise in temperature. The winters in the mountains are cold, while the summers are mild. June is the hottest month of the year, with average high temperatures of 34.96 ± 1.36 degrees Celsius and average low temperatures of 19.10 ± 1.50 degrees Celsius. The coldest month is January, with mean minimum temperatures of 0.67 ± 0.97 °C and mean maximum temperatures of 13.72 ± 1.39 °C. These values suggest that winters are harsher, since the temperature typically drops below the freezing threshold [29]. The yearly average precipitation ranges from 384 to 639 millimeters, and the relative humidity, from 54.8 ± 12.18 to 77.35 ± 3.12 percent [29]. The area’s climate plays an important part in the region’s social, economic, hydrological, and agricultural activities, and it was crucial for investigating the vegetation structure in the area [30].

2.2. Field Studies of Invasive Species Distribution and Interspecies Associations

A total of 21 D. innoxia-dominated stands were randomly sampled from 15 districts in field studies (Figure 1). The sites were categorized into three groups based in elevation, i.e., group I (from 427 ± 73.9 m above sea level (asl)), group II (from 798.9 ± 31 m asl), and group III (from 1151.66 ± 34 m asl), following [31]. The dataset consisted of 210 phytosociological plots (21 × 10 = 210 sites), which were selected precisely according to the principles of species diversity and structural uniformity within assessed plant stands to offer a representative survey of the whole study region following [2]. The plot sizes ranged from 3 to 5 m2, with differences of up to 5, as determined by [32], along 150–200 m transects in the vegetation dominated by D. innoxia. The standard procedure of Curtis and McIntosh [33] was used to determine the density, frequency, cover, relative density, relative frequency, relative cover, and importance value index in each plot. Following [34], edge effects were minimized by omitting a 10 m buffer zone between the adjacent quadrate borders (Figure 2). All plants were identified using the Flora of Pakistan [35] and the Kew Botanical Garden online source (https://powo.science.kew.org/. Accessed on 28 July 2022).

2.3. Assessment of Diversity Indices

The 210 plots invaded at varied intensities by D. innoxia were evaluated using the number of species (species richness), density, cover, height, and importance value index to assess species diversity and invasion consequences. Following Flora of Pakistan, an inventory was established including the species name, plant family, and other floristic features [36]. Herbarium vouchers were placed at the University of Malakand, Khyber Pakhtunkhwa, Pakistan’s Department of Botany. Based on species density, three significant ecological diversity indices were derived: species richness (S), evenness index (E), and Shannon–Wiener diversity index (H) [37] presented in equation 1 and 2. Species richness was determined by a simple count of species types in the stand. The E and H′ indices are determined as follows:
E = H In S
H = i = 1 S p i   In p i
where lnS = natural logarithm of species richness, pi = proportion of the species (1) to the total number of species, and ln pi = natural logarithm of pi.

2.4. Assessment of Environmental and Biotic Factors

Soil samples of 3 kg were collected from two opposing corners and a midposition of each D. innoxia-infested stand to describe the soil parameters. The top layer of soil is usually rich in nutrients, so samples were taken from 0 to 30 cm deep [38], then clumped and mixed well to reduce heterogeneity [34]. A digital pH meter and an EC-meter were used to measure soil pH and electrical conductivity in a soil–water suspension (at 1:5 ratios). The physiochemical and textural character of the soil was assessed by air-drying the samples and filtering them through a 2 mm screen, as per USDA procedures [39]. Organic matter was estimated using the Walkley–Black technique, while total organic carbon was evaluated using wet combustion with chromic acid digestion followed by dry combustion [40]. Micro-Kjeldahl was used to assess total nitrogen, accessible phosphorus (P2+), and exchangeable potassium (K+) according to [41]. Reis et al. [39] used the geometric approach to determine lime (calcium carbonate; percent) and assessed CO2 evolution geometrically. We calculated additional soil characteristics such as available water (AW), field capacity (FC), wilting and saturation point (WSP), conductivity (s/cm), and bulk density (BD) using an online calculator (https://www.nrcs.usda.gov accessed 22 June 2021), following [42]. The hydrometer approach [43] was used at the Swat Agriculture Research Institute (SARI) to assess textural qualities such as sand, clay, and percentage of silt distribution. The climatic data (temperatures, humidity and day length) were collected from meteorological stations in Peshawar, Hazara, and Malakand.
The degrees of biotic disturbance induced by erosion intensity, agricultural field disturbance, grazing intensity, and traffic density were measured using a six-point scale (0–5). A plot that received a score of 0 was regarded as undisturbed, while one that received a score of 5 was considered very disturbed [44]. Thus, 0 indicated no disturbance, 1 indicated that 0–20 percent of the plot had been disrupted, 2 indicated that 21–40 percent of the plot had been disturbed, 3 indicated that 41–60 percent of the plot had been disturbed, 4 indicated that 61–80 percent of the plot had been disturbed, and 5 indicated that 81–100 percent of the plot had been disturbed. The degrees of disturbance were graded based on the proportions of the given parameter persisting in disturbed plots, with each kind of disturbance being studied independently in this semiqualitative assessment. The point scale values were derived according to [45] to account for various forms of biotic disturbance.

2.5. Data Analyses

For analysis and interpretation, phytosociological data on species in the 21 stands and associated environmental factors were data banked. According to [46], the relative phytosociological qualities were transformed into an importance value index (IVI). Ward’s agglomerative approach was used to classify vegetative groups, with the Euclidean distance option selected in the software PC-ORD ver. 6.0. [47]. Following the numerical categorization, each stand’s species were allocated to a phytosociological category. The current literature was used to see whether a certain species might indicate a class [48]. Then, to offer an appropriate phytosociological locus to the stand’s groups established by numerical classification, we included the converted relative phytosociological values of the diagnostic species in plots. The nonparametric Kruskal–Wallis test examined the differences in stand parameters in the generated clusters.
Canonical correspondence analysis (CCA) was used on species’ IVIs to investigate the link between floristic variation within D. innoxia-dominated vegetation and environmental factors. A Monte Carlo permutation test assessed the post hoc interpretation of the CCA ordination axes and revealed the suitability of the method for the process of ordination. In addition, vectors of relevant variables were shown in an ordination diagram. Graph Pad ver. 7.0 and MS Excel were used to undertake all quantitative analyses of vegetation and environmental data.

3. Results

3.1. Floristic Composition

D. innoxia was found to be associated with thirty-eight species distributed in twenty-two families. The life forms revealed that most of the species were herbs (83%), followed by shrubs (14%), while the remaining were trees and herbs/shrubs. The species in the communities were mostly native (59%), naturalized (20%), invasive (17%), and casual alien (4%). Similarly, 55% of the plant species were annual, 8% were annual/perennial, 34% were perennial, and 3% were biennial shrubs (Figure 3). The following plant families were sorted in increasing order of species counts in the research areas: Asteraceae (23%, N = 9); Amaranthaceae and Lamiaceae (10%, N = 4); Solanaceae and Polygonaceae (5%, N = 2); and Apocynaceae, Aizoaceae, Boraginaceae, Carnaceae, Celastraceae, Fabaceae, Nyctaginaceae, Poaceae, Scropholaraceae, Sapindaceae, and Zygophyllaceae (3%, N = 1) (details available in Supplementary Table S1).

3.2. Vegetation Communities and Diversity Indices

The dendrogram at 50% information showed reasonable segregations of the communities dominated by D. innoxia into three distinct groups along the altitudinal gradients (Figure 4). Group I (community I) lay at low elevations and consisted of 16 species distributed in 7 stands. The codominant species of the community were Parthenium hysterophorus, with an IVI of 13.35 ± 2%, followed by Cannabis sativa L. (12.11 ± 2.5%), while the remaining thirteen species had IVIs of less 10%, as depicted in Table 1. The community could be designated as a DaturaPartheniumCannabis community in which the associated species was invasive, indicating overall a floristically disturbed community. Group II (community II) lay at intermediate elevations and consisted of 16 species distributed in three stands. The codominant species of the community was Medicago denticulata, with an IVI of 13.92 ± 5.34%, while the rest of the species had IVIs of less than 10%. The community could be designated as a DaturaMedicago community. Medicago denticulata is a native species, indicating a relatively stable community compared with community I.
Group III (Community III) was the diverse community that lay at higher elevations and consisted of 22 species distributed in 11 stands. The codominant species of the community were Cannabis sativa and Xanthium strumarium, with IVIs of 25.24 ± 1.7% and 10.44 ± 2.7%, respectively, while the remaining species had IVIs of less than 10%, as depicted in Table 1. The community could be designated as a DaturaCannabisXanthium community in which the associated species were invasive, indicating a disturbed community like community I. Overall, the codominant associated species were invasive and may have a deleterious impact on the native communities of the area.

3.3. Relation with Biotic and Environmental Variables

The diversity indices (Table 2) increased as elevation increased, i.e., the Shannon–Wiener diversity index ranged from 1.43 ± 0.07 to 1.81 ± 0.05 (groups I–III) and varied significantly (p < 0.05). However, Groups I and II had the same species richness (16), while Group III, at the highest elevation, had higher species richness. In contrast, the species evenness index varied in a narrow range, i.e., 0.76 ± 0.03–0.79 ± 0.02, and showed nonsignificant variation (p > 0.05). Moreover, the biotic factors varied across the elevation and IVI gradients, i.e., traffic density and the percentage of cultivated fields were higher at lower altitudes and progressively decreased at higher altitudes, varying significantly (F = 37 and 20.97, respectively at p <0.001). However, the reverse was true for grazing intensity and erosion percentages, which varied significantly, with F = 174.27 and 16.16, respectively (p < 0.001).
Among the environmental factors, elevation was the most important factor that differed significantly across groups (F-value 4.03 and P-value 0.036). Group I lay at an elevation of 427 ± 73.9 m above sea level, whereas group II lay at 798.9 ± 31 m and group III lay at 1151.66 ± 34 m above sea level. Similarly, in soil texture, group III had a higher percentage of silt than groups I and II, with a significant difference indicated by ANOVA (F-Value 3.42 and p-Value 0.054). The organic matter was lowest in group III and highest in group I; however, it differed less significantly (F-Value 2.93 and p-Value 0.079). Likewise, Group III had the lowest organic carbon mean value (0.24 ± 0.1) compared with the other groups. In contrast, group I had the highest organic carbon (0.96 ± 0.1), indicating a significant difference as demonstrated by ANOVA (F-Value 3.61 and p-Value 0.05).
Among the other soil nutrients, group III had a higher mean value of nitrogen than groups I and II, with a significant difference demonstrated by ANOVA (F-Value 8.70 and p-Value 0.00). In contrast, Groups II and III had more available water in their soil than group I and differed significantly (F-Value 3.24 and p-Value 0.06). The differences in climatic variables were found to be more pronounced than those in soil and environmental variables, as revealed in Table 3.
The CCA analysis showed 47.7% of the variation on the three axes, with axis 1 accounting for 17% of the variance, followed by axes 2 and 3 (Supplementary Table S2). The eigenvalues for the three axes were 0.49, 0.41, and 0.37, respectively. Organic matter (r = 0.32), cultivated fields (r = 0.30), traffic density (r = 0.32), and Shannon–Wiener diversity index (r = 0.39) all demonstrated substantial positive associations with the first ordination axis. Important parameters such as lime percentage (r = −0.30), erosion intensity (r = −0.49), grazing intensity (r = −0.39), and species richness (r = −0.39), on the other hand, had substantial negative associations on axis 1. The second axis, which may be viewed as an elevation gradient with a significant negative influence (r = −0.65) on D. innoxia-dominated vegetation, explained 14.1 percent of the floristic variance. Sand content had a reasonably positive correlation (r = 0.28), indicating that sand possibly favored populations of this invasive species. Silt content, on the other hand, had a negative relationship (r = 0.39).
The CCA-ordination biplot separated the vegetation types, with some species and stands spread and others concentrated in the center along axes 1 and 2, showing community homogeneity. In ordination arrangement, important invasive species such as Parthenium hysterophorus were found in the lower right quadrants. In contrast, important alien and native invasive species such as Xanthium strumarium and Cannabis sativa were found in the upper left and lower left quadrants (Figure 5). Similarly, the stands of the communities showed a clear distribution in the CCA biplot, where group I stands were in the lower right quadrant, group II stands were in the upper right quadrant, and group III stands were mostly in the upper left quadrant of the biplot. The environmental and biotic factors, i.e., organic matter percentage, elevation, soil texture, mean yearly temperature, annual yearly humidity, day length in hours, grazing intensity, traffic density, and cultivated fields, affected the communities, having significant biplot scores and being evident from the arrows in the CCA-ordination biplot.

4. Discussion

Alien species, once they have invaded an area, can form associations with the local floristic population. In this vein, we documented 38 plant species in 21 separate stands in different habitats based on elevation. These species belonged to 22, with Asteraceae (9 species), Amaranthaceae, and Lamiaceae (4 species each) being the most species-rich families and the remaining families being monospecific. This relationship between certain plant families and invaded regions has been found all over the globe, in addition to poor species richness. Ullah et al. [49] recently reported 50 Xanthium strumarium-invaded sites in the same area. Similarly, [50] found that Asteraceae, Poaceae, Amaranthaceae, and Fabaceae were the primary families of X. strumarium-dominated communities, and [51,52] found similar results. Discrepancies in taxonomic associations at the family level may be attributable to the geography and climate of a region [49], although our results matched previous findings.
Several floristic and phytosociological elements favor the establishment of D. innoxia in the region. Annual and perennial plant species dominated the communities, indicating that annuals, in particular, had pronounced effects on community homogenization [53] and that perennials promoted community disturbance, favoring an alien species invasion [54]. Likewise, P. hysterophorus and C. sativa are small herbs compared with D. innoxia, which may put them at a disadvantage given the tendency for smaller herbs to be gradually replaced by larger plants [55]. We also found D. innoxia invaded road/waste field sides in herb- or shrub-dominated communities and agricultural areas. Similarly, paved roads, railway tracks, and farming lands were predicted to be the most vulnerable areas to plant invasion [56]. In D. innoxia-dominated communities, IVI showed a declining tendency over elevation gradients. The cause of this elevation effect is unknown, since the impacts of an increase in nonnative plants on such large geographical and temporal scales are poorly understood [57]. Moreover, the decrease in IVI was inversely related to the species richness and Shannon–Wiener diversity, which may explain the negative impacts of D. innoxia’s phytosociological attributes. However, evaluation is needed of the environmental and biotic variables, which are also crucial in the spreading and establishing of nonnative communities. Similarly, Seifu et al. [50], Qureshi et al. [51], and Iqbal et al. [52] showed low diversity indices in invaded sites dominated by alien species. Nonnative species mostly invade lowland areas, disturbing the diversity and composition of native plant ecosystems and making them imperiled and fragile, rendering native endangered species more vulnerable to extinction [58]. Similarly, low diversity indices were found at low elevations, which might have indicated a high invasion rate in the studied areas.
Biotic variables substantially disrupted native community structure, favoring nonnative species invasion [59]. To link species invasion and biotic variables, the present study evaluated erosion intensity, grazing pressure, cultivated fields, and traffic density. These variables differed considerably across IVI and elevation gradients, indicating that they were associated with species invasion and community disruption. Lower altitudes had higher traffic density and agricultural activity or area occupied by cultivated fields, making the communities more vulnerable to invasion, as reported by [2,60]. This could be due to the easy transportation of the alien species propagules in such areas. According to [61], grazing pressure and erosion intensity increased at higher altitudes, favoring invasion by creating unoccupied niches for freshly invading propagules, allowing invasive plants to infiltrate the higher-altitude regions. These generalizations were supported by our results, which showed that D. innoxia had a significant impact on soil characteristics, as demonstrated by increasing D. innoxia IVIs, resulting in a drop in the Shannon–Wiener diversity index and species richness. In contrast, some researchers, e.g., [62], have indicated that aliens/naturalized species have a minor effect on community species richness. Invading communities might also favor a surge in native, fast-growing species resulting from changes in the composition, e.g., along with D. innoxia, Cannabis sativa, a fast-growing native invasive herbaceous plant, was found to be more frequent. D. innoxia, we believe, affected native diversity by changing anthropogenic and soil-variable patterns. As a result, D. innoxia’s presence impacted the diversity and richness of native species. D. innoxia likely offered a habitat for herbivorous species and competed with browsing-tolerant species for space. This study revealed that D. innoxia might impact native plant diversity and richness more than initially assumed. Similarly, the native vegetation of Nairobi National Park was studied to compare invaded and uninvaded sites [62,63]. Unlike our results, these researchers exposed that invasive species-infested habitats had higher diversity of native species.
The important feature that determines a nonnative species’s establishment and naturalization is the species’s adaptability to a prospective local soil’s physicochemical qualities, which subsequently modify community diversity [64]. The present study demonstrated significant changes in community composition and environmental factors throughout the altitudinal gradient. For example, as altitude increased, the percentages of organic matter and nitrogen dropped, but the percentages of lime, available water, and silt increased. Elevation affects soil parameters [65], and according to [66], soil nutrient availability and chemical composition are influenced either directly or indirectly by a plant species’s invasion capability. Furthermore, [67] found that alien/naturalized species may utilize available soil nutrients to regulate their establishment and propagation. Alien naturalized/invasive plants may also contribute to soil nutrient uniformity, encouraging further incursions into inhabited areas [68]. In a previous study, invaded sites had higher carbon, nitrogen, phosphorus, and potassium [69], and the plant growth rate and biomass output improved under nutrient-rich environments along with changes in plant biomass [69], which was consistent with our results. Invaders such as P. hysterophorus [70] and X. strumarium [3] have been proven to benefit from environmental degradation; this may also be true for D. innoxia. The most important component in encouraging and establishing nonnative plants is a combination of soil instabilities and fertilizer inputs [71]. Plant invasion and soil nutrition have a significant link [72], e.g., soils infected with P. hysterophorus had higher degradation and microbiological activity [73]. The same was true for D. innoxia in the present condition, a nutrient-rich zones were primarily invaded. Our results revealed that reduced nutrition availability at higher altitudes might limit invasion and naturalization intensities, resulting in lower IVIs of D. innoxia.
High altitudes show more diurnal change in climatic conditions [74]. Although most native species are at risk from climate change, aliens that thrive in warm environments are likely to flourish, increasing the risk to native species [75]. Plant invasion and development are also associated with global factors such as rainfall, nitrogen, and carbon dioxide deposition [76]. According to several researchers, increased precipitation promotes nutritional richness and invasion of alien species [77]. Our findings suggested that D. innoxia can adapt to various environmental gradients. Its capacity to flourish in various climatic and soil conditions was shown by its rapid growth and multiplication. Several studies have shown that invasive species such as P. hysterophorus have similar phenotypic plasticity and wide ranges of environmental adaptability [2,78]. D. innoxia follows the same pattern of plasticity, which will ultimately make it invasive in the region. Moreover, genetic diversity, genetic drift, and phenotypic plasticity may help the plant’s capacity to adapt to climate change across elevation gradients [79]. However, Vasseur et al. [80] identified the significance of a particular gene in Arabidopsis thaliana and reported that these genes reacted to abiotic stress and local temperature, affecting species distribution and relationships.

5. Conclusions

We found that D. innoxia was well established and spreading over the elevation gradient in the study area. Furthermore, D. innoxia’s phytosociological traits modified across the elevation gradient, suggesting a shift in morphological, physiological, biological, and biomass allocation that would allow this naturalized species to soon become invasive. If the invader cannot be removed and persists, careful management of soil nutrients and water features in farmed areas may be required to minimize reductions in production. It is worth mentioning, however, that the species’s rapid growth in the area may have benefitted the region’s economy and had ramifications for medicinal plant markets. However, its future invasive activity might counteract these benefits; thus, cautious control measures are needed. Integrated approaches that take into account the human communities may be needed. For example, farmers could be surveyed, and decisions could be made in collaboration with government agencies such as regional agriculture and livestock departments and local nongovernmental organizations, as suggested by [81]. In addition, assessments of the morphological, phenological, phytochemical, physiological, and reproductive biology of D. innoxia are essential for effective management [82]. Future invasions of such naturalized species might be avoided by conducting qualitative and quantitative monitoring using species inventories (seasonally) and phytosociological methodologies, as well as mapping using ground-based methods (through map overlays or GPS) and remotely sensed images (aerial photos, high-resolution multispectral digital data). To monitor and control such species from becoming invasive, investigators must build a plant detection network in the susceptible region and communicate with taxonomists, ecologists, and land managers. Furthermore, we urge that the beneficial and adverse characteristics of such species be examined in a large, systematic framework to avoid possible contradictions between their hazards and benefits, as indicated by [83].

Supplementary Materials

The following are available online at https://www.mdpi.com/article/10.3390/su141610214/s1, Table S1: Indices of phytosociological attributes for Thirty nine plant species in the three clusters of Datura innoxia dominated communities, Table S2: Axes summary, correlation and biplot scores of the of the environmental and climatic variables affecting the Datura innoxia communities.

Author Contributions

Conceptualization and writing original manuscript by K.A. and N.K. respectively; methodology and Formal analysis, R.U.; software and validation, A.G.; M.E.H.K. Performed formal analysis; visualization, by A.A.; funding acquisition, by D.A.J. All authors have read and agreed to the published version of the manuscript.

Funding

This research received no external funding.

Institutional Review Board Statement

Not applicable.

Informed Consent Statement

Not applicable.

Data Availability Statement

All the data of the present research is available in the manuscript or as Supplementary Material of the manuscript.

Acknowledgments

We acknowledge Ali Hazrat, Associate Professor in the Department of Botany, University of Malakand, for his assistance in plants species identification, along with Atta Ur Rahman, Muhammad Uzair, Tareef Ullah, and some local farmers who assisted greatly in the fieldwork.

Conflicts of Interest

The authors declare no conflict of interest.

References

  1. Cremene, C.; Groza, G.; Rakosy, L.; Schileyko, A.A.; Baur, A.; Erhardt, A.; Baur, B. Alterations of stepp like grasslands in Eastern Europe: A threat to regional biodiversity hotspots. Conserv. Biol. 2005, 19, 1606–1618. [Google Scholar] [CrossRef]
  2. Khan, N.; Bibi, K.; Ullah, R. Distribution pattern and ecological determinants of an invasive plant Parthenium hysterophorus L., in Malakand division of Pakistan. J. Mt. Sci. 2020, 17, 1670–1683. [Google Scholar] [CrossRef]
  3. Ullah, R.; Khan, N.; Rahman, A. Comparison of invaded and non-invaded sites: A case study of rough cocklebur (Xanthium strumarium L.), an alien invasive species. Appl. Ecol. Environ. Res. 2021, 19, 1533–1548. [Google Scholar] [CrossRef]
  4. Stohlgren, T.; Rejmánek, M. No universal scale-dependent impacts of invasive species on native plant species richness. Biol.L. Lett. 2014, 10, 2013093. [Google Scholar] [CrossRef]
  5. Stohlgren, T.J.; Barnett, D.T.; Jarnevich, C.S.; Flather, C.; Kartesz, J. The myth of plant species saturation. Ecol. Lett. 2008, 11, 313–322. [Google Scholar] [CrossRef]
  6. Pauchard, A.; Shea, K. Integrating the study of non-native plant invasions across spatial scales. Biol. Invasions 2006, 8, 399–413. [Google Scholar] [CrossRef]
  7. Powell, K.I.; Chase, J.M.; Knight, T.M. A synthesis of plant invasion effects on biodiversity across spatial scales. Am. J. Bot. 2011, 98, 539–548. [Google Scholar] [CrossRef]
  8. Price, E.P.F.; Spyreas, G.; Matthews, J.W. Biotic homogenization of regional wetland plant communities within short time-scales in the presence of an aggressive invader. J. Ecol. 2018, 106, 1180–1190. [Google Scholar] [CrossRef]
  9. Simberloff, D. The role of propagule pressure in biological invasions. Annual. Rev. Ecol. Evol. Syst. 2009, 40, 81–102. [Google Scholar] [CrossRef]
  10. Ullah, R.; Khan, N.; Ali, K. Which factor explains the life history of Xanthium strumarium L., an aggressive alien invasive plant species, along its altitudinal gradient? Plant Direct. 2022, 6, e375. [Google Scholar] [CrossRef]
  11. Mandal, G.; Joshi, S.P. The role of habitat types and soil physicochemical properties in the spread of a non-native shrub Lantana camara in the Doon valley, Western Himalaya, India. J. Environ. Geogh. 2014, 7, 31–42. [Google Scholar] [CrossRef]
  12. Chambers, D.C.; Perie, N.; de Blois, S. Challenges in modelling the abundance of 105 tree species in eastern North America using climate, edaphic, and topographic variables. For. Ecol. Manag. 2013, 291, 20–29. [Google Scholar] [CrossRef]
  13. Figueiredo, F.O.G.; Zuquim, G.; Tuomisto, H.; Moulatlet, G.M.; Balslev, H.; Costa, F.R.C. Beyond climate control on species range: The importance of soil data to predict the distribution of Amazonian plant species. J. Biogeogr. 2018, 45, 190–200. [Google Scholar] [CrossRef]
  14. Logan, J.A.; Regniere, J.; Powell, J.A. Assessing the impacts of global warming on forest pest dynamics. Front. Ecol. Environ. 2003, 1, 130–137. [Google Scholar] [CrossRef]
  15. Arroyo, M.T.K.; Marticorena, C. Patterns and Future Predictions. In Invasive Species in a Changing World; Springer: Berlin, Germany, 2000; p. 385. [Google Scholar]
  16. Mligo, C. Diversity and distribution pattern of riparian plant species in the Wami River system, Tanzania. J. Plant Ecol. 2017, 10, 259–270. [Google Scholar] [CrossRef]
  17. Shrestha, U.B.; Shrestha, B.B. Climate change amplifies plant invasion hotspots in Nepal. Divers. Distrib. 2019, 25, 1599–1612. [Google Scholar] [CrossRef]
  18. Ahmad, M.; Uniyal, S.K.; Batish, D.R.; Singh, H.P.; Jaryan, V.; Rathee, S.; Kohli, R.K. Patterns of plant communities along vertical gradient in Dhauladhar Mountains in lesser Himalayas in North-Western India. Sci. Total Environ. 2020, 716, 136919. [Google Scholar] [CrossRef]
  19. Begum, H.A.; Hamayun, M.; Shad, N.; Khan, W.; Ahmad, J.; Khan, M.E.H.; Jones, D.A.; Ali, K. Effects of UV radiation on germination, growth, chlorophyll content, and fresh and dry weights of Brassica rapa L. and Eruca sativa L. Sarhad. J. Agric. 2021, 37, 1016–1024. [Google Scholar] [CrossRef]
  20. Thuiller, W.; Richardson, D.M.; Pyšek, P.; Midgley, G.F.; Hughes, G.O.; Rouget, M. Niche-based modelling as a tool for predicting the risk of alien plant invasions at a global scale. Glob. Chang. Biol. 2005, 11, 2234–2250. [Google Scholar] [CrossRef]
  21. Dudley, S.A. Plasticity and the functional ecology of plants. In Phenotypic Plasticity: Functional and Conceptual Approaches; Oxford University Press: Oxford, UK, 2004; p. 2. [Google Scholar]
  22. Seastedt, T.R.; Oldfather, M.F. Climate Change, Ecosystem processes and biological diversity responses in high elevation communities. Climate 2021, 9, 87. [Google Scholar] [CrossRef]
  23. Kesarkar, P.; Khan, S. Ethnomedicinal plants used in the treatment of respiratory diseases around western Ghats region of Maharashtra, India. J. Glob. Biosci. 2021, 10, 8447–8457. [Google Scholar]
  24. Nayyar, M.S.; Hanif, M.A.; Mjaeed, M.I.; Ayub, M.A.; Rehman, R. Datura. In Medicinal Plants of South Asia; Elsevier: Amsterdam, The Netherlands, 2020; pp. 207–216. [Google Scholar]
  25. Setshogo, M.P. A review of some medicinal and or hallucinogenic Solanaceous plants of Botswana: The genus Datura L. Int. J. Appl. Res. Nat. Prod. 2015, 1, 15–23. [Google Scholar]
  26. Drake, L.R.; Lin, S.; Rayson, G.D.; Jackson, P.J. Chemical modification and metal binding studies of Datura innoxia. Environ. Sci. Technol. 1995, 30, 110–114. [Google Scholar] [CrossRef]
  27. Khan, F.K. Pakistan Geography Economy and People, 4th ed.; Oxford University Press: Islamabad, Pakistan, 2015. [Google Scholar]
  28. Dawood, M. Spatio-statistical analysis of temperature fluctuation using Mann–Kendall and Sen’s slope approach. Clim. Dyn. 2017, 48, 783–797. [Google Scholar]
  29. Ali, A.; Khan, T.A.; Ahmad, S. Analysis of climate data of Khyber Pakhtunkhwa, Pakistan. Int. Res. J. Eng. Technol. 2018, 5, 4266–4282. [Google Scholar]
  30. Deo, R.C.; Şahin, M. Application of the artificial neural network model for prediction of monthly standardized precipitation and evapotranspiration index using hydrometeorological parameters and climate indices in eastern Australia. Atmos. Res. 2015, 161, 65–81. [Google Scholar] [CrossRef]
  31. Ahmad, M.; Sharma, P.; Rathee, S.; Singh, H.P.; Batish, D.R.; Lone, G.R.; Kohli, R.K. Niche width analyses facilitate identification of high-risk endemic species at high altitudes in western Himalayas. Ecol. Indic. 2021, 126, 107653. [Google Scholar] [CrossRef]
  32. Morsdorf, F.; Mårell, A.; Koetz, B.; Cassagne, N.; Pimont, F.; Rigolot, E.; Allgöwer, B. Discrimination of vegetation strata in a multi-layered Mediterranean forest ecosystem using height and intensity information derived from airborne laser scanning. Remote Sens. Environ. 2010, 114, 1403–1415. [Google Scholar] [CrossRef]
  33. Curtis, J.T.; McIntosh, R.P. The interrelations of certain analytic and synthetic phytosociological characters. Ecology 1950, 31, 434–455. [Google Scholar] [CrossRef]
  34. Martínez-Falcón, A.P.; Zurita, G.A.; Ortega-Martínez, I.J.; Moreno, C.E. Populations and assemblages living on the edge: Dung beetles responses to forests-pasture ecotones. Peer J. 2018, 6, e6148. [Google Scholar] [CrossRef]
  35. Nasir, E.; Ali, S.I. (Eds.) Flora of West Pakistan; Fakhri Press: Karachi, Pakistan, 1972. [Google Scholar]
  36. Aeschimann, D.; Lauber, K.; Moser, D.M.; Theurillat, J.P. Flora Alpina: Atlas des 4.500 Plantes Vasculaires des Alpes Photographies en Couleurs de Konrad Lauber et Croquis d’André Michel; Belin Publisher: Paris, France, 2004. [Google Scholar]
  37. Maan, I.; Kaur, A.; Singh, H.P.; Batish, D.R.; Kohli, R.K. Exotic avenue plantations turning foe: Invasive potential, distribution and impact of Broussonetia papyrifera in Chandigarh, India. Urban For. Urban Green. 2021, 59, 127010. [Google Scholar] [CrossRef]
  38. Ullah, R.; Khan, N.; Ali, K.; Khan, M.E.H.; Jones, D.A. Screening of Xanthium strumarium (IAPS) Growing on Abandoned Habitats in Khyber Pakhtunkhwa, Pakistan: Perspectives for Phytoremediation. Appl. Sci. 2021, 11, 11704. [Google Scholar] [CrossRef]
  39. Reis, A.T.; Coelho, J.P.; Rucandio, I.; Davidson, C.M.; Duarte, A.C.; Pereira, E. Thermo-desorption: A valid tool for mercury speciation in soils and sediments? Geoderma 2015, 237, 98–104. [Google Scholar] [CrossRef]
  40. Nelson, D.W.; Sommers, L.E. Total carbon, organic carbon, and organic matter. In Methods of Soil Analysis: Part 3 Chemical Methods; Soil Science of America and American Society of Agronomy: Madison, WI, USA, 1996; Volume 5, pp. 961–1010. [Google Scholar]
  41. Yadav, R.L.; Tomar, S.S.; Sharma, U.C. Output: Input ratios and apparent balances of N, P and K inputs in a rice-wheat system in North-West India. Exp. Agric. 2002, 38, 457–468. [Google Scholar] [CrossRef]
  42. Saxton, K.E.; Rawls, W.; Romberger, J.S.; Papendick, R.I. Estimating generalized soil-water characteristics from texture. Soil Sci. Soc. Am. 1986, 50, 1031–1036. [Google Scholar] [CrossRef]
  43. Gangwar, D.P.; Baskar, M. Texture Determination of Soil by Hydrometer Method for Forensic Purpose; Central Forensic Science Laboratory: Chandigarh, India, 2019.
  44. Mligo, C. Anthropogenic disturbance on the vegetation in Makurunge woodland, Bagamoyo district, Tanzania. Tanzan. J. Sci. 2011, 37, 95–108. [Google Scholar]
  45. Leach, K.; Montgomery, W.I.; Reid, N. Modelling the influence of biotic factors on species distribution patterns. Ecol. Model. 2016, 337, 96–106. [Google Scholar] [CrossRef]
  46. Hailu, H. Analysis of vegetation phytosociological characteristics and soil physico-chemical conditions in Harishin Rangelands of Eastern Ethiopia. Land 2017, 6, 4. [Google Scholar] [CrossRef]
  47. McCune, B. Influence of noisy environmental data on canonical correspondence analysis. Ecology 1997, 78, 2617–2623. [Google Scholar] [CrossRef]
  48. Khan, N.; Ali, F.; Ali, K.; Shaukat, S. Composition, structure and regeneration dynamcis of Olea ferruginea Royle forests from Hindikush ranges of Pakistan. J. Mt. Sci. 2015, 12, 647–658. [Google Scholar]
  49. Ullah, R.; Khan, N.; Hewitt, N.; Ali, K.; Jones, D.A.; Khan, M.E.H. Invasive Species as Rivals: Invasive Potential and Distribution Pattern of Xanthium strumarium L. Sustainability 2022, 14, 7141. [Google Scholar] [CrossRef]
  50. Seifu, A.; Seboka, N.; Misganaw, M.; Bekele, T.; Merawi, E.; Ayenew, A.; Faris, G. Impact of invasive alien plant, Xanthium strumarium, on species diversity and composition of invaded plant communities in Borena Zone, Ethiopia. Biodivers. Int. J. 2017, 1, 00004. [Google Scholar] [CrossRef]
  51. Qureshi, H.; Anwar, T.; Arshad, M.; Osunkoya, O.O.; Adkins, S.W. Impacts of Xanthium strumarium L. invasion on vascular plant diversity in Pothwar Region (Pakistan). Ann. Di Bot. 2019, 9, 73–82. [Google Scholar]
  52. Iqbal, M.; Iram, A.; Liu, M.C.; Feng, Y.L. Competitive Approach of Invasive Cocklebur (Xanthium Strumarium) with Native Weed Species Diversity in Northeast China. PloS ONE 2020. [Google Scholar] [CrossRef]
  53. Qian, H.; Guo, Q. Linking biotic homogenization to habitat type, invasiveness and growth form of naturalized alien plants in North America. Divers. Distrib. 2010, 16, 119–125. [Google Scholar] [CrossRef]
  54. Tappeiner, J.; Zasada, J.; Ryan, P.; Newton, M. Salmonberry clonal and population structure: The basis for a persistent cover. Ecology 1991, 72, 609–618. [Google Scholar] [CrossRef]
  55. Timsina, B.; Shrestha, B.B.; Rokaya, M.B.; Münzbergová, Z. Impact of Parthenium hysterophorus L. invasion on plant species composition and soil properties of grassland communities in Nepal. Flora-Morphol. Distrib. Funct. Ecol. Plants 2011, 206, 233–240. [Google Scholar] [CrossRef]
  56. Khan, N.; Ullah, R.; Ali, K.; Jones, D.A.; Khan, M.E.H. Invasive Milk Thistle (Silybum marianum (L.) Gaertn.) Causes Habitat Homogenization and Affects the Spatial Distribution of Vegetation in the Semi-Arid Regions of Northern Pakistan. Agriculture 2022, 12, 687. [Google Scholar] [CrossRef]
  57. Dietz, H.; Edwards, P.J. Recognition that causal processes change during plant invasion helps explain conflicts in evidence. Ecology 2006, 87, 1359–1367. [Google Scholar] [CrossRef]
  58. Polo, A.; Cappitelli, F.; Villa, F.; Pinzari, F. Biological invasion in the indoor environment: The spread of Eurotium halophilicum on library materials. Int. Biodeterior. Biodegrad. 2017, 118, 34–44. [Google Scholar] [CrossRef]
  59. Geiger, E.L.; McPherson, G.R. Response of semi-desert grasslands invaded by non-native grasses to altered disturbance regimes. J. Biogeogr. 2005, 32, 895–902. [Google Scholar] [CrossRef]
  60. Chhogyel, N.; Kumar, L.; Bajgai, Y. Invasion status and impacts of parthenium weed (Parthenium hysterophorus) in West-Central region of Bhutan. Biol. Invasions 2021, 23, 2763–2779. [Google Scholar] [CrossRef]
  61. Sjödin, N.E.; Bengtsson, J.; Ekbom, B. The influence of grazing intensity and landscape composition on the diversity and abundance of flower-visiting insects. J. Appl. Ecol. 2008, 45, 763–772. [Google Scholar] [CrossRef]
  62. Hejda, M.; Pyšek, P. What is the impact of Impatiens glandulifera on species diversity of invaded riparian vegetation? Biol. Conserv. 2006, 132, 143–152. [Google Scholar] [CrossRef]
  63. Oduor, A.M.; Long, H.; Fandohan, A.B.; Liu, J.; Yu, X. An invasive plant provides refuge to native plant species in an intensely grazed ecosystem. Biol. Invasions 2018, 20, 2745–2751. [Google Scholar] [CrossRef]
  64. Eaton, W.D.; Farrell, R.E. Catabolic and genetic microbial indices, and levels of nitrate, ammonium and organic carbon in soil from the black locust (Robinia pseudo-acacia) and tulip poplar (Liriodendron tulipifera) trees in a Pennsylvania forest. Biol. Fertil. Soils 2004, 39, 209–214. [Google Scholar] [CrossRef]
  65. Dong, L.J.; He, W.M. The relative contributions of climate, soil, diversity and interactions to leaf trait variation and spectrum of invasive Solidago canadensis. BMC Ecol. 2019, 19, 1–9. [Google Scholar] [CrossRef]
  66. Sardans, J.; Alonso, R.; Janssens, I.A.; Carnicer, J.; Vereseglou, S.; Rillig, M.C.; Penuelas, J. Foliar and soil concentrations and stoichiometry of nitrogen and phosphorous across E uropean Pinus sylvestris forests: Relationships with climate, N deposition and tree growth. Funct. Ecol. 2016, 30, 676–689. [Google Scholar] [CrossRef]
  67. Vasquez, E.; Sheley, R.; Svejcar, T. Creating invasion resistant soils via nitrogen management. Invasive Plant Sci. Manag. 2008, 1, 304–314. [Google Scholar] [CrossRef]
  68. Dassonville, N.; Vanderhoeven, S.; Vanparys, V.; Hayez, M.; Gruber, W.; Meerts, P. Impacts of alien invasive plants on soil nutrients are correlated with initial site conditions in NW Europe. Oecologia 2008, 157, 131–140. [Google Scholar] [CrossRef]
  69. Cowie, B.W.; Strathie, L.W.; Goodall, J.M.; Venter, N.; Witkowski, E.T.; Byrne, M.J. Does host plant quality constrain the performance of the Parthenium beetle Zygogramma bicolorata? Biol. Control 2019, 139, 104078. [Google Scholar] [CrossRef]
  70. Rathee, S.; Ahmad, M.; Sharma, P.; Singh, H.P.; Batish, D.R.; Kaur, S.; Kohli, R.K. Biomass allocation and phenotypic plasticity are key elements of successful invasion of Parthenium hysterophorus at high elevation. Environ. Exp. Bot. 2021, 184, 104392. [Google Scholar] [CrossRef]
  71. Hobbs, R.J.; Huenneke, L.F. Disturbance, diversity, and invasion: Implications for conservation. Conserv. Biol. 1992, 6, 324–337. [Google Scholar] [CrossRef]
  72. Hester, A.J.; Hobbs, R.J. Influence of fire and soil nutrients on native and non-native annuals at remnant vegetation edges in the Western Australian wheatbelt. J. Veg. Sci. 1992, 3, 101–108. [Google Scholar] [CrossRef]
  73. Osunkoya, O.O.; Akinsanmi, O.A.; Lim, L.S.; Perrett, C.; Callander, J.; Dhileepan, K. Parthenium hysterophorus L. (Asteraceae) invasion had limited impact on major soil nutrients and enzyme activity: Is the null effect real or reflects data insensitivity? Plant Soil 2017, 420, 177–194. [Google Scholar] [CrossRef]
  74. Shea, J.M.; Wagnon, P.; Immerzeel, W.W.; Biron, R.; Brun, F.; Pellicciotti, F. A comparative high-altitude meteorological analysis from three catchments in the Nepalese Himalaya. Int. J. Water Resour. Dev. 2015, 31, 174–200. [Google Scholar] [CrossRef]
  75. Hou, Q.Q.; Chen, B.M.; Peng, S.L.; Chen, L.Y. Effects of extreme temperature on seedling establishment of non-native invasive plants. Biol. Invasions 2014, 16, 2049–2061. [Google Scholar] [CrossRef]
  76. Kadam, R.M.; Dhavle, S.D.; Allapure, R.B.; Jadhav, B.S. Evolution of phenological plasticity in Parthenium hysterophorus in response to air pollution stress and unordered environmental variation. Asian J. Environ. Sci. 2009, 3, 131–133. [Google Scholar]
  77. Eskelinen, A.; Harrison, S. Exotic plant invasions under enhanced rainfall are constrained by soil nutrients and competition. Ecology 2014, 95, 682–692. [Google Scholar] [CrossRef]
  78. Datta, A.; Kühn, I.; Ahmad, M.; Michalski, S.; Auge, H. Processes affecting altitudinal distribution of invasive Ageratina adenophora in western Himalaya: The role of local adaptation and the importance of different life-cycle stages. PloS ONE 2017, 12, e0187708. [Google Scholar]
  79. Gonzalo Turpin, H.; Hazard, L. Local adaptation occurs along altitudinal gradient despite the existence of gene flow in the alpine plant species Festuca eskia. J. Ecol. 2009, 97, 742–751. [Google Scholar] [CrossRef]
  80. Vasseur, F.; Exposito-Alonso, M.; Ayala-Garay, O.J.; Wang, G.; Enquist, B.J.; Vile, D.; Weigel, D. Adaptive diversification of growth allometry in the plant Arabidopsis thaliana. Proc. Natl. Acad. Sci. USA 2018, 115, 3416–3421. [Google Scholar] [CrossRef] [PubMed]
  81. Kapler, E.J.; Thompson, J.R.; Widrlechner, M.P. Assessing stakeholder perspectives on invasive plants to inform risk analysis. Invasive Plant Sci. Manag. 2012, 5, 194–208. [Google Scholar] [CrossRef]
  82. Raghubanshi, A.S.; Rai, L.C.; Gaur, J.P.; Singh, J.S. Invasive Alien species and biodiversity in India. Curr. Sci. 2005, 88, 539–540. [Google Scholar]
  83. Dickie, I.A.; Bennett, B.M.; Burrows, L.E.; Nuñez, M.A.; Peltzer, D.A.; Porté, A.; Richardson, D.M.; Rejmánek, M.; Rundel, P.W.; van Wilgen, B.W. Conflicting values: Ecosystem services and invasive tree management. Biol. Invasions 2014, 16, 705–719. [Google Scholar] [CrossRef]
Figure 1. Map of the study area where sampling was conducted showing the elevation distribution of the sites in Khyber Pakhtunkhwa, Pakistan.
Sustainability 14 10214 g001
Figure 2. Sketch presenting sampling design for phytosociological attributes.
Sustainability 14 10214 g002
Figure 3. Life form, status, and habitat distributions of the plant species found in association with Datura innoxia in northern Pakistan.
Sustainability 14 10214 g003
Figure 4. Ward’s agglomerative cluster dendrogram (WACD) of vegetation stands dominated by Datura innoxia in northern Pakistan.
Sustainability 14 10214 g004
Figure 5. CCA biplot showing the species distribution and important environmental and climatic factors effecting Datura innoxia communities.
Sustainability 14 10214 g005
Table 1. Importance Value Indices (IVIs) of plant species distributed in three major elevation-based vegetation groups.
Botanical NamesAcronymsGroup IGroup IIGroup III
Datura innoxia Mill.Dain45.48 ± 2.4541.28 ± 3.9834.33 ± 2.16
Ajuga bracteosa Wall. ex Benth.Ajbr*1.82 ± 1.82*
Alternanthera pungens KunthAlpg**0.53 ± 0.53
Amaranthus viridis L.Amvr6.96 ± 0.8**
Artemisia capillaris Thunb.Arcp*4.70 ± 2.49*
Calendula arvensis L.Clar*1.40 ± 1.406.14 ± 2.90
Calotropis procera (Aiton) W.T.AitonClpr**2.55 ± 1.28
Cannabis sativa L.Cast12.11 ± 2.5*25.24 ± 1.7
Carthamus oxycantha M.Bieb.Crox**3.09 ± 1.74
Centaurea cyanus L.Cent0.94 ± 0.94**
Chenopodium album L.Chal9.76 ± 2.463.41 ± 2.050.36 ± 0.36
Chrozophora tinctoria (L.) Raf.Chtn2.98 ± 1.5**
Cirsium arvense (L.) Scop.Crar**0.64 ± 0.64
Cornus macrophylla Wall.Coma**0.28 ± 0.28
Cynodon dactylon (L.) Pers.Cydy1.94 ± 1.07**
Dodonaea viscosa Jacq.Dovc**0.48 ± 0.48
Eryngium caeruleum M.Bieb.Erco0.60 ± 0.604.35 ± 4.35*
Gymnosporia royleana Wall. ex M.A.LawsonGyry*2.41 ± 2.41*
Heliotropium indicum L.Hein0.6 ± 0.6**
Medicago denticulata Willd.Medn*13.92 ± 5.341.13 ± 1.13
Mirabilis jalapa L.Mijp0.61 ± 0.614.18 ± 4.180.82 ± 0.82
Morus alba L.Mral*4.99 ± 3.42*
Origanum vulgare L.Ogvg*3.84 ± 1.94*
Otostegia limbata (Benth.) Bioss.Oslm*4.61 ± 4.61*
Oxalis corniculata L.Oxcr*1.59 ± 1.592.86 ± 2.02
Parthenium hysterophorus L.Pahy13.35 ± 2*1.57 ± 1.14
Persicaria maculosa GrayPrmu0.96 ± 0.96**
Ricinus communis L.Ricm6.09 ± 1.58*4.43 ± 1.41
Rumex hastatus D. DonRmhs**0.94 ± 0.63
Salvia moorcroftiana Wall. ex Benth.Slmc**0.82 ± 0.55
Silybum marianum (L.) Geartn.Simr0.79 ± 0.79*0.79 ± 0.79
Solanum nigrum L.Song*1.02 ± 1.021.06 ± 0.71
Trianthema portulacastrum L.Trpr1.08 ± 1.08*-
Tribulus terrestris L.Trtr1.73 ± 1.73**
Verbascum thapsus L.Vrth**0.340.34
Verbesina encelioides (Cav.) Benth. and Hook.f. ex A.GrayHean*0.97 ± 0.970.28 ± 0.28
Xanthium strumarium L.Xnst**10.44 ± 2.7
Zanthoxylum armatum DC.Xnar*5.46 ± 5.46*
* represents the absence of species in a particular group.
Table 2. Species diversity indices and biotic factors associated with D. innoxia communities in Khyber Pakhtunkhwa, Pakistan.
VariableGroup IGroup IIGroup IIIF-Valuep-Value
Species richness (S’)161622
Shannon–Wiener index (H’) 1.43 ± 0.07 a1.46 ± 0.17 a1.81 ± 0.05 b3.310.05
Pielou’s evenness index (E)0.76 ± 0.03 a0.70 ± 0.04 a0.79 ± 0.02 a1.570.23
Erosion intensity (EI)13.57 ± 0.53 a20 ± 1.45 a45.43 ± 1.42 b16.160.00002
Cultivated fields (CF)55 ± 1.37 a31.56 ± 0.95 b20.54 ± 0.76 b37.303.96 × 107
Grazing intensity (GI)18.57 ± 0.34 a38.42 ± 1.54 b79.43 ± 0.67 c174.271.66 × 1012
Traffic density (TD)64.28 ± 0.87 a48.33 ± 3.65 a31.82 ± 1.11 b20.971.98 × 105
Note: Different alphabetic superscript represents significant difference at p < 0.05.
Table 3. Environmental variables associated with Datura innoxia vegetation groups based on elevation as separated by Ward’s clustering algorithm. The data comprise the means and standard errors of factors and were compared using a one-way ANOVA.
ParameterGroupsF-Valuep-Value
IIIIII
Elev.427 ± 73.9 a798.9 ± 31 b1151.66 ± 34 c10.030.006
AA157.14 ± 31177.18 ± 34121.66 ± 86.20.320.73
CL%29.66 ± 4.921.37 ± 2.0520.88 ± 3.91.880.18
SL%28.67 ± 3 a48.28 ± 5.7 b53.46 ± 14 b3.420.054
SN%41.66 ± 5.430.34 ± 4.925.65 ± 10.50.120.88
pH (1:5)6.7 ± 0.16.75 ± 0.16.7 ± 0.20.070.92
OM%1.71 ± 0.24 a1.16 ± 0.23 a0.51 ± 0.11 b2.930.079
OC%0.95 ± 0.19 a0.67 ± 0.13 a0.24 ± 0.1 b3.610.05
L%7.57 ± 0.89.27 ± 1.511.28 ± 1.60.930.41
N0.081 ± 0.019 a0.03 ± 0.009 b0.24 ± 0.1 c8.700.00
P4.99 ± 0.464.85 ± 0.44.70 ± 0.830.110.90
K88.15 ± 3.3110.54 ± 13111.66 ± 170.720.50
EC375.11 ± 43292.45 ± 23388.66 ± 782.350.12
WP0.175 ± 0.020.13 ± 0.0080.13 ± 0.010.720.50
FC0.30 ± 0.020.28 ± 0.010.28 ± 0.0052.350.12
BD1.36 ± 0.031.38 ± 0.011.37 ± 0.010.190.83
SP0.48 ± 0.030.47 ± 0.0050.47 ± 0.0060.190.83
AW0.12 ± 0.006 a0.15 ± 0.005 b0.15 ± 0.01 b3.240.06
MYT19.27 ± 0.117.63 ± 0.2514.9 ± 0.6121.551.66 × 105
AYH66.23 ± 0.2154.3 ± 1.3449.64 ± 0.6419.183.45 × 105
DLH12.05 ± 0.00211.43 ± 0.2111.371 ± 0.0228.032.9 × 106
Note: Elev. (elevation); AA (aspect angle); CL% (clay percentage); SL% (silt percentage); SN% (sand percentage); pH (1:5) (pH value determined in soil:water suspension); OM (organic matter); OC (organic carbon); L % (Lime percentage); N (nitrogen); P (phosphorus); K (potassium); EC (electrical conductivity); WP (wilting point); FC (field capacity); BD (bulk density); SP (saturation point); AW (available water); MYT (mean yearly temperature); AYH (annual yearly humidity); DLH (day length in hours). Different alphabetic superscript represents significant difference at p < 0.05.
Publisher’s Note: MDPI stays neutral with regard to jurisdictional claims in published maps and institutional affiliations.

