Article

Optimization of Pervious Geopolymer Concrete Using TOPSIS-Based Taguchi Method

1
Department of Civil and Environmental Engineering, UAE University, Al Ain P.O. Box 15551, United Arab Emirates
2
Department of Civil Engineering, Universiti Malaya, Kuala Lumpur 50603, Malaysia
*
Author to whom correspondence should be addressed.
Sustainability 2022, 14(14), 8767; https://doi.org/10.3390/su14148767
Submission received: 22 June 2022 / Revised: 15 July 2022 / Accepted: 16 July 2022 / Published: 18 July 2022
(This article belongs to the Special Issue High Performance and Advanced Construction Materials)

Abstract

:
This paper evaluates the effect of mix design parameters on the mechanical, hydraulic, and durability properties of pervious geopolymer concrete (PGC) made with a 3:1 blend of granulated blast furnace slag (GBFS) and fly ash (FA). A total of nine PGC mixtures were designed using the Taguchi method, considering four factors, each at three levels, namely, the binder content, dune sand addition, alkaline-activator solution-to-binder ratio (AAS/B), and sodium hydroxide (SH) molarity. The quality criteria were the compressive strength, permeability, and abrasion resistance. The Taguchi and TOPSIS methods were adopted to determine the signal-to-noise (S/N) ratios and to optimize the mixture proportions for superior performance. The optimum mix for the scenarios with a compressive strength and abrasion resistance at the highest weights was composed of a binder content of 500 kg/m3, dune sand addition of 20%, AAS/B of 0.60, and SH molarity of 12 M. Meanwhile, the optimum mix for the permeability-dominant scenario included a 400 kg/m3 of binder content, 0% of dune sand addition, 0.60 of AAS/B, and 12 M of SH molarity. For a balanced performance scenario (i.e., equal weights for the responses), the optimum mix was similar to the permeability scenario with the exception of a 10% dune sand addition. An ANOVA showed that the binder content and dune sand addition had the highest contribution toward all the quality criteria. Multivariable regression models were established to predict the performance of the PGC using the mix design factors. Experimental research findings serve as a guide for optimizing the production of PGC with a superior performance while conducting minimal experiments.

1. Introduction

For the past few decades, the demand for cement has considerably increased to establish new infrastructure and sustain constant growth in the global population. The projected increase is estimated to reach up to 23% by 2050, leading to numerous environmental and economic concerns [1,2]. These concerns include greenhouse gas emissions, as the production of cement contributes to 8–10% of the global carbon dioxide (CO2) footprint and the consumption of nearly 1.6 tons of natural resources per ton of cement produced [1,3]. Thus, there is a need to lessen the utilization of cement in concrete by identifying alternative sustainable binders that reduce the CO2 footprint and replenish natural resources.
Other global problems involve the currently impervious concrete pavement systems. These systems prevent water and air percolation [4]. The impervious nature of these surfaces also significantly affects environmental processes, including stormwater runoff and urban heat islands [5]. Meanwhile, the harmful disposal of industrial wastes in landfills poses environmental distress [6]. To improve the sustainable development of pavements, the environmental concerns induced by the production of cement, the use of impervious pavements, and the disposal of industrial by-products should be addressed and mitigated. One technique involves the incorporation of supplementary cementitious materials (SCMs) obtained as waste materials from various industries in pervious concrete (PC). This system (i.e., PC) is regarded as a sustainable urban drainage system (SUDS) that promises to alleviate said environmental challenges and promote the environmental sustainability of cities, by improving the percolation of air and water, mitigating CO2 emissions and the consumption of natural resources, and beneficially recycling industrial wastes [4,5,7].
PC is a gap-graded concrete with zero slump and interconnected pores, allowing water to infiltrate and be collected as groundwater [8,9,10]. In addition to the evaluation of its strength properties, as in conventional concrete, the performance of PC is assessed through its hydraulic properties. Particular PC features include its pore sizes of 2–8 mm, a high volume of pores ranging from 15–30%, and a permeability of 2–6 mm/s [7]. Due to its porous nature, its mechanical performance is inferior to conventional concrete, with compressive strength ranging between 2 to 28 MPa, suitable for low-to-medium traffic pavement [9]. This system, i.e., PC, is regarded as the best practice for managing stormwater runoff [11,12]. Other benefits linked to the use of PC are noise reduction from tire-surface interaction, improved skid resistance, the protection of native ecosystems, and the recharging of groundwater [9,12].
The current literature converges on the notion that industrial waste materials can be incorporated in PC as a replacement to cement to enhance its sustainability [6,13]. Common materials used as SCMs include silica fume, fly ash (FA), granulated blast furnace slag (GBFS), and metakaolin, among others. The use of SCMs, such as fly ash and silica fume, also reduce the corrosion rate of steel rebar and prolong the service life of concrete structures [13]. In fact, the utilization of such waste materials in PC production promises to reduce cement consumption and recycle these wastes rather than disposing of them in stockpiles or landfills [14]. The complete replacement of cement with alkali-activated binders, either as single, binary, or ternary combinations of SCMs, has also shown promising results [15,16]. Indeed, with its superior performance, researchers have shown great interest in utilizing alkali-activated binders to produce an alternative construction material known as geopolymer [1,17].
Geopolymers are formed by activating the aluminosilicate precursors such as FA, GBFS, or other materials with alkaline solutions [1,17]. This causes the precipitation of three-dimensional polymeric Si-O-Al rigid bonds. Geopolymer materials have been advocated as a sustainable replacement for cementitious binders in concrete, as they can be formulated with considerably less CO2 emissions compared to ordinary Portland cement [17,18,19]. Even though PC is mainly made with cement, several studies have reported the integration of geopolymers in PC [20,21]. The results showed that fly ash-based geopolymers possessed high early strength, reduced shrinkage, and a good resistance to sulfate attack [22,23]. Additionally, pervious geopolymer concrete (PGC) made with FA or GBFS displayed superior strength and durability responses compared to its cement-based counterparts [23,24,25,26,27]. When cured at 60 °C, the PGC produced with GBFS and FA exhibited an improved compressive strength, signifying an increased polymerization rate at higher curing temperatures [28]; however, this practice is not feasible on-site. In PGC made with a blended geopolymer binder of GBFS and FA, a higher content of GBFS yielded higher strength responses. Indeed, respective increases of 19, 49, and 47% in compressive, tensile, and flexural strengths were reported, respectively, when the GBFS content increased from 450 to 490 kg/m3 [29]. Accordingly, PGC is considered a promising material in concrete industries, yet further studies are needed to explore the effect of mixture design factors on the strength, durability, and hydraulic properties of PGC.
The production of PGC highly depends on predefining factors that affect its strength, permeability, and durability responses. Several factors augment the complexity of the design, including the curing conditions, composition of the raw materials, soluble silicate content, and the activation solution and its alkalinity. As such, mixes become cumbersome and practically inconclusive without an excessive trial-and-error analysis [19]; thus, extensive experiments are needed to deduce the optimum mix while satisfying the desired performance [30]. Optimization techniques can be employed based on the desired performances or criteria to overcome such complex processes and excessive trial mixes and deduce the desired optimum mix using a limited number of experiments [31]. Some of the optimization techniques used in engineering are the Taguchi and TOPSIS (Technique for Order Preference by Similarity to Ideal Solution) methods. Dr. Taguchi developed the Taguchi method based on orthogonal arrays in the factorial technique to optimize the experimental mixtures, rationalizing multiple process variables for distinct factors and levels while reducing the uncontrolled responses (i.e., parameters) [32,33]. Due to the lack of flexibility in optimizing several parameters simultaneously using the Taguchi method, the TOPSIS method was further developed to integrate various parameters at once, obtaining a single substantive optimum mix [34]. Nevertheless, there are no studies on optimizing the mix proportions of PGC for specific desired performances using the Taguchi and TOPSIS methods.
This study evaluates the effect of mix design parameters on the performance of sustainable cement-free pervious geopolymer concrete (PGC) derived from waste materials, while also optimizing the mixture proportions for superior performance. The experiments were designed using the Taguchi method, whereby the PGC mixes were proportioned considering various factors, including the binder content, dune sand addition, the ratio of alkaline activator solution-to-binder (AAS/B), and sodium hydroxide (SH) solution molarity. The optimization process was carried out using the TOPSIS method for different performance criteria that represented the mechanical and hydraulic properties and durability of PGC, comprising the compressive strength, permeability, and abrasion resistance, respectively. Multivariate regressions were also developed to predict the properties of the so-produced PGC. These findings can be particularly interesting to engineers that seek to better understand pervious geopolymer concrete, thereby promoting their adoption by the construction industry.

2. Materials and Methods

2.1. Materials

Class F FA [35] and GBFS were locally sourced for use as the precursor binding agents. Their physical and chemical characteristics are presented in Table 1, while their mineralogy and morphology can be found elsewhere [36]. Dune sand and crushed dolomitic limestone were employed as the fine and coarse aggregates, respectively. Their respective gradations varied from 0 to 4 mm and 4 to 10 mm, conforming to the ASTM C33 requirements [37]. The respective dry rodded density, specific gravity, surface area, and fineness modulus of the dune sand and crushed limestone were 1660/1663 kg/m3, 2.77/2.82, 141.5/2.49 cm2/g, and 1.45/6.82. The sodium silicate (SS) and sodium hydroxide (SH) solutions were blended to form the alkaline activator solution (AAS). The Grade N SS solution had a composition of H2O:SiO2:Na2O of 6.2:2.5:1.0, by mass. SH solutions, with different molarities of 8, 10, and 12 M, were obtained by dissolving 97% SH flakes in tap water.

2.2. Development of Pervious Concrete Mixes

The PGC mixtures were formulated following the Taguchi method. Based on previous studies on geopolymer concrete, the performance was mainly impacted by four factors, including the binder content, dune sand addition, AAS/B, and SH molarity [38,39,40]. The impact of the factors on the performance of the PGC was evaluated through three levels. Table 2 summarizes the factors with their corresponding levels. A 3:1 blend of GBFS and FA was considered, as this blend showed superior properties compared to others [41,42]. The binder content represented the amount of binding material (i.e., GBFS and FA) in the PGC mix and ranged between 400 and 500 kg/m3. Dune sand was added to the mix in replacement of the coarse aggregates to study its effect on the properties of PGC. It ranged between 0 and 20%, by mass of the total aggregate. Furthermore, the AAS/B represented the quantity of solution added to the mix with respect to the binder content, ranging from 0.5 to 0.6. The SH solution molarity was the last factor considered in the design phase, ranging from 8 to 12 M. The suggested levels were based on typical values adopted in previous work on geopolymer concrete and the ACI 522R-10 guide on pervious concrete [43,44,45]. The ratio of SS-to-SH was fixed to 1.5, by mass, as this mix design parameter was found to have a limited impact on the properties of slag-fly ash geopolymer concrete [28]. Accordingly, an L9 orthogonal array consisting of four factors, each at three levels, was developed, as shown in Table 3. If the selected approach were a factorial design, the mixes required to attain the optimum would have been 81 (34). This underlines the importance of utilizing the Taguchi method for designing the mixes and minimizing the experimental work.

2.3. Sample Preparation

The PGC mixtures were prepared and cast at ambient temperature and a relative humidity of 24 ± 2 °C and 50 ± 5%, respectively. Twenty-four hours before the concrete mixing, the AAS was prepared to ensure the dissipation of heat generated from the chemical reaction between the SH and SS solutions. The mixing sequence consisted of blending the dry components (i.e., crushed limestone, dune sand, and binder) in a mixer for 3 min, followed by the gradual addition of the AAS and further mixing for another 3 min. The obtained fresh concrete was subsequently placed into 100 mm cubic and 100 mm × 200 mm (diameter × height) cylindrical molds to assess the mechanical, hydraulic, and durability properties. The specimens were cast into 2 layers, compacted manually, sealed with plastic wrap, and cured under the same conditions until the testing time. A representative hardened cube sample is shown in Figure 1a.

2.4. Test Methods

The 7-day cube compressive strength (fcu) was determined using 100 mm cubes, as per BS EN-12390-3 [46]. This was defined as the ultimate compressive strength of the cubic samples tested using a Wykeham Farrance compression machine with a loading capacity up to 2000 kN and at a loading rate of 2 kN/s, as shown in Figure 1b. Three replicate samples were tested for each mix to compute the average fcu value. The preliminary test results showed limited change in the strength between 7 and 28 days; therefore, the analysis was carried out on 7-day fcu only. Other past work had also implemented this approach [47,48,49].
The permeability of the PGC was evaluated using the falling head permeability test, as per the recommendation of ACI 522R-10 [45]. The setup is shown in Figure 1c. The 7-day cylindrical sample with a cross-sectional area (A) was positioned in a closed container while its sides were coated and sealed with an epoxy mortar to avoid water leakage. The specimen was subjected to axial water flow from the top. Once the water valve was opened, the time (t) needed for the water to flow from the initial to the final head (h) was recorded. Hence, the permeability coefficient (k) was determined using Equation (1):
k = Q L t A h
where k is the coefficient of permeability, Q is the discharge of water into the collection unit, t is the time elapsed (s), L is the top length of the specimen, A is the top area of the specimen, and h is the applied pressure head (m).
The mass loss of the 7-day PGC due to abrasive forces was determined using a Los Angeles abrasion machine, as per ASTM C131 [51]. A Utest UTA-0602A Los Angeles abrasion machine consisted of a rolled steel drum that was rotated by a speed reducer driven by an electric motor at a speed of 32 rpm. The machine was equipped with an automatic counter, which can be preset to the required number of revolutions of the drum or the total working time, as shown in Figure 1d. The mass of the samples was measured prior to testing (W1) and after 500 revolutions (W2). Hence, the abrasion resistance was calculated using Equation (2):
Abrasion   resistance   % = W 2 W 1   ×   100 %

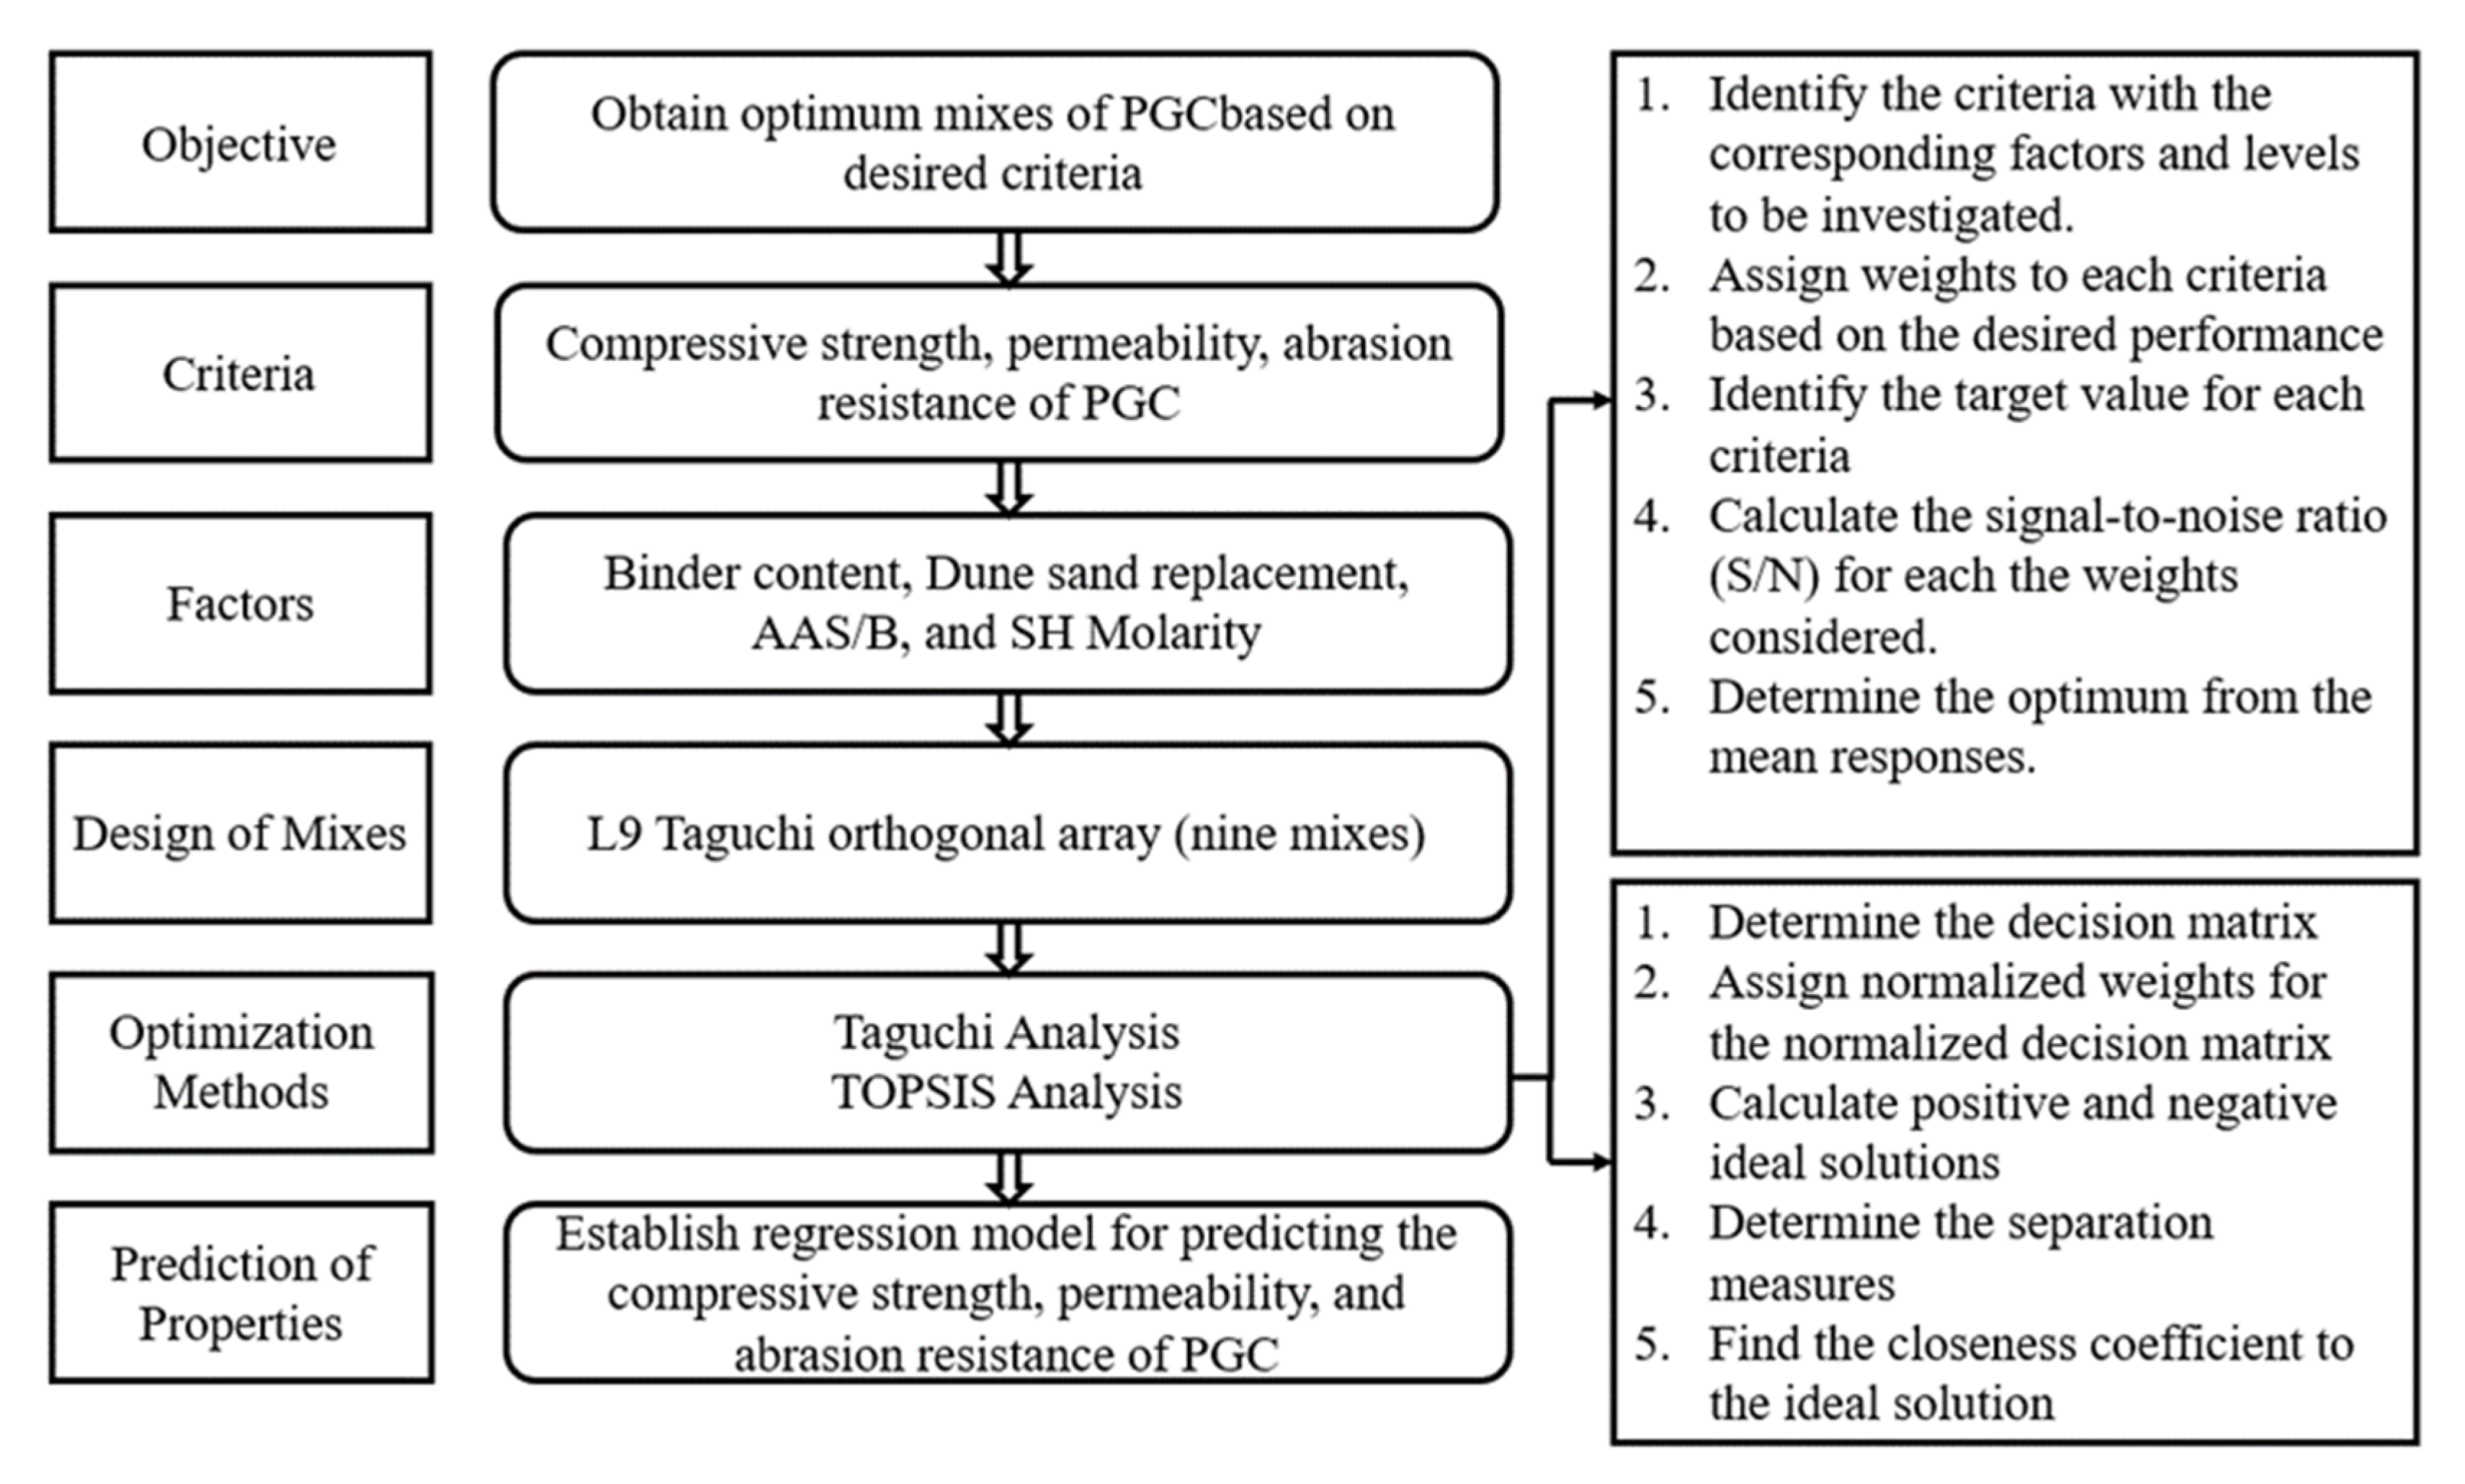
2.5. Framework for the Selection of Optimum PGC Mixes

The developed framework comprised three stages (Figure 2). The first stage aimed to design the PGC mixtures by considering various factors and subsequent levels while limiting the number of experiments and understanding the effect of the design factors. The Taguchi and TOPSIS methods were employed in the second stage to find the optimum mix proportions, considering single and multiple performance criteria, respectively. The final phase included establishing regression models to predict the properties of the PGC.

2.5.1. Taguchi Analysis

The Taguchi method limits the number of experiments using an orthogonal array based on Gauss’s quadratic function [34,52]. This method entails considering the desired property with factors and corresponding levels and evaluating it using a signal-to-noise ratio (S/N) [33]. Optimization occurs when there is variation between the desired response value and noise factors with the required result. The S/N values are calculated using the target parameter (i.e., response) optimization characteristic, namely “larger is better,” “smaller is better,” and “nominal is better”, as shown in Equations (3)–(5), respectively. “Larger is better” signifies the maximization of the response, while “smaller is better” means that the response is minimized. Meanwhile, in the “nominal is better” characteristic, the standard deviation of the results is used to determine the target value [52].
The analysis was carried out using the results of the considered properties obtained from the nine experimental mixes. The S/N ratio of “larger is better” was chosen for all properties, i.e., compressive strength, permeability, and abrasion resistance, as they should be maximized in pervious concrete applications:
S / N S = 10   ×   log 10 1 n i = 1 n Y i 2   ( Smaller   is   better )
S / N L = 10   ×   log 10 1 n i = 1 n 1 Y i 2     ( Larger   is   better )
S / N N = 10   ×   log 10 1 n i = 1 n ( Y i Y o ) 2     ( Nominal   is   better )
where S/N denotes the signal-to-noise ratio, n represents the number of experiments, Yi is the optimized response, and Y0 characterizes the response mean.

2.5.2. TOPSIS Analysis

The Taguchi method of analysis optimizes the levels of factors using the calculated S/N ratios for a single property or response; however, to optimize the mixture proportions for multiple properties simultaneously, a TOPSIS-based Taguchi analysis was employed. Hwang and Yoon [53] developed the TOPSIS method that examines the distance between the target responses and ideal positive and negative solutions. The TOPSIS optimization process was carried out as follows:
  • The decision matrix was normalized to develop a comparison within the results of the different criteria. The S/N ratios obtained from the Taguchi method were utilized in the process, as per Equation (6):
    r i j = a i j i = 1 m a i j 2
    where aij is the S/N ratio for a performance criterion (response), and rij denotes the normalized vector of the aij vector.
  • After normalization, the weights of the performance criteria were assigned relevant to their importance. Different scenarios could be developed accordingly. The highest weight was given to the most desired or significant criteria to the user, and equal weights were assigned when the criteria were equally important to the user. A weighted normalized matrix was obtained by multiplying the normalized matrix values by the corresponding assigned weights.
  • Furthermore, the maximum and minimum weighted normalized matrices were allotted as the positive (vj+) and negative (vj) ideal solutions, respectively, and calculated as per Equations (7) and (8):
    v j + = max v i j | j J , min v i j | j J
    v j = min v i j | j J , max v i j | j J
  • Respective separation measures from the ideal solutions, S+ and S, were further obtained using Equations (9) and (10):
    S + = j = 1 n v i j v j + 2
    S = j = 1 n v i j v j 2
  • The optimal mix was then deduced from the ranking score or closeness coefficient (Ci) obtained using Equation (11). The values of Ci for each scenario, ranging from 0 to 1, were then inputted as Taguchi responses. Using the “larger-is-better” characteristic, the Taguchi method analysis was performed to determine the S/N ratios, whereby the maximum S/N ratio for each level corresponded to the optimum mix:
    C i = S S + + S

3. Results and Discussion

3.1. Properties of PGC

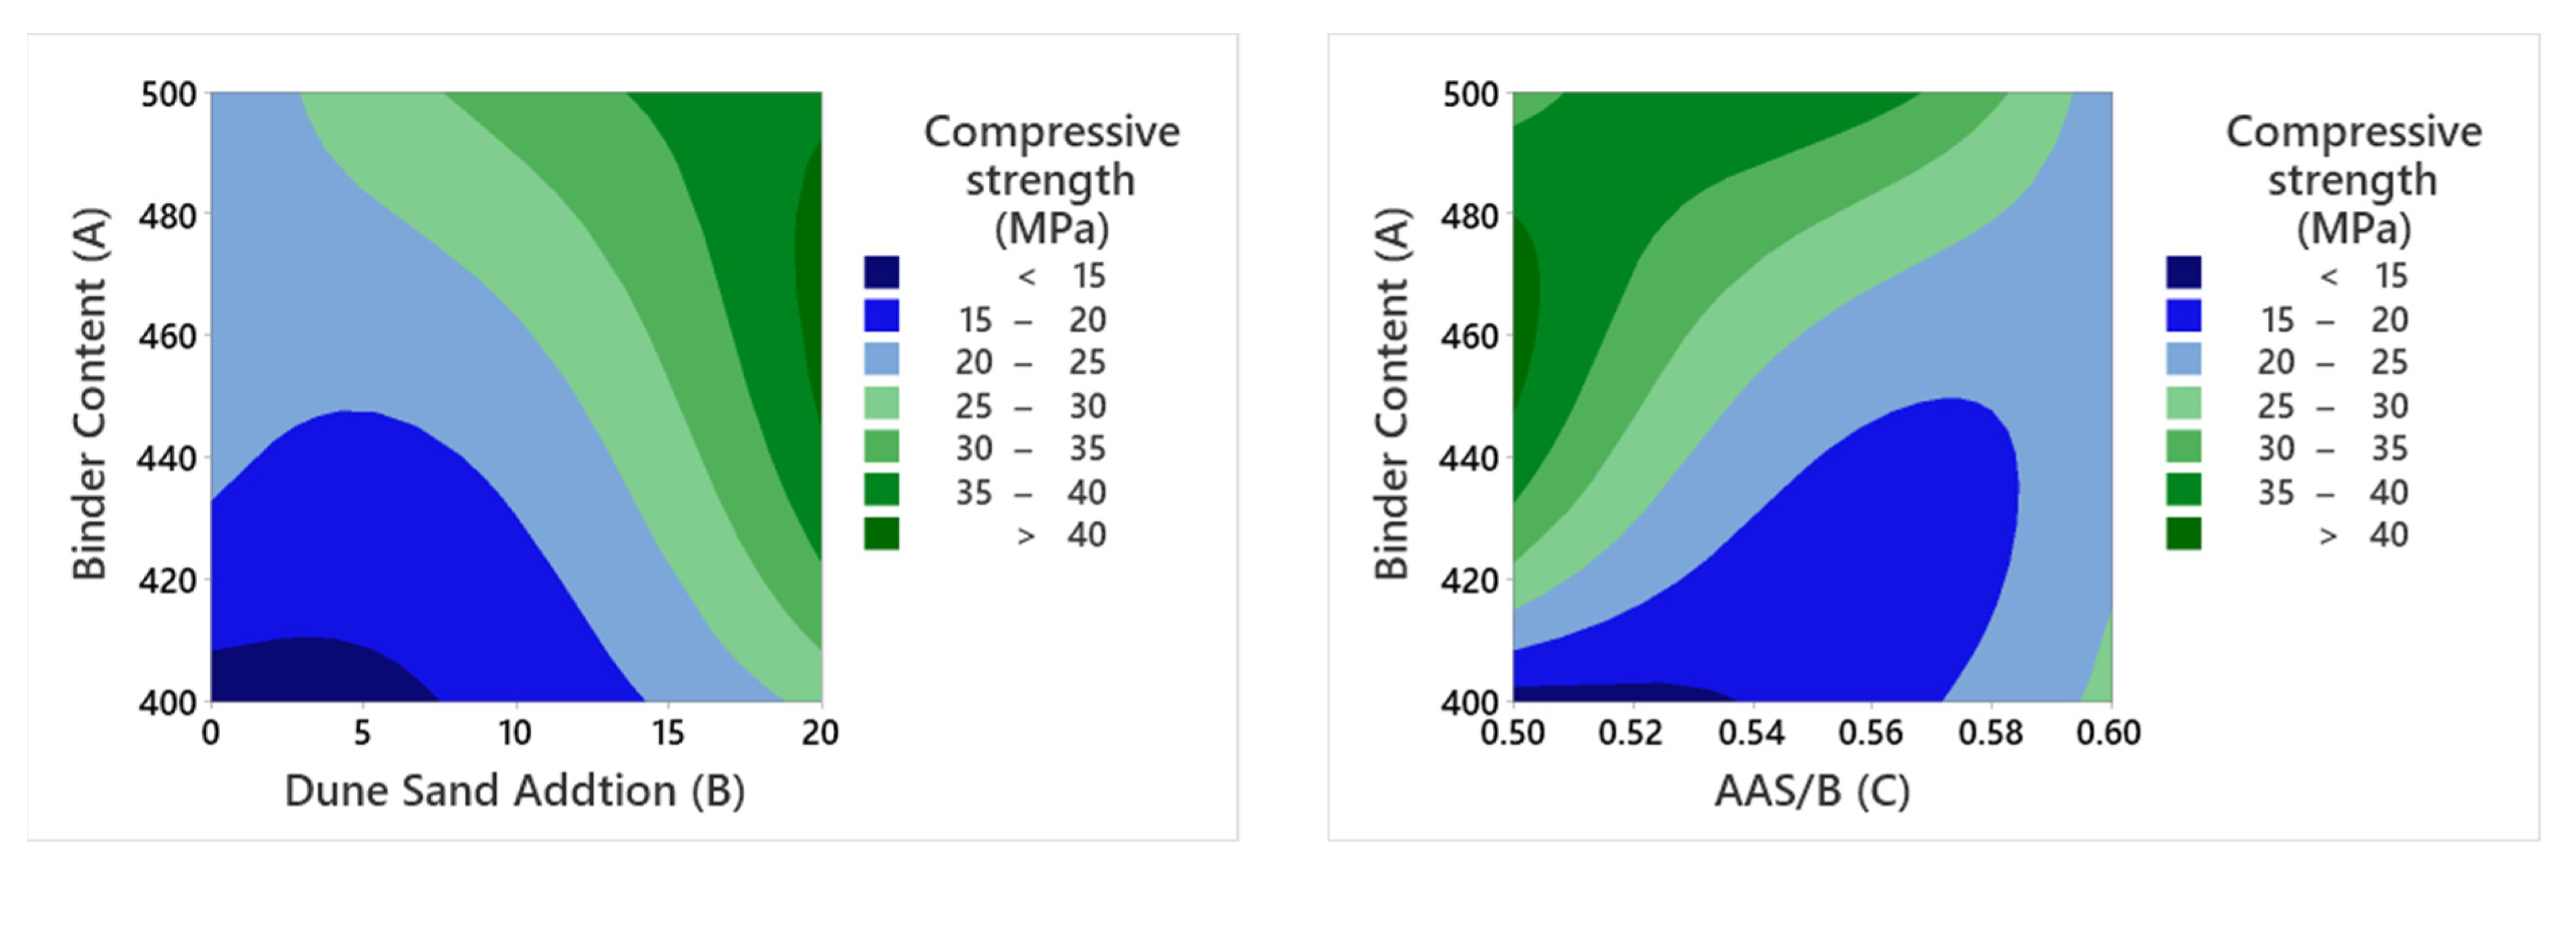
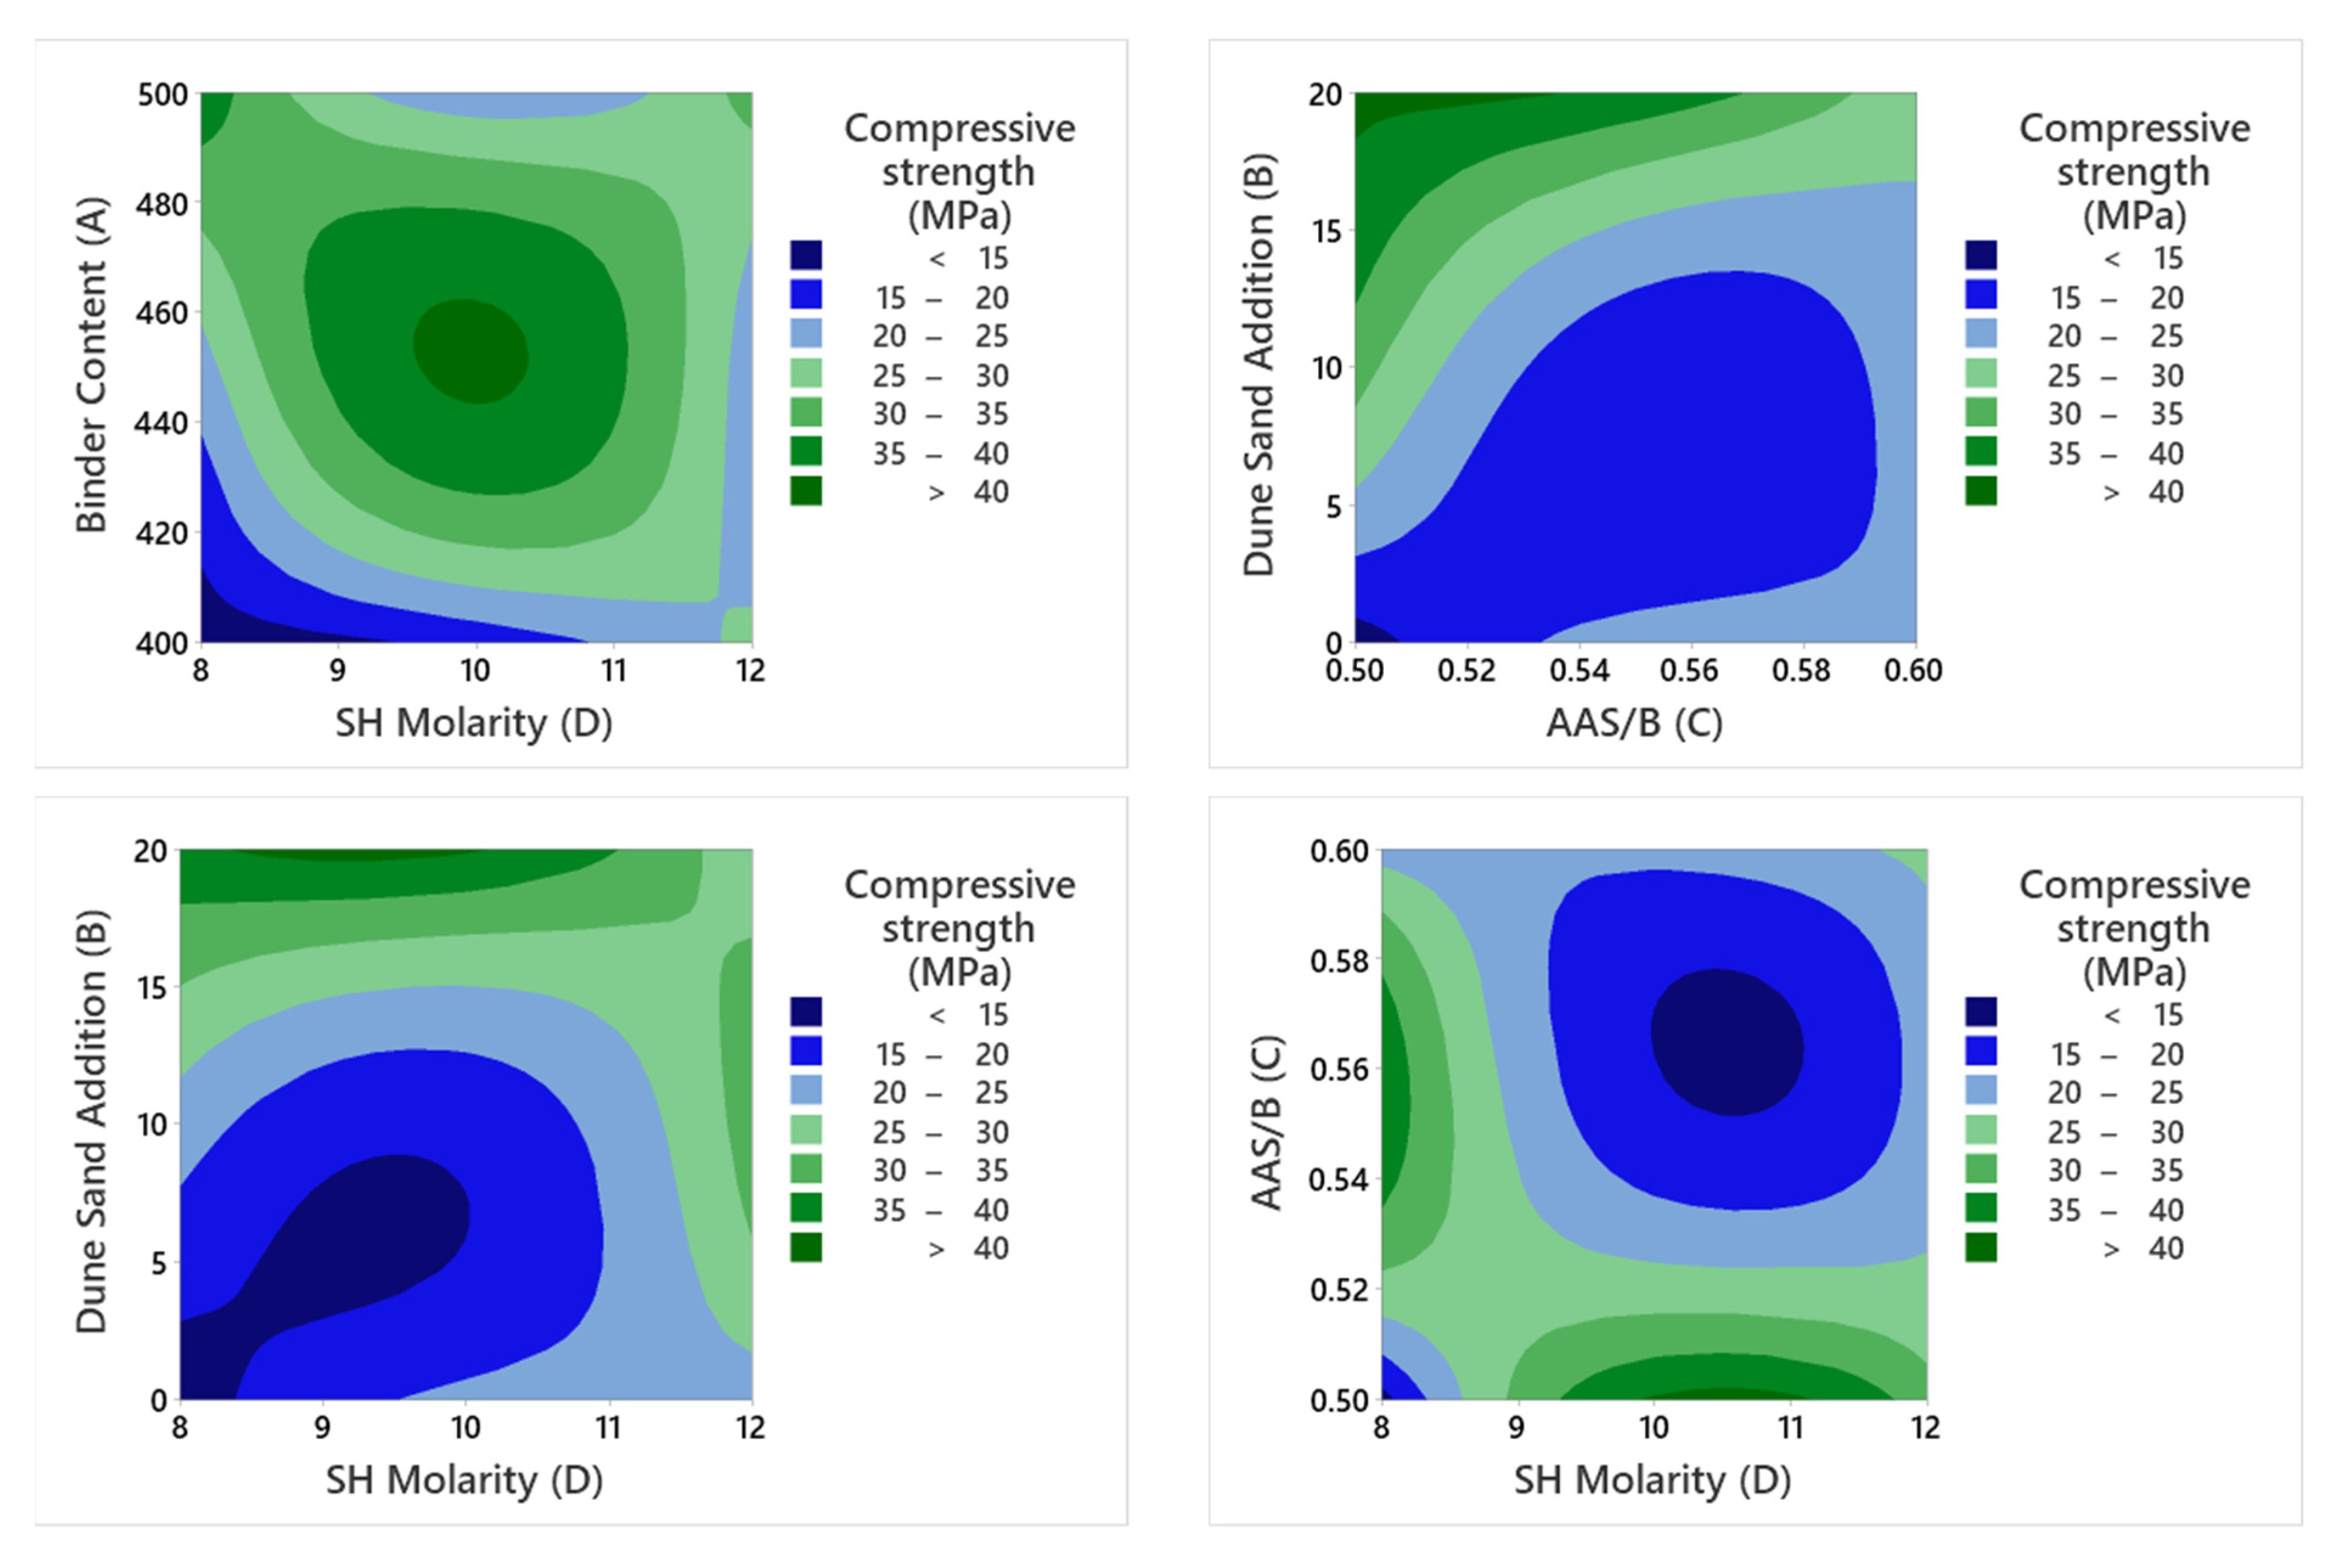
3.1.1. Compressive Strength
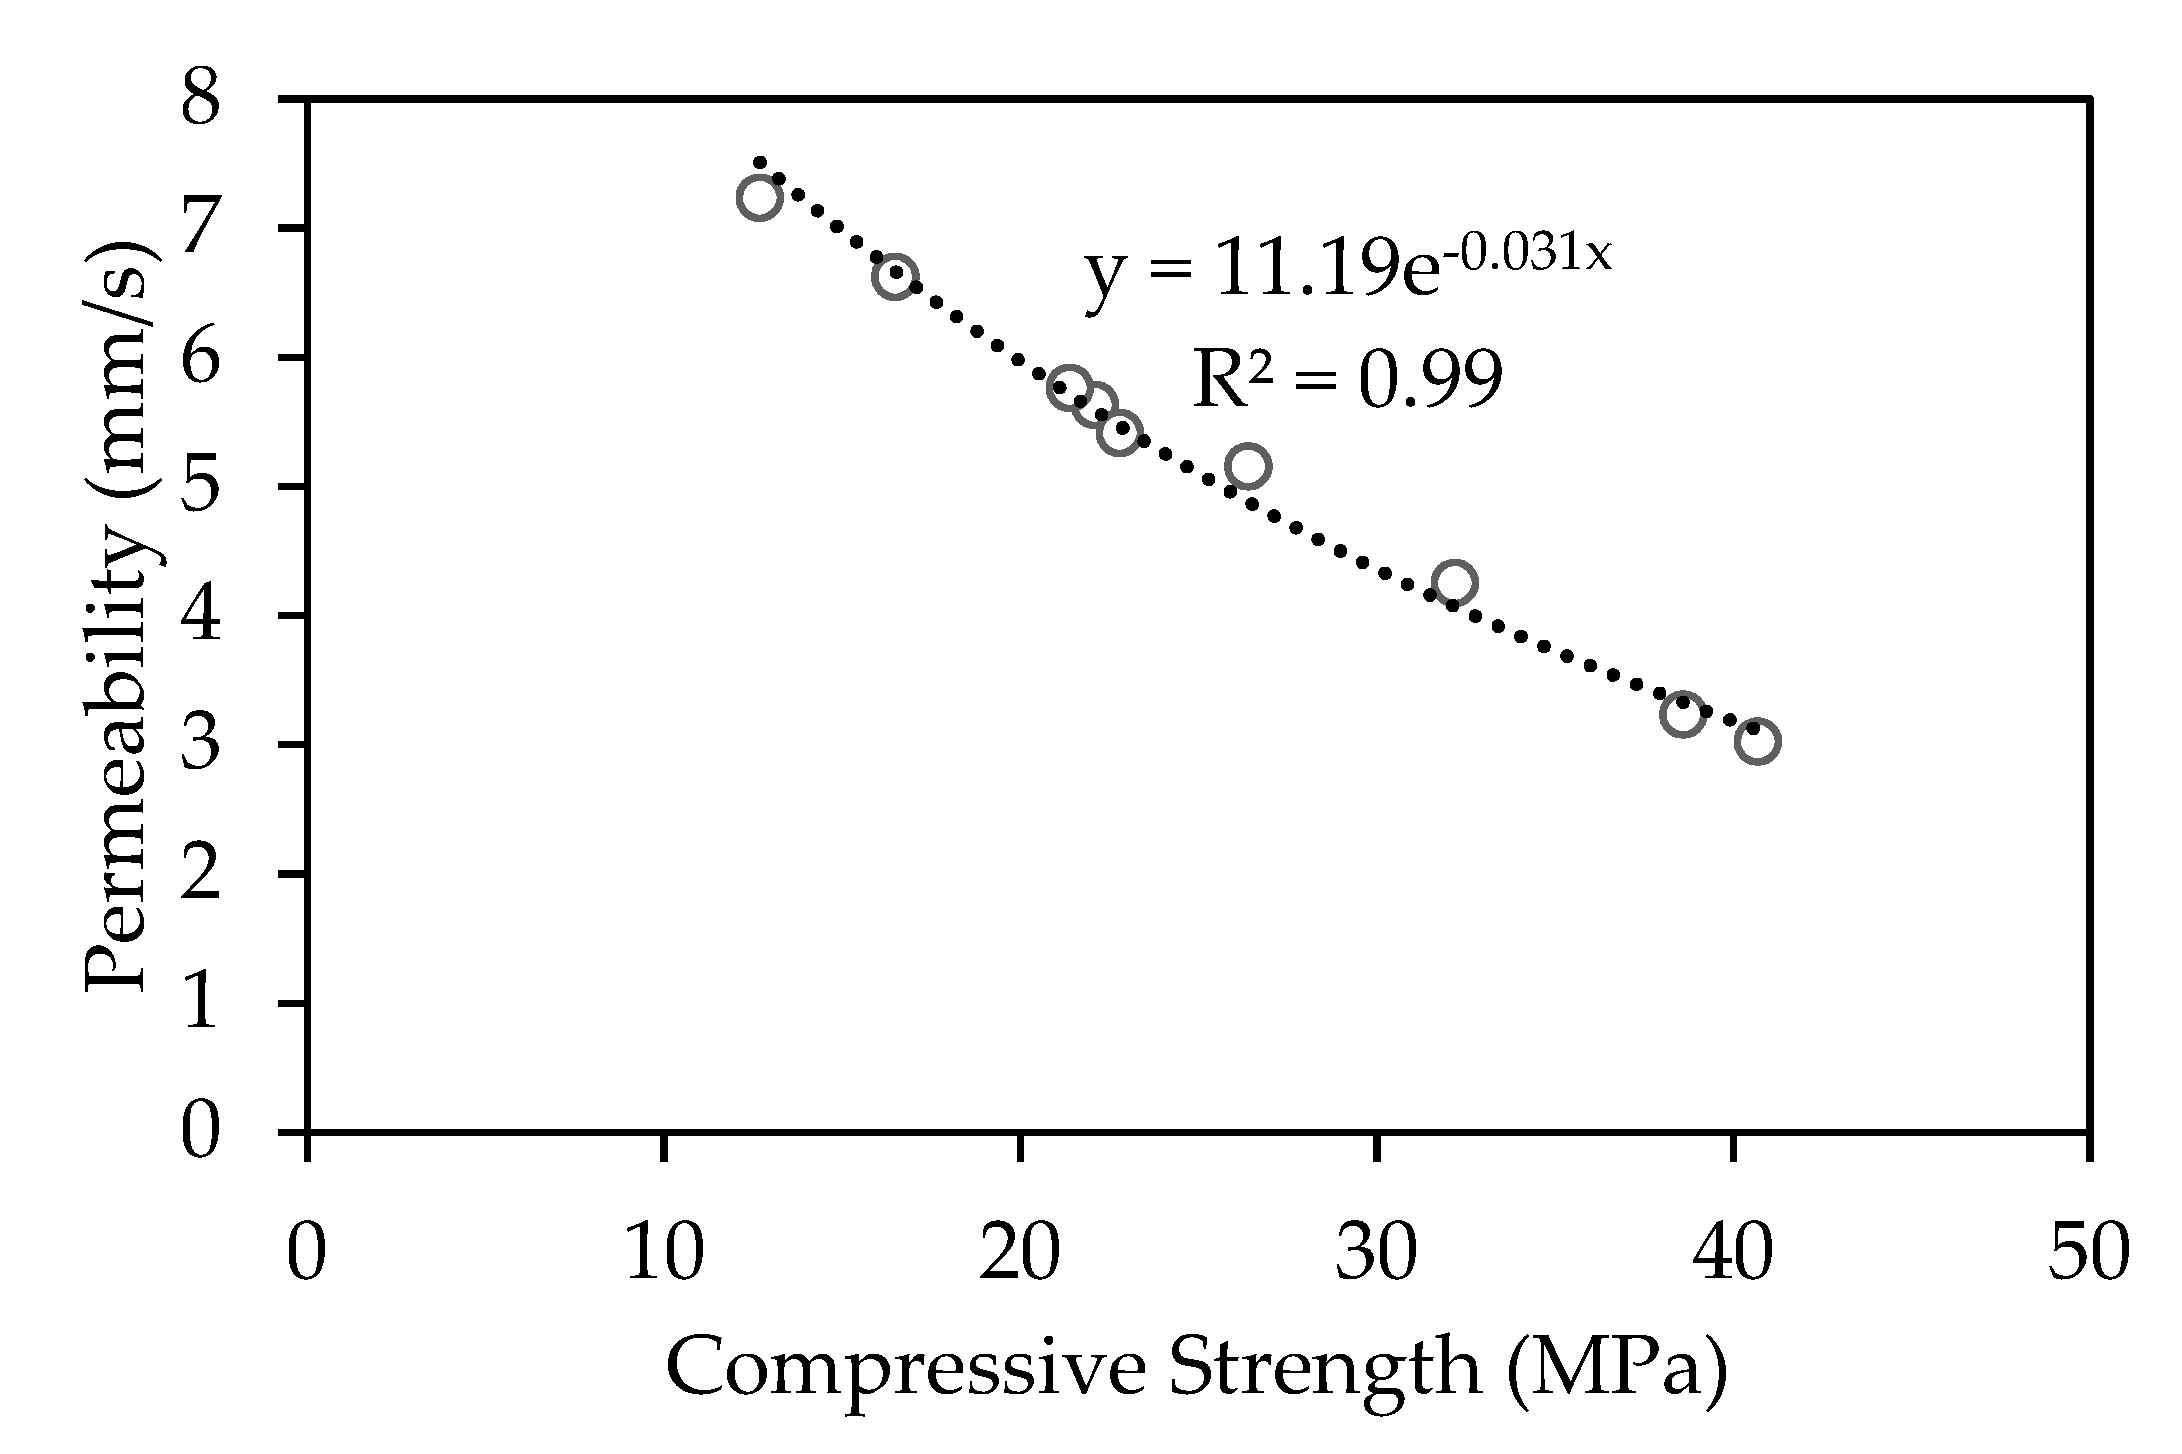
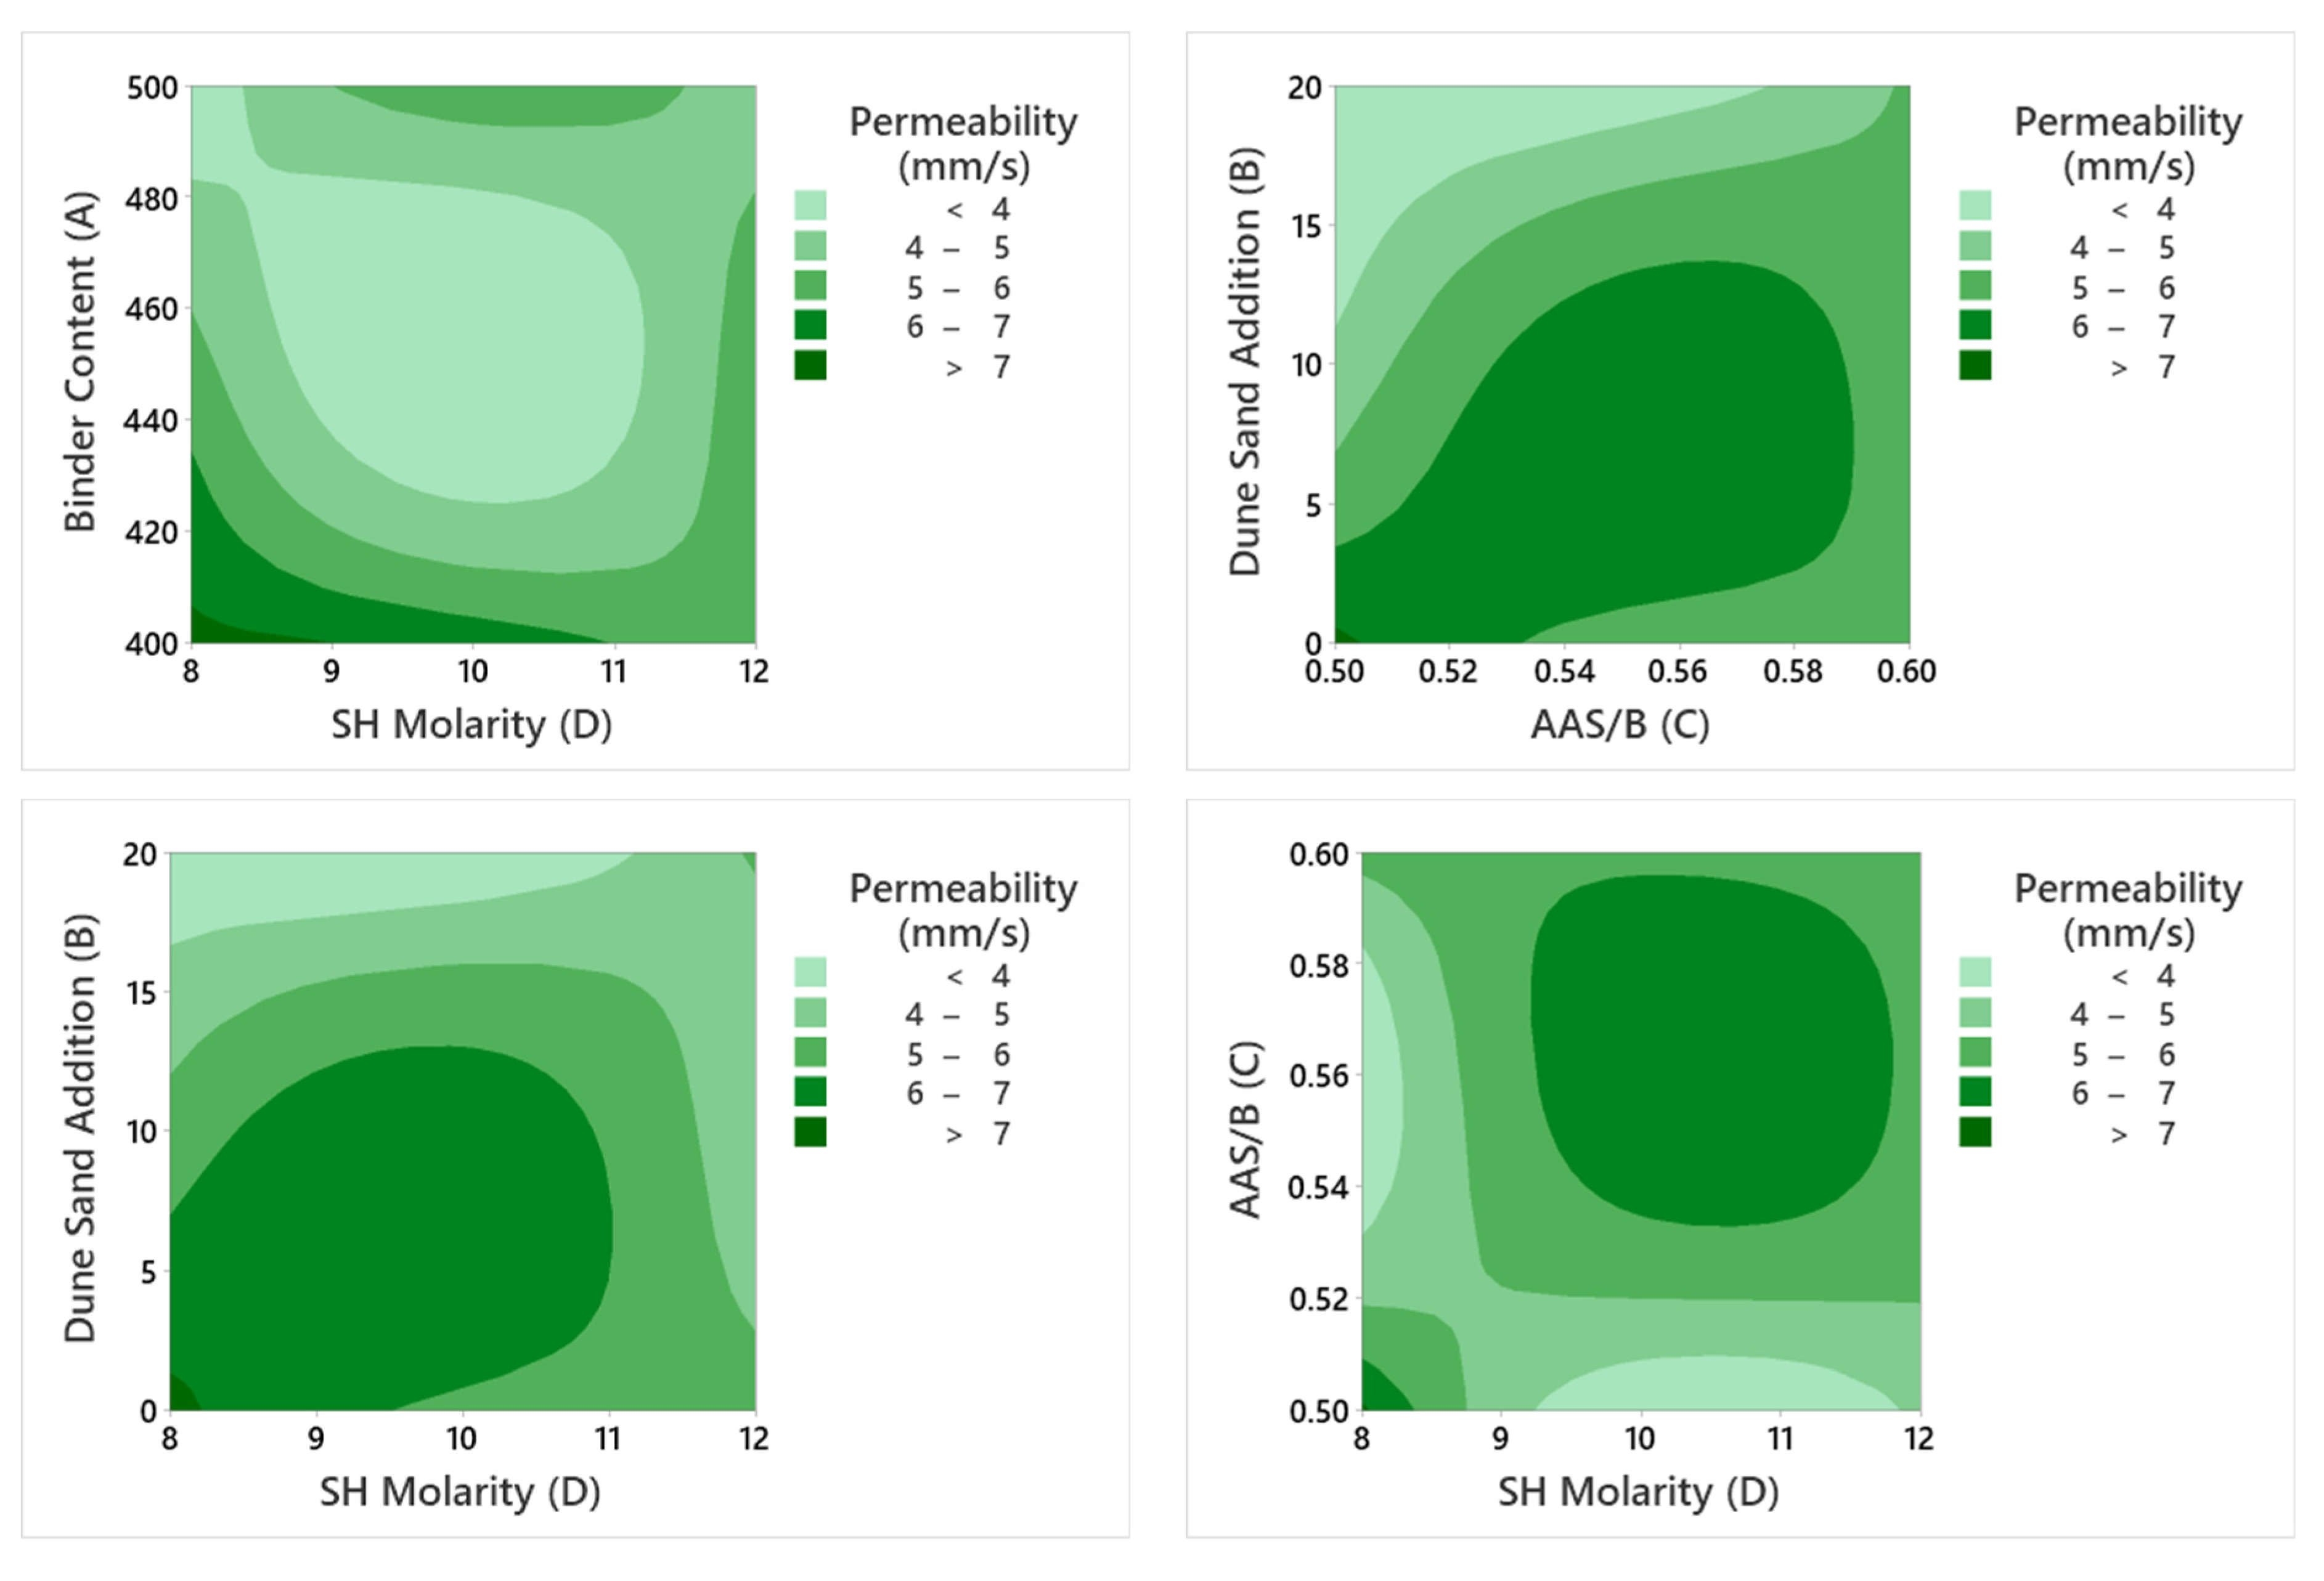
The compressive strength of the PGC mixtures ranged between 12.7 and 40.7 MPa, as summarized in Table 4. Mix 1, comprising a binder content of 400 kg/m3 and dune sand addition of 0%, exhibited a low strength response of less than 15 MPa. Conversely, mix 6, with a binder content of 450 kg/m3, dune sand addition of 20%, AAS/B of 0.50, and SH solution molarity of 10 M, exhibited the highest strength response of 40.7 MPa. For each group of mixes with a constant binder content (400, 450, and 500 kg/m3), those made with a 0% dune sand addition experienced the lowest strength, i.e., mixes 1, 4, and 7, respectively. Similarly, in each group of mixes, the highest strength was attained with a 20% dune sand addition (i.e., mixes 3, 6, and 9). Such a finding is independent of the AAS/B or SH molarity, indicating the critical influence of dune sand compared to these two factors.
Contour plots, showing the effect of the different mix design factors on the compressive strength, are presented in Figure 3. The highest compressive strength response was attained by adopting a specific range of factors. For instance, a strength response higher than 30 MPa could be achieved for PGC mixtures made with 450–500 kg/m3 of the binder content, 10–20% of a dune sand addition, 0.50–0.55 of AAS/B, and 8–12 M of SH molarity. The use of a high binder content (i.e., ≥450 kg/m3) led to an increase in strength, owing to a higher hydraulic reaction capacity with the presence of more CaO in the binding matrix [54]. On the other hand, a low AAS/B ratio and the addition of dune sand (10–20%) increased the strength responses due to the improved particle packing density and reduced void content [46,55]. The contribution of the dune sand to strength can be also attributed to its fineness, leading to a denser and more homogenous geopolymer concrete. In fact, mortar and concrete made with dune sand had an equivalent strength to that of their counterparts made with natural aggregates [56,57]. Lastly, the incorporation of a SH solution with a molarity of 10 M led to a higher dissolution of hydroxide ions, reflecting higher strength responses (>35 MPa) [28]. Higher or lower molarities reduced the strength response. It is noteworthy that adopting one level of factors without considering the others could lead to inferior strength responses. For example, the use of a low binder content of 400 kg/m3 with a 0% dune sand addition in the PGC yielded inferior strength responses below 15 MPa.

3.1.2. Permeability

In order to secure adequate water percolation in PC, the permeability coefficient should fall within the range of 1.3–12.2 mm/s [7,58]. As summarized in Table 4, all concrete mixes were within this range. Of these mixes, mix 1, made with 400 kg/m3 of the binder, a 0% dune sand addition, AAS/B of 0.50, and SH solution of 8 M, attained the highest permeability of 7.23 mm/s. Conversely, mix 6, including a binder content of 450 kg/m3, dune sand addition of 20%, AAS/B of 0.50, and SH molarity of 10 M, achieved the lowest permeability response of 3.02 mm/s. The results show that incorporating a higher binder content decreased the permeability, owing to the refinement of the pore structure that hindered the ease of water percolation [59]. Furthermore, the addition of dune sand to the PGC mixes reduced the permeability. In fact, for each group of binder content (400, 450, and 500 kg/m3), the mixes made with a 20% dune sand addition had the lowest permeability. These findings highlight the more significant impact of binder content and dune sand addition on the permeability of PGC compared to AAS/B and SH molarity, evidenced by the contribution shown in the ANOVA section later. Analogous findings have been noted in conventional pervious concrete made with cement, where the hydraulic performance was greatly affected by the amount of fine aggregate and binder incorporated into the mix [60]. In addition, the permeability results were in line with those of compressive strength. As such, an exponential relationship was developed between the two properties, as shown in Figure 4. This correlation can be used to predict the permeability of PGC from its fcu values with a high accuracy (coefficient of determination, R2 = 0.99).
Figure 5 shows contour plots highlighting the effect of various mix design factors on the permeability of the PGC mixtures. It can be observed that high permeability values, exceeding 6 mm/s, were obtained while having a binder content, dune sand addition, AAS/B, and SH solution of 400–450 kg/m3, 0–10%, 0.50–0.55, and 8–10 M, respectively. Further increases in the binder content, dune sand addition, AAS/B, and SH molarity led to lower permeability responses, with values lower than 4 mm/s being attained. Such a response could be owed to the higher hydraulic reaction capabilities with the increase in binder content, which leads to less pores in the binding matrix [56,61]. Similarly, the increase in dune sand content lowered the percolation capacity of the PGC due to the granular structure and void-filling capacity of the dune sand [57]. Additionally, the permeability was reduced to below 4 mm/s when the SH solution molarity increased and AAS/B decreased, owing to an increase in the dissolution of hydroxide ions and poor packing density, respectively [62]. Nevertheless, all 9 mixes tested herein had permeability coefficients between 3.02 and 7.23 mm/s, which are acceptable for pervious concrete applications [7,57]. Moreover, it is worth noting that designing a PGC mix with one suitable factor while neglecting others may lead to insufficient permeability. For example, using 500 kg/m3 of binder content with a dune sand addition of 10–20% resulted in a permeability value below 4 mm/s.

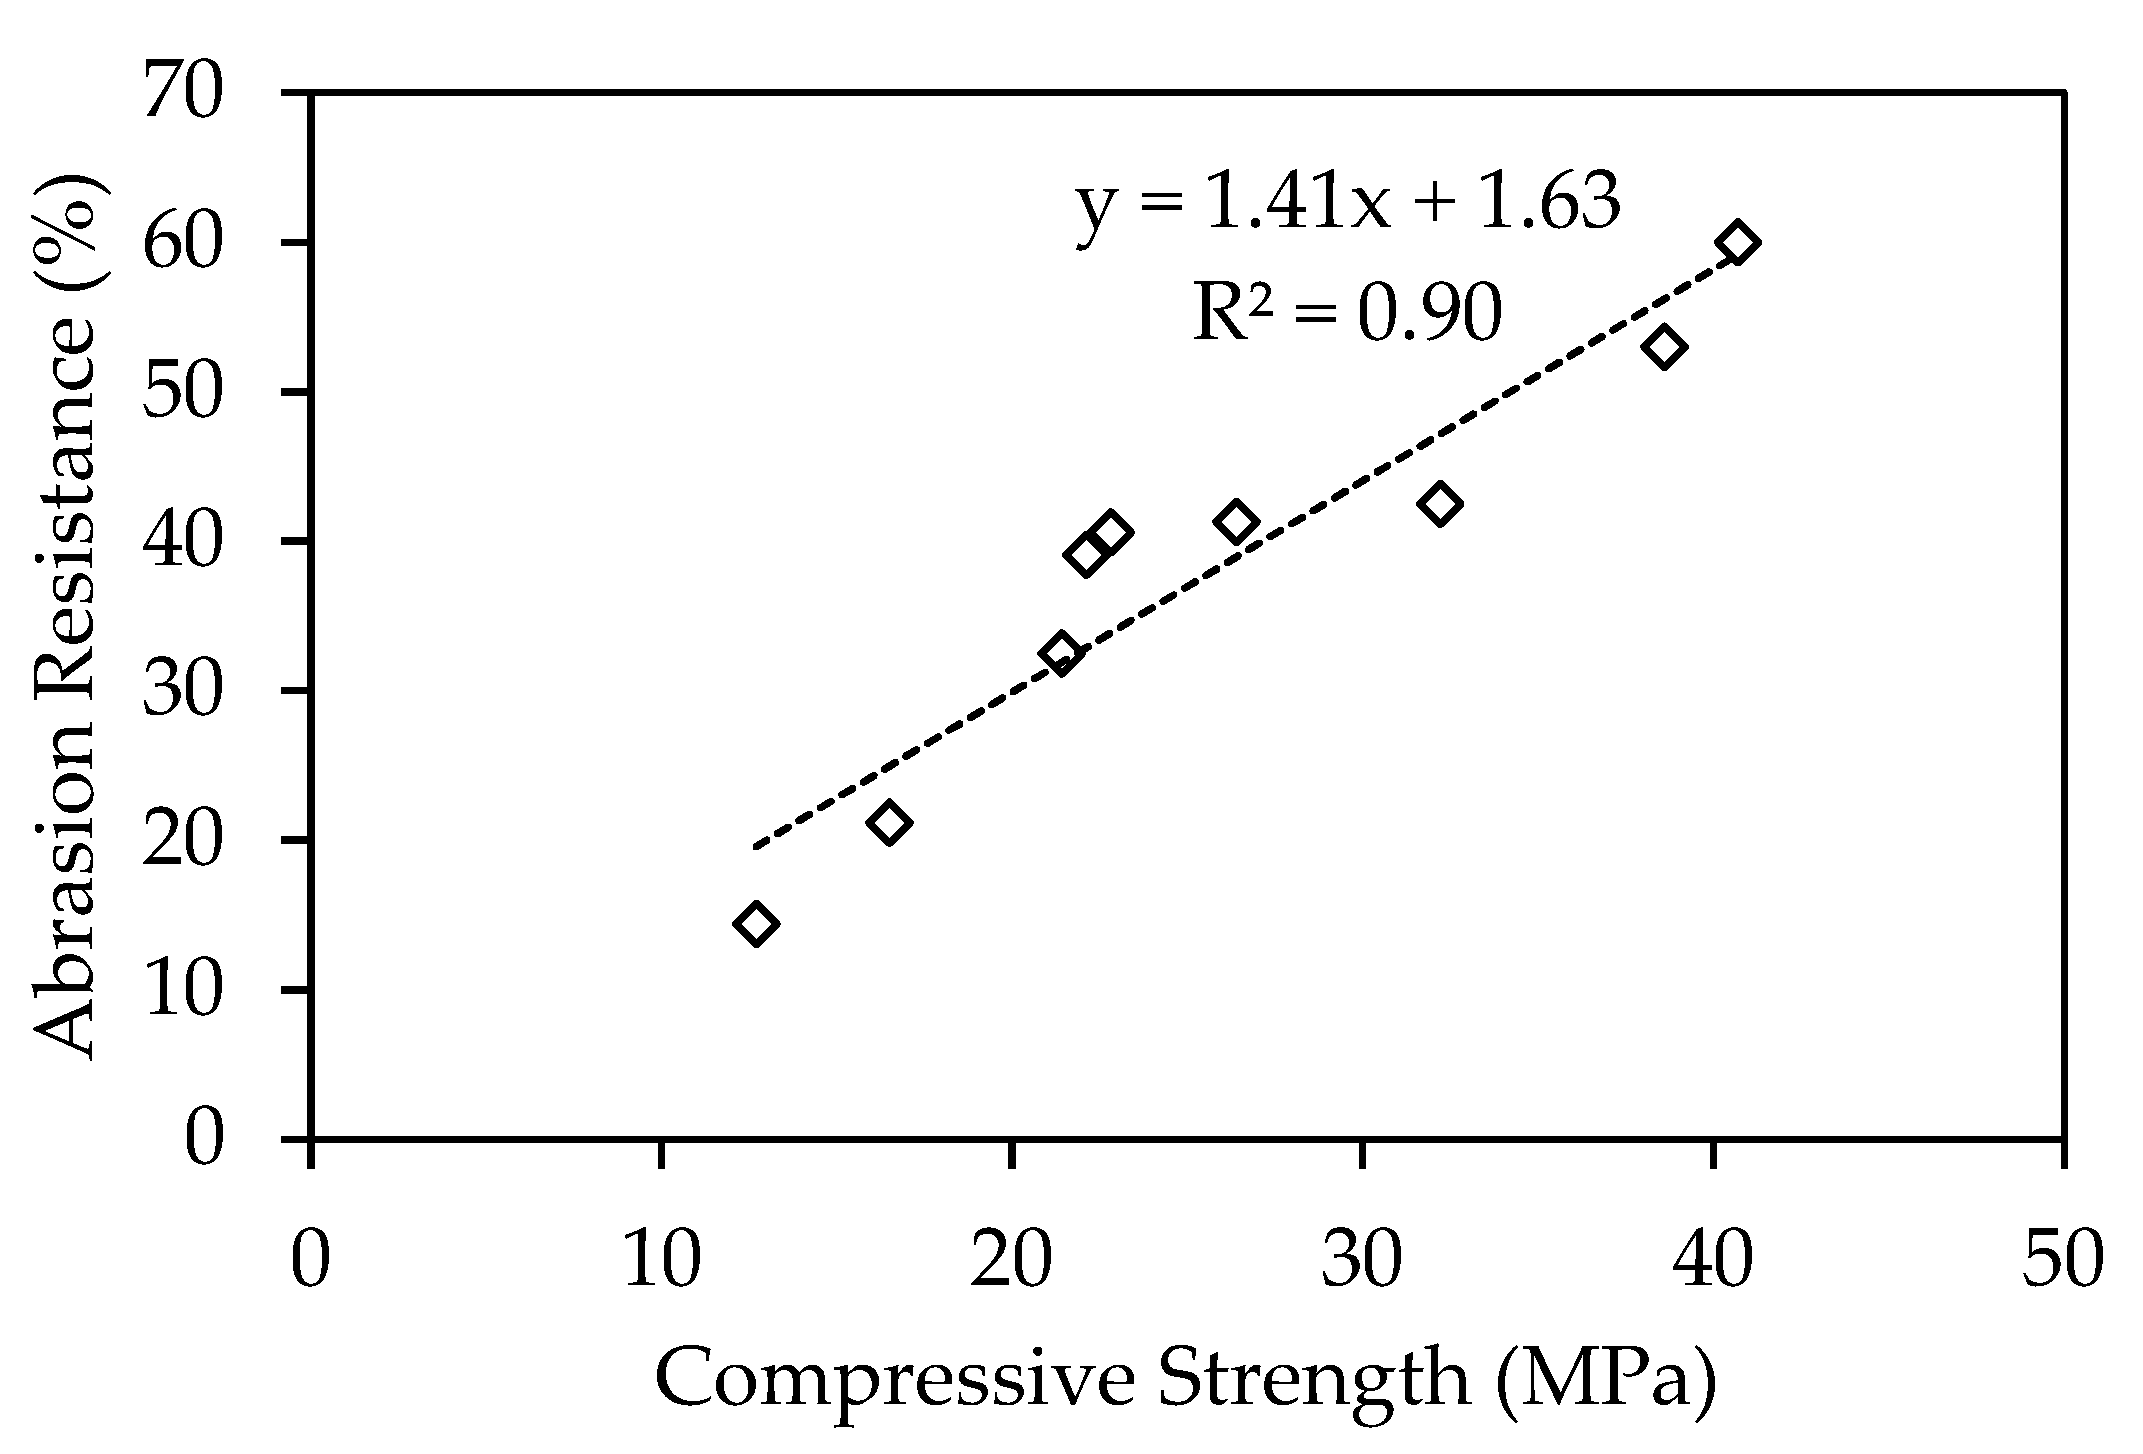
3.1.3. Abrasion Resistance

Table 4 summarizes the abrasion resistance of the PGC mixes. The abrasion resistance ranged between 14.4 and 55.0%, with the lowest and highest values being those of mixes 1 and 6, respectively. The results show that the abrasion resistance followed a synonymous pattern to that of the compressive strength. As such, a relationship was established between the two properties. Figure 6 shows that the abrasion resistance and fcu were correlated through a linear equation that could be used in predicting one performance criterion or response from the other with a high accuracy (R2 = 0.90).
To understand the effect of the mix design parameters on the abrasion resistance, bi-variate contour plots were developed, as presented in Figure 7. The PGC mixes attained an abrasion resistance above 40% when using 450–500 kg/m3 of the binder content, a 10–20% dune sand addition, 0.50–0.55 of AAS/B, and 8–12 M of SH solution. It can be noticed that these levels of mix design factors are similar to those for attaining a compressive strength exceeding 30 MPa. Furthermore, a decrease in the abrasion resistance was noted when a lower binder content and dune sand addition were employed. Meanwhile, the variation in SH molarity and AAS/B did not seem to significantly impact the abrasion resistance responses, evidenced by their low contributions presented in the ANOVA section later.

3.2. Optimization Results

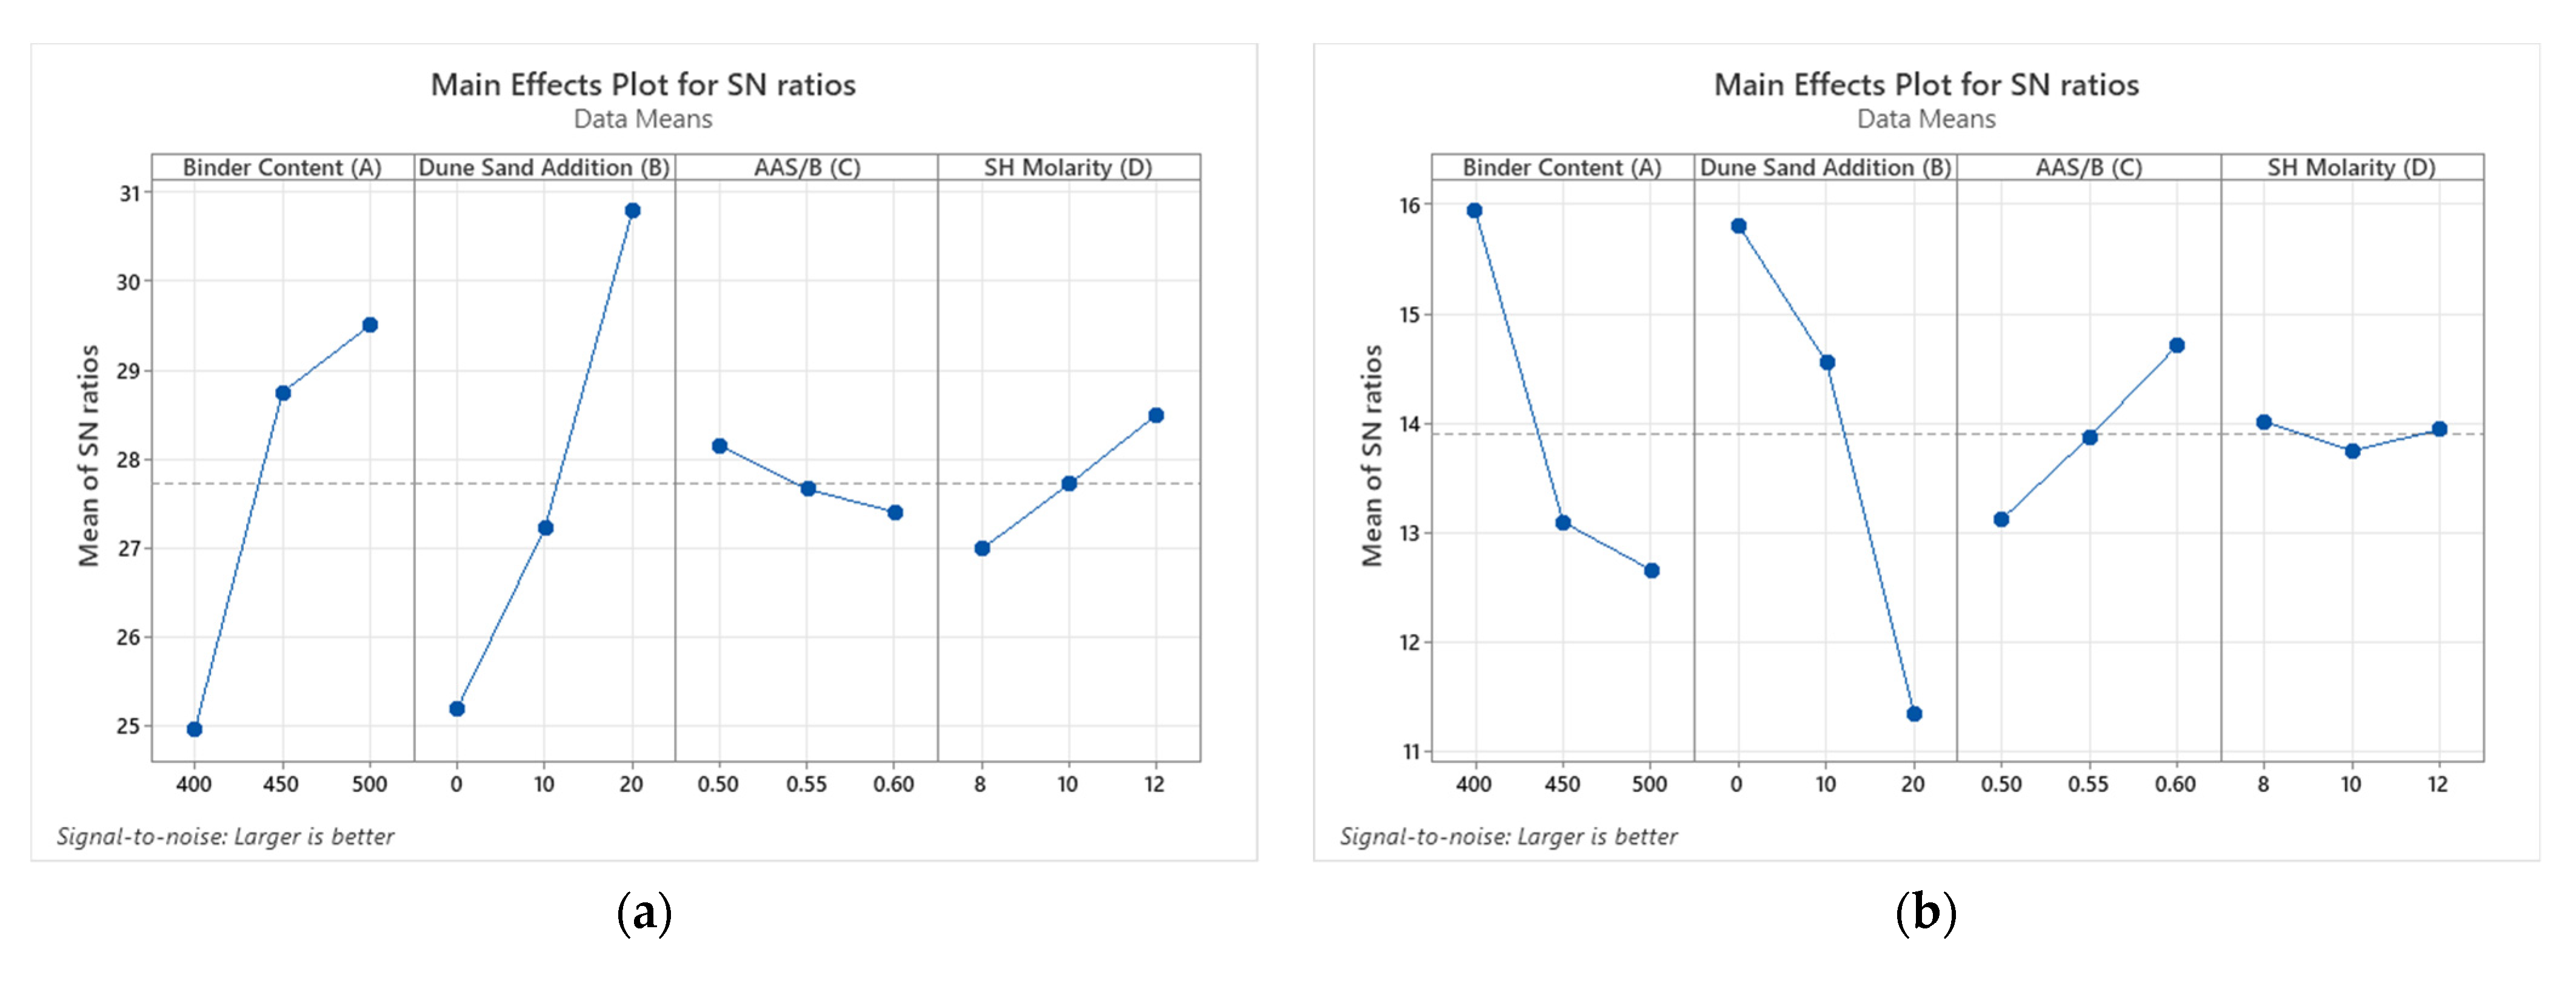
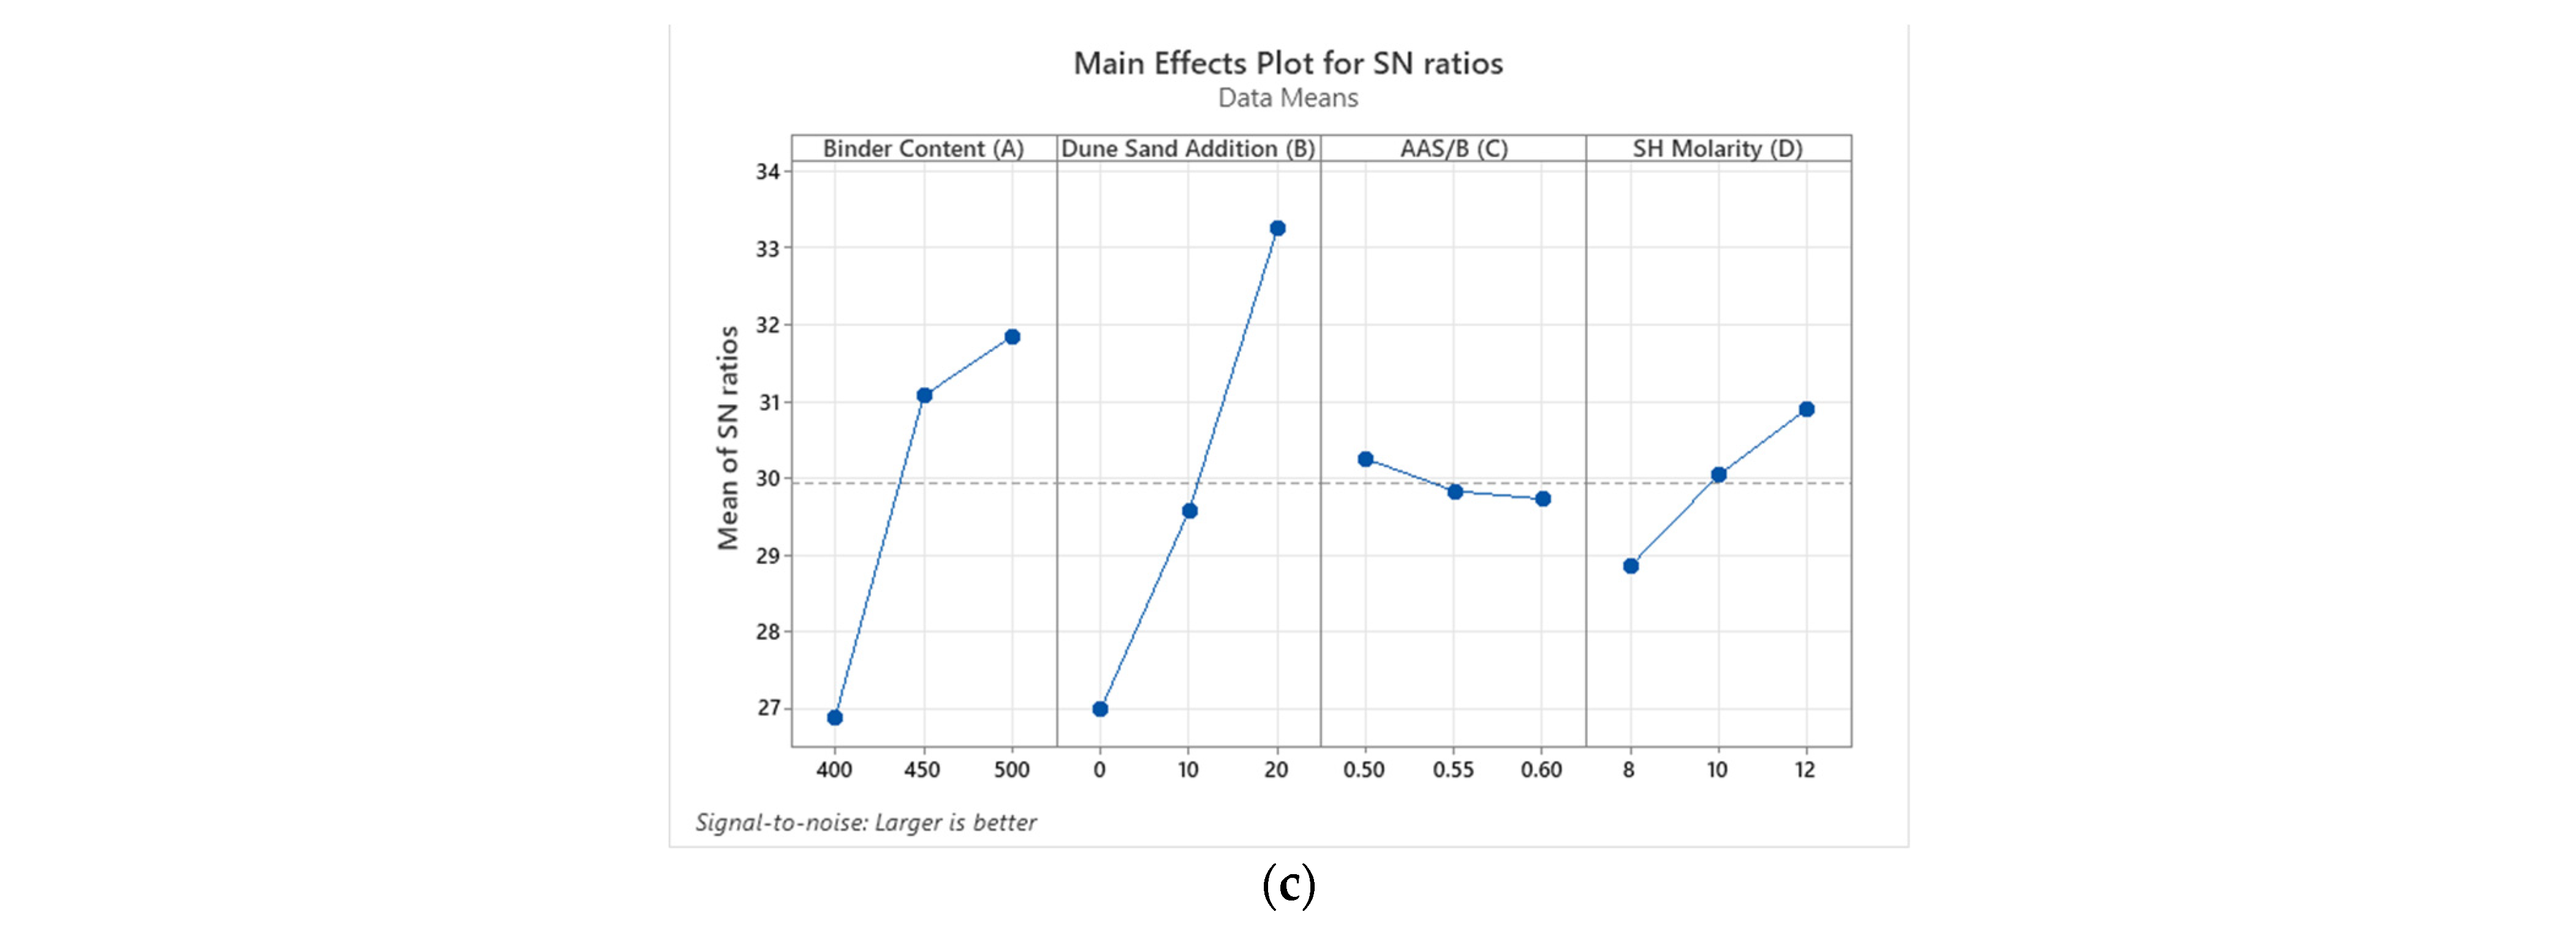
3.2.1. Taguchi Analysis

The Taguchi optimization process was implemented to seek the targeted experimental response of one performance criterion at a time. The optimum mixture proportions for each of the three performance criteria, including compressive strength, permeability, and abrasion resistance, were obtained using the signal-to-noise ratios (S/N), as illustrated in Figure 8. The optimum mixes for the compressive strength, permeability, and abrasion resistance were A3B3C1D3, A1B1C3D1, and A3B3C1D3, respectively. Owing to their high degree of correlation, the optimum mixes for superior compressive strength and abrasion resistance were the same, having a binder content of 500 kg/m3, a dune sand addition of 20%, AAS/B of 0.50, and SH molarity of 12 M. Conversely, the optimum mix to secure the best permeability corresponded to a 400 kg/m3 binder content, dune sand addition of 0%, AAS/B of 0.60, and SH solution molarity of 8 M. Hence, the Taguchi method revealed that a particular combination of levels was essential to provide either a superior strength and abrasion resistance or permeability of the PGC.

3.2.2. Analysis of Variance (ANOVA)

The contribution of each factor toward the strength, permeability, and abrasion resistance responses was assessed through the analysis of variance (ANOVA) at a confidence level of 95%. Figure 9 shows that the dune sand addition had the highest contribution toward strength and abrasion resistance with a value of 59% for each, followed by the binder content having contributions of 35 and 34%, respectively. Increasing the dune sand and binder contents led to a higher strength and abrasion resistance due to a higher hydraulic reaction capacity with the presence of more CaO in the matrix, improved particle packing density, and a reduced void content [46,55,56]. Conversely, the AAS/B and SH molarity had low contributions of less than 6%. Such results were confirmed with the strength results, whereby concrete with adequate strength, i.e., above 20 MPa, could be produced regardless of the AAS/B and SH molarity. These findings show that the binder content and dune sand addition predominantly controlled the mechanical and durability properties of the PGC.
Furthermore, the contribution of the dune sand addition and binder content toward the permeability were the highest at 56 and 40%, respectively. Indeed, adding dune sand and increasing the binder content were associated with better particle packing and a higher degree of hydraulic reaction, leading to less pores in the binding matrix [56,61]. The AAS/B and SH molarity had less significant impacts on the permeability with lower contributions of 3 and 1%, respectively. Evidently, the binder content was more impactful on the hydraulic performance of the PGC than on the mechanical and durability performance. Meanwhile, the opposite was noted for the impact of the dune sand addition; however, using a higher SH solution molarity or reducing the AAS/B resulted in a lower permeability of the PGC due to the respective increased dissolution of hydroxide ions and improved particle packing density [57,62]. Nevertheless, it is possible to attain acceptable PGC permeability for concrete pavement applications.

3.2.3. TOPSIS Analysis

Four different optimization scenarios were designed. The weights were assigned to the quality criteria as a value out of 10. The normalized weights were then obtained as the ratio of the weight of each criterion to the total weight of the investigated criteria. The normalized weights assigned to each criterion are presented in Table 5. The first optimization scenario served to maximize the compressive strength while providing less weight to the permeability and abrasion resistance. Conversely, the second and third optimization scenarios aimed to maximize the permeability and abrasion resistance, respectively, while giving lesser weight to the other properties. A fourth optimization scenario, i.e., balanced performance, was carried out with equal weights being assigned to each criterion.
The TOPSIS-based Taguchi optimization method aimed to maximize the three criteria. As summarized in Table 6, the S/N ratios for compressive strength, permeability, and abrasion resistance were calculated using Equation (4). These values were then employed in calculating the closeness coefficients, shown in Table 7. Then, the average S/N ratios of the respective levels for each factor were computed. The maximum S/N value represented the levels of the optimum PGC mix. As shown in Figure 10a,c, the first and third optimization scenarios (i.e., compressive strength and abrasion resistance with higher weights) yielded the same optimum level of factors of A3B3C3D3. In fact, the optimum mix for superior compressive strength and abrasion resistance comprised a binder content of 500 kg/m3, dune sand addition of 20%, AAS/B of 0.60, and SH molarity of 12 M.
Alternatively, the second scenario (i.e., permeability being dominant) revealed that A1B1C3D3 were the optimum levels of factors (Figure 10b), representing a binder content, dune sand addition, AAS/B, and SH solution molarity of 400 kg/m3, 0%, 0.60, and 12 M, respectively. Meanwhile, the levels of the factors for optimization based on the fourth scenario (i.e., the three quality criteria were assigned equal weights of 0.33) were A1B2C3D3 (Figure 10d). Hence, the TOPSIS optimization process produced a mix of PGC having a binder content of 400 kg/m3, dune sand addition of 10%, AAS/B of 0.60, and SH molarity of 12 M with a balanced performance among the compressive strength, permeability, and abrasion resistance.

3.3. Prediction of PGC Properties

A series of multivariable regression models was established to predict the compressive strength, permeability, and abrasion resistance of pervious geopolymer concrete while reflecting on the effect of different factors. Hence, the binder content (A), dune sand addition (B), AAS/B (C), and SH solution molarity (D) were employed at various levels for the proposed models. The levels of factors ranged from 400 to 500 kg/m3 for the binder content, 0 to 20% for the dune sand addition, 0.50 to 0.60 for AAS/B, and 8 to 12 M for SH solution molarity. The form of the proposed quadratic model is given in Equation (12). Table 8 lists the coefficients of the established models for each quality criterion. The R2 and root-mean-square-error (RMSE) values were in the respective ranges of 0.98–0.99 and 0.37–1.20. Accordingly, these models could be employed in predicting the properties of PGC with a high accuracy. Additionally, the properties of the optimum mixes (based on the TOPSIS analysis) could be estimated using the newly-developed regression models. Indeed, mixes A3B3C3D3, A1B1C3D3 and A1B2C3D3, i.e., the optimum mixes for scenarios 1/3, 2, and 4, were characterized by a compressive strength of 39.1, 10.5, and 15.6 MPa, respectively. Their corresponding permeability was 3.4, 7.7, and 6.9 mm/s, while their respective abrasion resistances were 52.8, 12.8, and 20.9%.
Property = α0(A) + α1(B) + α2(C) + α3(D) + α4(A2) + α5(B2) + α6(C2) + α7(D2)

4. Conclusions

This study evaluated the effect of various mix design parameters on the compressive strength, permeability, and abrasion resistance of pervious geopolymer concrete (PGC). The Taguchi and TOPSIS methods were used to optimize the mixture proportions for superior performance. Based on the experimental results and findings, the conclusions are as follows:
  • A compressive strength and abrasion resistance higher than 30 MPa and 40%, respectively, could be achieved for PGC mixtures made with 450–500 kg/m3 of binder content, a 10–20% dune sand addition, 0.50–0.55 of AAS/B, and 8–12 M of SH molarity. The abrasion resistance could be accurately predicted from the compressive strength using a newly-developed regression model with a high coefficient of determination of R2 = 0.90.
  • High permeability values, exceeding 6 mm/s, were obtained in PGC mixes made with a binder content, dune sand addition, AAS/B, and SH solution of 400–450 kg/m3, 0–10%, 0.50–0.55, and 8–10 M, respectively. An analytical regression model was established to predict the permeability of the PGC from the compressive strength with a high accuracy (R2 = 0.99).
  • Using the Taguchi method, the optimum mixes for superior compressive strength and abrasion resistance were made with a binder content, dune sand addition, AAS/B, and SH molarity of 500 kg/m3, 20%, 0.50, and 12 M, respectively. Contrarily, the optimized mix design for superior permeability was made with a binder content of 400 kg/m3, dune sand addition of 0%, AAS/B of 0.6, and SH molarity of 8 M.
  • An ANOVA revealed that the binder content and dune sand addition had the highest contributions to the compressive strength, permeability and abrasion resistance, while the AAS/B and SH solution molarity had lower contributions toward the performance of the PGC.
  • A TOPSIS-based Taguchi method was employed in optimizing the mixes in accordance with four optimization scenarios. For the scenarios where the compressive strength and abrasion resistance were more important to the user, the optimum mix comprised a binder content of 500 kg/m3, dune sand addition of 20%, AAS/B of 0.60, and SH molarity of 12 M. As for the permeability-dominant scenario, the optimum mix had a binder content of 400 kg/m3, dune sand addition of 0%, AAS/B of 0.60, and SH Molarity of 12 M. Meanwhile, the balanced performance scenario, i.e., equal weights for the three criteria, had an optimum mix comprised of a binder content of 400 kg/m3, dune sand addition of 10%, AAS/B of 0.60, and SH Molarity of 12 M.
  • Multivariable regression models were established to predict the compressive strength, permeability, and abrasion resistance from the binder content, dune sand addition, AAS/B, and SH solution molarity with a high accuracy. The R2 and RMSE values ranged from 0.98 to 0.99 and 0.37 to 1.20, respectively. The optimum mixes, namely, A3B3C3D3, A1B1C3D3, and A2B2C3D3, had compressive strengths of 39.1, 10.5, and 15.6 MPa, permeability of 3.4, 7.7, and 6.9 mm/s, and abrasion resistance of 52.8, 12.8, and 20.9%, respectively.
The experimental results and findings highlight the feasibility of producing a sustainable cement-free pervious geopolymer concrete derived from waste materials with adequate compressive strength, permeability, and abrasion resistance for use as a sustainable urban drainage system (SUDS).

Author Contributions

Conceptualization, H.E.-H. and M.H.; methodology, F.H.A., H.E.-H., S.M., M.H. and K.H.M.; software, F.H.A. and A.E.-M.; validation, H.E.-H., M.H. and K.H.M.; formal analysis, F.H.A., H.E.-H. and A.E.-M.; investigation, F.H.A., H.E.-H., A.E.-M., S.M., M.H. and K.H.M.; resources, H.E.-H., M.H. and K.H.M.; data curation, F.H.A. and A.E.-M.; writing—original draft preparation, F.H.A. and A.E.-M.; writing—review and editing, H.E.-H., S.M., M.H. and K.H.M.; visualization, H.E.-H. and M.H.; supervision, H.E.-H. and M.H.; project administration, H.E.-H. and M.H.; funding acquisition, H.E.-H., M.H. and K.H.M. All authors have read and agreed to the published version of the manuscript.

Funding

This research was funded by ASPIRE and UAE University, grant numbers 21N235 and 31R277.

Institutional Review Board Statement

Not applicable.

Informed Consent Statement

Not applicable.

Data Availability Statement

Data is available upon request from the corresponding author.

Acknowledgments

The authors acknowledge the support of the UAE University staff and lab engineers.

Conflicts of Interest

The authors declare no conflict of interest.

References

  1. Díaz, E.E.S.; Barrios, V.A.E. Development and use of geopolymers for energy conversion: An overview. Constr. Build. Mater. 2021, 315, 125774. [Google Scholar] [CrossRef]
  2. Shah, K.W.; Huseien, G.F.; Xiong, T. Functional nanomaterials and their applications toward smart and green buildings. In New Materials in Civil Engineering; Butterworth-Heinemann: Oxford, UK, 2020; pp. 395–433. [Google Scholar]
  3. Lo, F.-C.; Lee, M.-G.; Lo, S.-L. Effect of coal ash and rice husk ash partial replacement in ordinary Portland cement on pervious concrete. Constr. Build. Mater. 2021, 286, 122947. [Google Scholar] [CrossRef]
  4. Elizondo-Martínez, E.-J.; Andrés-Valeri, V.-C.; Jato-Espino, D.; Rodriguez-Hernandez, J. Review of porous concrete as multifunctional and sustainable pavement. J. Build. Eng. 2019, 27, 100967. [Google Scholar] [CrossRef]
  5. Chandrappa, A.K.; Biligiri, K.P. Pervious concrete as a sustainable pavement material—Research findings and future prospects: A state-of-the-art review. Constr. Build. Mater. 2016, 111, 262–274. [Google Scholar] [CrossRef]
  6. Hwang, S.S.; Cortés, C.M.M. Properties of mortar and pervious concrete with co-utilization of coal fly ash and waste glass powder as partial cement replacements. Constr. Build. Mater. 2020, 270, 121415. [Google Scholar] [CrossRef]
  7. Zhong, R.; Leng, Z.; Poon, C.-S. Research and application of pervious concrete as a sustainable pavement material: A state-of-the-art and state-of-the-practice review. Constr. Build. Mater. 2018, 183, 544–553. [Google Scholar] [CrossRef]
  8. Joshaghani, A.; Ramezanianpour, A.A.; Ataei, O.; Golroo, A. Optimizing pervious concrete pavement mixture design by using the Taguchi method. Constr. Build. Mater. 2015, 101, 317–325. [Google Scholar] [CrossRef]
  9. Khankhaje, E.; Rafieizonooz, M.; Salim, M.R.; Khan, R.; Mirza, J.; Siong, H.C.; Salmiati, S. Sustainable clean pervious concrete pavement production incorporating palm oil fuel ash as cement replacement. J. Clean. Prod. 2018, 172, 1476–1485. [Google Scholar] [CrossRef]
  10. Bilal, H.; Chen, T.; Ren, M.; Gao, X.; Su, A. Influence of silica fume, metakaolin & SBR latex on strength and durability performance of pervious concrete. Constr. Build. Mater. 2021, 275, 122124. [Google Scholar]
  11. Anwar, F.H.; El-Hassan, H.; Hamouda, M.A. A Meta-Analysis on the Performance of Pervious Concrete with Partial Cement Replacement by Supplementary Cementitious Materials; ZEMCH: Dubai, United Arab Emirates, 2021. [Google Scholar]
  12. Chen, X.; Wang, H.; Najm, H.; Venkiteela, G.; Hencken, J. Evaluating engineering properties and environmental impact of pervious concrete with fly ash and slag. J. Clean. Prod. 2019, 237, 117714. [Google Scholar] [CrossRef]
  13. Presuel-Moreno, F.J.; Tang, F. Corrosion Propagation of Rebar Embedded in Low w/c Binary Concrete Blends Exposed to Seawater; CORROSION: Phoenix, AZ, USA, 2018; Available online: https://onepetro.org/NACECORR/proceedings-abstract/CORR18/All-CORR18/NACE-2018-11167/126508 (accessed on 10 July 2022).
  14. Elango, K.; Vivek, D.; Prakash, G.K.; Paranidharan, M.; Pradeep, S.; Prabhukesavaraj, M. Strength and permeability studies on PPC binder pervious concrete using palm jaggery as an admixture. Mater. Today Proc. 2020, 37, 2329–2333. [Google Scholar] [CrossRef]
  15. Adil, G.; Kevern, J.T.; Mann, D. Influence of silica fume on mechanical and durability of pervious concrete. Constr. Build. Mater. 2020, 247, 118453. [Google Scholar] [CrossRef]
  16. Zhang, H.; Hadi, M.N.S. Geogrid-confined pervious geopolymer concrete piles with FRP-PVCconfined concrete core: Concept and behaviour. Constr. Build. Mater. 2019, 211, 12–25. [Google Scholar] [CrossRef]
  17. Hadi, M.N.S.; Farhan, N.A.; Sheikh, M.N. Design of geopolymer concrete with GGBFS at ambient curing condition using Taguchi method. Constr. Build. Mater. 2017, 140, 424–431. [Google Scholar] [CrossRef] [Green Version]
  18. Anwar, F.H.; Malami, S.I.; Baba, Z.B.; Farouq, M.M.; Labbo, M.S.; Aliyu, D.S.; Umar, A.B. Compressive Strength of Lightweight Concrete and Benefit of Partially Replacing Cement by Animal Bone Aah (ABA). J. Emerg. Technol. Innov. Res. 2019, 6, 554–560. [Google Scholar]
  19. Panagiotopoulou, C.; Tsivilis, S.; Kakali, G. Application of the Taguchi approach for the composition optimization of alkali activated fly ash binders. Constr. Build. Mater. 2015, 91, 17–22. [Google Scholar] [CrossRef]
  20. Garces, J.I.T.; Dollente, I.J.; Beltran, A.B.; Tan, R.R.; Promentilla, M.A.B. Life cycle assessment of self-healing geopolymer concrete. Clean. Eng. Technol. 2021, 4, 100147. [Google Scholar] [CrossRef]
  21. Sun, Z.; Lin, X.; Vollpracht, A. Pervious concrete made of alkali activated slag and geopolymers. Constr. Build. Mater. 2018, 189, 797–803. [Google Scholar] [CrossRef]
  22. Zaetang, Y.; Wongsa, A.; Sata, V.; Chindaprasirt, P. Use of coal ash as geopolymer binder and coarse aggregate in pervious concrete. Constr. Build. Mater. 2015, 96, 289–295. [Google Scholar] [CrossRef]
  23. Ganesh, A.C.; Deepak, N.; Deepak, V.; Ajay, S.; Pandian, A. Utilization of PET bottles and plastic granules in geopolymer concrete. Mater. Today Proc. 2020, 42, 444–449. [Google Scholar] [CrossRef]
  24. Chen, X.; Guo, Y.; Ding, S.; Zhang, H.Y.; Xia, F.Y.; Wang, J.; Zhou, M. Utilization of red mud in geopolymer-based pervious concrete with function of adsorption of heavy metal ions. J. Clean. Prod. 2018, 207, 789–800. [Google Scholar] [CrossRef]
  25. Ganesh, A.C.; Kumar, M.V.; Devi, R.K.; Srikar, P.; Prasad, S.; Sarath, R. Pervious Geopolymer Concrete under Ambient Curing. Mater. Today Proc. 2021, 46, 2737–2741. [Google Scholar] [CrossRef]
  26. Rahman, S.S.; Khattak, M.J. Roller compacted geopolymer concrete using recycled concrete aggregate. Constr. Build. Mater. 2021, 283, 122624. [Google Scholar] [CrossRef]
  27. Soundararajan, E.K.; Vaiyapuri, R. Geopolymer binder for pervious concrete. J. Croat. Assoc. Civ. Eng. 2021, 73, 209–218. [Google Scholar]
  28. El-Hassan, H.; Ismail, N. Effect of process parameters on the performance of fly ash/GGBS blended geopolymer composites. J. Sustain. Cem. Mater. 2017, 7, 122–140. [Google Scholar] [CrossRef]
  29. Malayali, A.B.; Chokkalingam, R.B. Mechanical properties of geopolymer pervious concrete. Int. J. Civ. Eng. Technol. 2018, 9, 2394–2400. [Google Scholar]
  30. Taiwo, A.E.; Madzimbamuto, T.N.; Ojumu, T.V. Optimization of process variables for acetoin production in a bioreactor using Taguchi orthogonal array design. Heliyon 2020, 6, e05103. [Google Scholar] [CrossRef]
  31. Ahmad, S.; Alghamdi, S.A. A Statistical Approach to Optimizing Concrete Mixture Design. Sci. World J. 2014, 2014, 7. [Google Scholar] [CrossRef] [Green Version]
  32. El-Mir, A.; El-Hassan, H.; El-Dieb, A.; Alsallamin, A. Development and Optimization of Geopolymers Made with Desert Dune Sand and Blast Furnace Slag. Sustainability 2022, 14, 7845. [Google Scholar] [CrossRef]
  33. Şimşek, B.; Uygunoğlu, T. Multi-response optimization of polymer blended concrete: A TOPSIS based Taguchi application. Constr. Build. Mater. 2016, 117, 251–262. [Google Scholar] [CrossRef]
  34. Sharifi, E.; Sadjadi, S.J.; Aliha, M.; Moniri, A. Optimization of high-strength self-consolidating concrete mix design using an improved Taguchi optimization method. Constr. Build. Mater. 2019, 236, 117547. [Google Scholar] [CrossRef]
  35. ASTM C618; Standard Specification for Coal Fly Ash and Raw or Calcined Natural Pozzolan for Use in Concrete. ASTM International: West Conshohocken, PA, USA, 2014.
  36. El-Hassan, H.; Elkholy, S. Enhancing the performance of Alkali-Activated Slag-Fly ash blended concrete through hybrid steel fiber reinforcement. Constr. Build. Mater. 2021, 311, 125313. [Google Scholar] [CrossRef]
  37. ASTM C33; Standard Specification for Concrete Aggregates. ASTM International: West Conshohocken, PA, USA, 2018.
  38. Dhemla, P.; Somani, P.; Swami, B.; Gaur, A. Optimizing the design of sintered fly ash light weight concrete by Taguchi and ANOVA analysis. Mater. Today Proc. 2022, 62, 495–503. [Google Scholar] [CrossRef]
  39. Ismail, N.; El-Hassan, H. Development and Characterization of Fly Ash–Slag Blended Geopolymer Mortar and Lightweight Concrete. J. Mater. Civ. Eng. 2018, 30, 04018029. [Google Scholar] [CrossRef]
  40. El-Hassan, H.; Elkholy, S. Performance Evaluation and Microstructure Characterization of Steel Fiber–Reinforced Alkali-Activated Slag Concrete Incorporating Fly Ash. J. Mater. Civ. Eng. 2019, 31, 04019223. [Google Scholar] [CrossRef]
  41. El-Hassan, H.; Shehab, E.; Al-Sallamin, A. Effect of curing regime on the performance and microstructure characteristics of alkali-activated slag-fly ash blended concrete. J. Sustain. Cem. Mater. 2021, 10, 289–317. [Google Scholar] [CrossRef]
  42. Ling, Y.; Wang, K.; Li, W.; Shi, G.; Lu, P. Effect of slag on the mechanical properties and bond strength of fly ash-based engineered geopolymer composites. Compos. Part B Eng. 2019, 164, 747–757. [Google Scholar] [CrossRef]
  43. Younis, K.H. Influence of sodium hydroxide (NaOH) molarity on fresh properties of self-compacting slag-based geopolymer concrete containing recycled aggregate. Mater. Today Proc. 2021, 56, 1733–1737. [Google Scholar] [CrossRef]
  44. Ekmen, S.; Mermerdaş, K.; Algın, Z. Effect of oxide composition and ingredient proportions on the rheological and mechanical properties of geopolymer mortar incorporating pumice aggregate. J. Build. Eng. 2020, 34, 101893. [Google Scholar] [CrossRef]
  45. ACI Committee 522. 522R-10: Report on Pervious Concrete; Technical Documents; American Concrete Institute: Farmington Hills, MI, USA, 2010; p. 38. [Google Scholar]
  46. BS EN 12390-3:2009; British Standard. Testing Hardened Concrete. Part 3: Compressive Strength of Test Specimens. British Standards Institution: London, UK, 2011.
  47. Najm, O.; El-Hassan, H.; El-Dieb, A. Optimization of alkali-activated ladle slag composites mix design using taguchi-based TOPSIS method. Constr. Build. Mater. 2022, 327, 126946. [Google Scholar] [CrossRef]
  48. Hardjito, D.; Wallah, S.E.; Sumajouw, D.M.J. On the development of fly ash-based geopolymer concrete. ACI Mater. J. 2004, 101, 467–472. [Google Scholar]
  49. Joseph, B.; Mathew, G. Influence of aggregate content on the behavior of fly ash based geopolymer concrete. Sci. Iran. 2012, 19, 1188–1194. [Google Scholar] [CrossRef] [Green Version]
  50. El-Hassan, H.; Kianmehr, P. Pervious concrete pavement incorporating GGBS to alleviate pavement runoff and improve urban sustainability. Road Mater. Pavement Des. 2016, 19, 167–181. [Google Scholar] [CrossRef]
  51. ASTM C131; Standard Test Method for Resistance to Degradation of Small-Size Coarse Aggregate by Abrasion and Impact in the Los Angeles Machine. ASTM International: West Conshohocken, PA, USA, 2014.
  52. Phadke, M.S. Quality Engineering Using Robust Design, 1st ed.; Prentice-Hall: Englewood Cliffs, NJ, USA, 1989. [Google Scholar]
  53. Dedania, H.V.; Shah, V.R.; Sanghvi, R.C. Portfolio Management: Stock Ranking by Multiple Attribute Decision Making Methods. Technol. Invest. 2015, 6, 141–150. [Google Scholar] [CrossRef] [Green Version]
  54. Kabir, S.M.A.; Alengaram, U.J.; Jumaat, M.Z.; Sharmin, A.; Islam, A. Influence of Molarity and Chemical Composition on the Development of Compressive Strength in POFA Based Geopolymer Mortar. Adv. Mater. Sci. Eng. 2015, 2015, 15. [Google Scholar] [CrossRef] [Green Version]
  55. Fang, G.; Ho, W.K.; Tu, W.; Zhang, M. Workability and mechanical properties of alkali-activated fly ash-slag concrete cured at ambient temperature. Constr. Build. Mater. 2018, 172, 476–487. [Google Scholar] [CrossRef]
  56. El-Hassan, H.; Hussein, A.; Medljy, J.; El-Maaddawy, T. Performance of Steel Fiber-Reinforced Alkali-Activated Slag-Fly Ash Blended Concrete Incorporating Recycled Concrete Aggregates and Dune Sand. Buildings 2021, 11, 327. [Google Scholar] [CrossRef]
  57. El-Hassan, H.; Medljy, J.; El-Maaddawy, T. Properties of Steel Fiber-Reinforced Alkali-Activated Slag Concrete Made with Recycled Concrete Aggregates and Dune Sand. Sustainability 2021, 13, 8017. [Google Scholar] [CrossRef]
  58. El-Hassan, H.; Kianmehr, P.; Zouaoui, S. Properties of pervious concrete incorporating recycled concrete aggregates and slag. Constr. Build. Mater. 2019, 212, 164–175. [Google Scholar] [CrossRef]
  59. Akkaya, A.; Çağatay, I.H. Investigation of the density, porosity, and permeability properties of pervious concrete with different methods. Constr. Build. Mater. 2021, 294, 123539. [Google Scholar] [CrossRef]
  60. Aliabdo, A.A.; Elmoaty, A.E.M.A.; Fawzy, A.M. Experimental investigation on permeability indices and strength of modified pervious concrete with recycled concrete aggregate. Constr. Build. Mater. 2018, 193, 105–127. [Google Scholar] [CrossRef]
  61. Anwar, F.H.; El-Hassan, H.; Hamouda, M.; Hinge, G.; Mo, K.H. Meta-Analysis of the Performance of Pervious Concrete with Cement and Aggregate Replacements. Buildings 2022, 12, 461. [Google Scholar] [CrossRef]
  62. Chuah, S.; Duan, W.; Pan, Z.; Hunter, E.; Korayem, A.; Zhao, X.; Collins, F.; Sanjayan, J. The properties of fly ash based geopolymer mortars made with dune sand. Mater. Des. 2016, 92, 571–578. [Google Scholar] [CrossRef]
Figure 1. Images of the (a) representative cubic sample, (b) compression machine, (c) permeability setup [50], and (d) abrasion machine.
Sustainability 14 08767 g001
Figure 2. Framework of the study.
Sustainability 14 08767 g002
Figure 3. Bivariate relationships between mix design factors and compressive strength.
Sustainability 14 08767 g003aSustainability 14 08767 g003b
Figure 4. Correlation between compressive strength and permeability.
Sustainability 14 08767 g004
Figure 5. Bivariate relationships between the mix design factors and permeability.
Sustainability 14 08767 g005aSustainability 14 08767 g005b
Figure 6. Correlation between compressive strength and abrasion resistance.
Sustainability 14 08767 g006
Figure 7. Bivariate relationships between mix design factors and abrasion resistance.
Sustainability 14 08767 g007
Figure 8. S/N ratios of Taguchi analysis for (a) compressive strength, (b) permeability, and (c) abrasion resistance.
Sustainability 14 08767 g008aSustainability 14 08767 g008b
Figure 9. Contribution of factors toward Taguchi optimization of the mix for superior (a) compressive strength, (b) permeability, and (c) abrasion resistance.
Sustainability 14 08767 g009
Figure 10. S/N ratios of TOSIS analysis for scenarios (a) 1, (b) 2, (c) 3, and (d) 4.
Sustainability 14 08767 g010
Table 1. Chemical and physical characteristics of FA, GBFS, and dune sand.
Component, UnitFAGBFSDune Sand
SiO2, (wt.%)48.027.864.9
CaO, (wt.%)3.358.614.1
Al2O3, (wt.%)23.18.13.0
Fe2O3, (wt.%)12.51.30.7
MgO, (wt.%)1.56.01.3
Na2O, (wt.%)0.00.20.4
Others, (wt.%)10.50.315.5
LOI, (wt.%)1.10.90.0
Specific gravity2.322.702.77
Unit weight, kg/m3126212091660
Table 2. Taguchi analysis parameters.
FactorLevel 1Level 2Level 3
Binder content (kg/m3)400450500
Dune sand addition (wt.%)01020
AAS/B ratio0.500.550.60
SH Molarity (M)81012
Table 3. Mix design of pervious geopolymer concrete.
Mix No.Binder Content (kg/m3)Dune Sand
Addition (wt.%)
AAS/B RatioSH
Molarity (M)
140000.508
2400100.5510
3400200.6012
445000.5512
5450100.608
6450200.5010
750000.6010
8500100.5012
9500200.558
Table 4. Summary of experimental results for PGC mixes.
Mix
No.
Binder Content (kg/m3)Dune Sand
Addition (wt.%)
AAS/B
Ratio
SH
Molarity
(M)
Compressive Strength (MPa)Permeability (mm/s)Abrasion Resistance (%)
140000.50812.77.2314.4
2400100.551016.56.6221.2
3400200.601226.45.1535.3
445000.551222.15.6328.1
5450100.60822.85.4129.6
6450200.501040.73.0255.0
750000.601021.45.7627.5
8500100.501232.24.2543.5
9500200.55838.63.2350.0
Table 5. Normalized weights for response criteria in TOPSIS analysis.
Response CriterionNormalized Weights for Each Criterion
Target ValuesScenario 1Scenario 2Scenario 3Scenario 4
Compressive StrengthLarger is better0.800.100.100.33
PermeabilityLarger is better0.100.800.100.33
AbrasionResistanceLarger is better0.100.100.800.33
Table 6. Decision matrix for the three criteria responses.
Mix No.S/N 1
(Compressive Strength)
S/N 2
(Permeability)
S/N 3
(Abrasion Resistance)
122.0817.1823.17
224.3516.4226.53
328.4314.2430.96
426.8915.0128.97
527.1614.6629.43
632.199.6034.81
726.6115.2128.79
830.1612.5732.77
931.7310.1833.98
Table 7. Closeness coefficients of the four optimization scenarios.
Mix No.Scenario 1Scenario 2Scenario 3Scenario 4
10.15520.89030.14720.5035
20.26540.86900.31470.5589
30.62820.61270.66700.6305
40.48400.70960.50420.5971
50.50840.66510.54100.5933
60.84480.10970.85280.4965
70.45860.73470.48990.5976
80.77780.39920.80170.5839
90.84440.13080.84190.5015
Table 8. Regression models for the prediction of different properties of PGC.
Compressive StrengthPermeabilityAbrasion Resistance
α0(A)1.122−0.1791.687
α1(B)0.194−0.0350.447
α2(C)−921.000176.000−1457.000
α3(D)0.8000.2204.400
α4(A2)−0.0010.001−0.002
α5(B2)0.032−0.0040.036
α6(C2)791.000−154.0001261.000
α7(D2)−0.015−0.014−0.168
R20.990.980.99
RMSE1.040.371.20
Publisher’s Note: MDPI stays neutral with regard to jurisdictional claims in published maps and institutional affiliations.

