Article

Experiment and Model Study on the Destination of 3,5,6-Trichloro-2-pyridinol in the Purple Soil of Southwestern China with a High Ratio of Biochar Applied

1
College of Resources and Environmental Engineering, Guizhou University, Guiyang 550025, China
2
Key Laboratory of Karst Geological Resources and Environment (Ministry of Education), Guizhou University, Guiyang 550025, China
3
Chengdu Surveying Geotechnical Research Institute of MCC, Chengdu 610023, China
4
College of Tea Science, Guizhou University, Guiyang 550025, China
*
Author to whom correspondence should be addressed.
Sustainability 2022, 14(14), 8712; https://doi.org/10.3390/su14148712
Submission received: 23 February 2022 / Revised: 19 June 2022 / Accepted: 21 June 2022 / Published: 16 July 2022
(This article belongs to the Special Issue Future Directions for Soil Remediation and Environmental Management)

Abstract

:
3,5,6-Trichloro-2-pyridinol (TCP), the main degradation production of the pesticide chlorpyrifos and the herbicide triclopyr, features anti-degradation and high water solubility that challenge the in situ prevention of the migration of TCP from soils to water bodies. Biochar is a widely used amendment, but previous studies focused on the low content of biochar application that restricted the off-site prevention. In this study, therefore, both experiments and models were employed to explore the destination of TCP in purple soil, an Entisol with low organic matter content, large pores, and high water conductivity in southwestern China with a high ratio of biochar applied. Soil columns were homogeneously packed by mixing biochar at 0, 1%, 2%, 3%, 4%, 5%, 7.5%, 10%, 15%, and 20%, then the impulsive input of the breakthrough curves was used to explore the adsorption and desorption process of TCP, and the release of adsorbed TCP was traced by Br. Following the dynamic outflow during the adsorption processes was simulated using the cumulative distribution function of gamma distribution, and the release of TCP was simulated by coupling the mass balance equation and first-order decay kinetics equation. The results revealed that the adsorption ability of the soil increased exponentially with the content of mixed biochar, implying a much larger increment at high content. For the removal rate of 90%, e.g., the increment was about 20 mg/kg when the content of biochar was raised from 15% to 20%, while it was about 7 mg/kg when the content was raised from 0 to 5%. The dynamic release and the unreleasable TCP could be well simulated by the first-order decay kinetics equation and the logarithmic model, respectively. The releasable TCP showed an increase–decrease pattern, and the maximum was observed at a 5% biochar content. These results above will provide a systematic experimental scheme, model support, and data reference to control organic pollutants with high solubility, stability, and strong migration using biochar in an off-site pattern such as an ecological ditch system.

1. Introduction

Pesticides and their degradation products have posed a substantial potential risk to human health due to their widespread use in agriculture [1,2,3]. 3,5,6-Trichloro-2-pyridinol (TCP) is the main degradation product of the pesticides chlorpyrifos and chlorpyrifos-methyl, as well as the herbicide triclopyr [4,5]. TCP exhibits the typical characteristics of anti-degradation ability, high water solubility, and easy leaching, which lead to the potential environmental pollution of both soils and water bodies [6,7,8,9]. As a consequence, TCP has been found to lower testosterone levels in the human body [10,11]. Purple soil (an Entisol according to the USDA soil taxonomy) is mainly distributed in the hilly central Sichuan located in southwestern China, with a total area of 160,000 km2. The characteristics of low organic matter, poor aggregation, and large pores lead to purple soil being very vulnerable to water erosion [12,13]. In addition, vertical subsurface flows through abundant soil macropores and fine fractures in the underlying mudrock are the dominant flow patterns on sloping farmland during rainfall, posing a high risk of contaminant transport [14,15]. Hence, it is necessary and imperative to find an environmentally friendly soil-remediation agent to prevent and reduce the risk of TCP transportation effectively from the field to water bodies.
Biochar, a pyrolyzed product prepared from agricultural wastes [16,17], is considered to be a potential amendment material due to its relatively large surface area and micropore volume, high exchange capacity (CEC), and abundant surface functional groups [18,19,20,21]. Thus, the application of biochar in agriculture soil can increase the soil’s pH, organic matter, CEC, and nutrient utilization [22,23,24]; mitigate greenhouse gas emissions [25]; and then reduce the mobility of pesticides and their degradation products from the soil to groundwater through pore filling, partitioning, the hydrophobic effect, H-bonding, electrostatic attraction, specific interaction, and surface precipitation [26,27,28,29]; such pesticides and their degradation products include pyrazosulfuron-ethyl [16], glyphosate [30], atrazine [31], and TCP [9]. Therefore, as an environmentally friendly soil amendment, biochar is progressively gaining attention from policy makers and scientific communities.
To better evaluate the impact of biochar amendment on the fate of pesticides in the soil, it is necessary to characterize the sorption and desorption process of pesticides and their redistributions in the environment [8,32], from which important information can be obtained to characterize the mobility and conversion of pesticides, such as chemical transport, leaching, bioavailability in the soil, absorption, and utilization of pesticides by plants [24,33]. The most widely used laboratory method to test the adsorption/desorption of pesticides is the batch experiment (equilibrium and kinetic), according to OECD guideline 106 [34], from which the adsorption and desorption at a specific concentration can be identified. A number of studies have revealed that biochar addition can improve the sorption ability of the soil to most pesticides, and that the Freundlich coefficient Kf increases with the rate of biochar application [35,36,37] and can be up to 2–250 times compared to control treatment [38,39,40]. In addition, biochar addition has little effect on sorption of several pesticides or metabolites; e.g., imazamox and metazachlor sulfonic acid, due to the negative net charge [2].
As for desorption, it cannot be simply considered as a reversible process of adsorption because the desorption process is much more complex. Usually, reversible sorption of pesticides on biochar mixed with soil occurs through the deformation of the pore system resulting from the swelling of sorbent and weak binding between the pesticides and biochar components [24,41,42,43,44,45]. The reversibility is quantified by the hysteresis coefficient (H), and an increase in the H value can be explained as a sign of partial reversibility [40]. Several studies have reported that the addition of biochar in soil could promote the desorption coefficient of pesticides such as isoproturon, diuron, pyrimethanil, and atrazine [41,46,47], and the H value increased with the addition rates of the biochar [48]. On the contrary, the addition of biochar could reduce the desorption of specific pesticides; e.g., pyrimethanil, MCPA (4-chloro-2-methylph-enoxy acetic acid), terbuthylazine, and carbendazim [37,42,49], or had no effect on desorption of Methyl-desphenyl-chloridazon and metazachlor oxalic acid [2]. However, most of the studies above were based on batch experiments, and the addition rate of the biochar was less than 5%. These experiments were different from the adsorption and desorption in the field. In addition, as for TCP, the characteristics of high water solubility and easy leaching challenge the in situ remediation and require an off-site pattern that mixes a higher content of soil amendment [8,9]. However, the unknown destination of TCP in the soil mixed with a high ratio of biochar restricts the model simulation and the application in agricultural engineering.
Therefore, the objectives of this study were to systematically explore the adsorption behaviors of TCP and its releases from the high content biochar applied purple soil through breakthrough curve experiments, and to identify the appropriate models to simulate the destination quantitatively. The results and conclusions provide a systematic experimental scheme, model support, and data reference to control the migration of organic pollutants with high water solubility, stability, and strong migration through an off-site pattern such as an ecological ditch system.

2. Materials and Methods

2.1. Experiments

2.1.1. Preparations of the Soil Columns

In this study, a series of packed soil columns were used to explore the relationship between the destination of TCP and the ratio of biochar application, including a series of mass contents of 0%, 1%, 2%, 3%, 5%, 7.5%, 10%, 15%, and 20%. The soil and biochar were mixed homogeneously in a glass column at a bulk density of 1.35 g/m3 for all the soil samples. In order to keep the water flow as a one-dimensional movement, the inner diameter of glass column was 3.8 cm and the length was 10 cm. The soil investigated in this research study was a loamy soil with a content of clay, silt, and sand of 19.67%, 30.75%, and 49.58%, respectively. The soil pH was 7.52, the bulk density was 1.35 g cm−3, and the SOM content was 9.46 g kg−1. More details about the characteristics of the soil and biochar are presented in our previous study [9]. The experiments below were carried out at room temperature (20 °C) and a humidity of 70%.

2.1.2. Breakthrough Curve Experiment

Before the breakthrough curve (BTC) experiments, the packed soil column was saturated with a background solution of CaCl2 at 0.01 mol/L, which equaled the average ionic strength of the natural rainfall in the study area. Then, the impulse input of the TCP was carried out. In the first period, the input solution was TCP (about 25 mg/L) mixed with Br at a concentration of 30 mg/L and with a background solution of CaCl2. After inputting about 6.0 PV (about 6.75 PV for soil mixed with 20% biochar) of the mixed solutions, the input solution in the upper boundary of the soil column was replaced with the background solution of CaCl2. The input rate of the solution was 5.6 mm/h, which approximated the average level of a rainfall storm in the study area. The outflows were sampled every 0.3125 PV (about 15 mL) for concentration measurement. A diagram of the BTC experiment was presented in our previous study [7].

2.1.3. Measurement of the TCP and Br

The outflow concentration of TCP was performed using HPLC/UV spectroscopy (Waters 2695, Milford, MA, USA) with a detection limit of 0.001 mg/L [9]. The concentration of Br was tested with an ion meter (Bante 931, Shanghai, China).

2.2. Simulation of the BTCs in Adsorption Process

In the first period of the BTCs, the relative concentration of TCP in the outflow was equal to the value of the outflow divided by that of the inputted solution, and increased from 0 to 1 (-). Thus, the outflow of TCP could be considered as a cumulative distribution function (CDF). In this study, gamma distribution was selected to describe the outflow process due to its advantage of a flexible shape of the probability density function (PDF), which combined both the arithmetic mean and geometric mean of a variable based on the principle of maximum information entropy [50,51,52]. The PDF (f(x)) and the CDF (F(x)) of a three-parameter gamma distribution is given below:
f ( x ) = 1 Γ ( α ) β α ( x γ ) α 1 e ( x γ ) β
F ( x ) = 0 + 1 Γ ( α ) β α ( x γ ) α 1 e ( x γ ) β d x
where α is the shape parameter, β is the scale parameter, γ is the location factor (γ ≥ 0), and Γ(α) is the gamma function:
Γ ( α ) = 0 + t α 1 e t d t

2.3. Tracing the Release of TCP and its Simulation

2.3.1. Tracing the Release of TCP

In the BTC experiments, the TCP in the soil column included two parts: adsorbed on the surface of soil particles and dissolved in the pore water. After inputting the background solution, the outflow of TCP also originated from two sources: dissolved and adsorbed TCP. The dissolved TCP could be traced by the Br because there was no source of Br in the natural geochemical processes [53,54], and both dissolved TCP and Br can be considered as distributing homogeneously in porous water. Based on the mass balance, the desorbed TCP thus could be calculated using the difference between the total outflow and dissolved TCP [8]:
S d i s = S T S r e l
where ST is the total solute, and Sdis and Srel represent the dissolved TCP in porous water and the released TCP from the surface of soil particles, respectively.
ST was measured from the outflow of the BTCs in the second period, while the dissolved (Sdis) was calculated from the concentration of Br in the outflow multiplied by a scale factor. More details used in determining the two parameters are given in our previous study [8].

2.3.2. The First-Order Decay Kinetics

The adsorbed TCP on the surface of soil mixed with biochar also included two parts: releasable and unreleasable TCP. The former followed the first-order decay kinetics, and the decay constant was determined by the characteristics of the pesticide and soil. The latter was correlated with the characteristics of the soil, and was considered as a constant for a specific soil.
Assuming the residual TCP is Qr, the area of the soil surface is A, thus the concentration of TCP on the surface of soil particle can be calculated as shown below:
C ( t ) = Q r ( t ) A t
where C(t) is the concentration of TCP on the surface of the soil particle (in mg·Kg−1/m2), and t is the time (in PV).
Then, based on the first-order decay kinetics equation:
C ( t ) t = K C ( t )
where K is the first-order decay constant.
Combine Equations (5) and (6):
C ( t ) t = Q r ( t ) A t t = 1 A t Q r ( t ) t
The right hand of Equation (6) can also be written as:
K C ( t ) = K Q r ( t ) A t
Thus, substitute Equations (7) and (8) into Equation (6):
1 A t Q r ( t ) t = K Q r ( t ) A t Q r ( t ) t = K Q r ( t )
Equation (9) can be transformed as below:
Q r ( t ) Q r ( t ) = K t
Following integration on both sides of Equation (10), we can then obtain:
Q r ( t ) = e K t
At the beginning time, the total releasable TCP is A0; when the time approaches +∞, some TCP still cannot be released, and the unreleasable amount of TCP is C. Therefore, the release of TCP can be written as:
Q r ( t ) = A 0 e K t + C

3. Results

3.1. The BTCs of TCP and Br

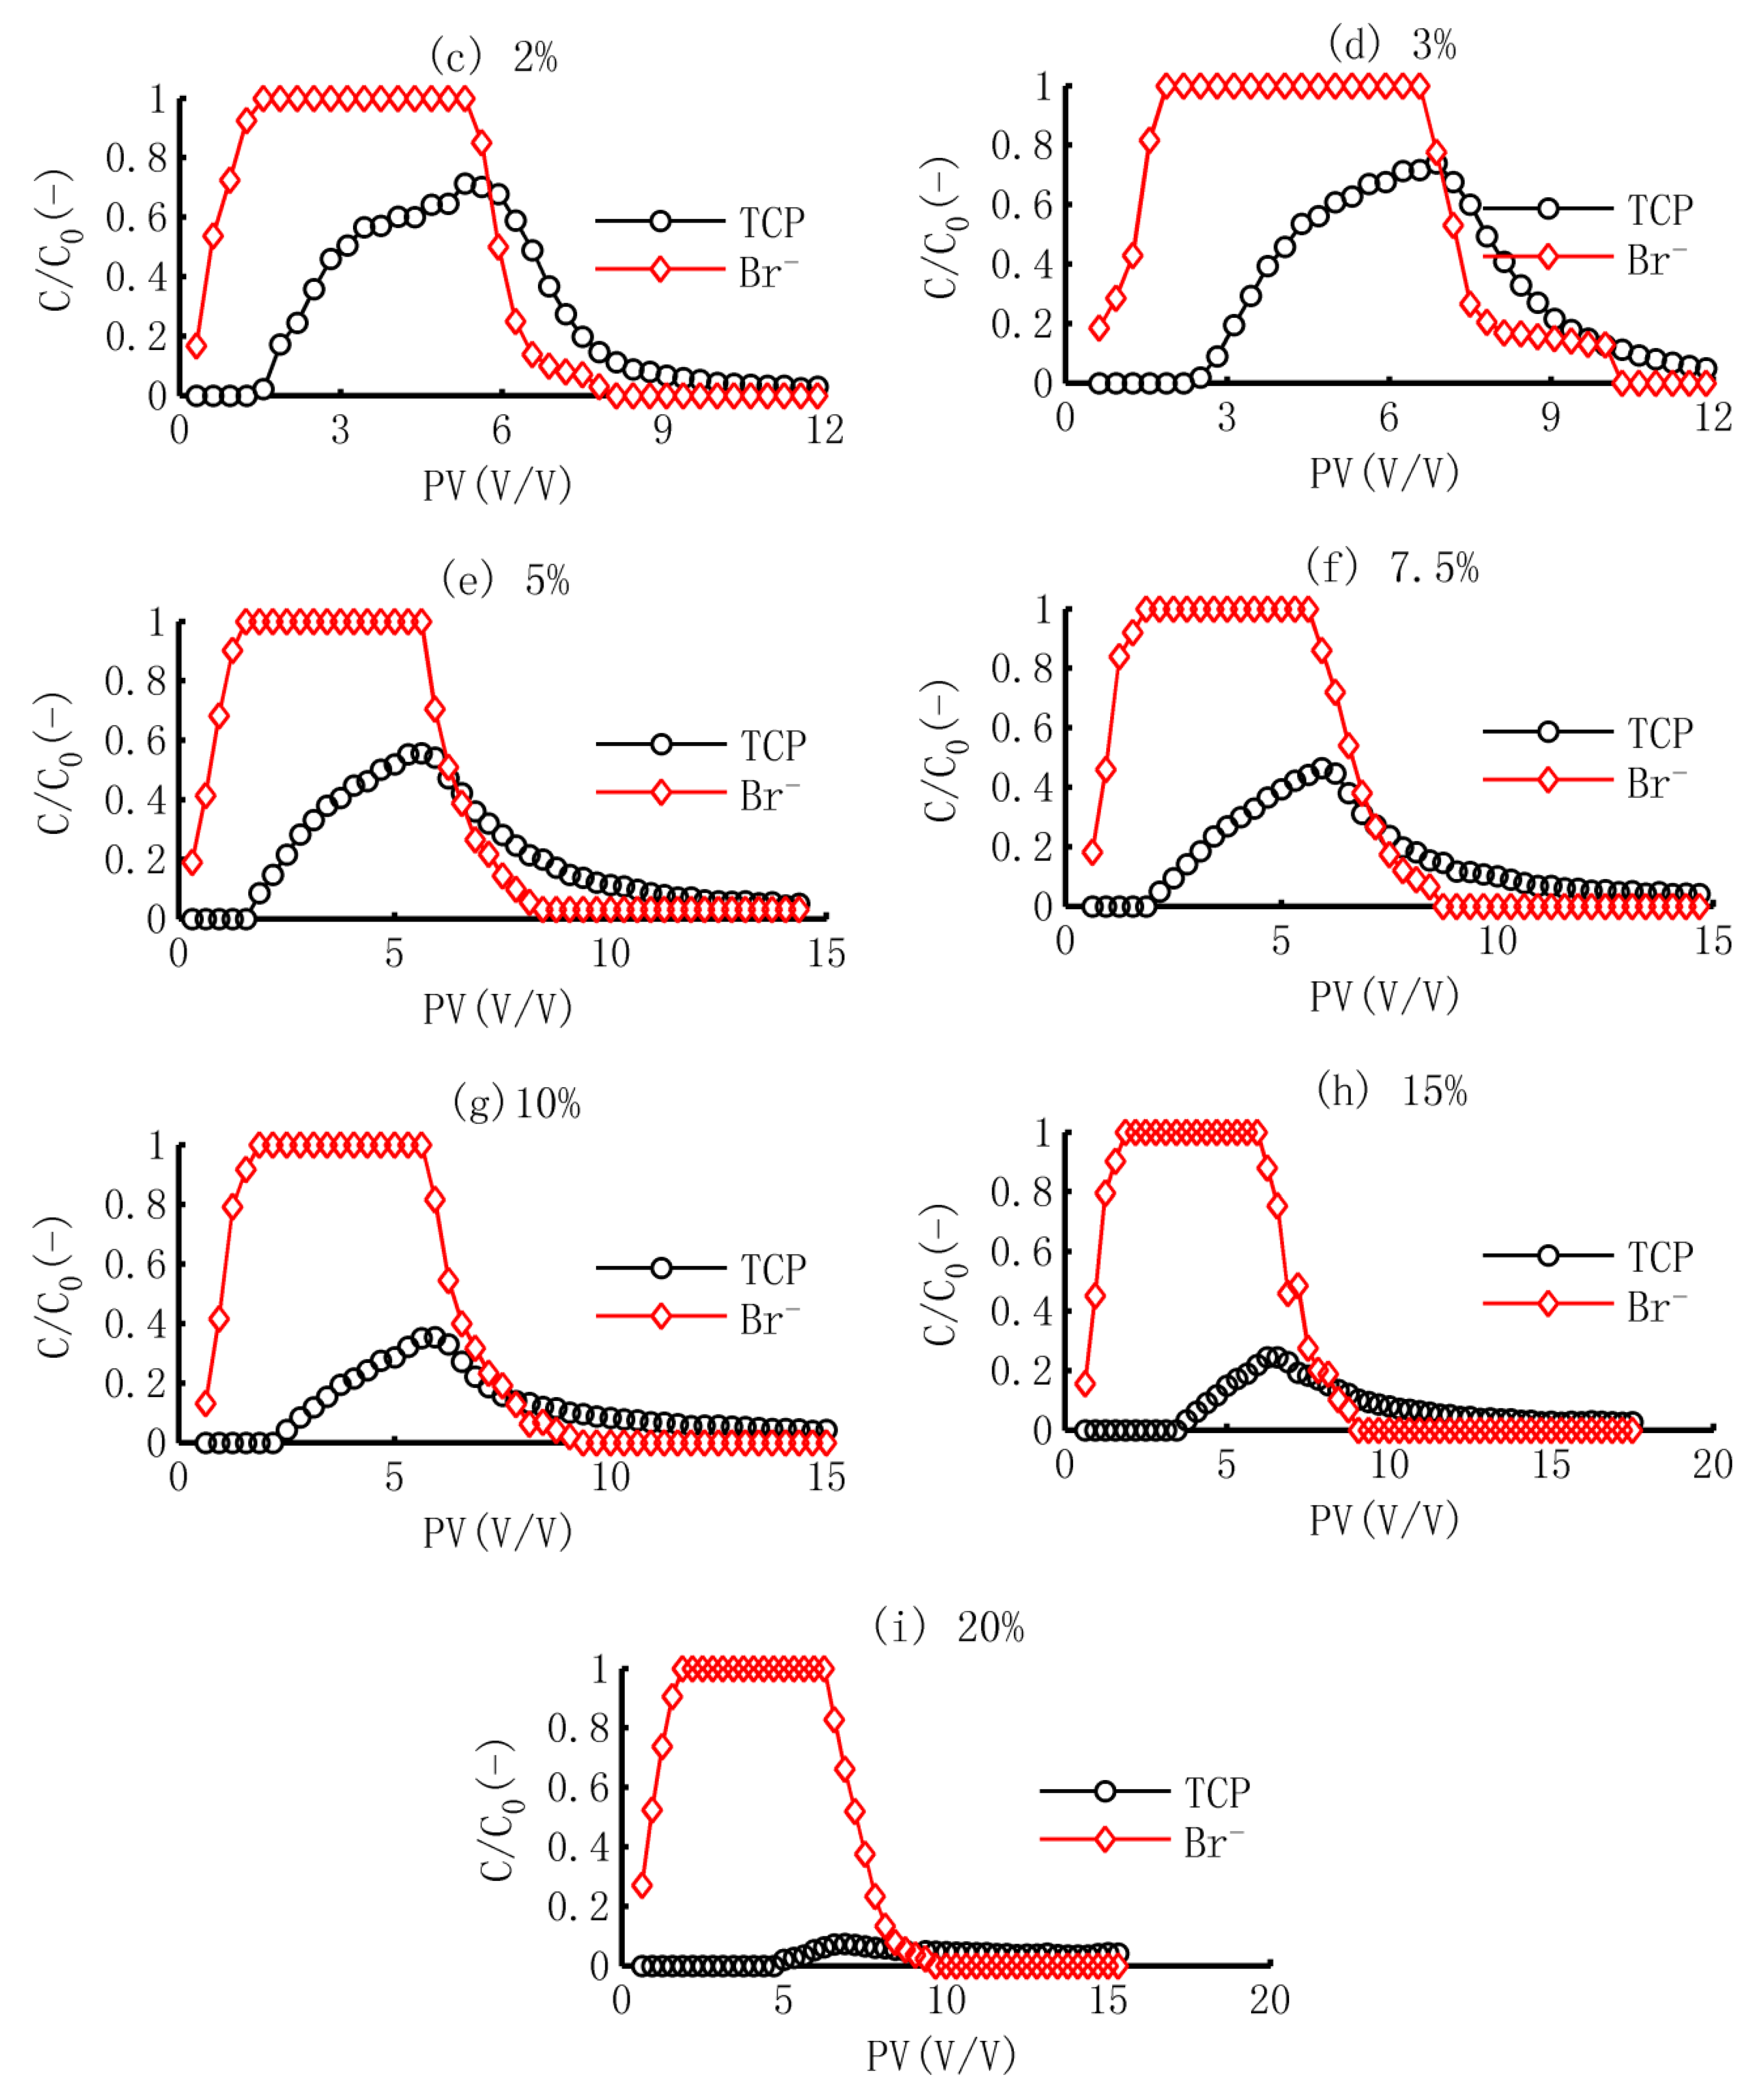
The BTCs of both TCP and Br in the biochar mixed with purple soil are given in Figure 1. As for Br, the BTCs reached the maximum area at about 1–1.25 PV, and the dissolved Br discharge from the soil column at about 2–3 PV after inputting of the background solution. On the other hand, the concentration of TCP in the outflow decreased gradually with the increase in the biochar application rate; the peak value was reduced by 11.11%, 22.22%, 27.78%, 38.89%, 52.22%, 58.89%, 72.22%, and 91.11% compared to the control sample, respectively. The reason was that the biochar exhibited a larger specific surface and a stronger binding capacity [9,16,55], which increased the adsorption ability of the soil [35,36,37].

3.2. Simulation of TCP in Adsorption Process

(1)
Performance of the Model
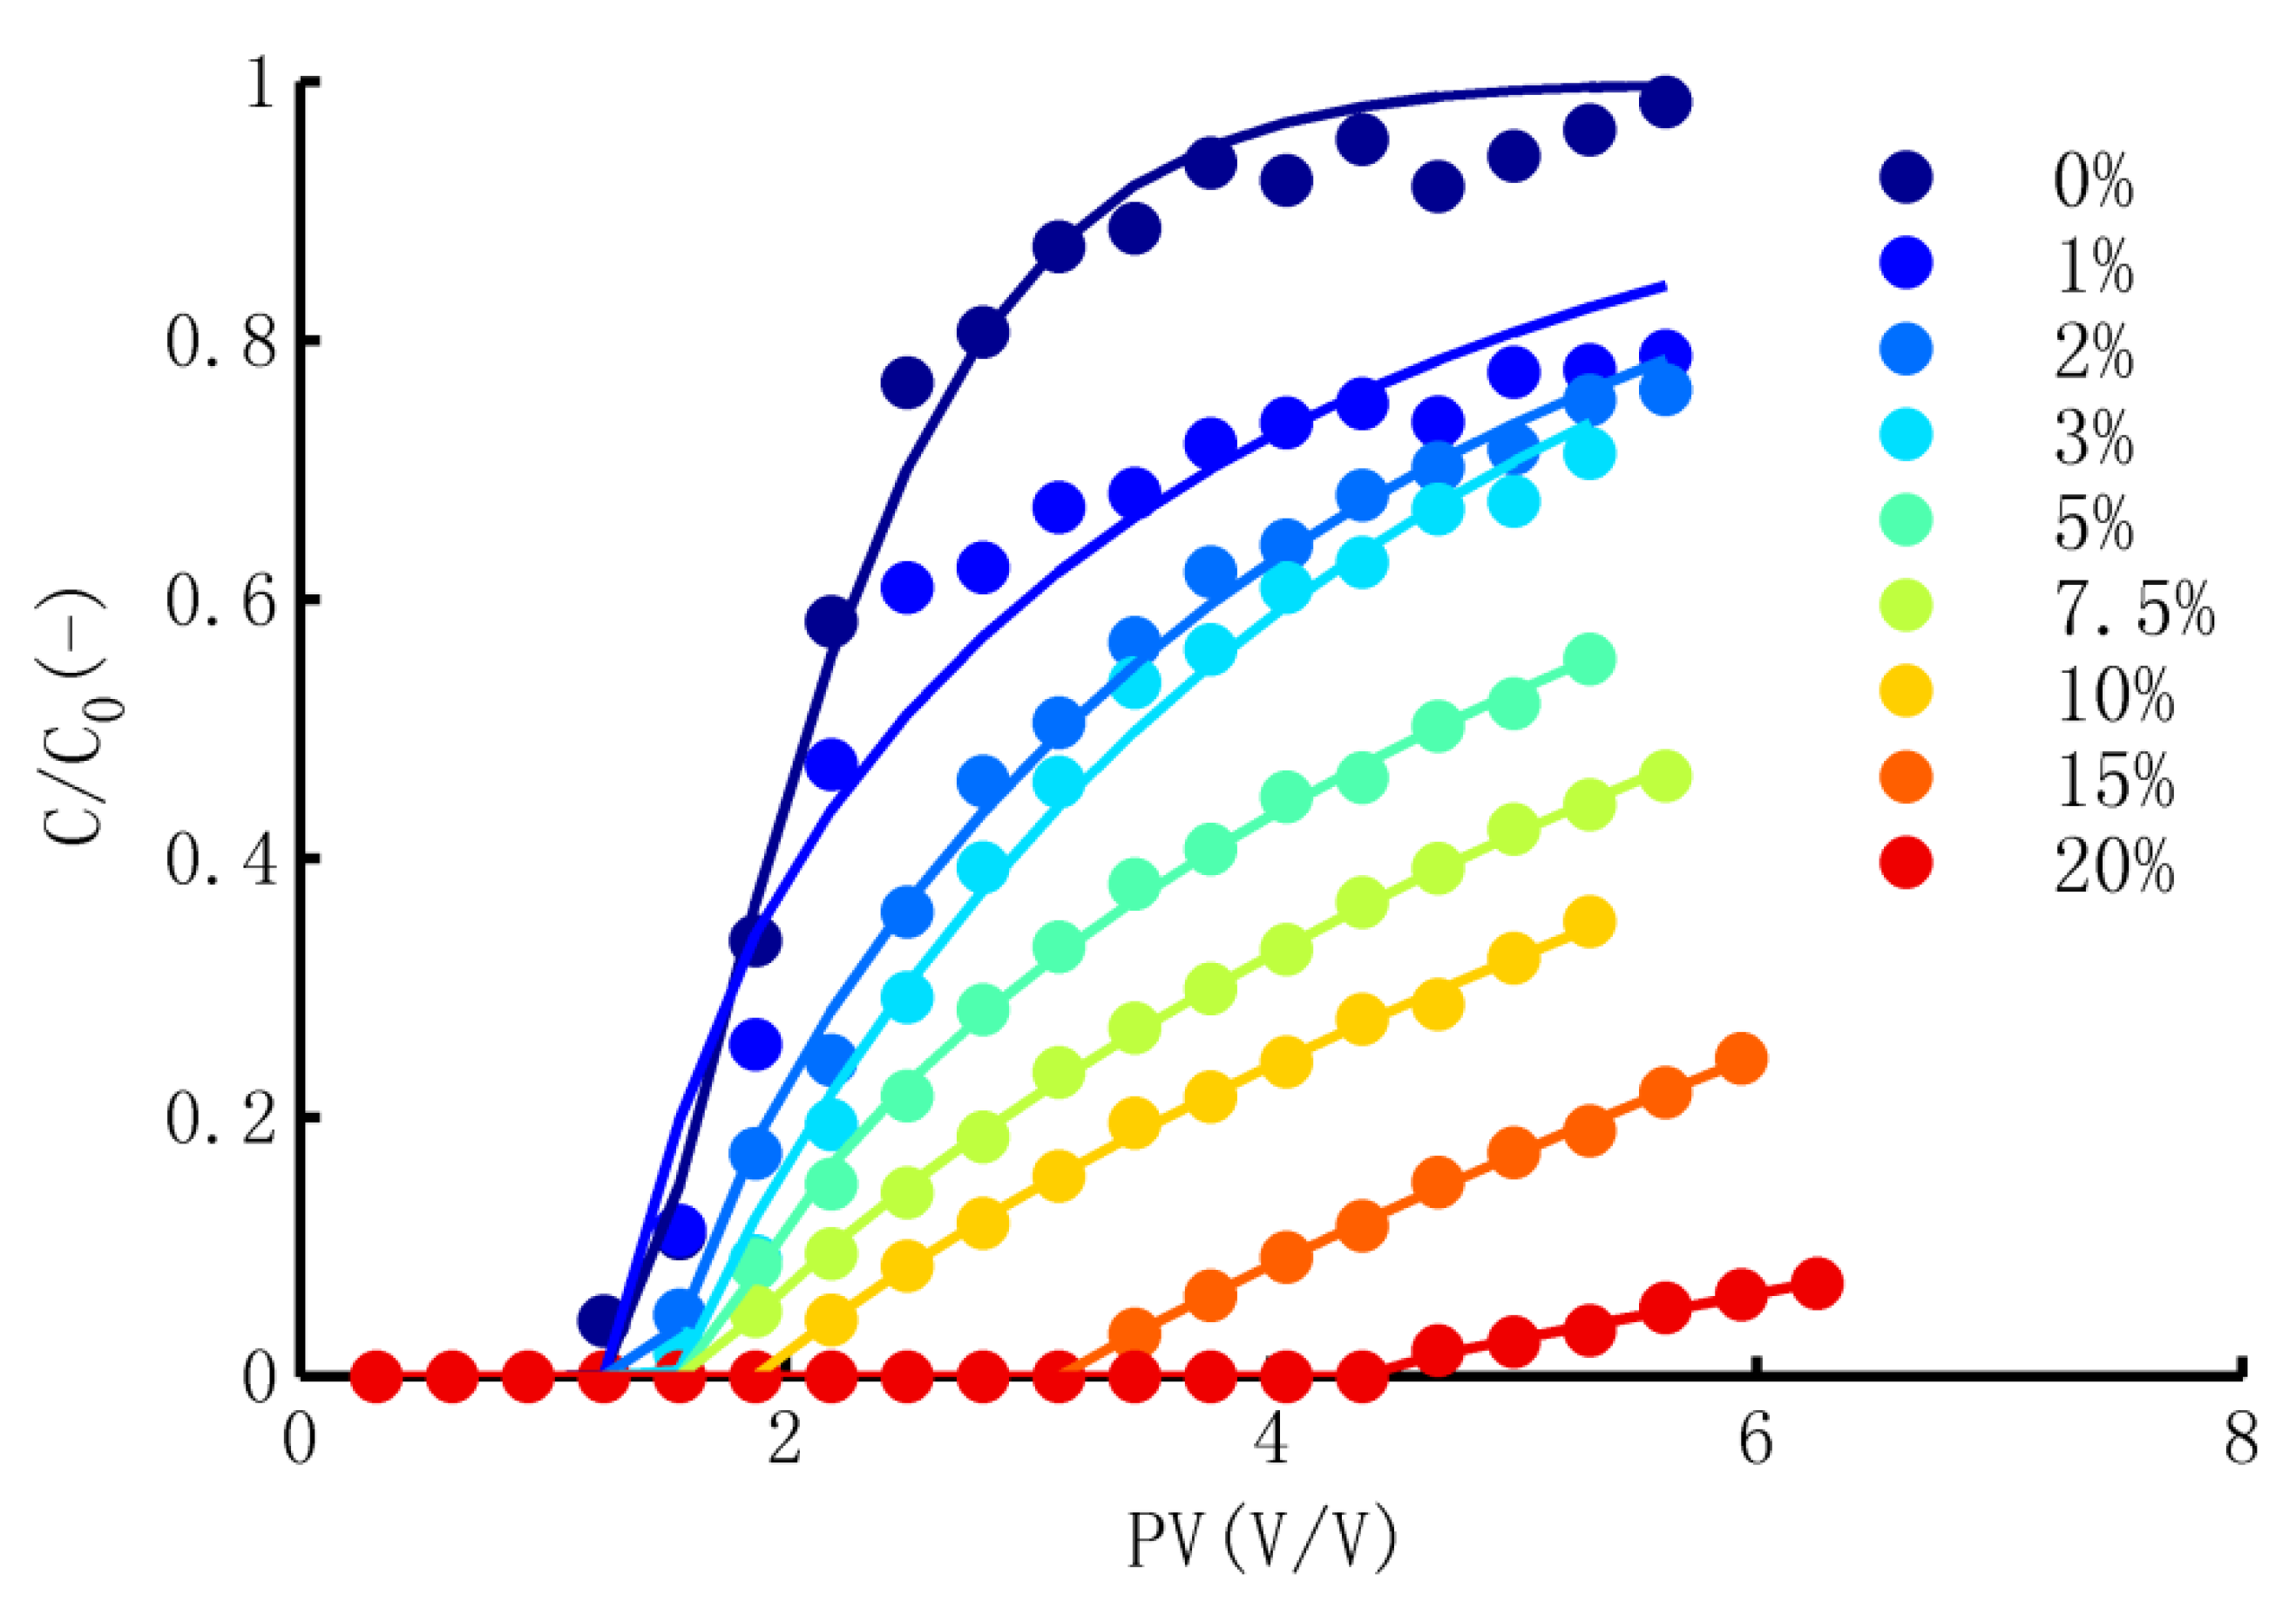
The first half of the BTCs were simulated using the CDF of the three-parameter gamma distribution; the results are shown in Figure 2. The parameters of the model and the error analysis are given in Table 1. Generally, this model performed well in describing the dynamic process of the outflow. The square of the correlation coefficient (R2) was larger than 0.98 and the mean squared error (MSE) was lower than 0.05 for the result of each soil column experiment.
(2)
Meanings of the parameters
The meanings of these parameters and their correlation with the rate of biochar application are explored below.
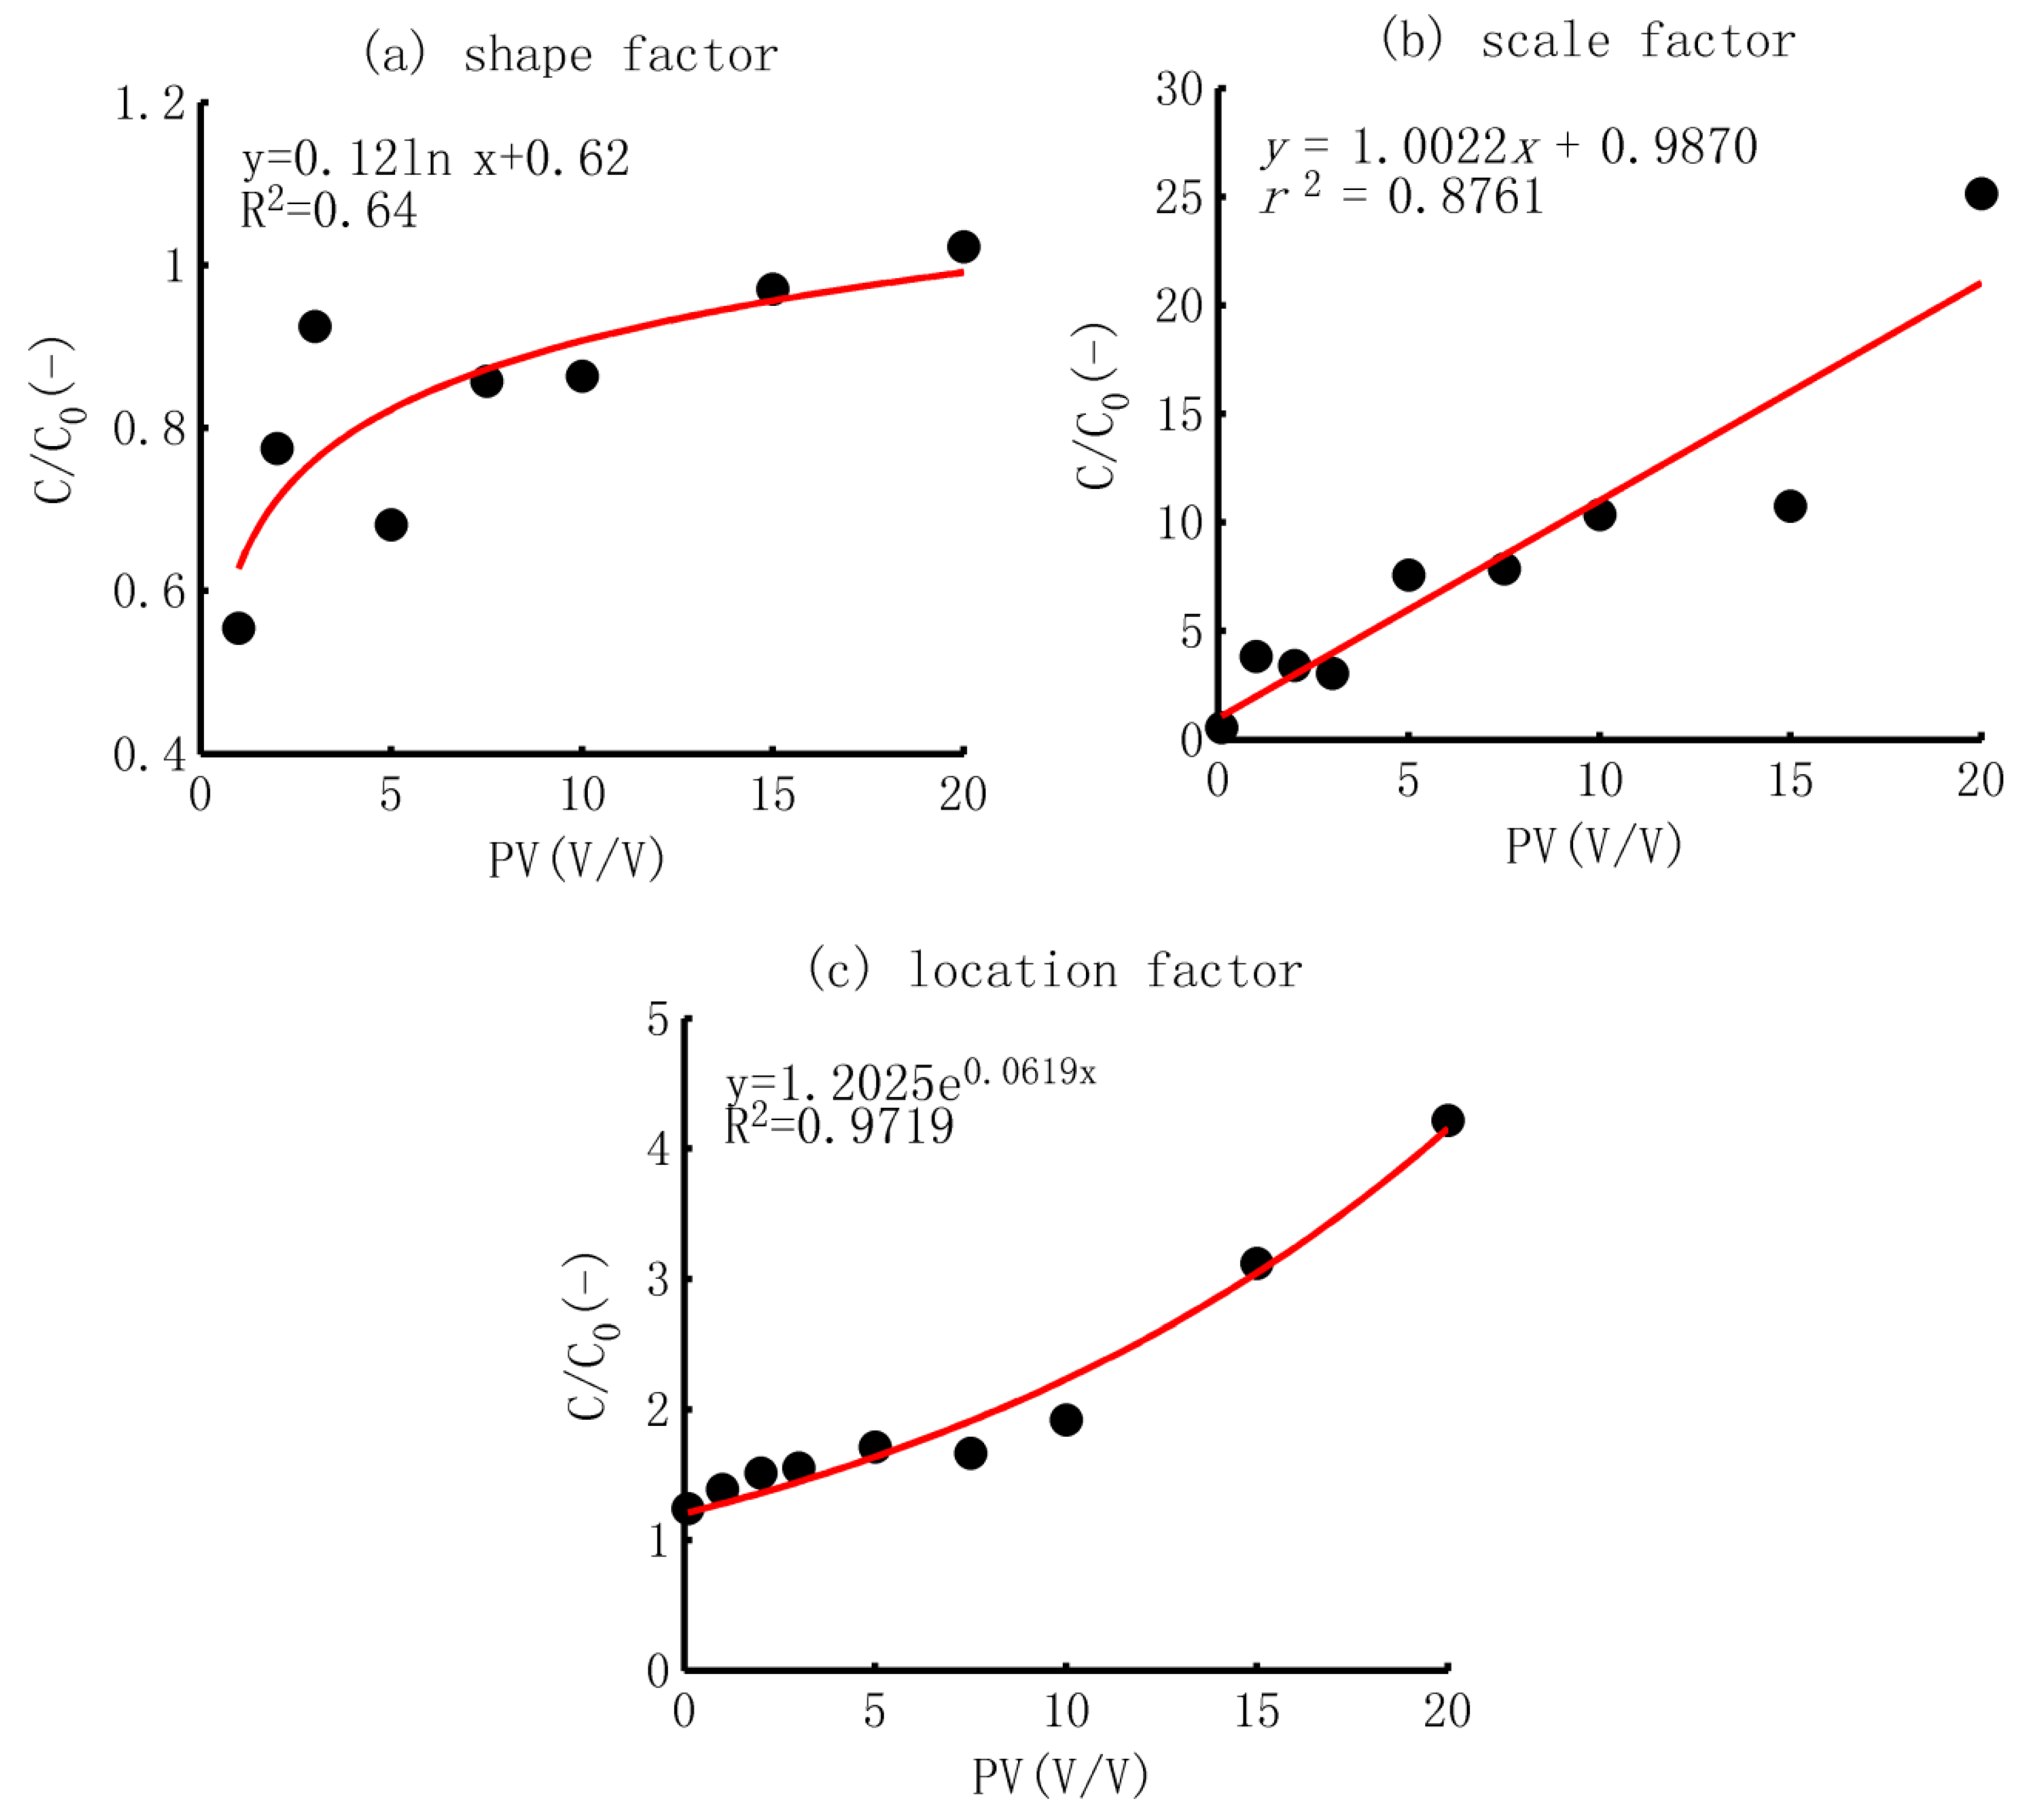
Shape factor α. The shape factor generally displays two types: larger than one and equal to or less than one. The first type was observed in the soil column without biochar application, showing a maximum shape factor of 1.82. The shape factors of the other soil samples were smaller than one. In addition, after a scatter analysis and curve fitting, it was found that the shape factors that were less than one increased logarithmically with a rise in the biochar application rate, as shown in Figure 3a.
Scale factor β. The scale factor showed a linear trend with the increase in the biochar application rate, as shown in Figure 3b. Based on the CDF of the gamma distribution, the scale factor was correlated with the arithmetic mean; a larger scale factor meant a larger adsorption ability and a smaller rate of decrease.
Location factor γ. The location factor increased exponentially with the ratio of biochar application, as shown in Figure 3c. The location factor reflected that the inputted TCP was absorbed completely by the soil if the amount was smaller than this value. The exponential increase pattern also implied that the location factor would not increase substantially when the biochar application rate was smaller than 5%, but the rate of increase would be much larger in soil mixed with a higher content of biochar.
(3)
Adsorbed TCP Versus biochar application rate
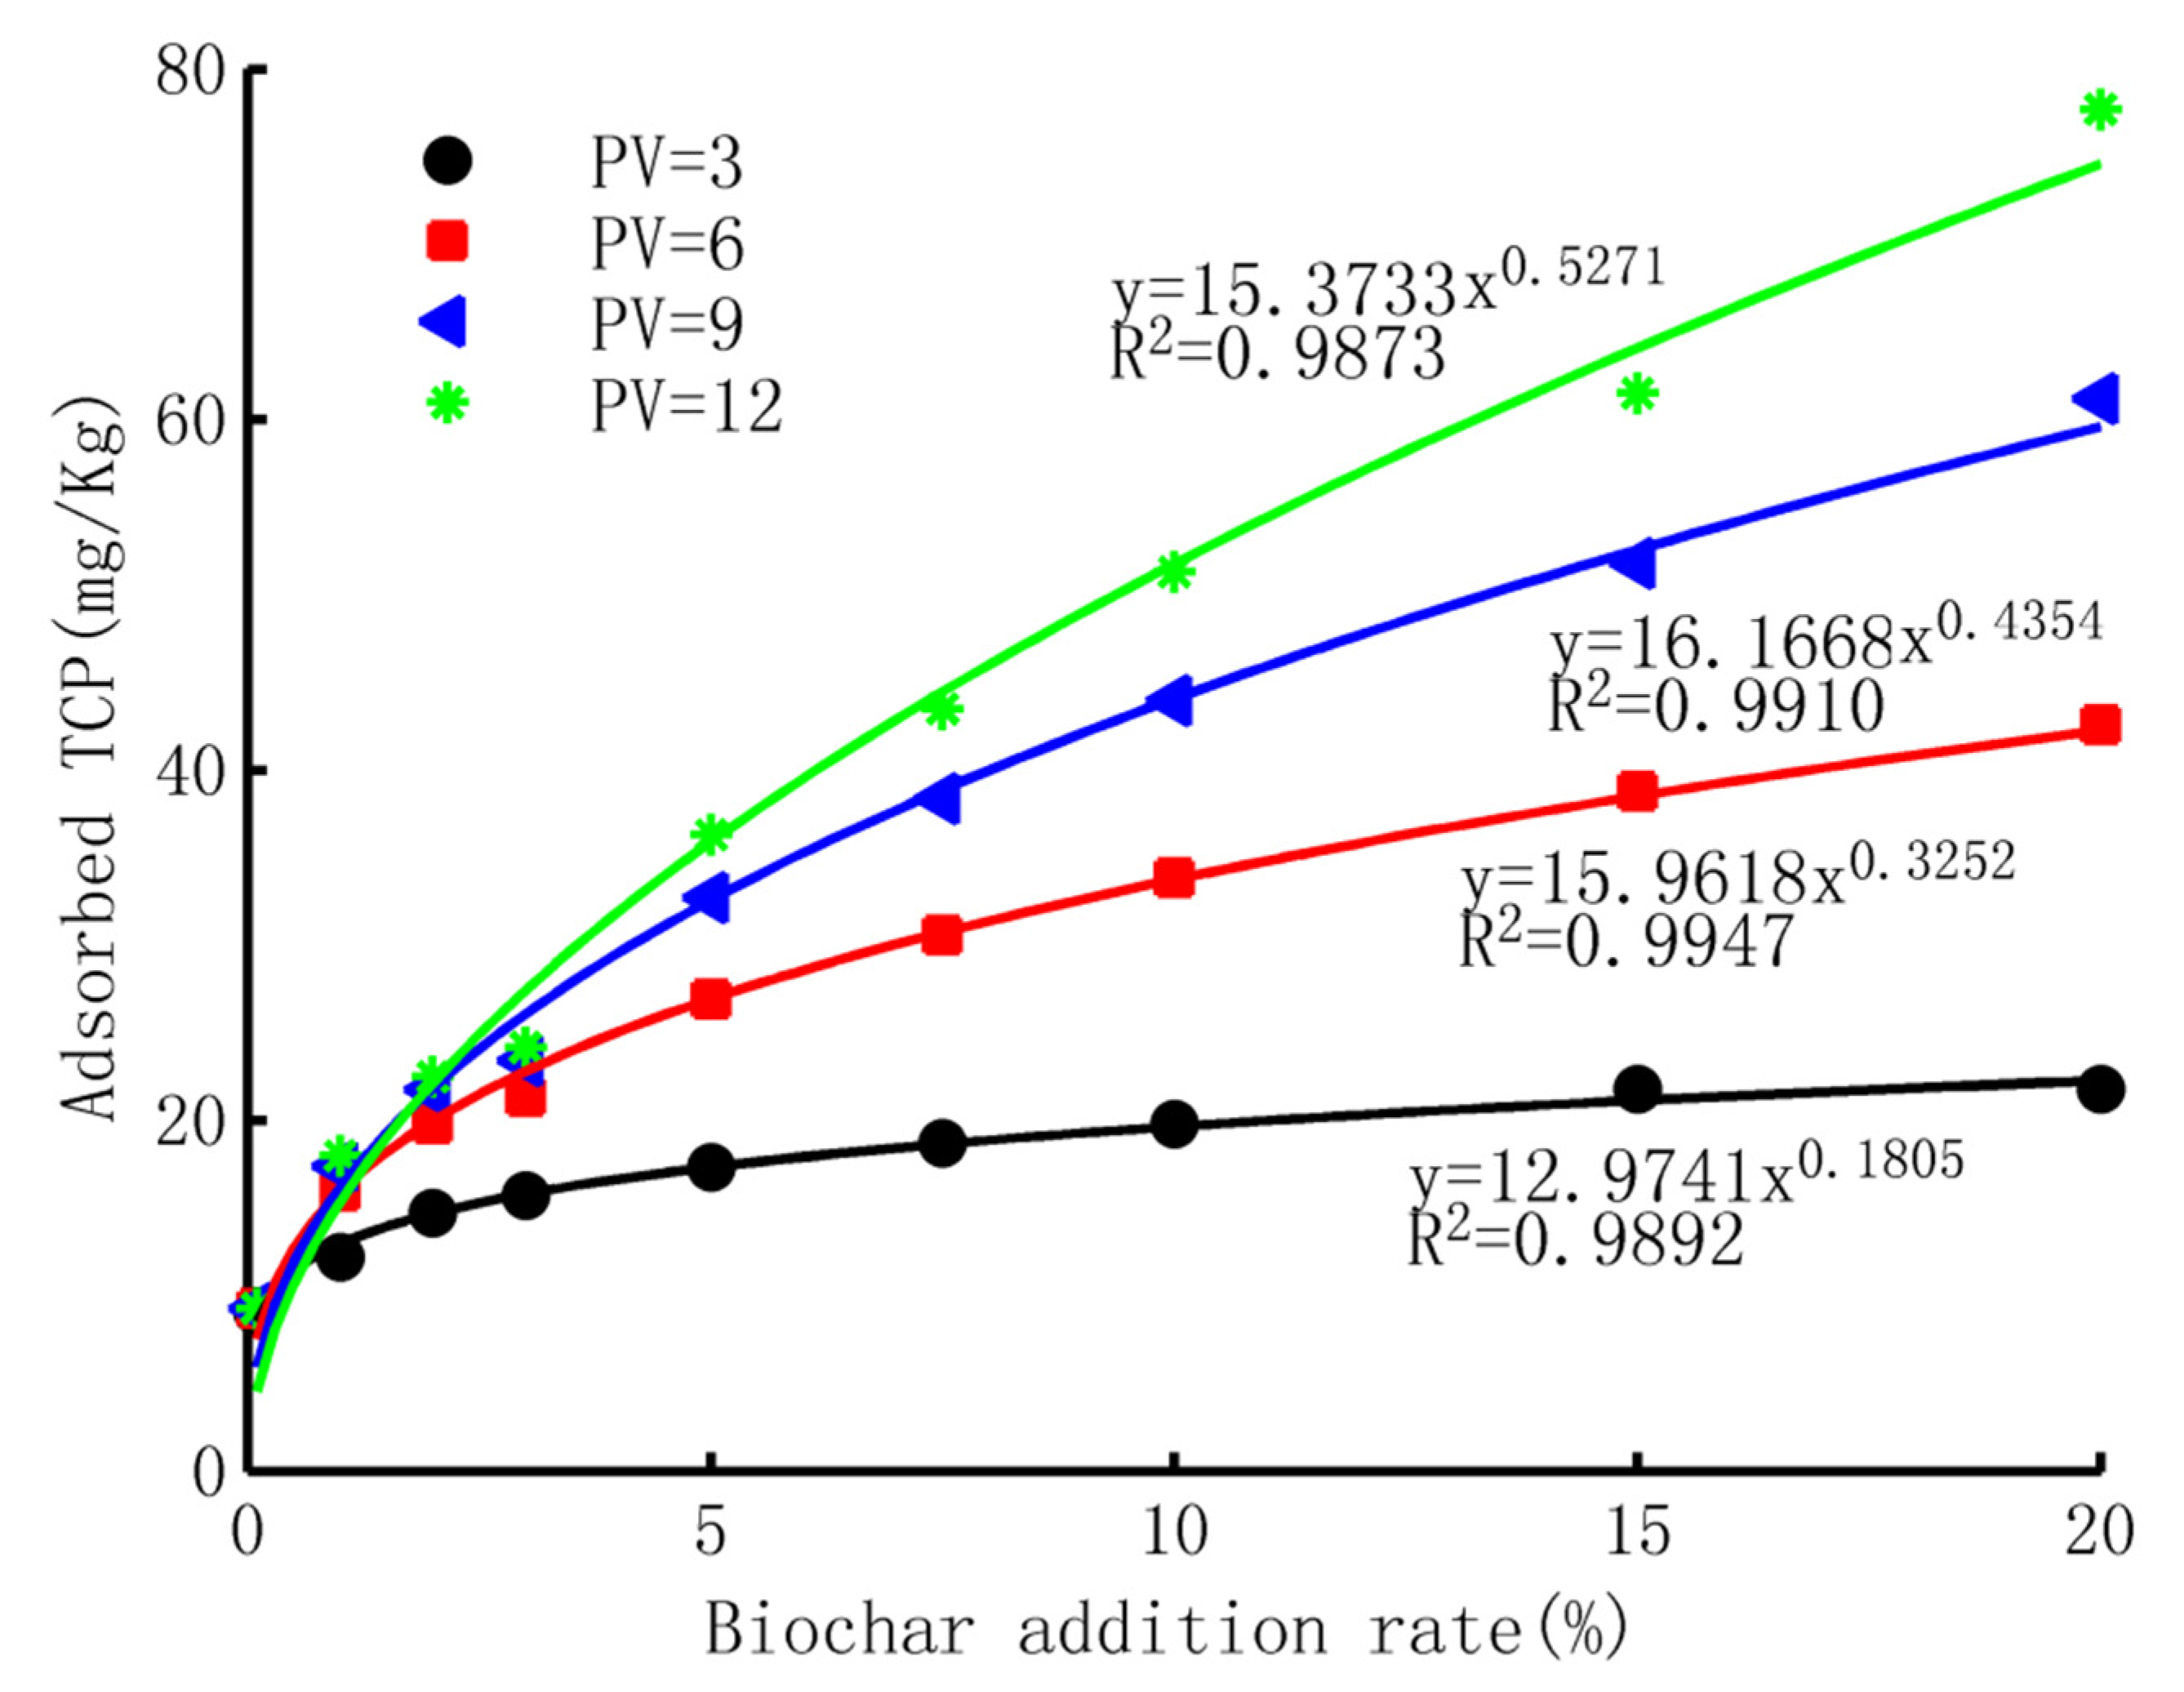
The amount of adsorbed TCP at different times was obtained in the experiments and simulations. The results are given in Figure 4. In total, the correlation between the adsorbed TCP per unit mass of soil and the rate of biochar application could be described well by a power function. The power index increased with the continuous input of TCP, but was smaller than one. The former reflected a nonlinear process of the adsorption of TCP in the biochar-amended soil, and the latter indicated the loss in adsorption sites in the soil column.
(4)
The adsorption ability of biochar-mixed soil
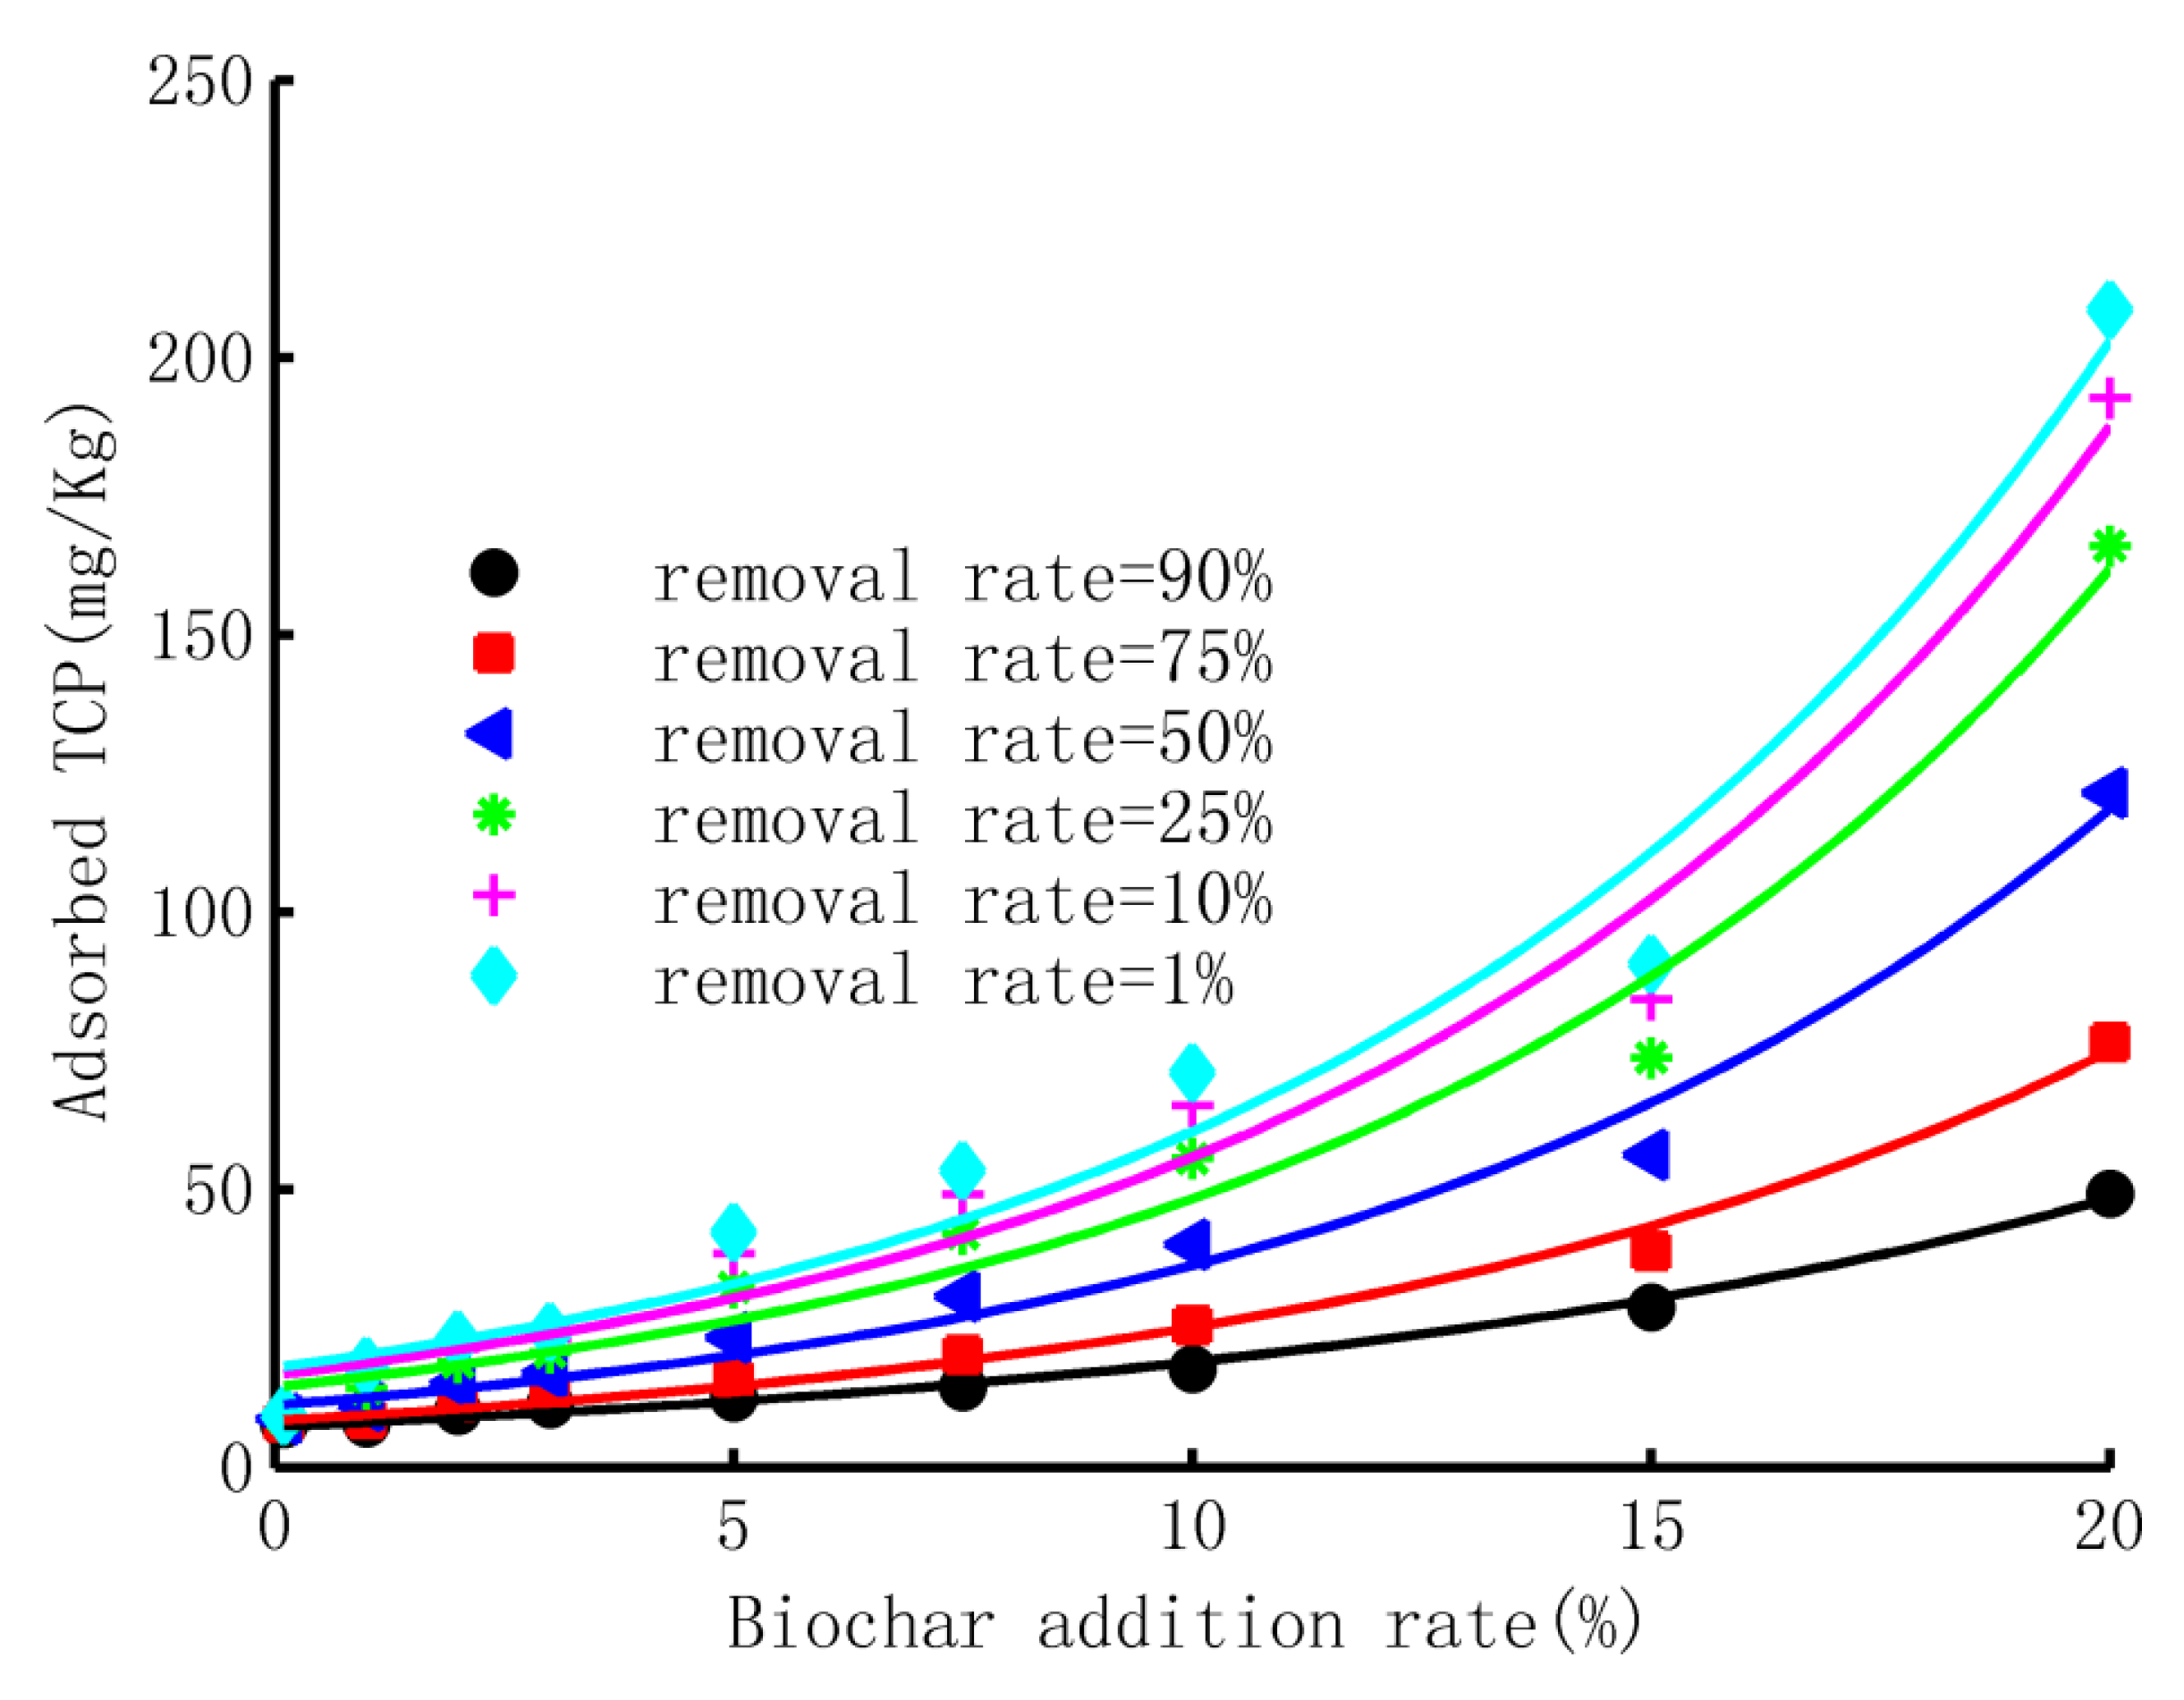
Based on the model simulation, the adsorption ability could be estimated by assuming the time of inputting TCP was large enough. The threshold time of several specific removal rates at different contents of biochar addition are given in Table 2. Correspondingly, the total adsorbed TCP could also be calculated using the difference between the input and output of TCP in the soil column; the results of these typical removal rates are given in Figure 5. The results showed a good exponential relationship between the adsorbed TCP and the biochar-addition rate. The exponential increase also reflected that the adsorption ability increased dramatically when the biochar addition was large; e.g., 15 and 20% in this study. At a removal rate of 90%; e.g., the increment was about 20 mg/kg when the content of biochar was raised from 15% to 20%, while it was about 7 mg/kg when the content was raised from 0 to 5%.

3.3. The Desorption Process

3.3.1. Scaled BTCs of Br

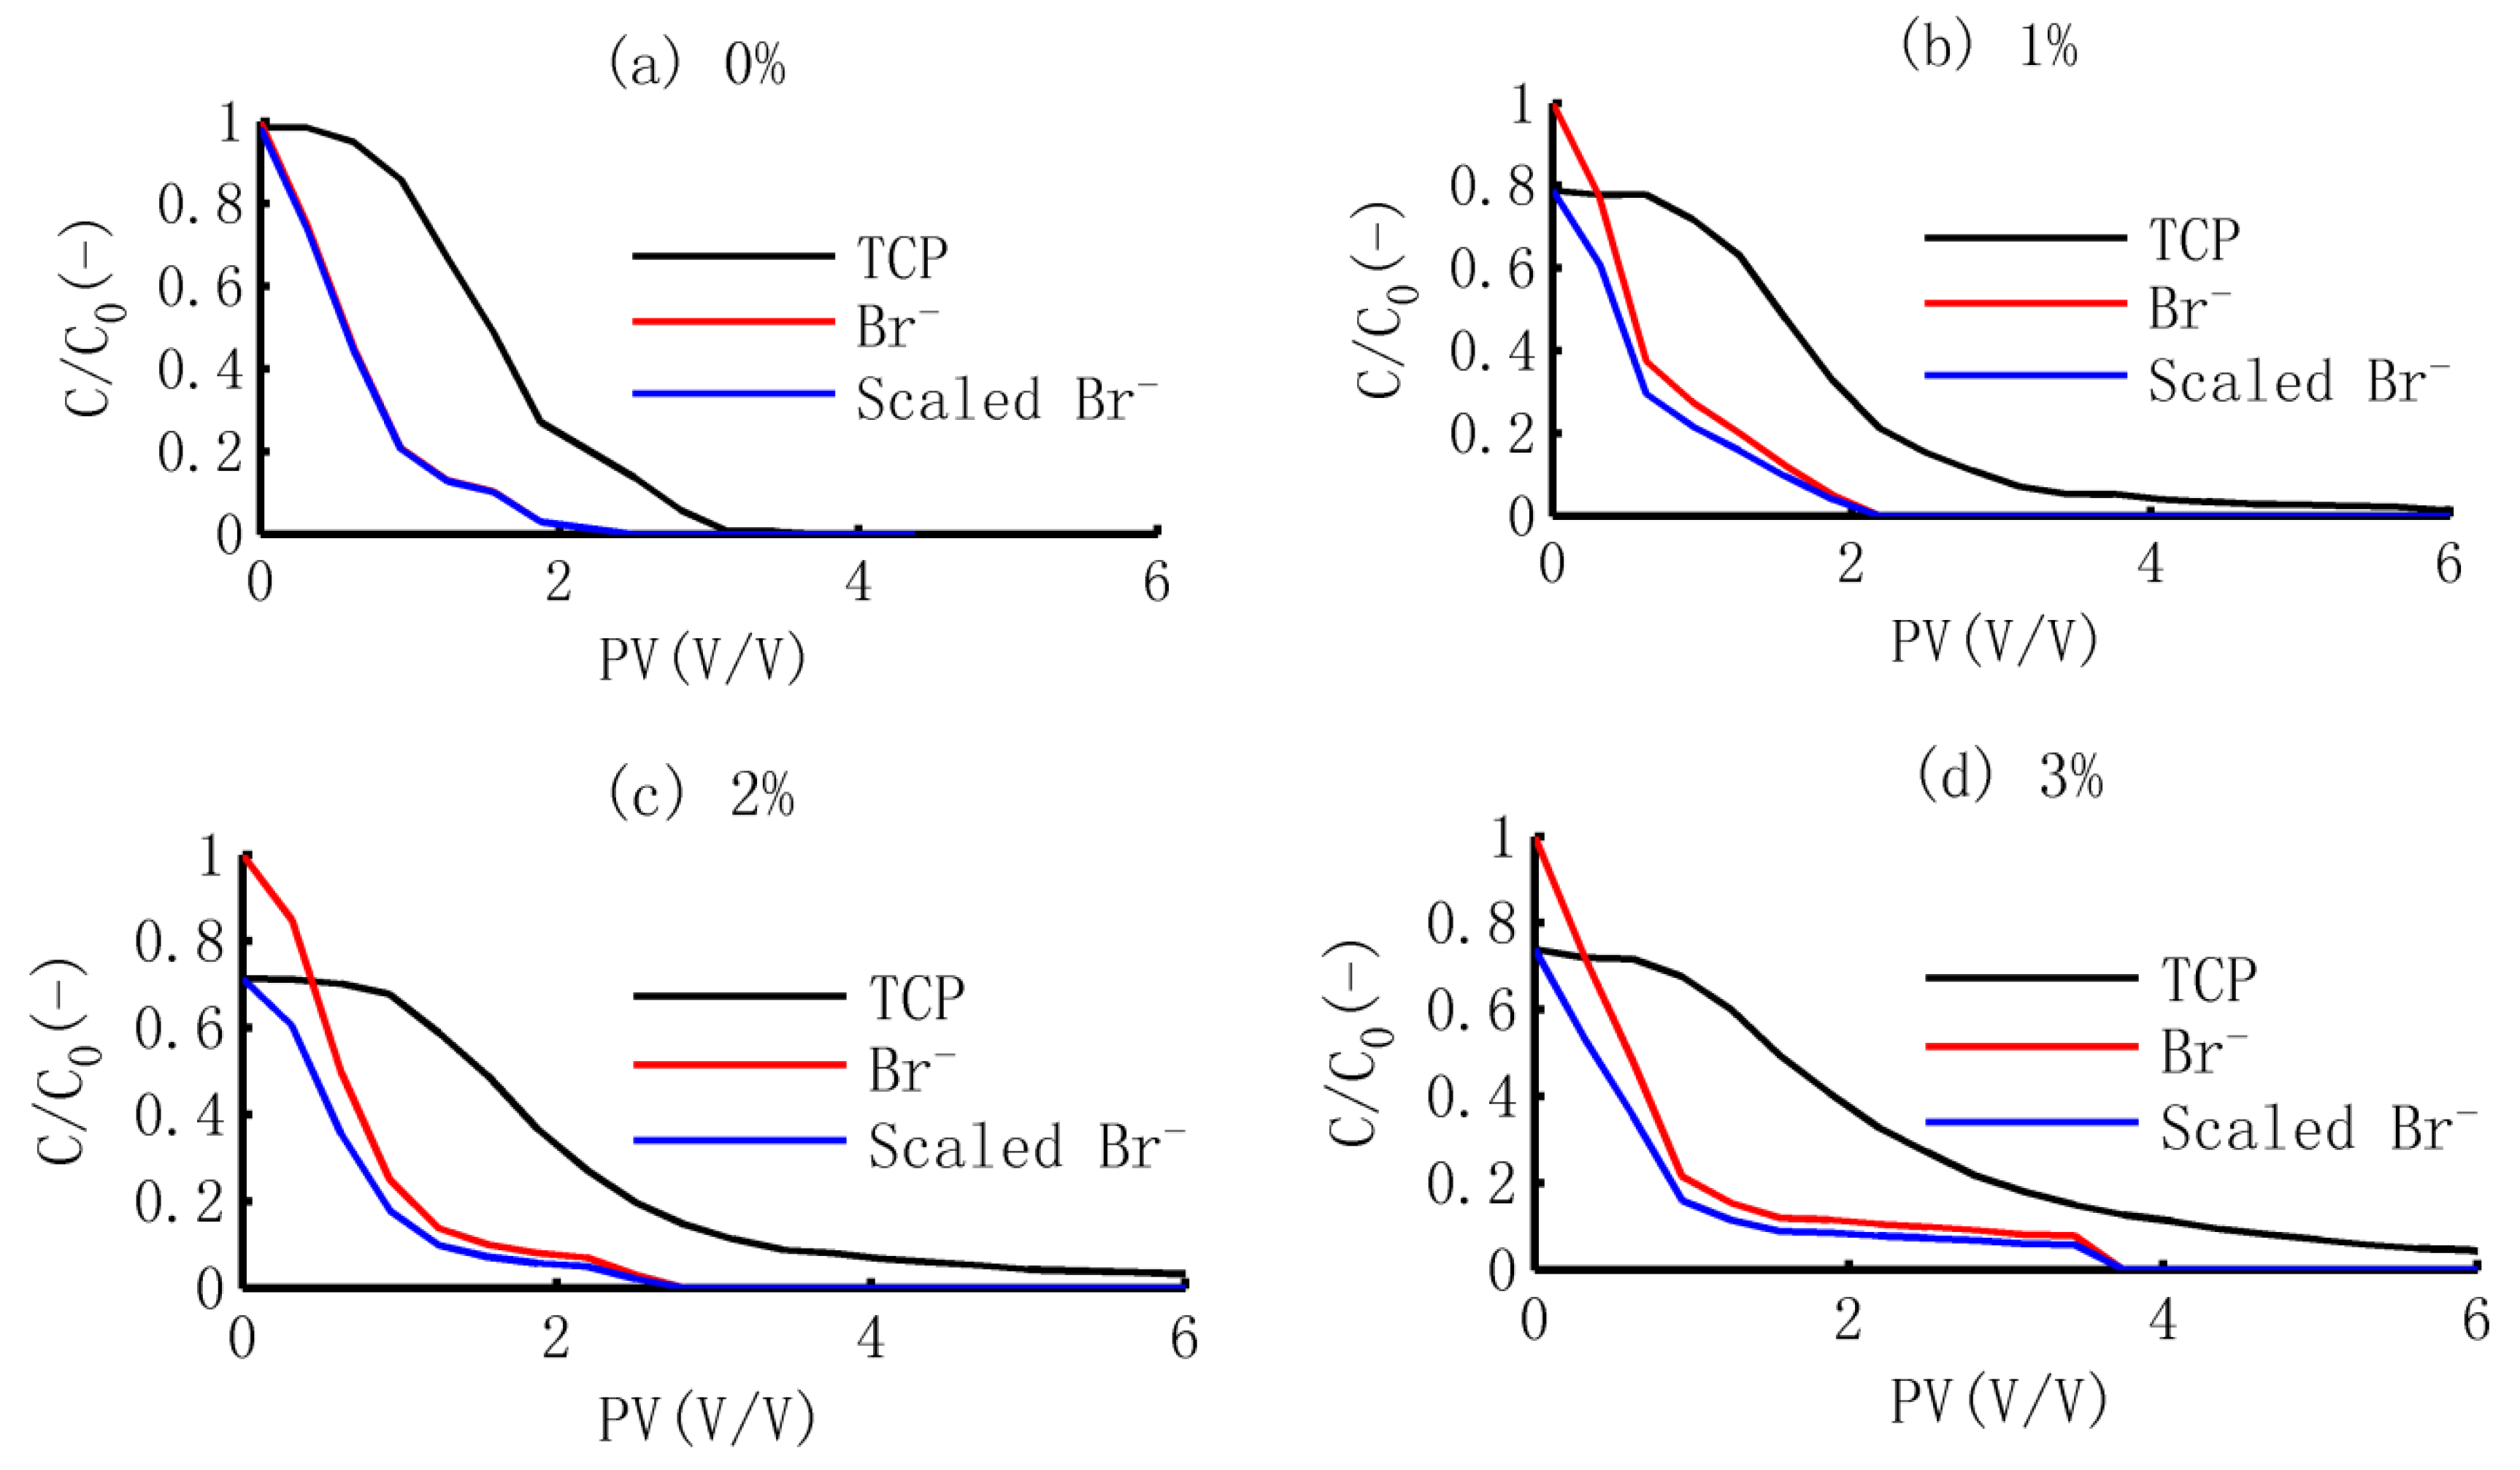
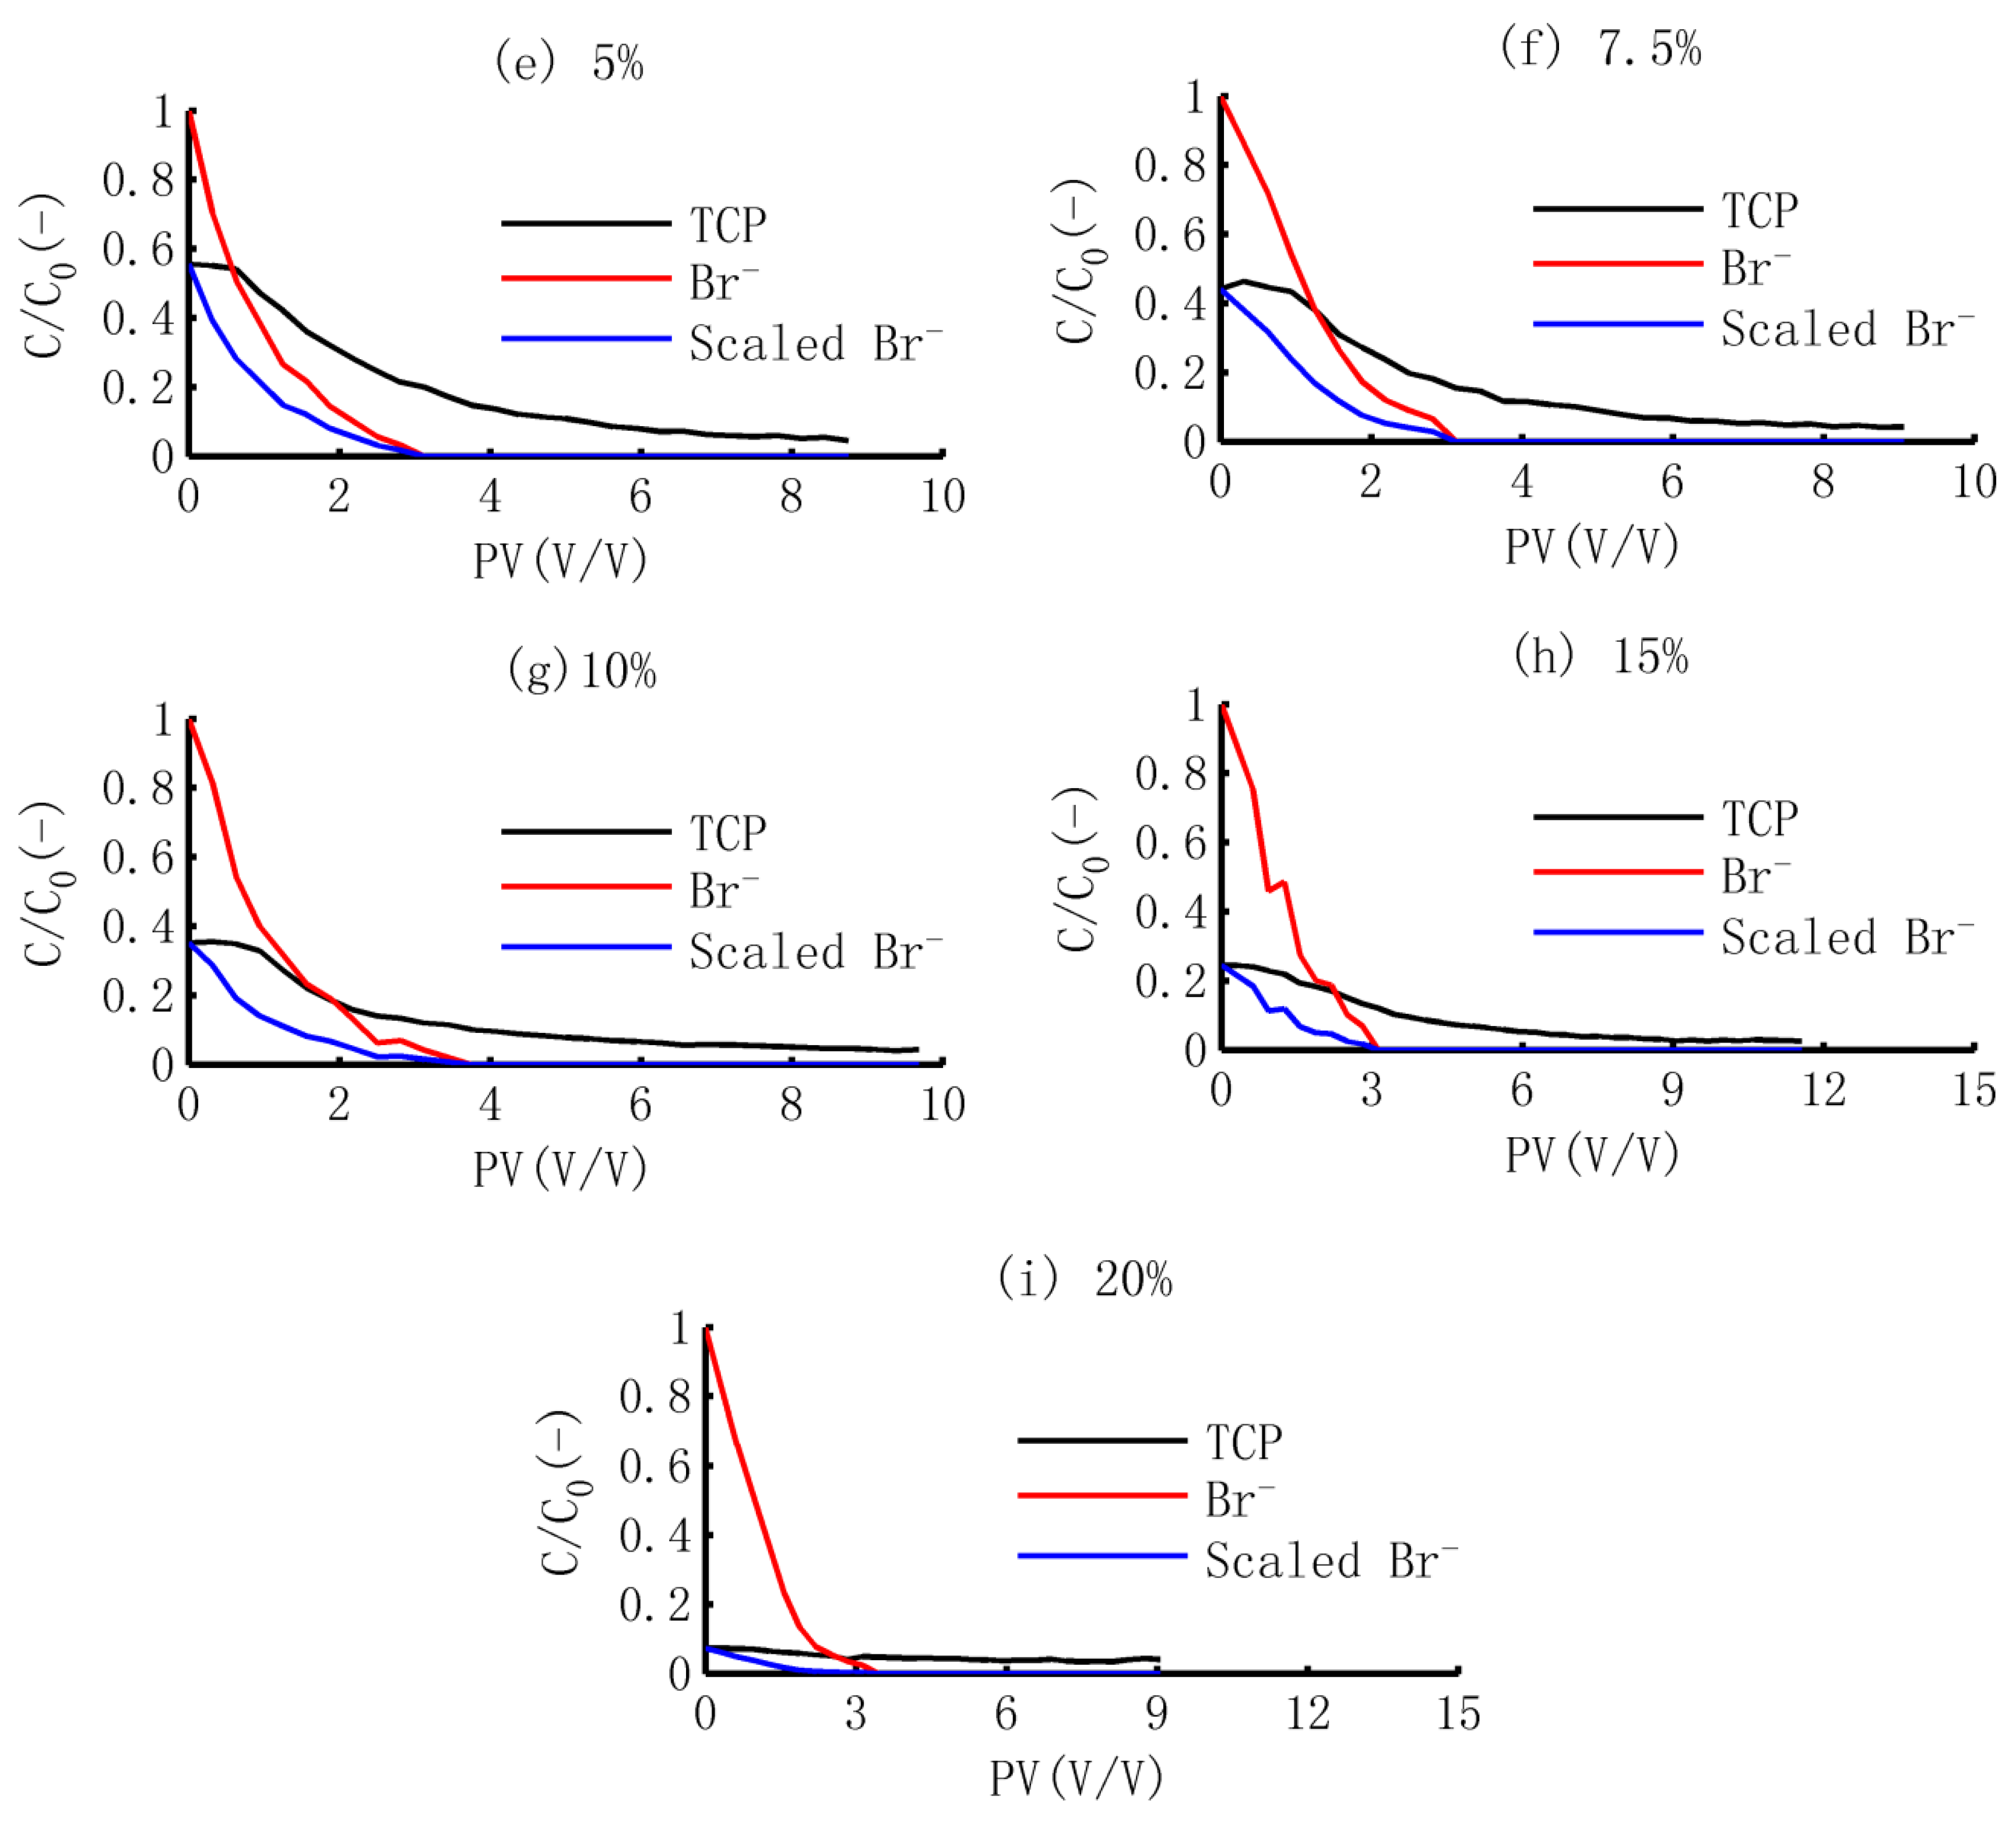
After inputting the background solution, the BTCs of TCP and Br and scaled BTCs of Br are presented in Figure 6. In this figure, the scaled BTCs of Br are smaller than the BTCs of TCP at all PVs, indicating the reasonability of the results. In addition, the BTCs of TCP were at a high level in the first 0.3–0.5 PV. This was because the dissolved TCP in the porous water of soil column lagged a little behind the outflow at the bottom of the soil column.

3.3.2. Dynamic Release of TCP

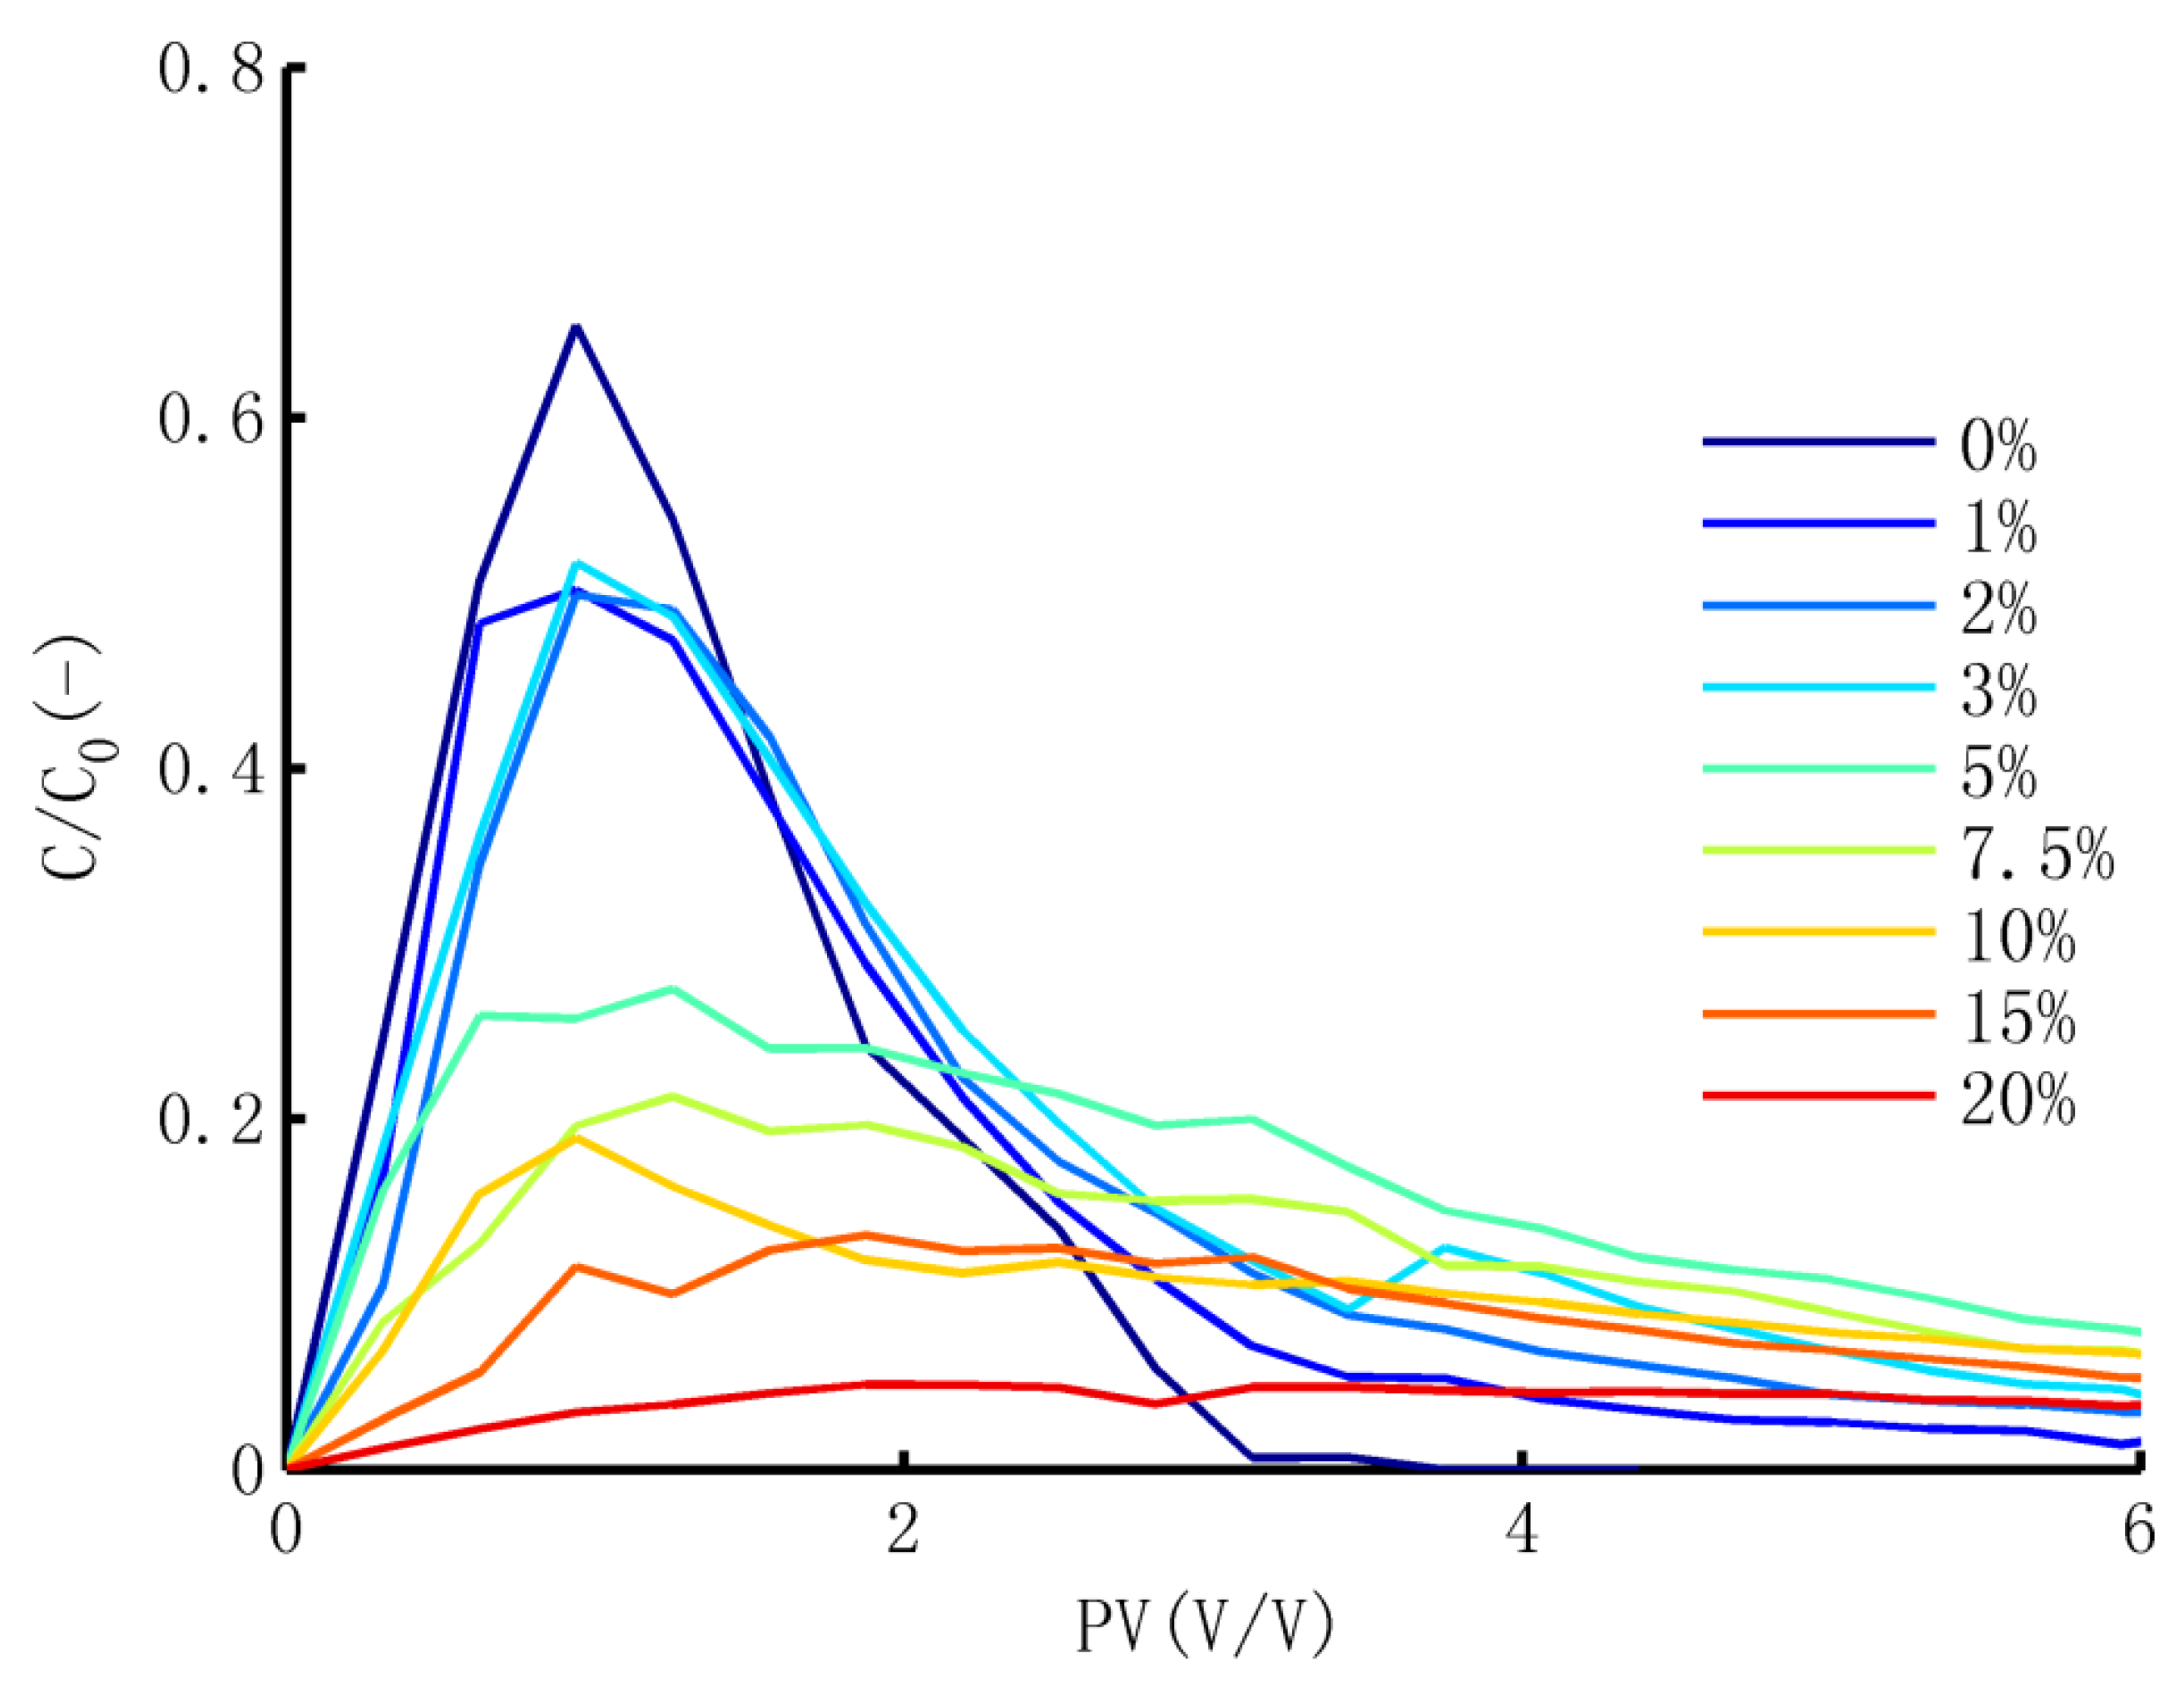
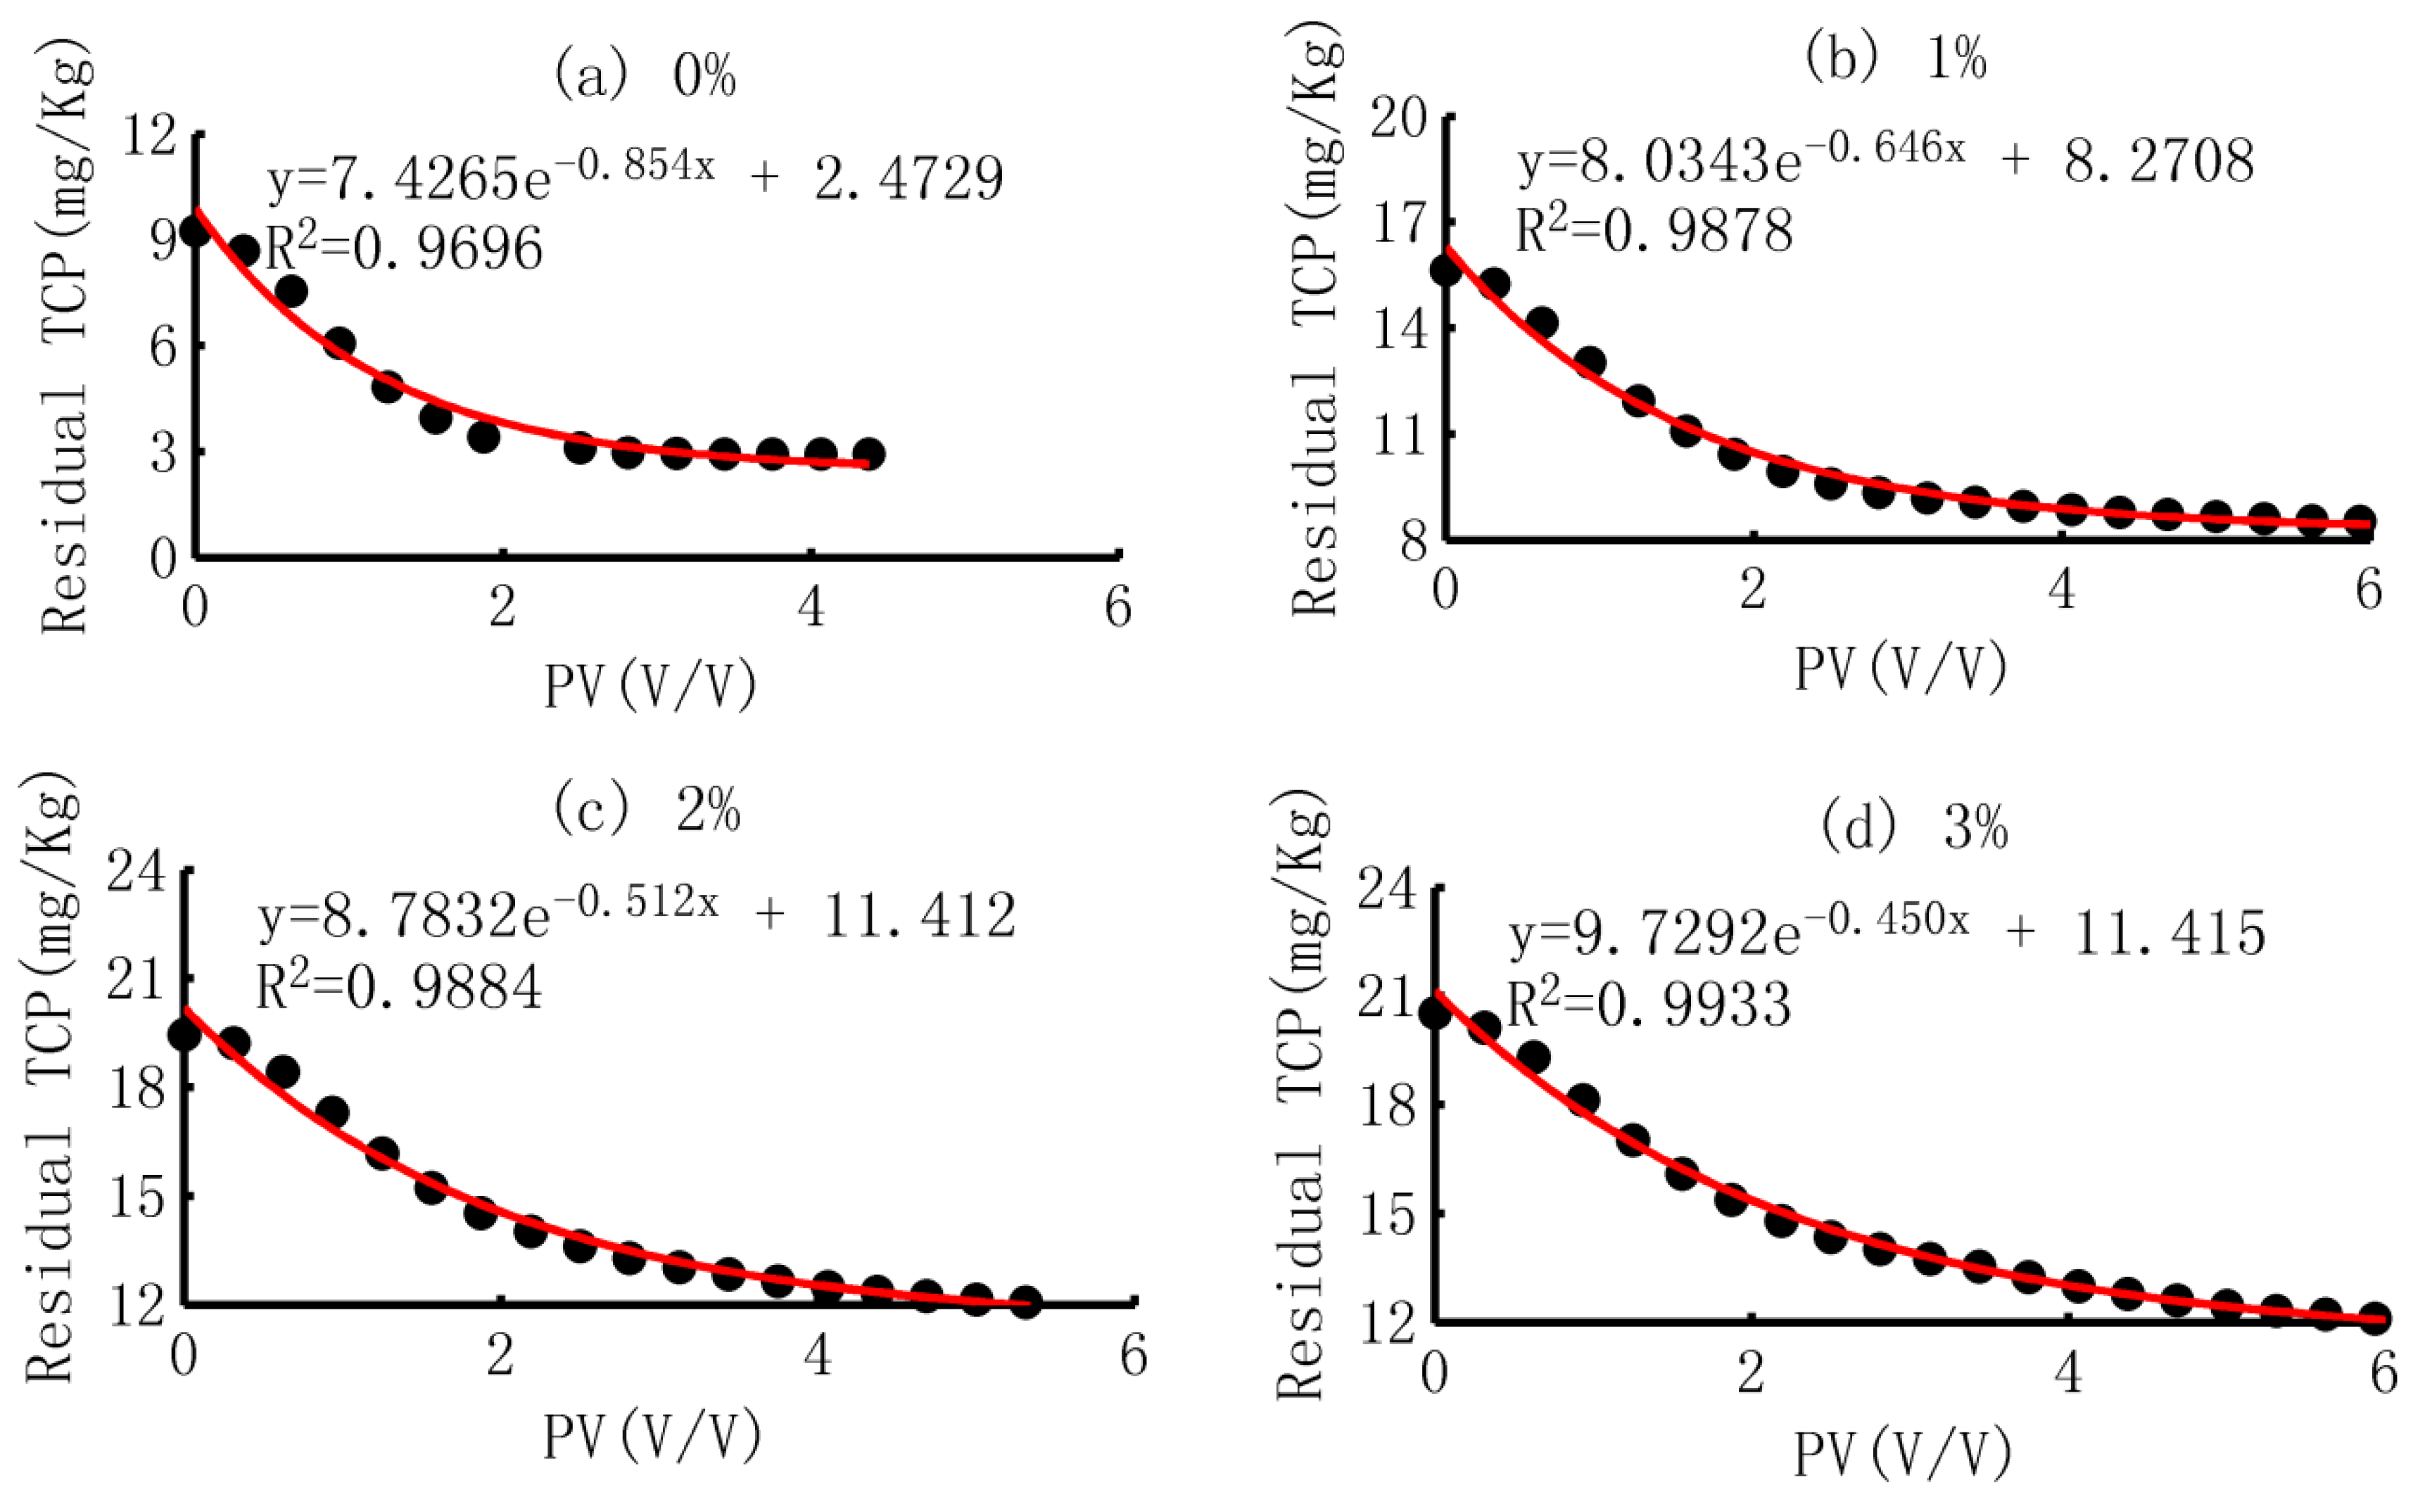
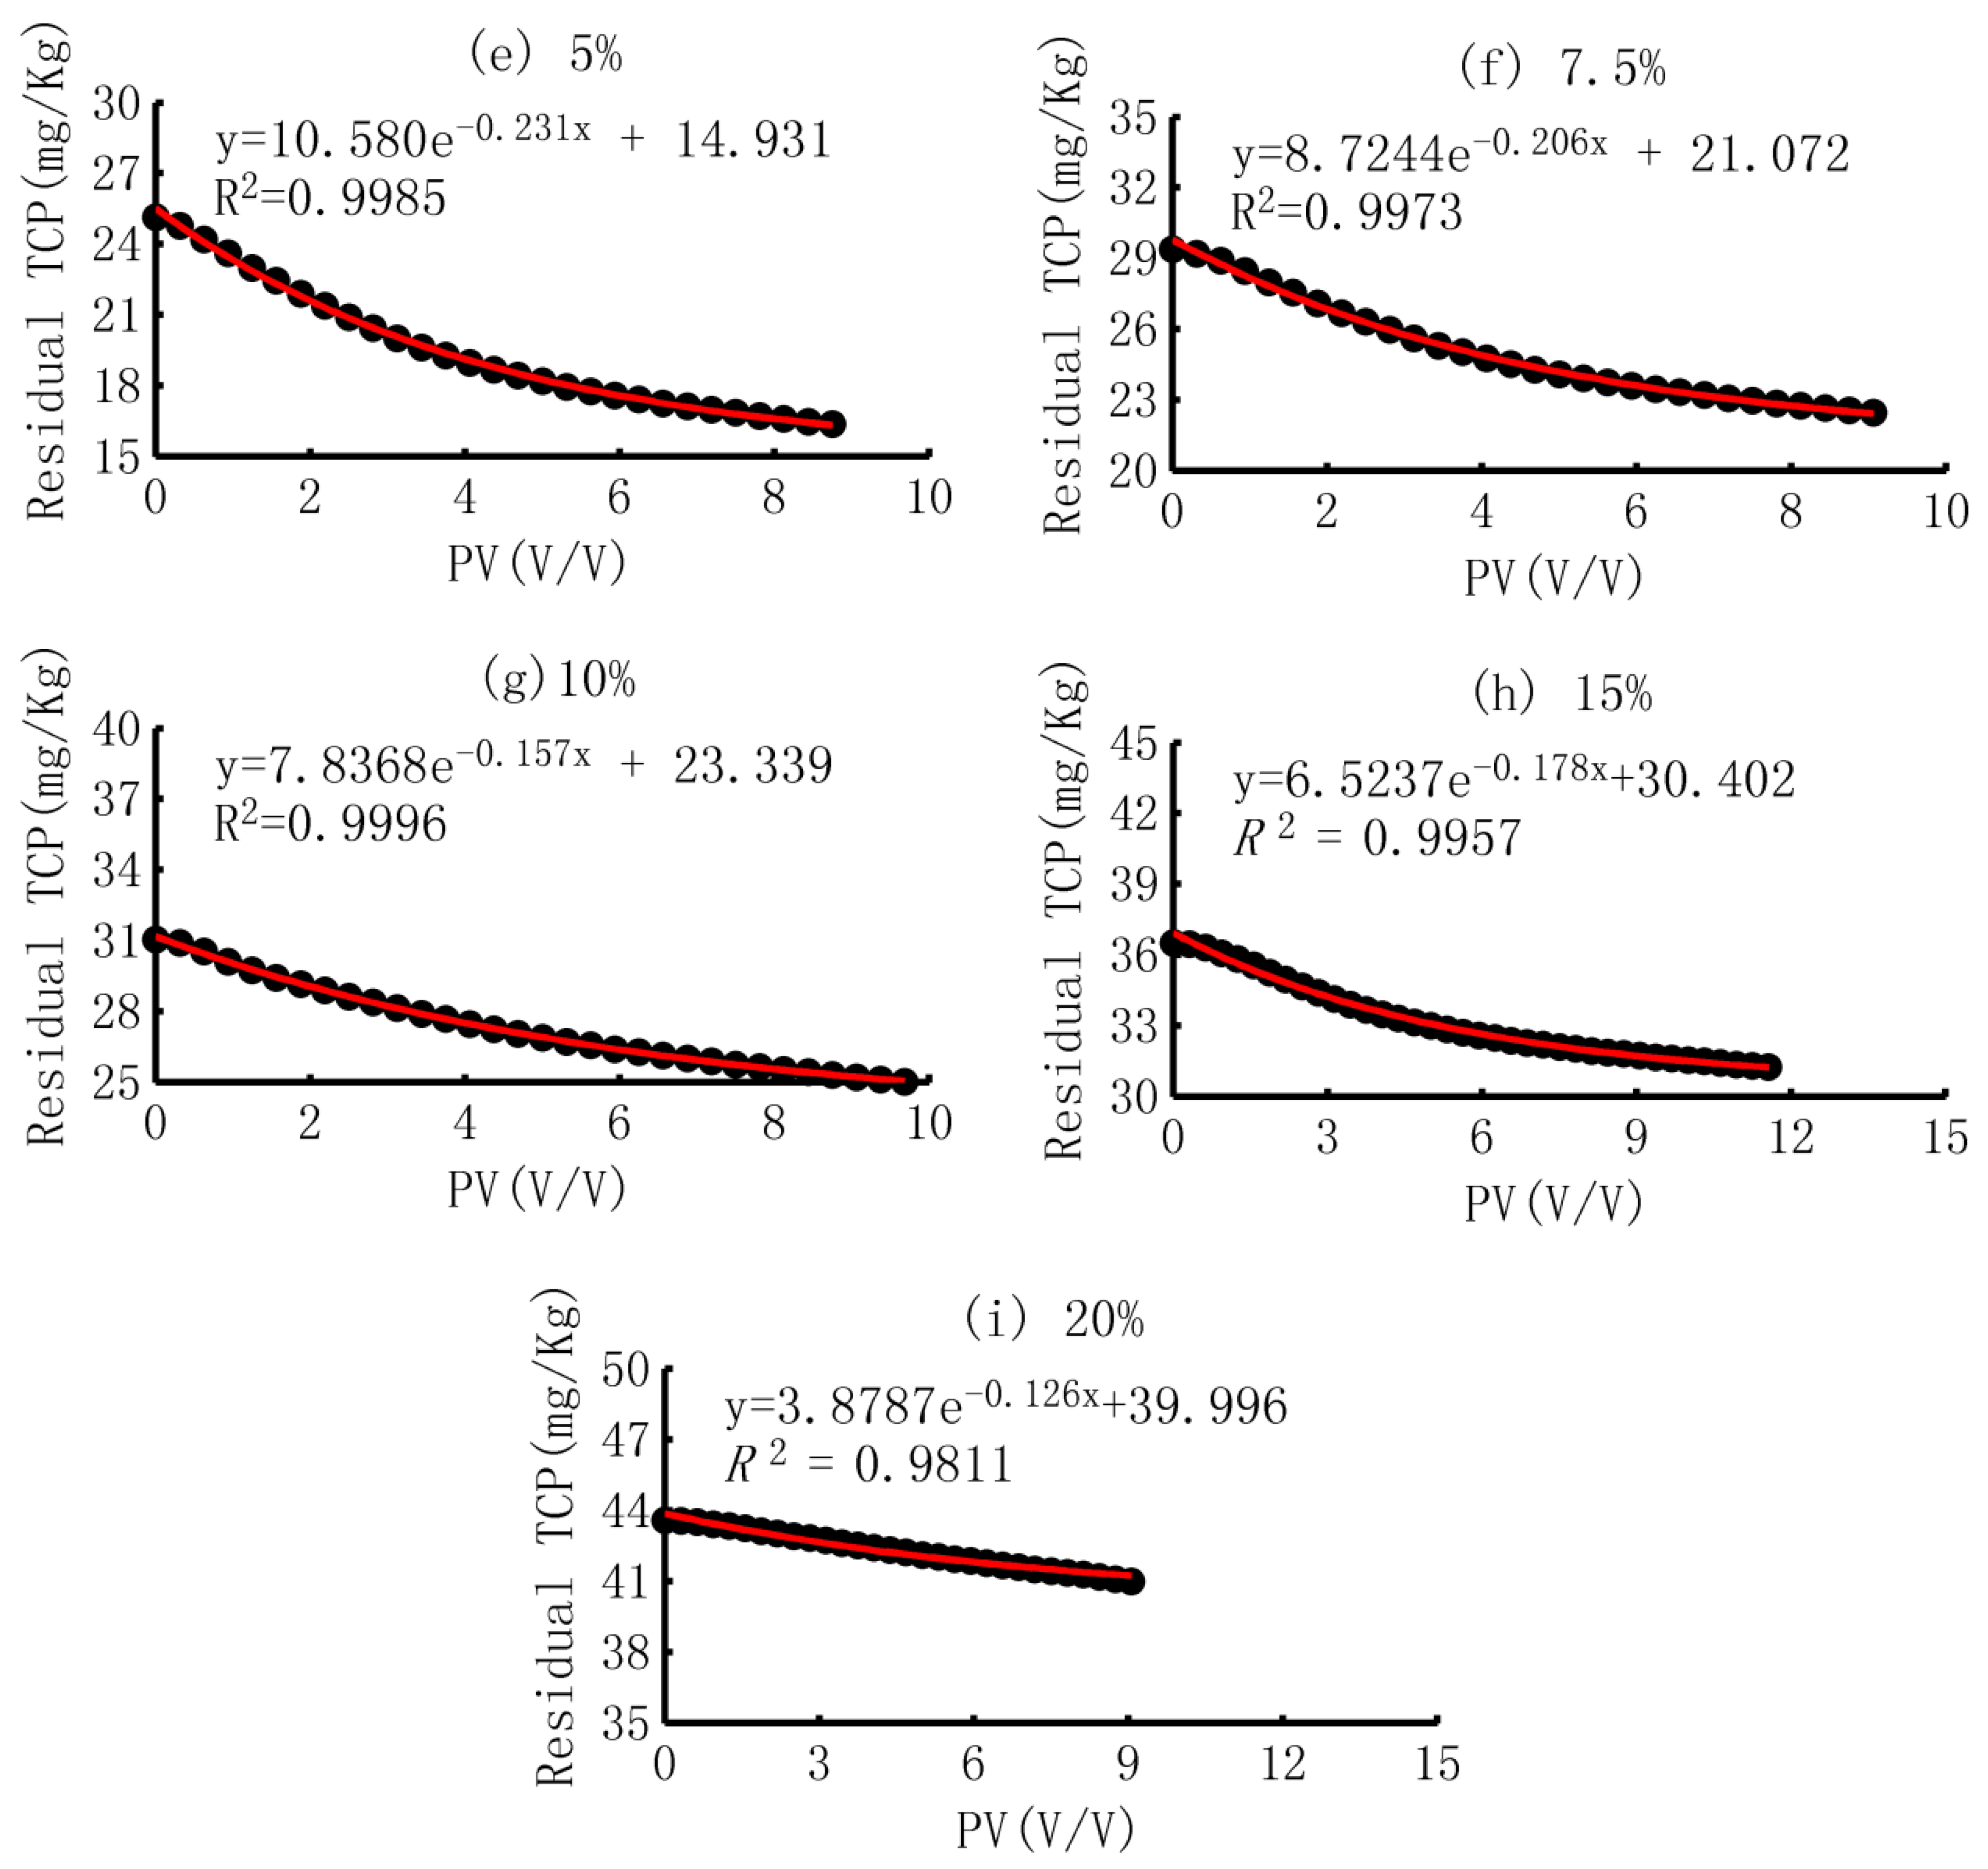
The dynamic processes of desorbed TCP are shown in Figure 7. Generally, the desorption of TCP exhibited an increase–decrease pattern, which was the same as results of both the packed and undisturbed soil columns [8]. Hence, the addition of biochar in the soil did not change the basic pattern of the desorption process. In addition, another interesting finding was that the tailing of the dynamic release of TCP was affected by the biochar-addition rate. Generally, a longer tailing was observed when the soil was mixed with a higher content of biochar. However, this pattern was very close when the biochar addition was smaller than or was equal to 3%, as shown in Figure 7. The similar pattern meant that the released TCP was mainly from the surfaces of soil particles when the addition rate of biochar was small.

3.3.3. Curve Fitting and the Meaning of Parameters

(1)
Curve fitting
The dynamic process was fitted using the first-order decay equation, as given by Formula (12). The fitted results, estimated parameters, and correlation coefficient between the estimated and measured values are shown in Figure 8. It can be observed that the first-order decay equation could describe the release of the adsorbed TCP from the surface of the biochar-added soil, and all R2 values of the model were larger than 0.97.
(2)
Trend of the parameters
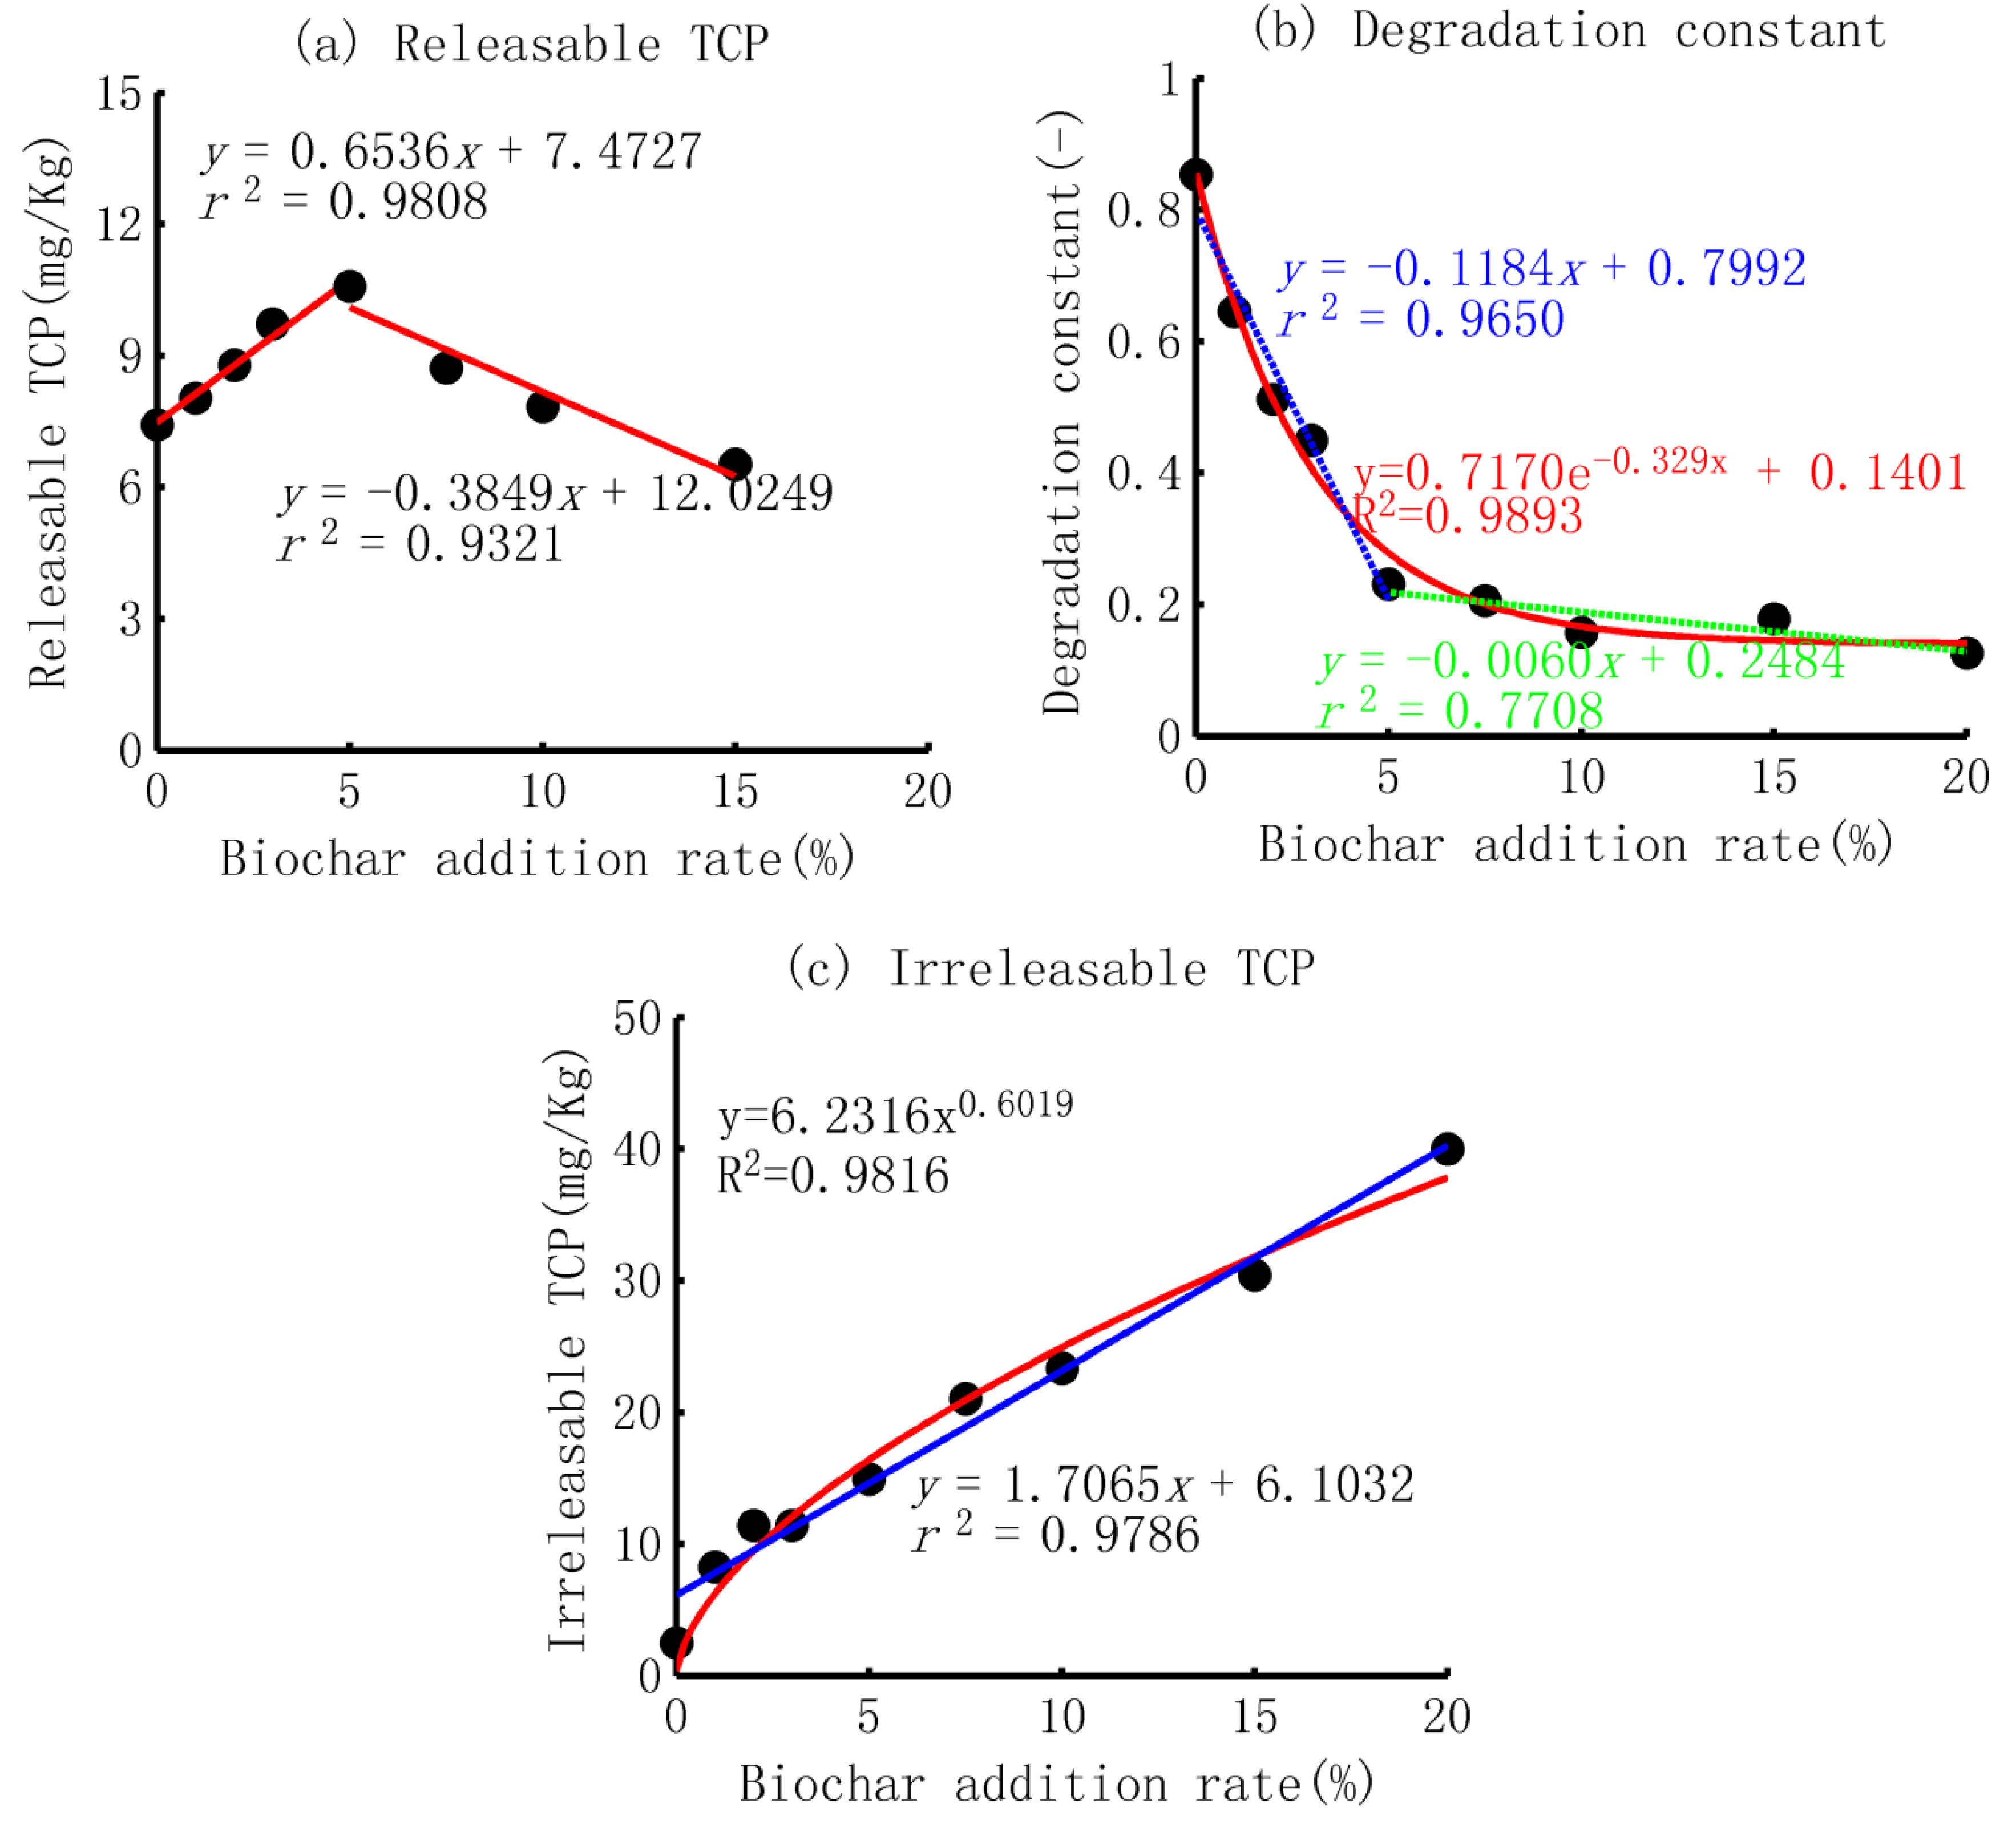
Based on inversion simulation, the trends of the three parameters with the increase in biochar addition are given in Figure 9. The parameter A0, representing the releasable amount, showed a linear increase–decrease pattern. As shown in Figure 9a, the parameter A0 reached the maximum when the biochar-addition rate was equal to 5%, and then decreased with the increase in the biochar-addition rate. Here, the result for the soil sample with a 20% biochar-addition rate was removed because the input of the TCP was larger than the other samples. The increase–decrease pattern implied that the release of TCP was easier when the biochar addition was smaller than or was equal to 5% while it was more difficult when the biochar-addition rate was larger. The second parameter, the decay constant K, decreased exponentially with the increase in the biochar-addition rate, as shown in Figure 9b. The exponential decrease trend implied that the release of adsorbed TCP was more difficult in a high biochar content, as well as a much smaller risk to regional water environment. The third parameter, the constant C, represented the unreleasable amount of TCP, and it increased in a power function. However, the index of the power was smaller than one, which suggested the adsorption sites of the biochar were partly occupied in the soil column.

4. Discussions

4.1. Adsorption Process

Based on the results above, two key points should be explored further, including the difference in the shape factor and its physical meaning, and the exponentially increasing trend between the adsorption ability of the soil and the ratio of biochar application.
(1)
The shape factors: smaller Vs larger than 1
The results revealed that the shape factor of the three-parameter gamma distribution model was larger than one in the control sample, while less than one in the biochar-added soil columns. Based on the characteristics of gamma distribution, the PDF displayed an increase–decrease pattern when the shape factor was larger than one, but showed a monotonic decreasing pattern when it was equal to or smaller than one [52,56]. The increase–decrease pattern indicated that the increasing rate of concentration of TCP in the outflow rose faster in a short time, about 0.5 PV in this study, and then became smaller gradually. Based on the physical mechanisms, the transportation of TCP in the soil column generally was dominated by convection, diffusion, and adsorption comprehensively [9]. The TCP that first arrived at the lower boundary of soil column was mainly driven by the diffusion, and then driven by the convection. Thus, the scale factor of the model generally should have been larger than one when the diffusion existed. On the other hand, all the shape factors were smaller than one in the biochar-added soil column, which implied that the TCP arriving at the lower boundary firstly driven by the diffusion had disappeared. In fact, the disappeared TCP was absorbed by the biochar because the biochar exhibited a stronger adsorption ability than that of the soil particles due to its larger surface area, porosity, carbon content, functional groups, and aromatic structure [24]. Therefore, the fast transportation of TCP driven by the diffusion was captured by the biochar, even when the addition ratio was only 1%.
(2)
The exponential increase of the adsorption ability
The results above also revealed that the adsorption ability of the soil increased exponentially instead of in a linear form with the rise of the biochar-addition rate in the homogeneously packed soil column. Our previous study and several other studies revealed that the Kd or Kf of soil increased linearly with the rise in biochar content [9,35,36,46,57,58]. The different trend was because the studies above focused on a low content of biochar mixed with the soil (less than 5%). In this study, the trend could also be considered as a linear form when the biochar level was smaller than 5%. The exponential increase may have resulted from the two main factors: more adsorption sites for the molecules of pollutants and stronger adsorption forces from the overlapping of the particles of the biochar. The first aspect can be simply understood because more biochar application would provide more adsorption sites for the pollutants, and has been demonstrated in many other studies [37,39,58]. The second aspect is based on the adsorption theories of the energetically nonuniform surfaces [59], and the overlapping of the adsorption forces can capture the migration of the molecules of pollutants.

4.2. Release of TCP from the Biochar-Mixed Purple Soil

In addition, two main aspects should be discussed further regarding the release of TCP from the biochar-mixed soil, including: (1) the basic patterns of the release of TCP from the biochar-amended soil; and (2) the trends of the other three parameters of the first-order decay kinetics equations.

4.2.1. Basic Pattern of the Release Process and its Implications

(1)
Basic pattern of the release process
The results in this study showed that the typical pattern of TCP released from the soil particles displayed an increase first and then a decrease. Generally, this pattern can be interpreted through the dynamic relationships among three forces: the attraction force driven by the surfaces of soil particles, the repulsive force driven by the concentration gradient between the surface of the soil and the solution, and the motive force from the water flow. At the beginning of the release process, the adsorption and desorption of TCP reached an equilibrium, and the difference between them was zero [8,9]. After inputting the background solution, the dissolved TCP discharged at a faster rate, which resulted in a lower concentration of TCP in the pores of the soil column and a larger concentration gradient gradually. After about 1 PV, the concentration reached the maximum, and then the release rate of TCP began to decrease. The basic pattern was discussed in our previous study [8].
(2)
Different releasing patterns and their implications
Another interesting finding was that the releases of TCP were very close when the biochar-addition rate was equal to or less than 3% while exhibiting a longer tail when increasing the content of biochar. This similar pattern indicated that the sources of the released TCP and the dominating factors were close. The longer tail implied that more TCP was released from the biochar-mixed soil. Hence, both the main source and the influencing factors of the released TCP changed when the biochar-addition rate was increased to 5% or larger.
In fact, in the biochar-applied soil, the TCP was adsorbed by the surfaces of both the soil and biochar particles [47]. If the released TCP was mainly from the surfaces of soil particles, the curves of desorption should have been correspondingly close. In this study, the release curves of TCP with the biochar-addition rates of 1%, 2%, and 3% were close to that of the soil without biochar addition, implying the main source was the surfaces of soil particles instead of the biochar particles. The longer tailing suggested a smaller release rate based on the first-order decay kinetics equation. The reason was that the biochar exhibited a stronger absorbability, and the absorbed TCP could not be released easily due to surface specific adsorption, entrapment in micropores, and partitioning into condensed structures [24,38,41,49]. The quantitative relationship between the decay rate and the content of biochar are discussed in the next section.

4.2.2. The First-Order Decay Kinetics Equation and the Physical Meaning of the Parameters

The results showed that the release of TCP from the biochar-applied soil followed the first-order decay kinetics equation, which has been widely used to describe the decay of the pollutant in the water environment. More interestingly, the parameters of the model showed a different trend with an increase in the biochar content. These were discussed as follows.
(1)
The increase–decrease pattern of the releasable TCP
Some studies have revealed that the released pollutant increases with an increase in the biochar content [48], and this can be attributed to the swelling of a sorbent during sorption, leading to micro-/macro-pore network deformation [24,41,44,48] and weak binding between the pesticides and biochar components [24,42,43,44,48]. In this study, however, the results showed an increase–decrease pattern. The difference was that the ratio of biochar addition was less than 5% in the study above [2,15,48]. An increasing trend was observed when the biochar-application rate was smaller than 5%. When the content of the biochar was increased further, the releasable TCP decreased gradually. The main reason was similar to that for the exponential increase in the adsorption ability: more adsorption sites due to the increased organic carbon content, surface area, and porous structure of the biochar [35], as well as the overlapping of the adsorption forces [59].
(2)
The exponential decrease in the decay constant and power increase in the residual TCP
The decay content of the first-order decay kinetics equation displayed an exponential decrease with an increase in the biochar-application rate. Previous studies reported that the releasable pollutant increased with the content of biochar [41,46,47], but the quantitative relationship between them was not clear. The exponentially decreasing trend would not only provide the quantitative relationship, but also would reflect a more difficult release of TCP with the increase in biochar addition. Thus, the total residual of a pollutant, such as TCP in this study, cannot be simply calculated using a linear formula in a soil with a high content of biochar applied.

5. Conclusions

(1)
The breakthrough curves of TCP in the adsorption process could be well described by CDF of the three-parameter gamma distribution, with a minimum R2 of 0.97. The shape factor, scale factor, and location factor of the model showed a logarithmic trend, linear trend, and exponential trend with the increase in the biochar-addition rate, respectively. The experimental data and simulated results revealed that the adsorption ability of the purple soil increased exponentially with the content of biochar application, implying a small improvement with a low content of biochar application but a much larger improvement with a higher ratio of biochar.
(2)
The release of TCP could be well simulated by the general form of the first-order decay equation, and the three parameters represented the releasable amount, decay constant, and unreleasable amount. The releasable TCP displayed a linear increase–decrease pattern, and the maximum was at a 5% biochar addition. The reasons were a smaller concentration gradient before this content and an overlapping of the adsorption force for soil mixed with a higher content of biochar. The decay constant decreased exponentially with the ratio of biochar application; the residual TCP increased in a power function with an index smaller than one, implying the occupation of adsorption sites in the soil column.
These results above quantitatively revealed the relationship between the ratio of biochar application and the adsorption–desorption of TCP in purple soil, which will provide a systematic experimental scheme, model simulation, and data reference for controlling the migration of TCP and other similar organic pollutants with high water solubility, good stability, and strong migration through an off-site pattern such as an ecological ditch system.

Author Contributions

S.S.: Investigation, Data curation, Formal analysis, Methodology; D.R.: Formal analysis; W.L.: Investigation, Data curation, Writing—review and editing, Supervision, Funding acquisition; X.Z.: Conceptualization, Formal analysis, Methodology, Data curation, Writing—original draft, Visualization, Funding acquisition. All authors have read and agreed to the published version of the manuscript.

Funding

This research was funded by the National Natural Science Foundation of China (Grant Nos. 41701558 and 42167037) and the Science and Technology Funding of Guizhou Province (Grant Nos. [2019]2875, [2018]5781-45, and RCJD2018-21).

Institutional Review Board Statement

Not applicable.

Informed Consent Statement

Not applicable.

Data Availability Statement

The data are identifiable and have not been made available.

Conflicts of Interest

The authors declare no conflict of interests.

References

  1. Saunders, M.; Magnanti, B.L.; Correia, C.S.; Yang, A.; Alamo-Hernández, U.; Riojas-Rodriguez, H.; Calamandrei, G.; Koppe, J.G.; Martin, K.; Keune, H.; et al. Chlorpyrifos and neurodevelopmental effects: A literature review and expert elicitation on research and policy. Environ. Health 2012, 11, S5. [Google Scholar] [CrossRef] [PubMed] [Green Version]
  2. Dechene, A.; Rosendahl, I.; Laabs, V.; Amelung, W. Sorption of polar herbicides and herbicide metabolites by biochar-amended soil. Chemosphere 2014, 109, 180–186. [Google Scholar] [CrossRef]
  3. Das, S.; Hageman, K.J.; Taylor, M.; Michelsen-Heath, S.; Stewart, I. Fate of the organophosphate insecticide, chlorpyrifos, in leaves, soil, and air following application. Chemosphere 2020, 243, 125194. [Google Scholar] [CrossRef] [PubMed]
  4. Racke, K.D. Environmental fate of chlorpyrifos. In Reviews of Environmental Contamination and Toxicology; Springer: New York, NY, USA, 1993; pp. 1–150. [Google Scholar]
  5. Ganapathy, C. Environmental Fate of Triclopyr, Environmental Monitoring and Pest Management Branch; Department of Pesticide Regulation Sacramento: Sacramento, CA, USA, 1997; p. 18. [Google Scholar]
  6. Armbrust, K.L. Chlorothalonil and chlorpyrifos degradation products in golf course leachate. Pest. Manag. Sci. 2001, 57, 797–802. [Google Scholar] [CrossRef] [PubMed]
  7. Lei, W.J.; Zhou, X.Y. Experiment and simulation on adsorption of 3,5,6-Trichloro-2-Pyridinol in typical farmland of purple soil, Southwestern China. Soil. Sediment. Contam. 2017, 26, 345–363. [Google Scholar] [CrossRef]
  8. Lei, W.J.; Tang, X.Y.; Zhou, X.Y. Quantifying dynamic desorption of 3,5,6-trichloro-2-pyridinol in loamy farmland soils. Environ. Sci. Pollut. Res. 2019, 26, 30782–30793. [Google Scholar] [CrossRef]
  9. Lei, W.J.; Tang, X.Y.; Zhou, X.Y. Biochar amendment effectively reduces the transport of 3,5,6-trichloro-2-pyridinol (a main degradation product of chlorpyrifos) in purple soil: Experimental and modeling. Chemosphere 2020, 245, 125651. [Google Scholar] [CrossRef]
  10. Dai, H.; Asakawa, F.; Suna, S.; Hirao, T.; Karita, T.; Fukunaga, I.; Jitsunari, F. Investigation of indoor air pollution by chlorpyrifos: Determination of chlorpyrifos in indoor air and 3, 5, 6-trichloro-2-pyridinol in residents’ urine as an exposure index. Environ. Health. Prev. 2003, 8, 139–145. [Google Scholar] [CrossRef]
  11. Meeker, J.D.; Ryan, L.; Barr, D.B.; Hauser, R. Exposure to non-persistent insecticides and male reproductive hormones. Epidemiology 2006, 17, 61–68. [Google Scholar] [CrossRef]
  12. Li, Z.M.; Zhang, X.W.; He, Y.R.; Tang, S.J. Purple Soil in China (a); Science Press: Beijing, China, 1991. [Google Scholar]
  13. He, M.R. Purple Soils of China; Science Press: Beijing, China, 2003. [Google Scholar]
  14. Zhang, W.; Tang, X.Y.; Xian, Q.S.; Weisbrod, N.; Yang, J.E.; Wang, H.L. A field study of colloid transport in surface and subsurface flows. J. Hydrol. 2016, 542, 101–114. [Google Scholar] [CrossRef]
  15. He, Y.; Liu, C.; Tang, X.Y.; Xian, Q.S.; Zhang, J.Q.; Guan, Z. Biochar impacts on sorption-desorption of oxytetracycline and florfenicol in an alkaline farmland soil as affected by field ageing. Sci. Total. Enviro. 2019, 671, 928–936. [Google Scholar] [CrossRef]
  16. Manna, S.; Singh, N. Biochars mediated degradation, leaching and bioavailability of pyrazosulfuron-ethyl in a sandy loam soil. Geoderma 2019, 334, 63–71. [Google Scholar] [CrossRef]
  17. Liu, X.; Zhou, J.; Chi, Z.; Zheng, J.; Li, L.; Zhang, X. Biochar provided limited benefits for rice yield and greenhouse gas mitigation six years following an amendment in a fertile rice paddy. Catena 2019, 179, 20–28. [Google Scholar] [CrossRef]
  18. Joseph, S.D.; Camps-Arbestain, M.; Lin, Y.; Munroe, P.; Chia, C.H.; Hook, J.; Lehmann, J. An investigation into the reactions of biochar in soil. Soil. Res. 2010, 48, 501–515. [Google Scholar] [CrossRef]
  19. Trigo, C.; Spokas, K.A.; Cox, L.; Koskinen, W.C. Influence of soil biochar aging on sorption of the herbicides MCPA, nicosulfuron, terbuthylazine, indaziflam, and fluoroethyldiaminotriazine. J. Agric. Food. Chem. 2014, 62, 10855–10860. [Google Scholar] [CrossRef] [Green Version]
  20. Chen, D.; Liu, X.; Bian, R.; Cheng, K.; Zhang, X.; Zheng, J.; Joseph, S.; Crowley, D.; Pan, G.; Li, L. Effects of biochar on availability and plant uptake of heavy metals—A meta-analysis. J. Environ. Manag. 2018, 222, 76–85. [Google Scholar] [CrossRef]
  21. Sashidhar, P.; Kochar, M.; Singh, B.; Gupta, M.; Cahill, D.; Adholeya, A.; Dubey, M. Biochar for delivery of agri-inputs: Current status and future perspectives. Sci. Total Environ. 2020, 703, 134892. [Google Scholar] [CrossRef]
  22. Xu, P.; Sun, C.X.; Ye, X.Z.; Xiao, W.D.; Zhang, Q.; Wang, Q. The effect of biochar and crop straws on heavy metal bioavailability and plant accumulation in a Cd and Pb polluted soil. Ecotox. Environ. Saf. 2016, 132, 94–100. [Google Scholar] [CrossRef]
  23. Blanco-Canqui, H. Biochar and soil physical properties. Soil. Sci. Soc. Am. J. 2017, 81, 687–711. [Google Scholar] [CrossRef] [Green Version]
  24. Liu, Y.X.; Lonappan, L.S.; Brar, S.K.; Yang, S.M. Impact of biochar amendment in agricultural soils on the sorption, desorption, and degradation of pesticides: A review. Sci. Total Environ. 2018, 645, 60–70. [Google Scholar] [CrossRef]
  25. Xu, G.; Lv, Y.; Sun, J.; Shao, H.; Wei, L. Recent advances in biochar applications in agricultural soils: Benefits and environmental implications. Clean. Soil. Air Water 2012, 40, 1093–1098. [Google Scholar] [CrossRef] [Green Version]
  26. Li, J.; Li, Y.; Wu, M.; Zhang, Z.; Lü, J. Effectiveness of low-temperature biochar in controlling the release and leaching of herbicides in soil. Plant. Soil. 2013, 370, 333–344. [Google Scholar] [CrossRef]
  27. Mendes, K.; Hall, K.; Spokas, K.; Koskinen, W.; Tornisielo, V. Evaluating agricultural management effects on alachlor availability: Tillage, green manure, and biochar. Agronomy 2017, 7, 64. [Google Scholar] [CrossRef] [Green Version]
  28. Wu, P.; Ata-Ul-Karim, S.T.; Singh, B.P.; Wang, H.L.; Wu, T.L.; Liu, C.; Fang, G.D.; Zhou, D.M.; Wang, Y.J.; Chen, W.F. A scient metric review of biochar research in the past 20 years (1998–2018). Biochar 2019, 1, 23–43. [Google Scholar] [CrossRef] [Green Version]
  29. Guo, M.X.; Song, W.P.; Tian, J. Biochar-facilitated soil remediation: Mechanisms and efficacy variations. Front. Environ. Sci. 2020, 8, 521512. [Google Scholar] [CrossRef]
  30. Hagner, M.; Penttinen, O.P.; Tiilikkala, K.; Setälä, H.M. The effects of biochar, wood vinegar and plants on glyphosate leaching and degradation. Eur. J. Soil. Biol. 2013, 58, 1–7. [Google Scholar] [CrossRef]
  31. Delwiche, K.B.; Lehmann, J.; Walter, M.T. Atrazine leaching from biochar amended soils. Chemosphere 2014, 95, 346–352. [Google Scholar] [CrossRef] [Green Version]
  32. Yue, L.; Ge, C.; Feng, D.; Yu, H.; Deng, H.; Fu, B. Adsorption-desorption behavior of atrazine on agricultural soils in China. J. Environ. Sci. 2017, 57, 180–189. [Google Scholar] [CrossRef]
  33. Khorram, M.S.; Zheng, Y.; Lin, D.; Zhang, Q.; Fang, H.; Yu, Y. Dissipation of fomesafen in biochar-amended soil and its availability to corn (Zea mays L.) and earthworm (Eisenia fetida). J. Soils. Sediments. 2016, 16, 2439–2448. [Google Scholar] [CrossRef]
  34. OECD. 106: Adsorption–desorption using a batch equilibrium method. In OECD Guideline for the Testing of Chemicals; OCED: Paris, France, 2000. [Google Scholar]
  35. Jin, J.W.; Li, Y.A.; Zhang, J.Y.; Wu, S.C.; Cao, Y.C.; Liang, P.; Zhang, J.; Wong, M.H.; Wang, M.Y.; Shan, S.D.; et al. Influence of pyrolysis temperature on properties and environmental safety of heavy metals in biochars derived from municipal sewage sludge. J. Hazard. Mater. 2016, 320, 417–426. [Google Scholar] [CrossRef]
  36. Khorram, M.S.; Lin, D.; Zhang, Q.; Zheng, Y.; Fang, H.; Yu, Y. Effects of aging process on adsorption–desorption and bioavailability of fomesafen in an agricultural soil amended with rice hull biochar. J. Environ. Sci. 2017, 56, 180–191. [Google Scholar] [CrossRef] [PubMed]
  37. Ding, T.D.; Huang, T.; Wu, Z.; Li, W.; Guo, K.X.; Li, J.Y. Adsorption–desorption behavior of carbendazim by sewage sludge-derived biochar and its possible mechanism. RSC. Adv. 2019, 9, 35209–35216. [Google Scholar] [CrossRef] [PubMed] [Green Version]
  38. Wang, H.L.; Lin, K.D.; Hou, Z.N.; Richardson, B.; Gan, J. Sorption of the herbicide terbuthylazine in two New Zealand Forest soils amended with biosolids and biochars. J. Soils Sediments 2010, 10, 283–289. [Google Scholar] [CrossRef]
  39. Martin, S.M.; KooKana, R.S.; Zwieten, L.V.; Krull, E. Marked changes in herbicide sorption-desorption upon ageing of biochars in soil. J. Hazard. Mater. 2012, 231, 70–78. [Google Scholar] [CrossRef]
  40. Cabrera, A.; Cox, L.; Spokas, K.; Hermosin, M.C.; Cornejo, J.; Koskinen, W.C. Influence of biochar amendments on the sorption–desorption of aminocyclopyrachlor, bentazone and pyraclostrobin pesticides to an agricultural soil. Sci. Total Environ. 2014, 470, 438–443. [Google Scholar] [CrossRef] [Green Version]
  41. Sopeña, F.; Semple, K.; Sohi, S.; Bending, G. Assessing the chemical and biological accessibility of the herbicide isoproturon in soil amended with biochar. Chemosphere 2012, 88, 77–83. [Google Scholar] [CrossRef]
  42. Tatarková, V.; Hiller, E.; Vaculík, M. Impact of wheat straw biochar addition to soil on the sorption, leaching, dissipation of the herbicide (4-chloro-2-methylphenoxy) acetic acid and the growth of sunflower (Helianthus annuus L.). Ecotoxicol. Environ. Saf. 2013, 92, 215–221. [Google Scholar] [CrossRef]
  43. Agrafioti, E.; Kalderis, D.; Diamadopoulos, E. Ca and Fe modified biochars as adsorbents of arsenic and chromium in aqueous solutions. J. Environ. Manag. 2014, 146, 444–450. [Google Scholar] [CrossRef]
  44. Khorram, M.S.; Wang, Y.; Jin, X.; Fang, H.; Yu, Y. Reduced mobility of fomesafen through enhanced adsorption in biochar-amended soil. Environ. Toxicol. Chem. 2015, 34, 1258–1266. [Google Scholar] [CrossRef]
  45. Acosta, R.; Fierro, V.; Martínez, D.; Narbalatz, D.; Celzard, A. Tetracycline adsorption onto activated carbons produced by KOH activation of tyre pyrolysis char. Chemosphere 2016, 149, 168–176. [Google Scholar] [CrossRef]
  46. Yu, X.Y.; Ying, G.G.; Kookana, R.S. Sorption and desorption behaviors of diuron in soils amended with charcoal. J. Agric. Food. Chem. 2006, 54, 8545–8550. [Google Scholar] [CrossRef] [PubMed]
  47. Yu, H.M. Sorption/Desorption Characteristics and Mechanisms of Biochars with Atrazine in Environment. Ph.D. Thesis, China University of Mining and Technology, Beijing, China, 2014. [Google Scholar]
  48. Deng, H.; Feng, D.; He, J.X.; Li, F.Z.; Yu, H.M.; Ge, C.J. Influence of biochar amendments to soil on the mobility of atrazine using sorption-desorption and soil thin-layer chromatography. Ecol. Eng. 2017, 99, 381–390. [Google Scholar] [CrossRef]
  49. Yu, X.Y.; Pan, L.G.; Ying, G.G.; Kookana, R.S. Enhanced and irreversible sorption of pesticide pyrimethanil by soil amended with biochars. J. Environ. Sci. 2010, 22, 615–620. [Google Scholar] [CrossRef]
  50. Jaynes, E.T. Information theory and statistical mechanics. Phys. Rev. 1957, 106, 620–630. [Google Scholar] [CrossRef]
  51. Conrad, K. Probability distributions and maximum entropy. Entropy 2004, 6, 10. [Google Scholar]
  52. Zhou, X.; Lei, W.; Ma, J. Entropy base estimation of moisture content of the Top 10-m unsaturated soil for the Badain Jaran desert in northwestern China. Entropy 2016, 18, 323. [Google Scholar] [CrossRef] [Green Version]
  53. Montoya, J.C.; Costa, J.L.; Liedl, R.; Bedmar, F.; Daniel, P. Effects of soil type and tillage practice on atrazine transport through intact soil cores. Geoderma 2006, 137, 161–173. [Google Scholar] [CrossRef]
  54. Fernández-Bayo, J.D.; Nogales, R.; Romero, E. Winery vermicompost to control the leaching of diuron, imidacloprid and their metabolites: Role of dissolved organic carbon content. J. Environ. Sci. Health B 2015, 50, 190–200. [Google Scholar] [CrossRef]
  55. Zand, A.D.; Grathwohl, P. Enhanced immobilization of polycyclic aromatic hydrocarbons in contaminated soil using forest wood-derived biochar and activated carbon under saturated conditions, and the importance of biochar particle size. Pol. J. Environ. Stud. 2016, 25, 427–441. [Google Scholar] [CrossRef]
  56. McLaughlin, M.P. A Compendium of Common Probability Distributions, 2nd ed. 2016. Available online: https://www.causascientia.org/math_stat/Dists/Compendium.pdf (accessed on 2 February 2022).
  57. Yang, Y.N.; Sheng, G.Y.; Huang, M.S. Bioavailability of diuron in soil containing wheat-straw-derived char. Sci. Total Environ. 2006, 354, 170–178. [Google Scholar] [CrossRef]
  58. Tang, J.; Zhu, W.; Kookana, R.; Katayama, A. Characteristics of biochar and its application in remediation of contaminated soil. J. Biosci. Bioeng. 2013, 116, 653–659. [Google Scholar] [CrossRef] [PubMed]
  59. Dubinin, M.M. The potential theory of adsorption of gases and vapors for adsorbents with energetically nonuniform surfaces. Chem. Rev. 1960, 60, 235–241. [Google Scholar] [CrossRef]
Figure 1. BTCs of TCP and Br in soil with different ratios of biochar.
Sustainability 14 08712 g001aSustainability 14 08712 g001b
Figure 2. Simulated BTCs of TCP in biochar-added soil.
Sustainability 14 08712 g002
Figure 3. Trend of the three parameters of gamma distribution with the increase in biochar addition rate.
Sustainability 14 08712 g003
Figure 4. Trend of adsorbed TCP with the increase in biochar addition rate at different inputs of TCP.
Sustainability 14 08712 g004
Figure 5. Correlation between the adsorbed TCP and ratios of biochar application at different removal rates.
Sustainability 14 08712 g005
Figure 6. BTCs of TCP and Br and scaled BTCs of Br after the input of background solution.
Sustainability 14 08712 g006aSustainability 14 08712 g006b
Figure 7. Dynamic release of TCP from the soil applied with different ratios of biochar.
Sustainability 14 08712 g007
Figure 8. Dynamic of the residual TCP in the biochar-amended soil.
Sustainability 14 08712 g008aSustainability 14 08712 g008b
Figure 9. Relationships among the biochar-addition rate and the releasable TCP, unreleasable TCP, and degradation constant.
Sustainability 14 08712 g009
Table 1. Parameters of three-parameter gamma distribution and the error analysis.
Ratio of Biochar
Sddition
Parameters of the ModelSquare of Correlation Coefficient (R2)Mean Squared Error (MSE)
αβγ
01.820.571.240.99420.0379
1%0.553.851.390.97740.0534
2%0.783.411.520.99720.0175
3%0.923.061.550.99540.0213
5%0.687.591.720.99890.0081
7.5%0.867.871.670.99960.0040
10%0.8610.361.930.99910.0048
15%0.9710.763.120.99950.0029
20%1.0025.144.220.99650.0025
Table 2. Threshold times represented in PV for several typical removal rates with different biochar addition rates.
BiocharRemoval Rate
RR = 90%RR = 75%RR = 50%RR = 25%RR = 10%RR = 1%
0%1.491.712.092.643.293.76
1%1.441.662.454.267.049.29
2%1.682.083.155.178.0010.20
3%1.812.303.455.478.1910.27
5%1.942.644.688.8114.7819.50
7.5%2.193.316.0411.0117.8023.02
10%2.634.127.7514.3223.2930.17
15%4.166.0310.2817.6127.3634.75
20%7.0411.7922.2039.8663.1080.64
Publisher’s Note: MDPI stays neutral with regard to jurisdictional claims in published maps and institutional affiliations.