Article

XGBoost for Imbalanced Multiclass Classification-Based Industrial Internet of Things Intrusion Detection Systems

1
IoT Research Center, Pusan National University, Busan 609735, Korea
2
Blockchain Platform Research Center, Pusan National University, Busan 609735, Korea
3
School of Computer Science and Engineering, Pusan National University, Busan 609735, Korea
*
Author to whom correspondence should be addressed.
Sustainability 2022, 14(14), 8707; https://doi.org/10.3390/su14148707
Submission received: 8 June 2022 / Revised: 8 July 2022 / Accepted: 13 July 2022 / Published: 16 July 2022
(This article belongs to the Special Issue Security Technology-Driven Development for Sustainable Networks)

Abstract

:
The Industrial Internet of Things (IIoT) has advanced digital technology and the fastest interconnection, which creates opportunities to substantially grow industrial businesses today. Although IIoT provides promising opportunities for growth, the massive sensor IoT data collected are easily attacked by cyber criminals. Hence, IIoT requires different high security levels to protect the network. An Intrusion Detection System (IDS) is one of the crucial security solutions, which aims to detect the network’s abnormal behavior and monitor safe network traffic to avoid attacks. In particular, the effectiveness of the Machine Learning (ML)-based IDS approach to building a secure IDS application is attracting the security research community in both the general cyber network and the specific IIoT network. However, most available IIoT datasets contain multiclass output data with imbalanced distributions. This is the main reason for the reduction in the detection accuracy of attacks of the ML-based IDS model. This research proposes an IDS for IIoT imbalanced datasets by applying the eXtremely Gradient Boosting (XGBoost) model to overcome this issue. Two modern IIoT imbalanced datasets were used to assess our proposed method’s effectiveness and robustness, X-IIoTDS and TON_IoT. The XGBoost model achieved excellent attack detection with F1 scores of 99.9% and 99.87% on the two datasets. This result demonstrated that the proposed approach improved the detection attack performance in imbalanced multiclass IIoT datasets and was superior to existing IDS frameworks.

1. Introduction

The Industrial Internet of Things (IIoT) contains physical service systems and digital equipment such as sensors, actuators, vehicular networks, interfaces of integration and communication, etc. The IIoT has been used to generate extensive data from multiple sensors and IoT devices. Therefore, the IIoT is utilized for intelligent operations in various management domains, such as smart cities, smart homes, smart factories, smart grids, smart agriculture, etc., [1,2,3]. Nevertheless, massive data are created from sensors within the IIoT network, making it increasingly attractive for cyber attacks worldwide. For example, the opening up of the connected devices to expand the IIoT network [4] has increased the threats of cyber attacks. Hence, the IIoT faces attacks that endanger the risk of operating seamlessly in supply organizations.
Cyber attackers steal or obliterate information from computers and network structures, promoting cyberwar. Several types of attacks are Man-in-the-Middle (MitM), data theft, botnet, port-sweep, address-sweep, network scanning, and port-scan attacks. Due to the enormous variety of IoT devices, there can be an unsecured connection from Machine-to-People (M2P) and Machine-to-Machine (M2M); so, hackers can easily steal and hold vital information. This not only violates the privacy and usage of network space but also causes operational disruption and financial loss [5]. In fact, several industrial IoT systems have been attacked, such as a well-known attack on the Ukrainian power grid in 2015 [6], where cyber criminals attained remote access to the grid’s control unit and disrupted power to over 230,000 users. In 2018, a Taiwanese chip manufacturer with an IIoT network was attacked [7], resulting in damages of approximately USD 170 million. Hence, although there is no chance of changing the increased dependence on digitalization and automation, industrial organizations are still seeking enhanced methods to secure their IIoT networks. It is estimated that IIoT enterprises will spend up to USD 90 trillion by 2030 if they fail to find effective mitigation strategies to prevent cyber attacks on the IIoT network [8]. Therefore, it is vital to protect infrastructures and services, as the volume of IIoT devices in every industrial organization is increasing daily [9].
An IDS has a critical role in enhancing the security of the IIoT network to ensure the integrity of the information and the privacy of the data transmitted. An IDS aims to automatically detect, report, react to, and prevent any malicious or attack activities, which can affect the security of an IIoT network [10]. IDS is considered a precise or effective method when it can obtain a high accuracy of attack detection and a low false-positive rate [5]. In addition, an IDS should determine when the hackers begin probing devices, which is the initial step in generating a secure IIoT [11]. A few years ago, deep learning (DL)-based IDS, especially the Deep Neural Network (DNN) model was considered a potential method for IDS, for example, Recurrent Neural Network (RNN), Long-Short Term Memory (LSTM), and Gated Recurrent Unit (GRU) models. However, these DL methods have not been effective in detecting attack data with an imbalanced distribution. Studies [12,13,14] have applied variant RNN models on the KDD cup dataset. Although the average detection rate (DR) obtained from these methods was over 98%, the average User to Root (U2R) attack type detection was still below 50% or even not detected because of the very small amount of U2R samples compared to the other attack-type samples. Next, Le et al. [15,16] built an IDS model based on RNN, LSTM, and GRU models using two datasets, the NSL-KDD and ISCX datasets. Their experimental results showed that the SFSDT-GRU model obtained the best performance compared to variant RNN models. In particular, the model achieved a detection attack rate of 91.8% and a U2R attack detection accuracy of 90%.
In recent years, machine learning (ML) has also gained increasing attention and developed applications to detect malicious activity on a target network, because this technology can balance performance efficiency and computational cost for next-generation IoT networks. Researchers have successfully developed advanced IDS methods based on the ML method, which have achieved a promising attack detection performance [17]. Still, the major issue of existing IDS datasets is the huge volume both in the number of network traces and feature space dimensions. Moreover, one of the challenges in the IIoT IDS dataset is the imbalanced distribution in the number of samples for each attack type. This has caused previous ML or DL models to not obtain a high performance in detecting particular attack types. In this paper, we propose an ML-based IIoT IDS method approach that aims to improve the performance of the attack detection of different types with an imbalanced distribution of data. The model is trained using the latest and benchmark intrusion detection IIoT datasets that contain an imbalanced distribution of attack type data. Hence, the main contributions of this study are as follows.
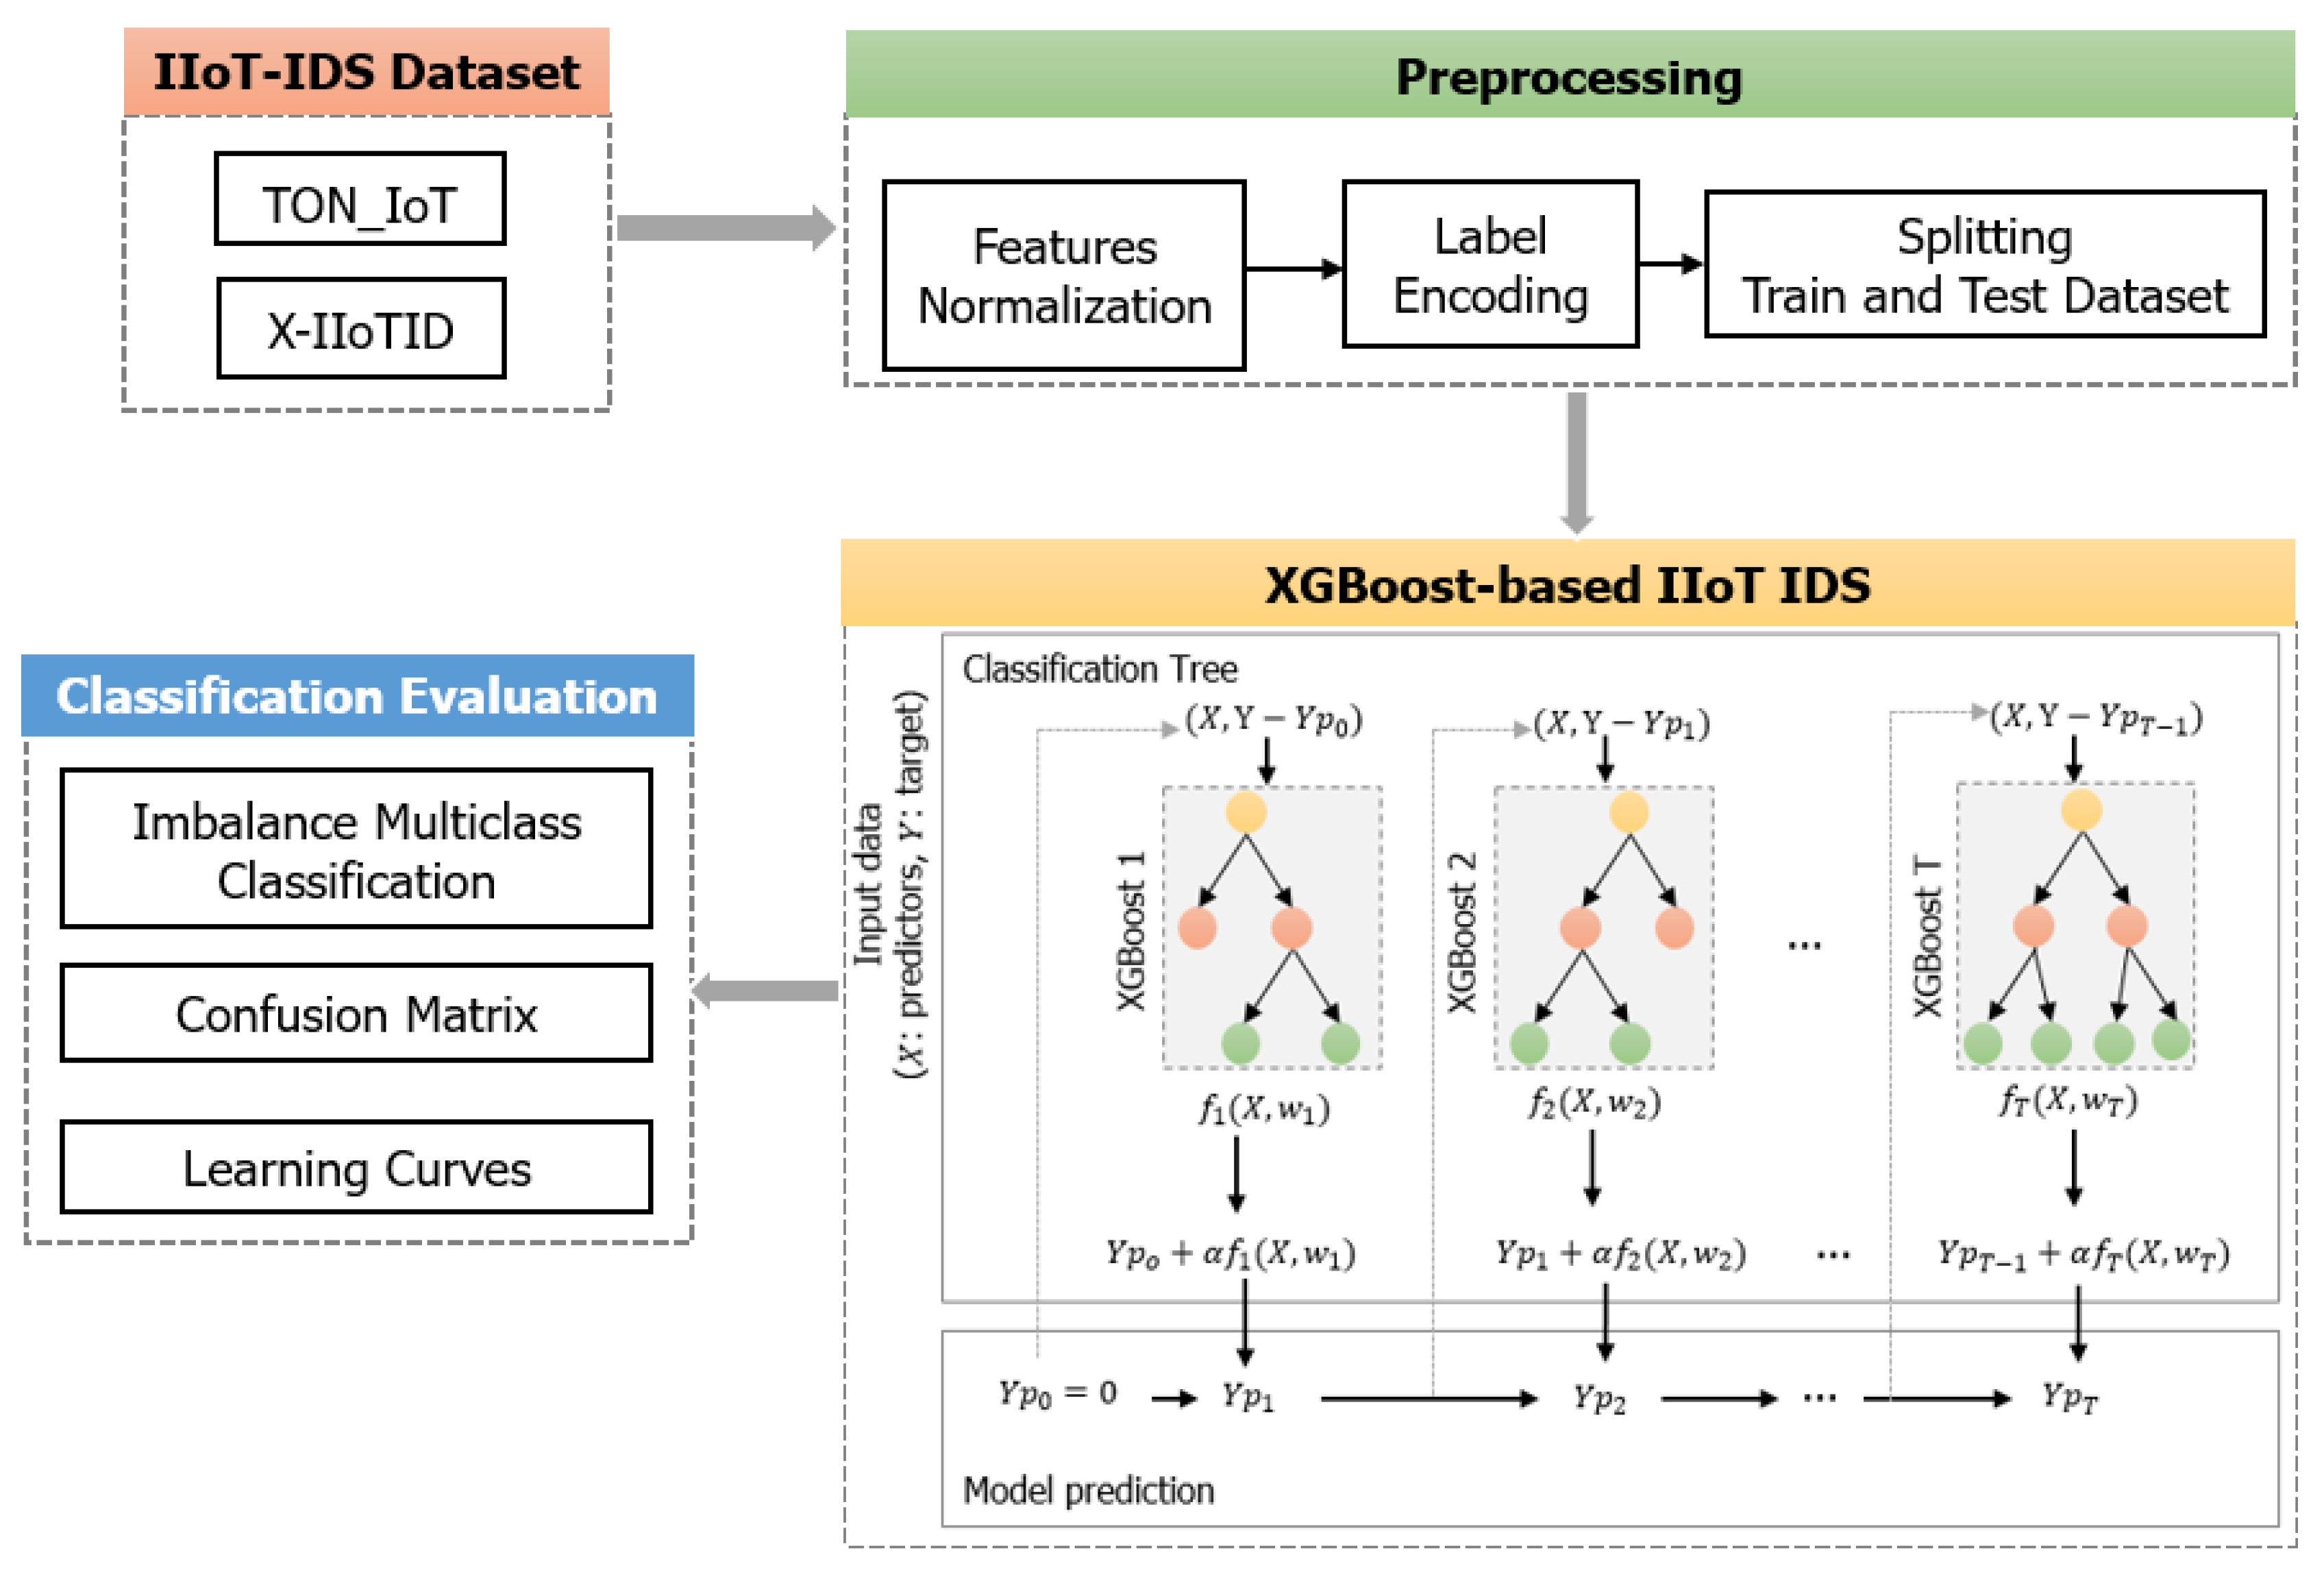
  • We built an XGBoost model to improve the detection of imbalanced distribution attack types using two benchmark IIoT IDS datasets, the X-IIoTID and TON_IoT. The raw datasets were preprocessed in several steps, including normalizing features, encoding labels, and splitting the training and testing data.
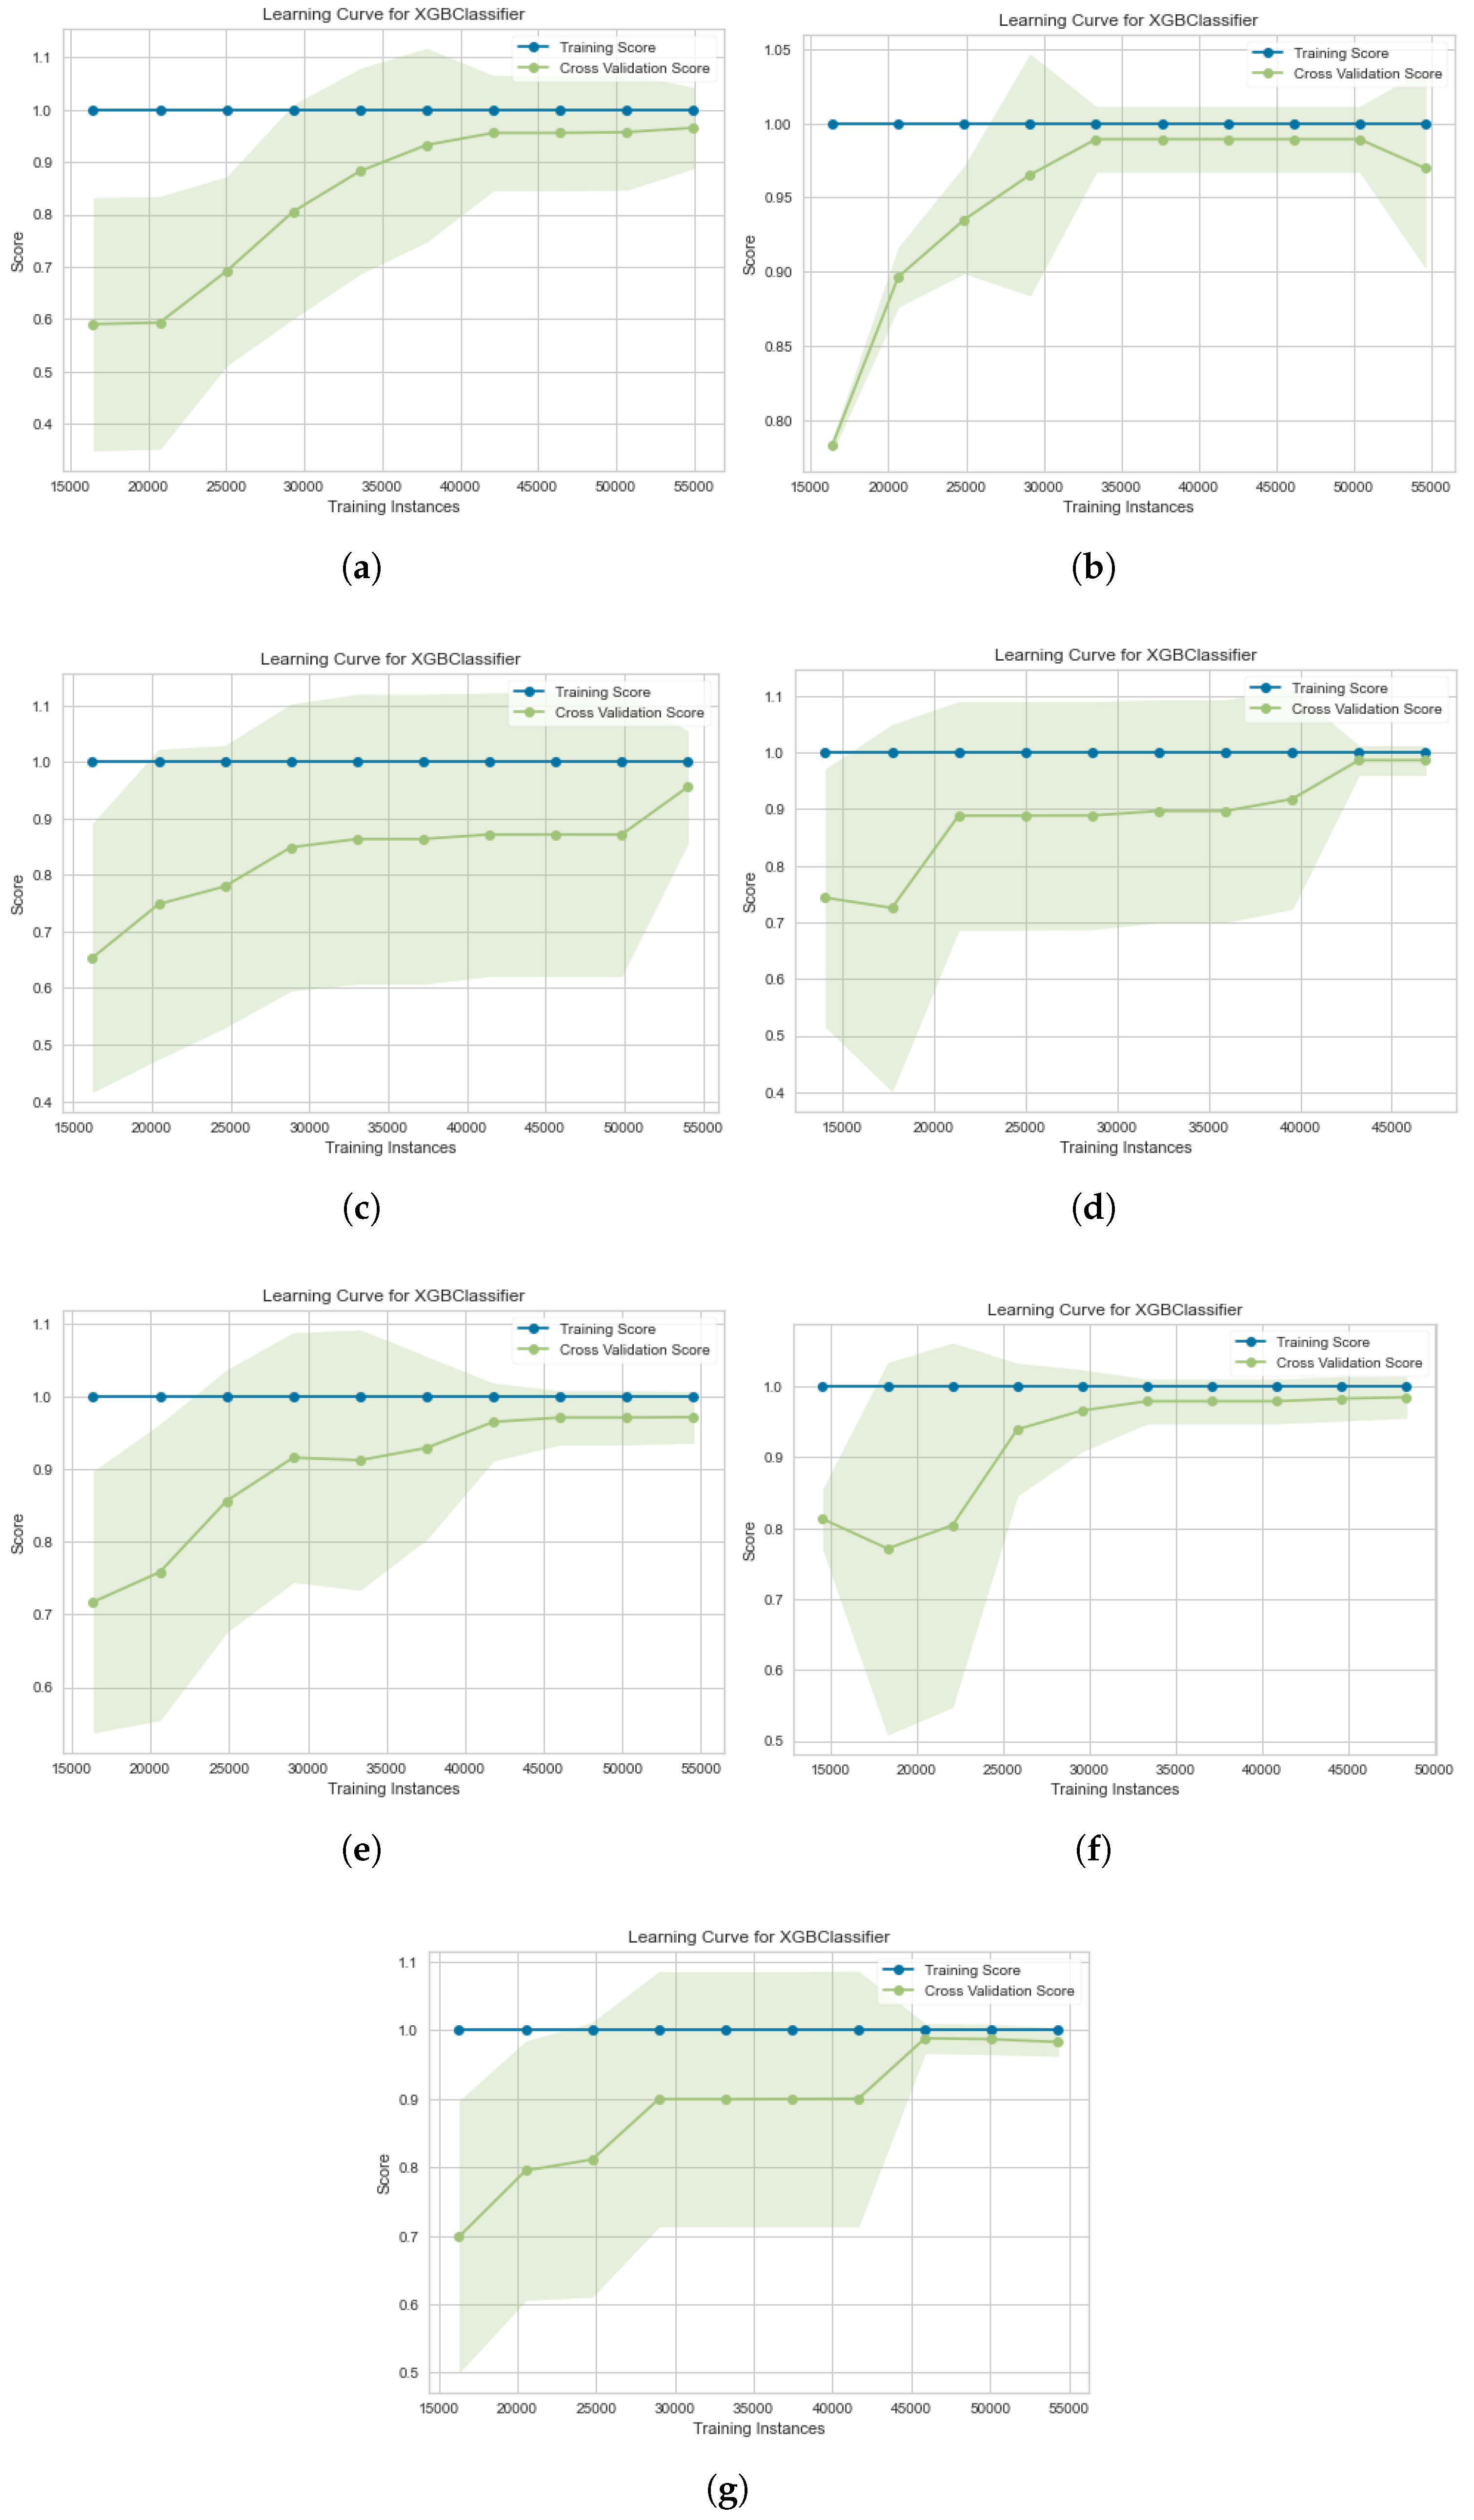
  • We evaluated the proposed method with imbalanced multiclass classification by measuring two performance metrics, which were the confusion matrix and the learning curve.
  • We compared the proposed method’s results with other related methods. The experimental results showed that our model enhanced the performance of attack detection for imbalanced multiclass classification in IIoT-based IDS datasets and outperformed other previous models on the same datasets.
The remainder of this paper is organized as follows. Section 2 describes the materials and methods. Section 3 presents the results of the proposed method with the imbalanced multiclass classification and performance learning curve results and then discusses the performance comparison. Finally, Section 4 provides the conclusions of the study and future work.

2. Materials and Methods

This section provides (1) a summary of the related research work in ML-based IoT/IIoT IDS methods, (2) the IIoT datasets used and their imbalanced distribution of attack type data, and (3) the proposed XGBoost model to solve the imbalanced multiclass classification.

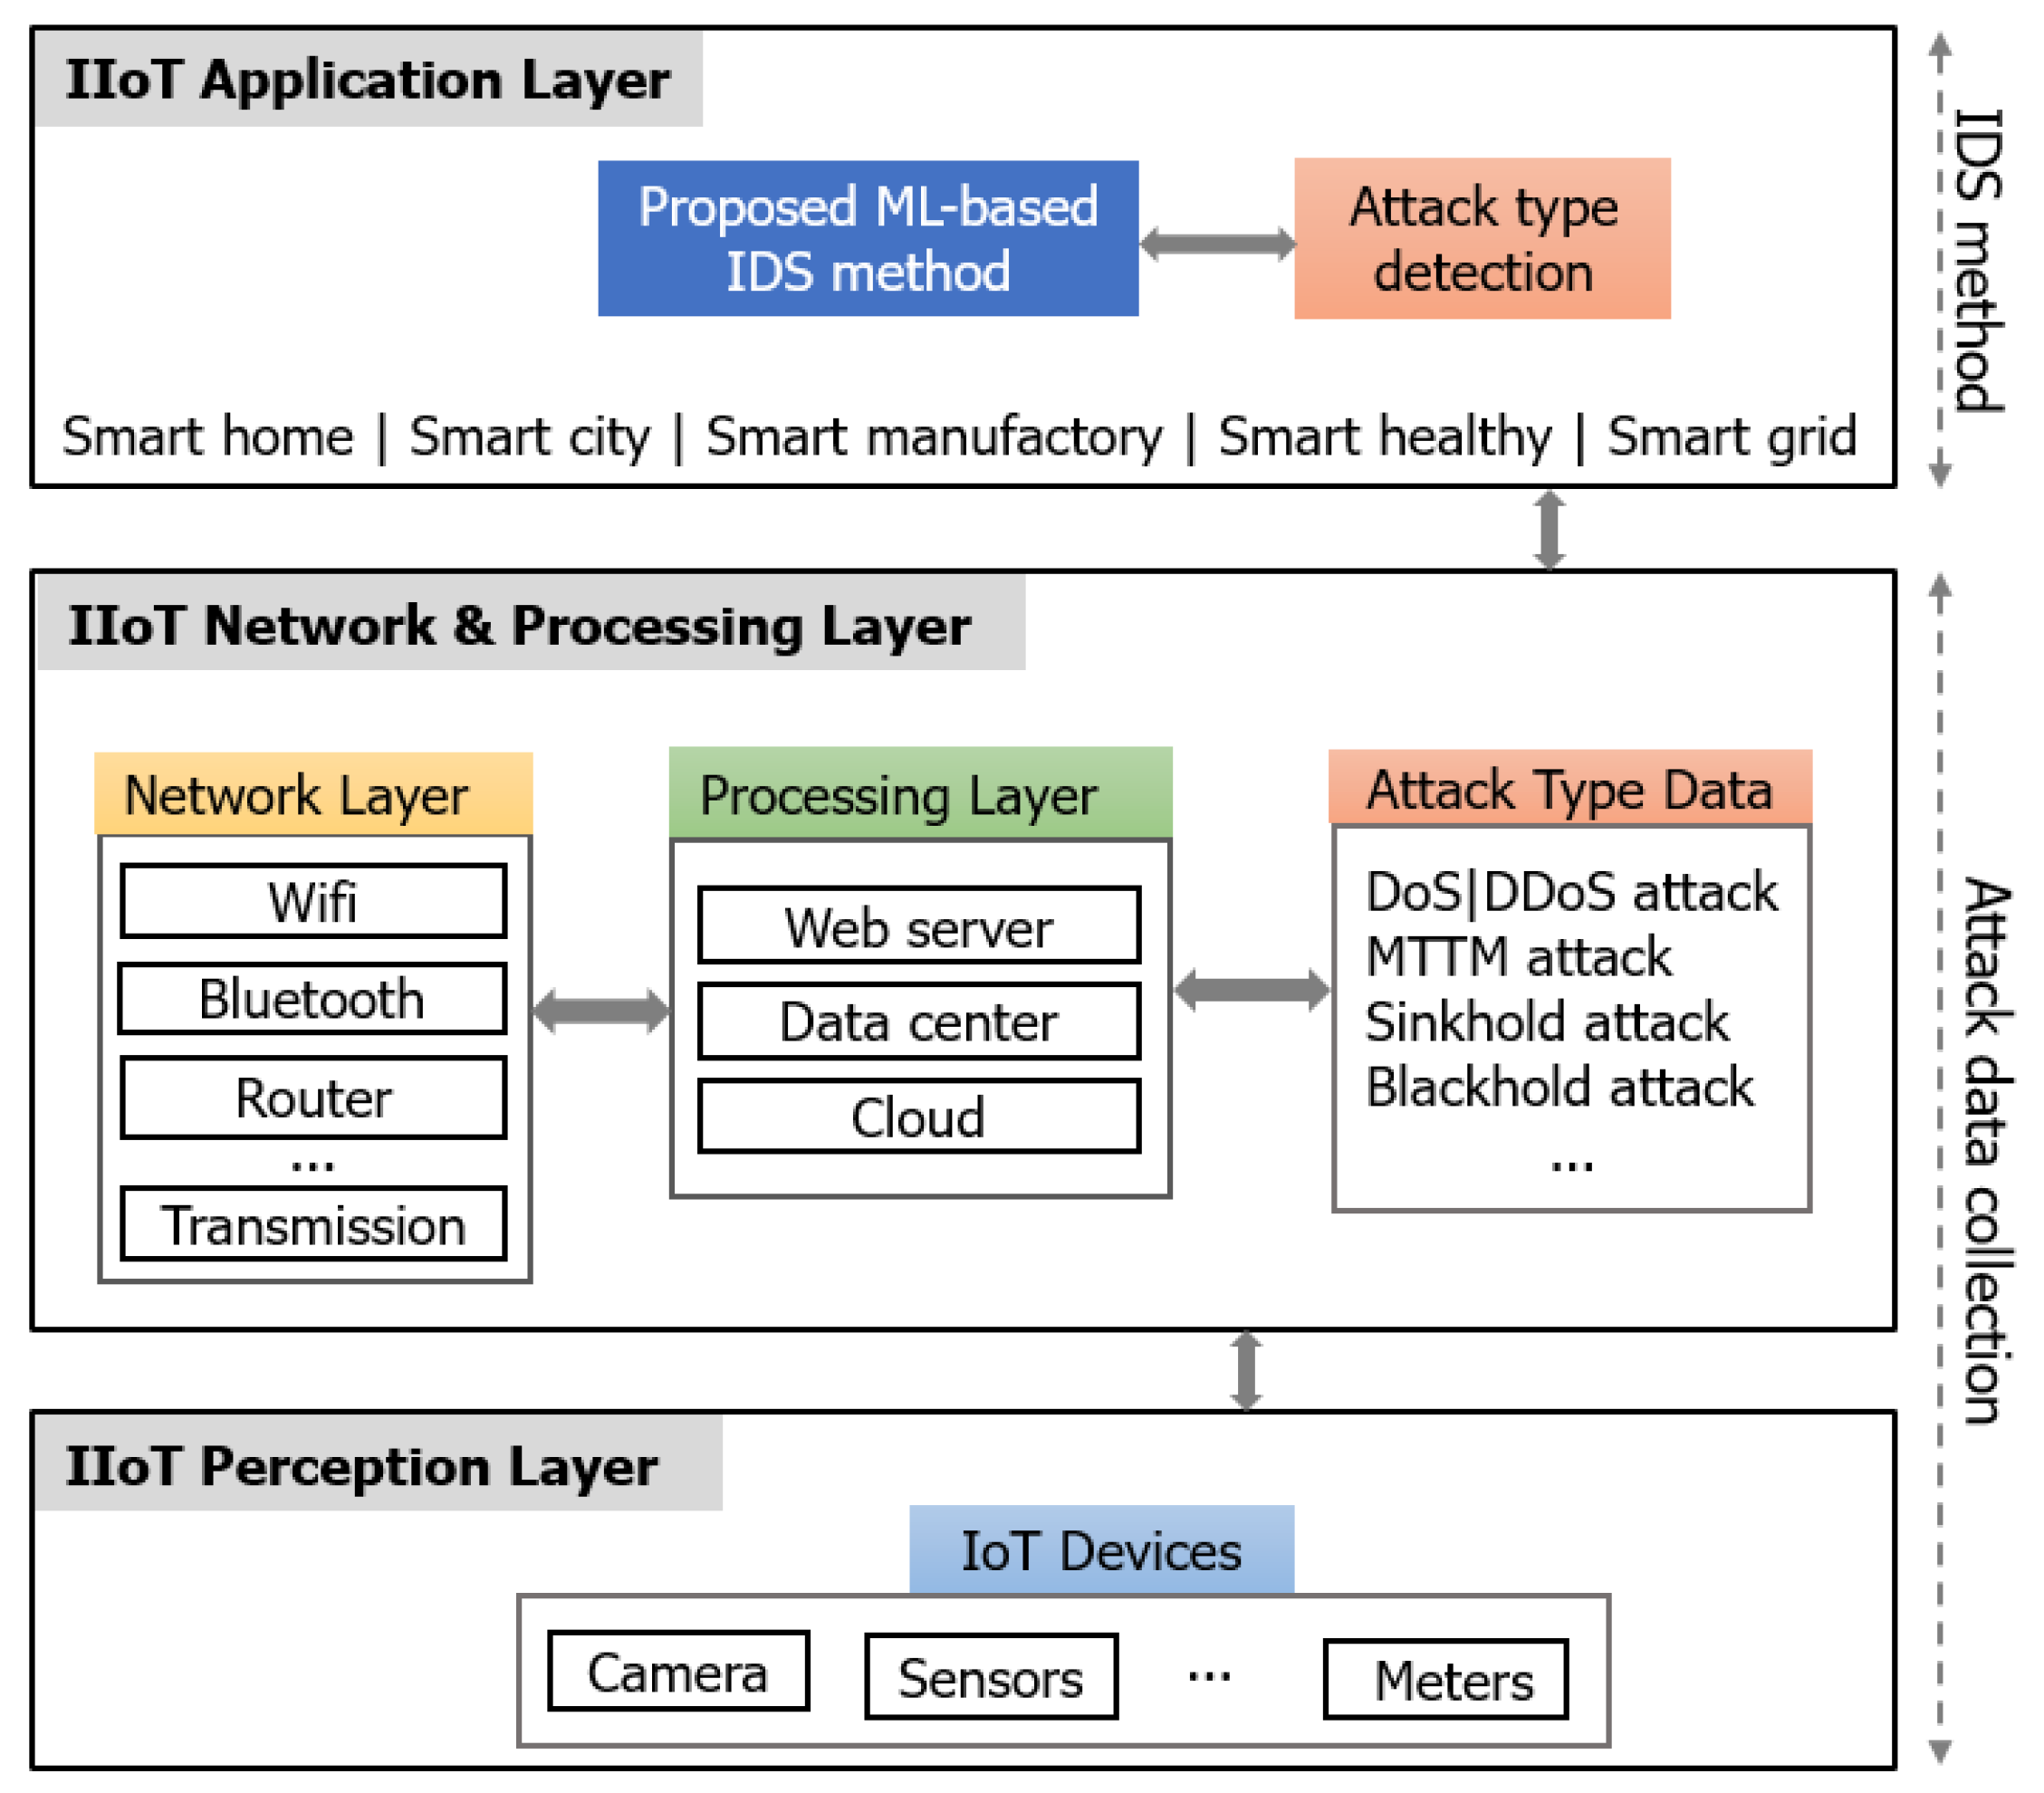
2.1. ML-Based IoT/IIoT IDS Context

Numerous cyber attacks target industrial enterprises around the world. Therefore, it is necessary to build an effective IDS to protect industrial systems by fighting against attacks automatically and intelligently. There have been many ML-based IDS methods proposed to achieve this goal. ML-based IDS classification techniques learn from labeled input and evaluate new observations in the binary or multiclass format. Some recent methods used for IDS classification include Support Vector Machine (SVM), Naïve Bayes (NB), k-Nearest Neighbors (kNN), Gradient Boosting Machines (GBM), Random Forest (RF), Decision Tree (DT), Logistic Regression (LR), Linear Discriminant Analysis (LDA), Classification and Regression Trees (CART), Neural Network (NN), etc.
For a general network, Al-Khateeb et al. [18] proposed an anomaly detection method based on an NB classifier. This method was evaluated using modeled data to predict anomalous behaviors. Le et al. [19] applied an RF model to detect types of DoS attacks in wireless sensor networks (WSNs). Sornsuwit et al. [20] proposed a hybrid ML method to improve detection of cyber threats using two datasets: KDD Cup and UNSW-NB15. Hui Wu et al. [21] proposed an ML-based method to detect cyber attacks, such as DoS, DDoS, and malware with high performance accuracy.
For an IoT/IIoT network, Khraisat et al. [22] built a hybrid ML model based on an SVM model to detect zero-day IoT network attacks. Similarly, Ullah et al. [23] proposed a hybrid ML model based on DT and RF to detect real-time IoT network attacks. Le et al. [24] proposed ensemble trees models comprising DT and RF to detect attacks on IoT-based IDS datasets. Alsamiri et al. [25] examined several ML models to detect attacks and based on the experimental results selected the model most efficient on IoT network data. Pacheco et al. [26] proposed an ML-based IDS method to detect IIoT node attacks with a high detection accuracy rate and low false alarm rate.
For the X-IIoTDS dataset, Al-Hawawreh et al. [27] implemented three IDS models, including Asynchronous Peer-to-Peer Federated Learning (AP2PFL)-Multilayer Perceptron (AP2PFL-MLP), AP2PFL-DNN, and Data Purifying Module–Diagnostic and Decision Module (DPM–DDM) models using the X-IIoTID and NSL-KDD datasets. The experimental results showed that the DPM–DDM model obtained average F1 scores of 97.41% and 89.93% on X-IIoTID and NSL-KDD, respectively, which outperformed the other two models. However, the DPM–DDM model obtained low detection rates for targeted ransomware state data on the two datasets. In the X-IIoTID dataset, the F1 score was 64.66% for the “exploitation” attack. Furthermore, in the NSL-KDD dataset, the F1 score was 55.81% for the “Weaponization” attack. Al-Hawawreh et al. [28] applied several learning models on the same dataset. The experimental results showed that the DT model obtained the best F1 scores of 97.27% (for class 1 output with 9 attack types) and 93.80% (for class 2 output with 18 attack types). However, the DT model had low detection rates for several attack types, such as “RDOS” (76.77%), “Shell” (67.62%), and “Modbus_read” (79.94%) of class 2 output.
For the TON_IoT dataset, Alsaedi et al. [29] applied several learner methods such as LR, LDA, kNN, RF, CART, NB, SVM, and LSTM models on the TON_IoT dataset. The experimental results showed that the CART algorithm achieved the highest average F1 score of 81.14%. However, the CART model obtained poor F1 scores for two IoT devices’ data, including Light_Motion with 43% and Thermostat with 57%. Next, Kumar et al. [30] proposed a Trustworthy Privacy-Preserving Secured Framework (TP2SF) with gradient tree boosting systems for an intrusion detection module inside ToN-IoT and BoT-IoT. The TP2SF model obtained a 95.28% F1 score on the ToN-IoT dataset. However, this study did not mentioned the detection rate for each IoT device and each attack type. Then, Booij et al. [31] applied GBM, RF, and NN models on the TON_IoT dataset. The RF model obtained the highest F1 score of 97.264% compared to the GBM and NN models. However, similar to [30], the authors did not detail the performance results for the detection rate of each IoT device as well as each attack type.

2.2. IIoT Datasets and the Imbalanced Multiclass Problem

There are several representative IIoT datasets that can validate IDS in network traffic, including N-BaIoT, UNSW-NB15, BoT-IoT, etc. However, these datasets cannot be used to validate IDS in a different environment, such as an IoT system or host. Hence, they have several drawbacks as shown in Table 1 below.
In this work, we chose two recent IIoT-based IDS datasets on which to perform experiments, the TON_IoT and X-IIoTDS. These datasets have addressed the main limitations of the existing related datasets above. Furthermore, they are suitable for the requirements of the IIoT network. These datasets were collected from IIoT network systems with both normal and attack scenarios. The datasets were collected from the new IIoT connectivity protocols, network traffic, logs, security mechanisms, host resources, and especially recent attack tactics. The obtained data are the labeled network data and host data, which reflect a realistic and complete IIoT network.
First, TON_IoT [29] was collected from a new testbed at the IoT Lab. To mimic the scalability and complexity of the IIoT network, they set up connected physical systems, virtual machines, hacking platforms, cloud and fog platforms, and IIoT sensors. The obtained datasets comprised telemetry of IIoT sensors, operating systems data of Windows 7 and 10, Ubuntu 14 and 18 TL, and network traffic data. The datasets were saved in CSV files. This paper focused on the telemetry IoT device dataset logged in a CSV file. Seven IoT device data were collected, including IoT_Fridge, IoT_Garage_Door, IoT_GPS_Tracker, IoT_Modbus, IoT_Motion_Light, IoT_Thermostat, and IoT_Weather. Table 2 describes the distribution of each class type in each IoT device from the TON_IoT dataset.
As shown in Table 2, “xss” and “scanning” had the smallest ratio distribution of the number of samples compared to the other attack types. For example, in the IoT_Garage_Door dataset file, while the “scanning” attack type had the smallest amount with 2.15% and the “xss” attack type had 4.7%, each other attack type (“ddos”, “password”, “backdoor”, and “injection”) had the largest with 20.33% and the “ransomware” attack type had 11.83%. This was similar to the other IoT device dataset files.
Second, X-IIoTID [28] was created by careful simulation of techniques and procedures, recent tactics of attackers, and the realistic activities of IIoT systems. The simulation included IoT devices such as sensors, controllers, actuators, mobile, edge, and cloud traffic. In addition, it contained the behaviors of the connectivity protocols, such as MQTT, CoAP, and WebSocket. Furthermore, some communication patterns were also included, for example, M2M, Human-to-Machine (H2M), and Machine-to-Human (M2H) with large volume network traffic and events. The dataset contained 68 features, with a subcategory attack (class 2) and a sub-subcategory attack (class 1). Table 3 shows the distribution of the attack type of the X-IIoTID dataset.
As shown in Table 3, the smallest number of samples belonged to the “crypto-ransomware” and “MitM” attacks for the class 1 target. Furthermore, for the class 2 target, while “RDOS” and “Reconnaissance” attacks had the largest amounts of data with 35.39% and 31.97% respectively, the two attack types “Exploitation” and “crypto-ransomware” had the smallest data ratios of 0.28% and 0.038% respectively.
In summary, the imbalance of the data distribution is a challenge for the IIoT IDS datasets, and this is the main reason for the decreased performance accuracy for the attack detection of IDS ML or DL models.

2.3. The Proposed Method

This section provides the high-level architecture of IIoT with the attached ML-based IDS method and the proposed XGBoost IDS method for the IIoT datasets to solve the imbalanced multiclass classification issue.
Firstly, Figure 1 illustrates an IIoT high-level architecture, including three main layers: the IIoT perception layer, the IIoT network and processing layer, and the IIoT application layer [35,36].
In particular, the perception layer contains IoT devices, for example, IoT sensors, cameras, meters, etc. These devices have the main function of gathering sensory data, tracking the environment, and transporting raw materials. The next layer is the network layer, which might have different connectivity networks, such as LoRa, 6LoWPAN, Bluetooth, WiFi/IEEE 802.15.4, and NarrowBand-IoT. These connectivity networks have responsibility for transferring the sensory data from IoT devices in the perception layer to the network and processing layer [36,37]. The network and processing layer contains servers and databases for different types of attacks, for example, Ransomware, Distributed Denial of Service (DDoS), Man-in-the-Middle (MiT), etc. These attacks can block the connection, steal, or delay the transmitted data bytes [38,39,40].
In addition, the application layer ensures the meeting of the application-specific needs of the end user, such as a smart city, smart home, smart grid, smart factory, smart healthcare system, and ad hoc vehicle networks (VANET) [41]. Hence, Figure 1 contains an IDS network architecture ML-based solution in the application layer.
Secondly, Figure 2 shows the proposed XGBoost model for the imbalanced multiclass classification in the IIoT-IDS datasets. There are three main components: preprocessing, XGBoost-based IIoT IDS, and classification evaluation.
  • The data processing. We performed feature normalization, label encoding, and splitting of the training and testing datasets from the original TON_IoT and X-IIoTID. In the feature normalization, we used a min–max scale for input features following the formula:
    X i N = X i N m i n ( X i N ) m a x ( X i N ) m i n ( X i N )
    In the label encoding, we processed the multiclass output values in order to convert non-numerical type data to numerical data for the ML model to learn. We encoded target labels (Y) with a value between 0 and ( n _ c l a s s e s 1 ), where n _ c l a s s e s is the number of different values in Y. We used the LabelEconder function of the Sklearn library in Python language to process this task. The ratio between the training data and testing data determined the number of sampling data separately used for the training and testing processes of the proposed method. In splitting the training and testing data, we divided the data with a ratio of 70:30, respectively.
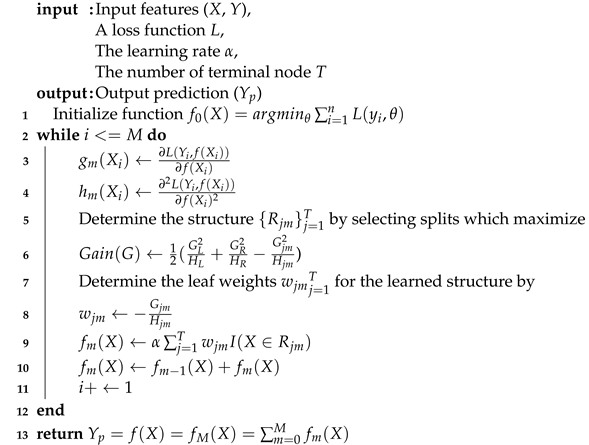
  • XGBoost-based IIoT IDS. XGBoost is one representative of the sequence model XGBoost. We chose the XGBoost model because of its advantages, including learning from its mistakes, fine-tuning extensive hyperparameters, scaling imbalanced data, and processing null values. The sequential ensemble method is known as boosting, which attempts to correct the mistakes of the previous models in their sequences. XGBoost is a kind of boosting algorithm that has been proven to boost weak learners in both classification and regression problems. The trees in XGBoost can create a new tree by considering the previous prediction value for the given input data of the tree and then maximize the gain in prediction. We present the main concept of XGBoost-based IIoT IDS datasets in Algorithm 1.
    In Algorithm 1, the training process is iterative to add a new tree, which can fix prior tree mistakes and residuals. After that, this process combines the previous trees to generate the final prediction. The prediction value is shown in Equation (2).
    Y p T ( X ) = Y p T 1 ( X ) + α f T ( X , w T )
    where Y p T is the prediction output of the Tth, α is the learning rate parameter, and f T is a function that is trained to predict the weight w T of the Tth.
    Based on the most significant gain loss, the model selects a leaf node; meanwhile, the model continuously measures the node loss during the training process. The model adds a tree each time by learning a new function f t ( X , w t ) to fit the residual of the last prediction. After training, the T tree is obtained, which contains the corresponding leaf node with the corresponding score. Finally, by adding the related scores of each tree, the predicted value is calculated. In order to avoid over-fitting issues, XGBoost needs to find the optimal solution to balance the decline of complexity and the object function. Hence, XGBoost takes the Taylor expansion of the loss function up to the second order and adds a regularization term. Therefore, the XGBoost model prediction is shown in Equation (3).
    Y p t = t = 1 T f t ( X t )
    where T is the number of decision trees, f t ( X t ) is the function of the input in the t-th decision tree, and Y p t is the predicted value.
    The training objective function of XGBoost includes two parts, which are the training error and regularization as shown in Equation (4).
    X p t = i = 1 n L ( Y i , Y p i ) + t = 1 T r e ( f t )
    where i = 1 n L ( Y i , Y p i ) is used to measure the difference between the predicted value and the real value of the loss function. t = 1 T r e ( f t ) is the the weak learner’s regularization term, and r e ( f t ) = γ N + 1 2 λ | s | 2 , where N is the number of leaf nodes, s is the score of the leaf nodes, γ is the leaf penalty coefficient, and λ ensures that the score of the leaf node is not too large.
    Taylor expansion on training object: in the above step t-th object function, the previous t 1 prediction function y head can be considered as a variable t-th weak learner, and f t ( X ) is the delta change; so, XGBoost uses a second order Taylor expression to approximate the step t-th object function:
    X p t = i = 1 N L ( Y i , Y p t 1 + g i f t ( X i ) + 1 2 h i f t 2 ( X i ) + i = 1 t r e ( f i )
    where g i is the gradient, which is the first derivative, and h i is the hessian, which is the second derivative.
    g i = Y p t 1 L ( Y i , Y p t 1 )
    h i = 2 Y p t 1 L ( Y i , Y p t 1 )
    In the equation above, at the current t-th step, the t 1 step prediction y head and all before t regularization are known values; so, they are constant values in the t-th step object function. We remove the constant terms (because they do not impact the object function optimization), and we obtain:
    X p t = i = 1 n g i f t ( X i ) + 1 2 h i f t 2 ( X i ) + r e ( f t )
    The tree mapping function definition is as follows:
    I j = { i | q ( X i ) = j }
    where j represents a tree’s j-th leaf; I j represents a set containing all data instances, which are located in the tree’s j-th leaf; and q ( x i ) represents a function that maps the data instance x i into a tree leaf and returns the leaf index:
    f t ( X ) = w q ( X )
    where w i represents the i-th leaf score (weight or output). So, f ( X ) actually represents a tree output, for instance, X.
    Next, we rewrite the object function with regularization:
    X ( t ) = i = 1 n g i f t ( X i ) + 1 2 h i f t 2 ( X i ) + γ T + 1 2 λ j = 1 T w j 2
    = j = 1 T ( i I j g i ) w j + 1 2 ( i I j h i + λ ) w j 2 + γ T
    where T is the number of leaves in the t-th weak learner tree f t ( X ) ; and γ and λ are regularization hyperparameters.
    The optimized object function is as follows: Now, the t-th step object function is a function of w i , g i , and h i , whose values are known, because they related to the loss function and step t 1 prediction values. So, we can use the following equation to obtain the best w i to minimize the object function:
    w i X t = 0
    The optimal w is:
    w j = i I j g i i I j h i + λ
    Furthermore, the corresponding minimal object value is:
    X t = 1 2 j = 1 T ( i I j g i ) 2 i I j h i + λ + γ T
    The slitting criteria for the weak learner is as follows: Firstly, we obtain the t-th step object function. Next, we build the t-th tree. This tree should be constructed to reduce the object function value as much as possible. To build this tree, we only allow a node split and search for the best split, which causes the greatest reduction. Hence, in each split, we measure the objective function value reduced by the tree object function value (After Node Split)-(Before Node Split).
    G = 1 2 ( i I L g i ) 2 i I L h i + λ + ( i I R g i ) 2 i I R h i + λ ( i I g i ) 2 i I h i + λ γ
    Gain (G) is how many object’s function values are reduced in the split. I L is a left splitting child leaf; I R is a right splitting leaf; and I is the parent leaf.
    For simplicity, each leaf can calculate its Similarity Score ( S S ):
    S S = ( i I g i ) 2 i I h i + λ
    The splitting gain can be expressed as:
    L e f t ( S S ) + R i g h t ( S S ) P a r e n t ( S S )
    Based on the chosen loss function, g i and h i are 1-order and 2-order derivatives to calculate tree node similarity and tree leaf output w i . For classification, the loss function is a custom log loss function (as shown in Equation (19).
    L = Y i l o g ( p i ) + ( 1 Y i ) l o g ( 1 p i )
    where p i = s i g m o i d ( Y i ) is the output class probability, calculated via log transformation on the tree output prediction Y i .
  • Classification evaluation metrics. Cortés-Leal et al. [42] used a performance metric to mitigate IIoT attacks through measuring the impact of the energy consumption during transmission in IoT and WSN environments. However, we considered other performance metrics, since they suited the ML approach in this work. In particular, we used a confusion matrix (CM) and learning curves to evaluate the performance of our proposed model. A CM contains true positive (TP), true negative (TN), false positive (FP), and false negative (FN). Based on these values of CM, we calculated other performance evaluation metrics, including precision (P), recall (R), and the F1 score.
    The precision (P) is used to measure the accuracy of the model for classifying a sample as positive.
    P = T P T P + F P
    The recall (R) is used to measure the ability of the model to detect positive samples.
    R = T P T P + F N
    The F1 score is the harmonic mean of P and R, which is calculated following Equation (22).
    F 1 = 2 × P × R P + R
    The learning curve performance represents the efficiency of the model during training time with instances. The cross-validation score will represent the evaluation performance of the learning curve.
Algorithm 1: XGBoost-based IDS model.
Sustainability 14 08707 i001

3. Results and Discussion

This section provides the performance evaluation results of the proposed method. In particular, Section 3.1 shows how the proposed method can solve the imbalanced multiclass classification problem. Section 3.2 presents the performance learning curves. Furthermore, we compare the performance classification of the proposed method with other related methods in Section 3.3.

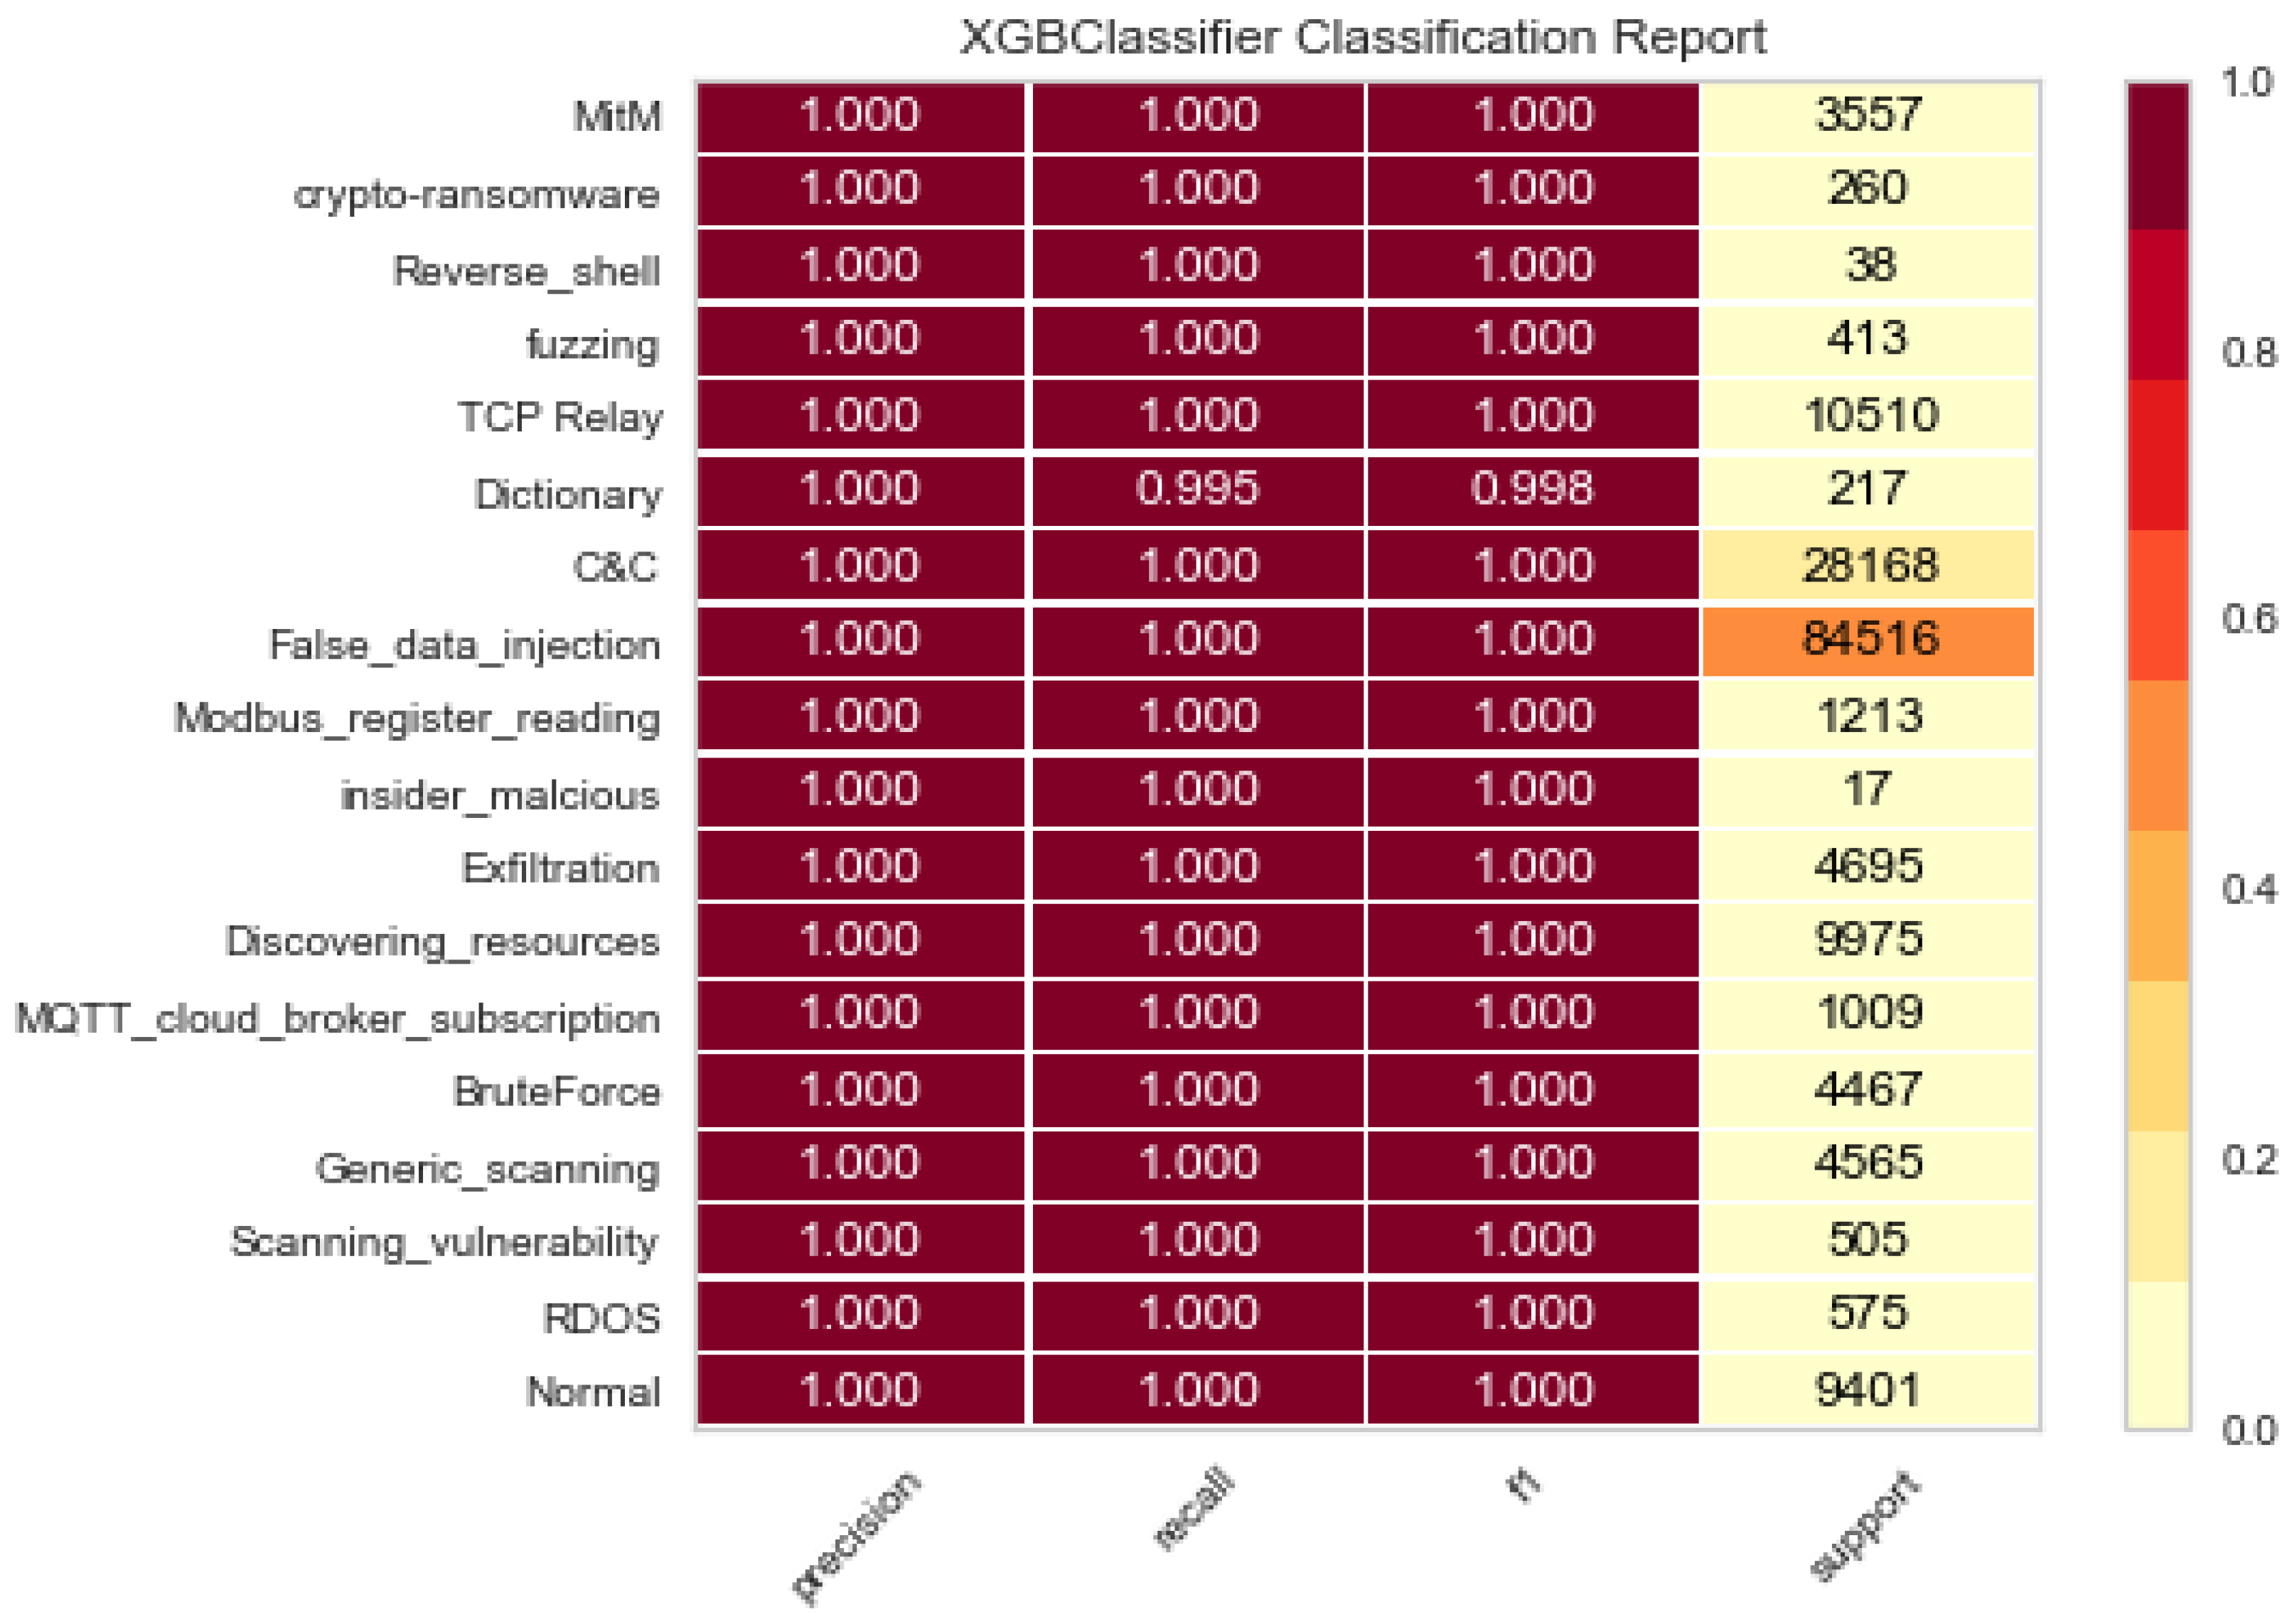
3.1. Imbalanced Multiclass Classification

We computed and visualized the multiclass classification of the proposed method using a CM and a classification report. For the X-IIoTID dataset, we visualized the performance results with precision, recall, and F1 measurements by classification reports for class 1 and class 2 as shown in Figure 3 and Figure 4, respectively.
The X-IIoTID dataset included two output class labels: class 1 and class 2. Although class 1 and class 2 contained output class labels, which were not balanced samples, the proposed method still obtained the best accuracy on the three types of measurement metrics. The proposed method obtained almost 100% on the precision, recall, and F1 metrics with 18 multiclass outputs of class 1 (see Figure 3) and 10 multiclass outputs of class 2 (see Figure 4).
For the TON_IoT dataset, we visualized the performance of the multiclass classification by CM as shown in Figure 5. Although the two attack types of “xss” and “scanning” had the smallest amount of IoT device data compared with the other attack types, the proposed model still detected approximately 100% accurately. Furthermore, the proposed method also obtained the best precision and recall as well as the F1 score on the balanced attack data distribution, including [“crypto-ransomware”, “Exploitation”, “C&C”, “Tampering”, “Exfilltration”, “Lateral_movement”, “Weaponization”, “reconnaissance”, and “RDOS attacks”].
In summary, we present the average performance classification of the proposed method on the two datasets in Table 4. Three evaluation metrics were used to evaluate the proposed approach: precision, recall, and F1 score. For the X-IIoTID dataset, the average F1 score of the two output classes was 99.9%. For the TON_IoT dataset, the average F1 score of all IoT device data was 99.87%. Therefore, the proposed method can handle the multiclass data’s imbalanced distribution issue.

3.2. Performance Learning Curve

To further examine the robust training performance of the proposed method, we provide the learning curve measurement results. In the learning curve plot, the cross-validation score illustrated the training performance of the model. Figure 6 and Figure 7 illustrate the learning curve results for each output class over each dataset: X-IIoTID and TON_IoT, respectively. In particular, the cross-validation score of the model on the X-IIoTID dataset achieved 99.99% (for class 1 output as shown in Figure 6a) and 99.995% (for class 2 output as shown in Figure 6b).
Next, we provide the plotting results for the learning curve of the proposed method on the TON_IoT dataset. Most cross-validation scores for the IoT device data were approximately 100%, and the cross-validation scores for IoT Garage Door data were 97% (see Figure 7b).

3.3. Performance Comparison

We confirmed the performance of the proposed method by comparing it with other related models used on similar public datasets. Firstly, we compared the performance of the multiclass classification via the F1 score of the proposed method with other related methods. We chose the X-IIoTID dataset with class 2 output to present the comparison results in Table 5. Indeed, the best F1 score emphasized in bold value belonged to the proposed method. While the F1 score of the Reconnaissance attack was 99.8%, the F1 scores for the other attacks achieved 100%. Hence, the attack detection performance of the proposed method was enhanced compared with the existing methods.
Secondly, we compared the F1 score of the proposed method with other methods [29] on the TON_IoT dataset. Alsaedi et al. [29] used three methods, including the LSTM, kNN, and CART algorithm as shown in Table 6. Although the LSTM method achieved the best F1 score on the IoT device datasets, IoT_Fridge and IoT_Garage_Door, our proposed method obtained a high F1 score on both IoT device datasets and a higher F1 score on the other IoT device datasets. In particular, our method improved by 12% and 44.84% the F1 scores compared with the LSTM model’s results on IoT_GPS_Tracker and IoT_Motion_Light, respectively. In addition, the proposed method enhanced by 1% and 12.75% the F1 scores compared with the CART algorithm’s result on the IoT_Modbus and IoT_Weather datasets, respectively. For IoT_Thermostat data, our proposed model increased by 42.6% compared with the kNN and CART methods.
Thirdly, we compared the average F1 score of the proposed method with the F1 score of other previous approaches on the TON_IoT and X-IIoTID datasets. For the TON_IoT dataset, the best F1 of the RF method achieved 97.264%, while our proposed method obtained 99.87%, an increase of 4.59%. In addition, the proposed method improved the F1 score by 2.49% compared with the best previous method, DPM–DDM, on the X-IIoTID dataset. The detailed comparison is shown in Table 7.

4. Conclusions

This paper proposed an IIoT IDS approach based on the XGBoost model. This model can solve the challenging issue of related IIoT datasets, which is the imbalance in the multiclass data distribution. The TON_IoT and X-IIoTID datasets were used for experiments to evaluate the proposed method. These datasets are benchmarks with advantages over other related IIoT datasets and contain imbalanced attack type distributions. A comprehensive set of experiments proved that the proposed method obtained the best performance in terms of F1 score. In particular, the proposed model obtained the best F1 scores of 99.87% and 99.9% in the TON_IoT and X-IIoTID datasets, respectively. In comparison with the baseline models’ results, the proposed method outperformed other previous approaches on the same two IIoT datasets: TON_IoT and X-IIoTID. Therefore, we demonstrated that the proposed method could better solve the challenge of the imbalance in attack data distribution in IIoT IDS datasets compared to previous learning methods. We shall test and apply the proposed model for a specific related IIoT application in future work. In other words, the proposed method can be tuned and used in a particular context of a security application in the future.

Author Contributions

Conceptualization, T.-T.-H.L.; methodology, T.-T.-H.L.; software, T.-T.-H.L.; validation, H.K.; formal analysis, T.-T.-H.L. and Y.E.O.; investigation, H.K.; resources, T.-T.-H.L. and Y.E.O.; data curation, T.-T.-H.L. and Y.E.O.; writing—original draft preparation, T.-T.-H.L. and Y.E.O.; writing—review and editing, H.K.; visualization, T.-T.-H.L. and Y.E.O.; supervision, H.K.; project administration, H.K.; funding acquisition, H.K. All authors have read and agreed to the published version of the manuscript.

Funding

This work was supported by Institute of Information & communications Technology Planning & Evaluation (IITP) grant funded by the Korea government(MSIT) (No.2022-0-00407, Digital twin-based business application R&D and demonstration), and in part by Smart City R&D project of the Korea Agency for Infrastructure Technology Advancement(KAIA) grant funded by the Ministry of Land, Infrastructure and Transport(MOLIT), Ministry of Science and ICT(MSIT) (Grant 18NSPS-B149388-01).

Institutional Review Board Statement

Not applicable.

Informed Consent Statement

Not applicable.

Conflicts of Interest

The authors declare no conflict of interest.

Abbreviations

The following abbreviations are used in this manuscript:
IoTInternet of Things
IIoTIndustrial Internet of Things
IDSIntrusion Detection System
MLMachine Learning
NIDSNetwork Intrusion Detection System
XGBoosteXtremely Gradient Boosting
M2MMachine-to-Machine
M2PMachine-to-People
H2MHuman-to-Machine
M2HMachine-to-Human
MitMMan-in-the-Middle
DLDeep Learning
RNNRecurrent Neural Network
LSTMLong Short-Term Memory
GRUGated Recurrent Unit
U2RUser to Root
LRLogistics Regression
LDALinear Discriminant Analysis
SVMSupport Vector Machine
NBNaïve Bayes
kNNk-Nearest Neighbors
GBMGradient Boosting Machines
RFRandom Forest
NNNeural Network
AP2PFL-MLPAsynchronous Peer-to-Peer Federated Learning-Multilayer Perceptron
TP2SFTrustworthy Privacy-Preserving Secured Framework
WSNWireless Sensor Network
DRDetection Rate
FARFalse Alarm Rate
DDoSDistributed Denial of Service
CMConfusion Matrix
TPtrue positive
TNtrue negative
FPfalse positive
FNfalse negative

References

  1. Latif, S.; Idrees, Z.; Zou, Z.; Ahmad, J. DRaNN: A deep random neural network model for intrusion detection in industrial IoT. In Proceedings of the 2020 International Conference on UK-China Emerging Technologies (UCET), Glasgow, UK, 20–21 August 2020; pp. 1–4. [Google Scholar]
  2. CNwakanma, I.; Nwadiugwu, W.; Lee, J.M.; Kim, D.S. Real-Time validation scheme using blockchain technology for Industrial IoT. In Proceedings of the 2019 Korean Institute of Communications and Information Sciences Summer Conference, Jeju, Korea, 19–21 June 2019; pp. 379–382. [Google Scholar]
  3. Boyes, H.; Hallaq, B.; Cunningham, J.; Watson, T. The Industrial Internet of Things (IIoT): An analysis framework. Comput. Ind. 2018, 101, 1–12. [Google Scholar] [CrossRef]
  4. Hafeez, I.; Antikainen, M.; Ding, A.Y.; Tarkoma, S. IoT-KEEPER: Detecting malicious IoT network activity using online traffic analysis at the edge. IEEE Trans. Netw. Serv. Manag. 2020, 17, 45–59. [Google Scholar] [CrossRef] [Green Version]
  5. Muna, A.H.; Moustafa, N.; Sitnikova, E. Identification of malicious activities in Industrial Internet of Things based on deep learning models. J. Inf. Secur. Appl. 2018, 41, 1–11. [Google Scholar]
  6. Defense Use Case. Analysis of the Cyber Attack on the Ukrainian Power Grid. Electricity Information Sharing and Analysis Center (E-ISAC) 388, 2015. Available online: https://africautc.org/wp-content/uploads/2018/05/E-ISAC_SANS_Ukraine_DUC_5.pdf (accessed on 7 May 2022).
  7. Alladi, T.; Chamola, V.; Zeadally, S. Industrial control systems: Cyberattack trends and countermeasures. Comput. Commun. 2020, 155, 1–8. [Google Scholar] [CrossRef]
  8. Sitnikova, E.; Foo, E.; Vaughn, R.B. The power of handson exercises in SCADA cybersecurity education. In Information Assurance and Security Education and Training; Springer: Berlin/Heidelberg, Germany, 2013; pp. 83–94. [Google Scholar]
  9. Dash, S.; Chakraborty, C.; Giri, S.K.; Pani, S.K.; Frnda, J. BIFM: Big-data driven intelligent forecasting model for COVID-19. IEEE Access 2021, 9, 97505–97517. [Google Scholar] [CrossRef]
  10. Koroniotis, N.; Moustafa, N.; Sitnikova, E. A new network forensic framework based on deep learning for Internet of Things networks: A particle deep framework. Future Gener. Comput. Syst. 2020, 110, 91–106. [Google Scholar] [CrossRef]
  11. Vaiyapuri, T.; Binbusayyis, A. Application of deep autoencoder as an one-class classifier for unsupervised network intrusion detection: A comparative evaluation. PeerJ Comput. Sci. 2020, 6, e327. [Google Scholar] [CrossRef]
  12. Le, T.T.H.; Kim, J.; Kim, H. Analyzing effective of activation functions on recurrent neural networks for intrusion detection. J. Multimed. Inf. Syst. 2016, 3, 91–96. [Google Scholar] [CrossRef]
  13. Le, T.T.H.; Kim, J.; Kim, J.; Thu, H.L.T.; Kim, H. Long Short Term Memory Recurrent Neural Network Classifier for Intrusion Detection. In Proceedings of the 2016 International Conference on Platform Technology and Service (PlatCon), Jeju, Korea, 15–17 February 2016; pp. 1–5. [Google Scholar]
  14. Le, T.T.H.; Kim, J.; Kim, H. An Effective Intrusion Detection Classifier Using Long Short-Term Memory with Gradient Descent Optimization. In Proceedings of the 2017 International Conference on Platform Technology and Service (PlatCon), Busan, Korea, 13–15 February 2017; pp. 1–6. [Google Scholar]
  15. Le, T.T.H.; Kang, H.; Kim, H. The Impact of PCA-Scale Improving GRU Performance for Intrusion Detection. In Proceedings of the 2019 International Conference on Platform Technology and Service (PlatCon), Jeju, Korea, 28–30 January 2019; pp. 1–6. [Google Scholar]
  16. Le, T.-T.-H.; Kim, Y.; Kim, H. Network Intrusion Detection Based on Novel Feature Selection Model and Various Recurrent Neural Networks. Appl. Sci. 2019, 9, 1392. [Google Scholar] [CrossRef] [Green Version]
  17. Garcia-Teodoro, P.; Diaz-Verdejo, J.; Maciá-Fernández, G.; Vázquez, E. Anomaly-based network intrusion detection: Techniques, systems and challenges. Comput. Secur. 2009, 28, 18–28. [Google Scholar] [CrossRef]
  18. Al-Khateeb, H.; Epiphaniou, G.; Reviczky, A.; Karadimas, P.; Heidari, H. Proactive Threat Detection for Connected Cars Using Recursive Bayesian Estimation. IEEE Sens. J. 2018, 18, 4822–4831. [Google Scholar] [CrossRef] [Green Version]
  19. Le, T.-T.-H.; Park, T.; Cho, D.; Kim, H. An Effective Classification for DoS Attacks in Wireless Sensor Networks. In Proceedings of the 2018 Tenth International Conference on Ubiquitous and Future Networks (ICUFN), Prague, Czech Republic, 3–6 July 2018; pp. 689–692. [Google Scholar]
  20. Sornsuwit, P.; Jaiyen, S. A New Hybrid Machine Learning for Cybersecurity Threat Detection Based on Adaptive Boosting. Appl. Artif. Intell. 2019, 33, 462–482. [Google Scholar] [CrossRef]
  21. Wu, H.; Han, H.; Wang, X.; Sun, S. Research on Artificial Intelligence Enhancing Internet of Things Security: A Survey. IEEE Access 2020, 8, 153826–153848. [Google Scholar] [CrossRef]
  22. Khraisat, A.; Gondal, I.; Vamplew, P.; Kamruzzaman, J.; Alazab, A. A Novel Ensemble of Hybrid Intrusion Detection System for Detecting Internet of Things Attacks. Electronics 2019, 8, 1210. [Google Scholar] [CrossRef] [Green Version]
  23. Ullah, I.; Mahmoud, Q.H. A Two-Level Flow-Based Anomalous Activity Detection System for IoT Networks. Electronics 2020, 9, 530. [Google Scholar] [CrossRef] [Green Version]
  24. Le, T.-T.-H.; Kim, H.; Kang, H.; Kim, H. Classification and Explanation for Intrusion Detection System Based on Ensemble Trees and SHAP Method. Sensors 2022, 22, 1154. [Google Scholar] [CrossRef] [PubMed]
  25. Alsamiri, J.; Alsubhi, K. Internet of Things Cyber Attacks Detection using Machine Learning. Int. J. Adv. Comput. Sci. Appl. 2019, 10, 627–634. [Google Scholar] [CrossRef] [Green Version]
  26. Pacheco, J.; Benitez, V.H.; Felix-Herran, L.C.; Satam, P. Artificial Neural Networks-Based Intrusion Detection System for Internet of Things Fog Nodes. IEEE Access 2020, 8, 73907–73918. [Google Scholar] [CrossRef]
  27. Al-Hawawreh, M.; Sitnikova, E.; Aboutorab, N. Asynchronous Peer-to-Peer Federated Capability-Based Targeted Ransomware Detection Model for Industrial IoT. IEEE Access 2021, 9, 148738–148755. [Google Scholar] [CrossRef]
  28. Al-Hawawreh, M.; Sitnikova, E.; Aboutorab, N. X-IIoTID: A Connectivity-Agnostic and Device-Agnostic Intrusion Data Set for Industrial Internet of Things. IEEE Internet Things J. 2022, 9, 3962–3977. [Google Scholar] [CrossRef]
  29. Alsaedi, A.; Moustafa, N.; Tari, Z.; Mahmood, A.; Anwar, A. TON_IoT Telemetry Dataset: A New Generation Dataset of IoT and IIoT for Data-Driven Intrusion Detection Systems. IEEE Access 2020, 8, 165130–165150. [Google Scholar] [CrossRef]
  30. Kumar, P.; Gupta, G.P.; Tripathi, R. TP2SF: A Trustworthy Privacy-Preserving Secured Framework for sustainable smart cities by leveraging blockchain and machine learning. J. Syst. Archit. 2021, 115, 101954. [Google Scholar] [CrossRef]
  31. Booij, T.M.; Chiscop, I.; Meeuwissen, E.; Moustafa, N.; Hartog, F.T.H.d. ToN_IoT: The Role of Heterogeneity and the Need for Standardization of Features and Attack Types in IoT Network Intrusion Data Sets. IEEE Internet Things J. 2022, 9, 485–496. [Google Scholar] [CrossRef]
  32. Meidan, Y.; Bohadana, M.; Mathov, Y.; Mirsky, Y.; Shabtai, A.; Breitenbacher, D.; Elovici, Y. N-baiot-network-based detection of iot botnet attacks using deep autoencoders. IEEE Pervasive Comput. 2018, 17, 12–22. [Google Scholar] [CrossRef] [Green Version]
  33. Moustafa, N.; Slay, J. Unsw-nb15: A comprehensive data set for network intrusion detection systems (unsw-nb15 network data set). In Proceedings of the 2015 military Communications and Information Systems Conference (MilCIS), Canberra, ACT, Australia, 10–12 November 2015; pp. 1–6. [Google Scholar]
  34. Koroniotis, N.; Moustafa, N.; Sitnikova, E.; Turnbull, B. Towards the development of realistic botnet dataset in the internet of things for network forensic analytics: Bot-iot dataset. Future Gener. Comput. Syst. 2019, 100, 779–796. [Google Scholar] [CrossRef] [Green Version]
  35. Zhou, J.; Cao, Z.; Dong, X.; Vasilakos, A.V. Security and privacy for cloud-based IoT: Challenges. IEEE Commun. Mag. 2017, 55, 26–33. [Google Scholar] [CrossRef]
  36. Wan, J.; Tang, S.; Shu, Z.; Li, D.; Wang, S.; Imran, M.; Vasilakos, A.V. Software-defined Industrial Internet of Things in the context of industry 4.0. IEEE Sens. J. 2016, 16, 7373–7380. [Google Scholar] [CrossRef]
  37. Sengupta, J.; Ruj, S.; Bit, S.D. A comprehensive survey on attacks, security issues and blockchain solutions for IoT and IIoT. J. Netw. Comput. Appl. 2020, 149, 102481. [Google Scholar] [CrossRef]
  38. Choi, C.; Choi, J. Ontology-based security context reasoning for power IoT-cloud security service. IEEE Access 2019, 7, 110510–110517. [Google Scholar] [CrossRef]
  39. Unwala, I.; Taqvi, Z.; Lu, J. IoT security: ZWave and thread. In Proceedings of the 2018 IEEE Green Technologies Conference (GreenTech), Austin, TX, USA, 4–6 April 2018; pp. 176–182. [Google Scholar]
  40. Siboni, S.; Sachidananda, V.; Meidan, Y.; Bohadana, M.; Mathov, Y.; Bhairav, S.; Elovici, Y. Security testbed for Internet-of-Things devices. IEEE Trans. Reliab. 2019, 68, 23–44. [Google Scholar] [CrossRef]
  41. Nguyen, T.G.; Phan, T.V.; Nguyen, B.T.; So-In, C.; Baig, Z.A.; Sanguanpong, S. Search: A collaborative and intelligent nids architecture for sdn-based cloud iot networks. IEEE Access 2019, 7, 107678–107694. [Google Scholar] [CrossRef]
  42. Cortés-Leal, A.; Del-Valle-Soto, C.; Cardenas, C.; Valdivia, L.J.; Del Puerto-Flores, J.A. Performance Metric Analysis for a Jamming Detection Mechanism under Collaborative and Cooperative Schemes in Industrial Wireless Sensor Networks. Sensors 2022, 22, 178. [Google Scholar] [CrossRef] [PubMed]
Figure 1. ML-based IDS method inside the high level IIoT network architecture context.
Sustainability 14 08707 g001
Figure 2. The proposed XGBoost for imbalanced multiclass classification.
Sustainability 14 08707 g002
Figure 3. Classification report result for class 1 of the X-IIoTID dataset.
Sustainability 14 08707 g003
Figure 4. Classification report result for class 2 of the X-IIoTID dataset.
Sustainability 14 08707 g004
Figure 5. Confusion matrix results of the proposed method on the TON_IoT dataset. (a) IoT Fridge; (b) IoT Garage Door; (c) IoT GPS Tracker; (d) IoT Modbus; (e) IoT Motion Light; (f) IoT Thermostat; and (g) IoT Weather.
Sustainability 14 08707 g005
Figure 6. Learning curve results of the proposed method on the X-IIoTID dataset: (a) class 1 output; (b) class 2 output.
Sustainability 14 08707 g006
Figure 7. Learning curve results of the proposed method on the TON_IoT dataset. (a) IoT Fridge; (b) IoT Garage Door; (c) IoT GPS Tracker; (d) IoT Modbus; (e) IoT Motion Light; (f) IoT Thermostat; and (g) IoT Weather.
Sustainability 14 08707 g007
Table 1. Other existing related IoT-based IDS datasets.
DatasetFeaturesLimitation
N-BaIoT [32]An IoT environment simulation was set up to collect normal status and botnet attacks. This simulation included some IoT devices such as access points, wifi, wired connection, and a router. A small-scale network-based Wireshark for network traffic collecting aimed to reduce many packets in the high-bandwidth network.There were no telemetry data from IoT sensors and data traces of operating systems.
UNSW-NB15 [33]The dataset was created in a network traffic simulation using an IXIA traffic generator and was saved in four CSV files. This dataset contained a normal vector and nine attack vectors. Each vector had 47 features and the class target feature.The dataset did not contain security events against operating systems and IoT networks.
Bot-IoT [34]Large-scale raw packets from different virtual machines were collected. This dataset contained malware events and various botnet attacks with various data features.The dataset did not contain hacking vectors against traces of operating systems and IoT systems.
Table 2. Type class output distribution of the TON_IoT dataset.
DeviceTarget ValueNumber of Samples
IoT_Fridgenormal35,000
ddos5000
injection5000
backdoor5000
password5000
ransomware2902
xss2042
IoT_Garage_Doornormal35,000
ddos5000
password5000
backdoor5000
injection5000
ransomware2902
xss1156
scanning529
IoT_GPS_Trackernormal35,000
password5000
backdoor5000
injection5000
ddos5000
ransomware2833
xss577
scanning550
IoT_Modbusnormal35,000
injection5000
backdoor5000
password5000
xss577
scanning529
IoT_Motion_Lightnormal35,000
ddos5000
password5000
injection5000
backdoor5000
ransomware2264
scanning1775
xss449
IoT_Thermostatnormal35,000
password5000
injection5000
backdoor5000
ransomware2264
xss449
scanning61
IoT_Weathernormal35,000
password5000
backdoor5000
ddos5000
injection5000
ransomware2865
xss866
scanning529
Table 3. Class output distribution of the X-IIoTDS dataset.
OutputTarget ValueNumber of Samples
Class 1Normal421,417
RDOS141,261
Scanning_vulnerability52,852
Generic_scanning50,277
BruteForce47,241
MQTT_cloud_broker_subscription23,524
Discovering_resources23,148
Exfiltration22,134
insider_malcious17,447
Modbus_register_reading5953
False_data_injection5094
C&C2863
Dictionary2572
TCP Relay2119
fuzzing1313
Reverse_shell1016
crypto-ransomware154
MitM117
Class 2Normal421,417
RDOS141,261
Reconnaissance127,590
Weaponization67,260
Lateral_movement31,596
Exfiltration22,134
Tampering5094
C&C2863
Exploitation1133
crypto-ransomware154
Table 4. Average performance of the proposed method for classification.
DatasetOutput class/DevicePrecisionRecallF1
X-IIoTIDClass 11.00.99750.999
Class 21.00.9980.999
TON_IoTIoT_Fridge0.99950.9990.9993
IoT_Garage_Door0.99951.00.9995
IoT_GPS_Tracker1.01.01.0
IoT_Modbus1.01.01.0
IoT_Motion_Light0.9990.99530.9984
IoT_Thermostat0.9950.99570.996
IoT_Weather0.9951.00.9975
Table 5. Comparison of multiclass classification by the F1 score of the proposed method with other methods on the X-IIoTID dataset.
Attack TypeDPM–DDM [27]DT [28]Proposed Method (XGBoost)
crypto-ransomware10099.86100
Exploitation64.6698.52100
C&C99.2789.66100
Tampering99.7299.47100
Exfiltration99.9889.76100
Lateral_movement91.4898.52100
Weaponization99.7699.97100
Reconnaissance9399.2299.8
RDOS99.9499.99100
Normal--100
Table 6. Comparison of the F1 scores on the TON_IoT dataset.
IoT Device DataLSTM [29]kNN [29]CART [29]Proposed Method (XGBoost)
IoT_Fridge100999799.93
IoT_Garage_Door10010010099.95
IoT_GPS_Tracker888885100
IoT_Modbus557799100
IoT_Motion_Light55434399.84
IoT_Thermostat54575799.6
IoT_Weather80818799.75
Table 7. Comparison average F1 score of the proposed method with other methods on two datasets.
DatasetMethodF1
TON_IoTLSTM [29]76
kNN [29]77.86
CART [29]81.14
GBM [31]92.557
RF [31]97.264
NN [31]92.120
TP2SF [30]95.28
Proposed method99.87
X-IIoTIDAP2PFL-MLP [27]92.061
AP2PFL-DNN [27]96.42
DPM-DDM [27]97.41
DT [28]97.27
Proposed method99.9
Publisher’s Note: MDPI stays neutral with regard to jurisdictional claims in published maps and institutional affiliations.

