Article

Modeling and Analysis of Electric Vehicle User Behavior Based on Full Data Chain Driven

School of Electrical Engineering, Southeast University, Nanjing 210096, China
*
Author to whom correspondence should be addressed.
Sustainability 2022, 14(14), 8600; https://doi.org/10.3390/su14148600
Submission received: 26 May 2022 / Revised: 3 July 2022 / Accepted: 12 July 2022 / Published: 14 July 2022

Abstract

:
The rapid development of electric vehicles (EVs) has posed challenges to power grids and transportation networks. Accurately capturing the usage patterns of EV users is a prerequisite for EVs’ interaction with electrified transportation networks. Thus, this paper proposes a full data chain (FDC) driven model to mine EVs’ comprehensive characteristics. By collecting the data of 150 private electric vehicles (PREVs), 100 commercial electric vehicles (CEVs), and 50 official electric vehicles (OEVs) in Chongqing, China, the driving characteristics are firstly mined by the adoption of origin-destination (OD) distribution and driving portrait. Moreover, the charging characteristics are extracted based on the state recognition for data chains. Then, vehicle usage characteristics of different types of users are comprehensively described based on the density-based spatial clustering of applications with noise (DBSCAN). Finally, the results of EV user characteristics are analyzed, and the effectiveness of the proposed model is verified by regional charging load analysis and urban road traffic flow comparison. The findings provide a data source and user behavior model for the planning, operation, and control of power grids and transportation networks.

1. Introduction

1.1. Motivation

With the increasingly severe problems of fossil energy consumption and environmental pollution, the transportation industry is concerned by governments worldwide. As an environment-friendly means of transportation, EVs usher in development opportunities [1,2]. By 2020, the number of new energy vehicles in China has reached 4.92 million, accounting for 1.75% of vehicles. Compared with 2019, the number increased by 1.11 million, with a growth rate of 29.18%. Significantly, the number of battery electric vehicles (BEVs) was 4 million, accounting for 81.32% of new energy vehicles [3]. Furthermore, according to the International Energy Agency, the global EV stock will reach 145 million by 2030, and the penetration rate of EVs will reach 7% [4]. If governments speed up their efforts to protect the environment, the rate is expected to exceed 12%, indicating EVs’ prosperity prospect in the global market.
The environmental pollution and energy crisis can be alleviated by the vigorous development of EVs, but it is worth noting that the continuous increase in EV numbers may bring challenges to the power grid operation and charging infrastructure construction [5,6]. On the one hand, due to the strong randomness of driving and charging behaviors of EV users, large-scale EVs may lead to an imbalance of power grids and an increase in peak valley difference [7,8,9]. On the other hand, the construction of EV charging facilities lags far behind the rapid growth of EVs, and EV owners tend to charge more frequently due to range anxiety [10,11]. The charging time of EVs is much longer than that of fuel vehicles (FVs), which will inevitably lead to charging difficulties for EV owners and even cause the congestion drift phenomenon. Therefore, exploring EVs’ driving and charging characteristics is essential for evaluating the impact of different penetration levels of EVs on the current grids. It plays a vital role in rationally planning charging facilities and guiding the healthy development of the EV industry [12].

1.2. Literature Survey

At present, the behavior characteristics of EV users are studied and analyzed from several perspectives. Based on the data sets provided by the U.S. National Household Travel Survey (NHTS), reference [13] adopts FVs’ travel data for behavior analysis to establish an EV charging load prediction model. Traffic flow data is used to capture the characteristics of EVs in [14,15,16]. In [14], the vehicle dynamic-location-property model and the travel time probability distribution are established, and the dynamic characteristics of EVs are analyzed. Reference [15] examines the travel distance, departure time, and other factors based on the open-source traffic data from the OpenStreetMap. On this basis, study [16] introduces weather data as a supplement to road traffic data and predicts the EV charging demand in both winter and summer. In addition, since most CEVs are equipped with travel locators, it is easy to obtain driving data of CEVs. The electrification substitution and behavior model based on FVs are established in research [17]. It explores the impacts of fast and slow charging planning on EV travel behaviors.
In brief, the above-mentioned studies are applied to grasp the EV characteristics from the perspective of traffic data or FVs travel data in the early stage. However, these works are part of indirect analysis methods, which use FVs to emulate EVs for data mining and behavior modeling. There is a lack of actual EV data to evaluate the behavior characteristics of EVs.
Fortunately, some scholars excavate actual EV data due to the popularization of vehicle trackers and the increasing improvement of vehicle-grid interconnection technology. Research [18] collects driving and charging data of PREVs in Beijing and analyzes 16 characteristic parameters in detail. On this basis, Chaudhari et al. [9] consider the initial state of charge (SOC), charging station location, and other parameters, and they propose an EV charging load forecasting model via the agent-based modeling method. Unlike PREVs, however, CEVs have more flexible travel routes, and most CEVs are operated in two shifts, which makes the analysis of CEVs more complicated. Aiming at CEVs, references [19,20] study CEVs in Beijing and Shenzhen, respectively. Based on the real-world data in Beijing, research [19] finds that the daily mileage of CEVs is about 117.98 km, which is far lower than that of FVs (249.3 km). Moreover, the battery capacity is significantly affected by the temperature, and the driving distance in winter is less than that in the other three seasons. Combining historical and real-time EV data, the driving and charging states of CEVs are identified in reference [20]. Based on the long-term tracking data from the research project “Hamburg-Wirtschaft am Strom,” research [21] studies the EV charging behavior characteristics in commercial transport. In addition, a hybrid logit model is leveraged in [22] to explore the influence of factors such as remaining power and detour distance on the EV drivers’ selections of charging stations. Similarly, Ashkrof et al. [23] analyze the influence of charging preferences on the route choice of EV drivers using the Dutch travel data. The impacts of fast charging on the range anxiety are discussed in reference [24]. It is found that the charging rate is negatively correlated with range anxiety, especially in cold weather. In addition, EV users’ choice of charging power is also affected by range anxiety.
In summary, although the above studies apply actual data to the EV characteristic mining and analysis, there are still two significant limitations:
  • The single characteristic of EVs has been carefully explored in the above-mentioned studies. However, it is challenging to establish a comprehensive EV user behavior profile without fully considering EVs’ dynamic traveling and random charging behaviors.
  • The established models and mining results of the above studies show poor applicability due to the high redundancy and heterogeneity of the raw data. Moreover, it lacks an EV modeling method that can support cross-platform and cross-region comparative analysis.

1.3. Contributions

To address the issues mentioned above, an FDC-based data-driven approach is established to dissect the driving, charging, and vehicle usage characteristics of EV users. The interaction between power grids and transportation networks is taken as the entry point, and the validity of the proposed model is verified through the regional charging load and traffic flow. Overall, our goal is to grasp the essence of different EV users’ behaviors and promote the friendly integration among EVs, power grids, and traffic networks. The significant contributions of this paper can be summarized as follows:
  • This paper proposes an FDC-based EV behavior modeling method from the perspective of time, space, and energy. The proposed method adopts data-driven approaches to uncover the deeper characteristics of EVs with as few data dimensions as possible. It provides a standardized and efficient way for FDC modeling and city-level EV profiling in different regions;
  • From the perspective of EV owners, charging stations, and transportation networks, this paper establishes a travel portrait of city-level EV users. By analyzing the FDCs of multi-type vehicles (i.e., PREVs, CEVs, and OEVs) in multiple scenarios (i.e., date types, functional area types), EV owners’ driving, charging, and vehicle usage characteristics are thoroughly mined;
  • Based on the data mining results, the validity and applicability of the proposed model are verified through the analysis of the EV charging load and the comparison of road flow. In this way, the validity of the proposed method is demonstrated in a closed loop. It provides a data source and user behavior model for EV charging control and navigation.

1.4. Paper Organization

The rest of this paper is organized as follows. Section 2 sketches the FDC-based EV modeling and analysis architecture. Section 3 introduces how to employ a data-driven approach to mine and model the FDC. The EV users’ characteristics are analyzed in Section 4. Finally, the paper ends with a discussion and conclusions.

2. FDC-Based EV Modeling and Analysis Architecture

To model and analyze EVs’ FDCs, the data sets of 300 EVs (including 150 PREVs, 100 CEVs, and 50 OEVs) in Chongqing from 1–31 December 2019, are adopted. The framework of data expansion and FDC mining based on actual EV travel data is shown in Figure 1:
(1)
Firstly, determine the regional scope. DataMap is introduced for POI retrieval, and the city functional areas are divided based on the POI information;
(2)
Secondly, EV travel data is extracted and mined to describe user driving characteristics. Combined with the expanded charging station information, the EV charging state is identified, and the charging time and charging power are calculated as the basis of charging characteristics mining for users;
(3)
Then, the driving and charging characteristics are integrated to explore EV owners’ vehicle usage characteristics from coupled traffic characteristics, driving trajectory, and charging preference;
(4)
Finally, the charging load of the selected area is deduced based on the FDC mining results, and the effectiveness of the proposed model is verified by a comparative analysis of road traffic flow.

3. FDC-Based Modeling and Mining

In this section, the “driving-charging-usage” characteristics of different EVs are deeply explored based on a real-world EV data set. For the follow-up research and analysis, the original data set is pre-processed, and the urban functional areas in Chongqing are divided firstly. Secondly, the driving characteristics of EV users are derived based on GPS trajectories. Then, the charging characteristics of different EVs are mined via SOC data. Finally, the behavior preferences of EV users are described from the synthetical perspective of time, space, and energy.

3.1. Data Description and Pre-Processing

3.1.1. Data Description

The data set format is listed in Table 1, and the sampling interval is 3 s. The driving/parking state recognition is performed on the original data set: if EV’s coordinates are stationary for more than 5 min, it is judged that the EV is parking; otherwise, it is driving. Based on the state recognition results, 112,701 pieces of driving data are extracted, including 27,935 pieces of PREVs, 75,703 pieces of CEVs, and 9063 pieces of OEVs. Accordingly, the number of parking data is 112,814, including 27,957 pieces of PREVs, 75,769 pieces of CEVs, and 9088 pieces of OEVs.
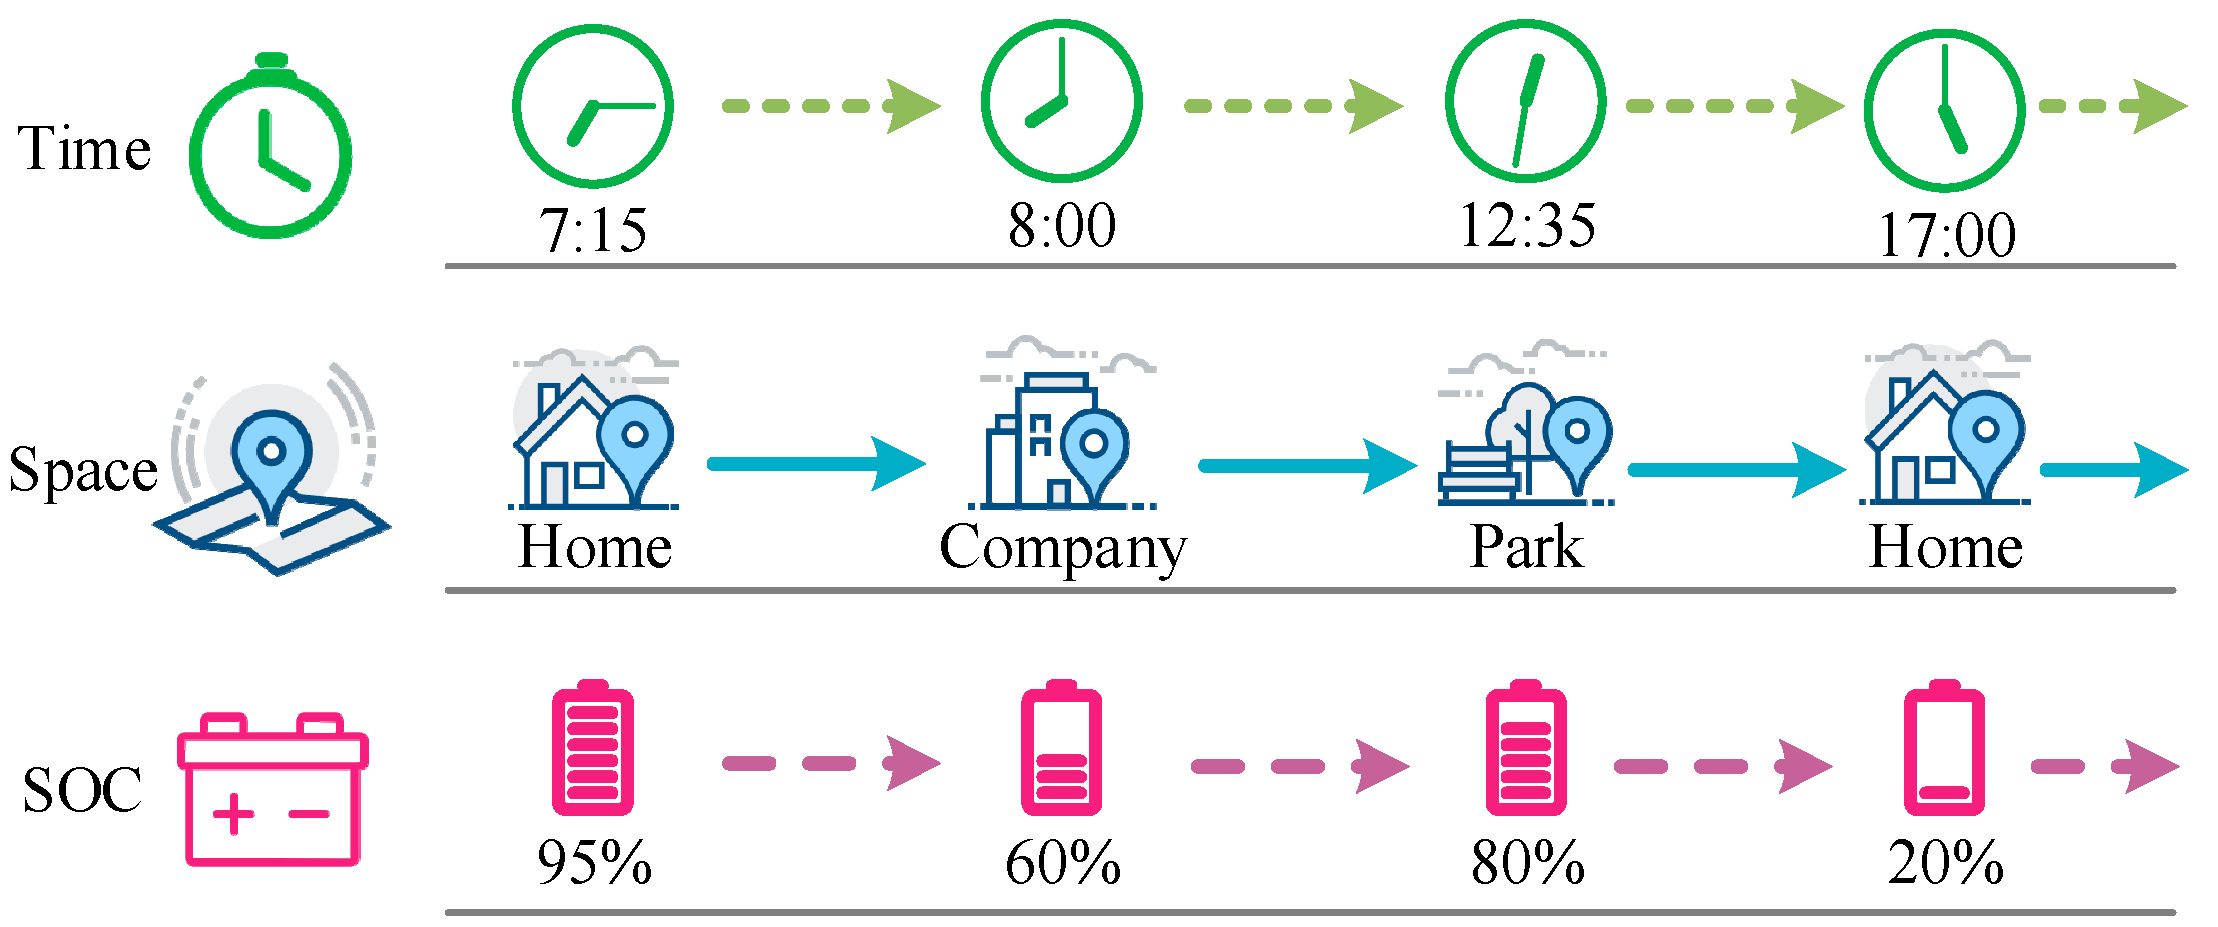
The data set mainly includes instant time, GPS coordinates, and SOC, representing three aspects of information: time, space, and energy. Unlike FVs, EVs combine mobility and energy storage characteristics, and the user behavior cannot be fully characterized based on the space and time latitudes [25,26]. Therefore, based on the three aspects of information, as shown in Figure 2, this paper models the FDC and mines the behavior characteristics of EV users.

3.1.2. Data Pre-Processing

Since the original data set contains interferences such as positioning distortion and missing data, the raw data must be pre-processed to ensure authenticity and practicability:
(1)
Trajectory filtering: the original trajectory may fluctuate sharply due to irresistible factors such as GPS signal interferences. The road network information in Chongqing is obtained via OpenStreetMap, and the GPS coordinates are mapped and filtered to improve the accuracy of the coordinates [27];
(2)
Data cleaning: for travel data, exclude data with instant GPS missing, travel distance less than 0.5 km, and instant SOC less than or equal to 0%. For parking data, exclude data with instant GPS missing and instant SOC greater than 100%;
(3)
Coordinate mapping: both data source and subsequent derivation process are based on the WGS-84 coordinate system. However, the DataMap (based on the GCJ-02 coordinate system) is applied for electronic map drawing in this paper, so the coordinate conversion is required to establish the mapping relationship between two coordinate trajectory sequences [2];
(4)
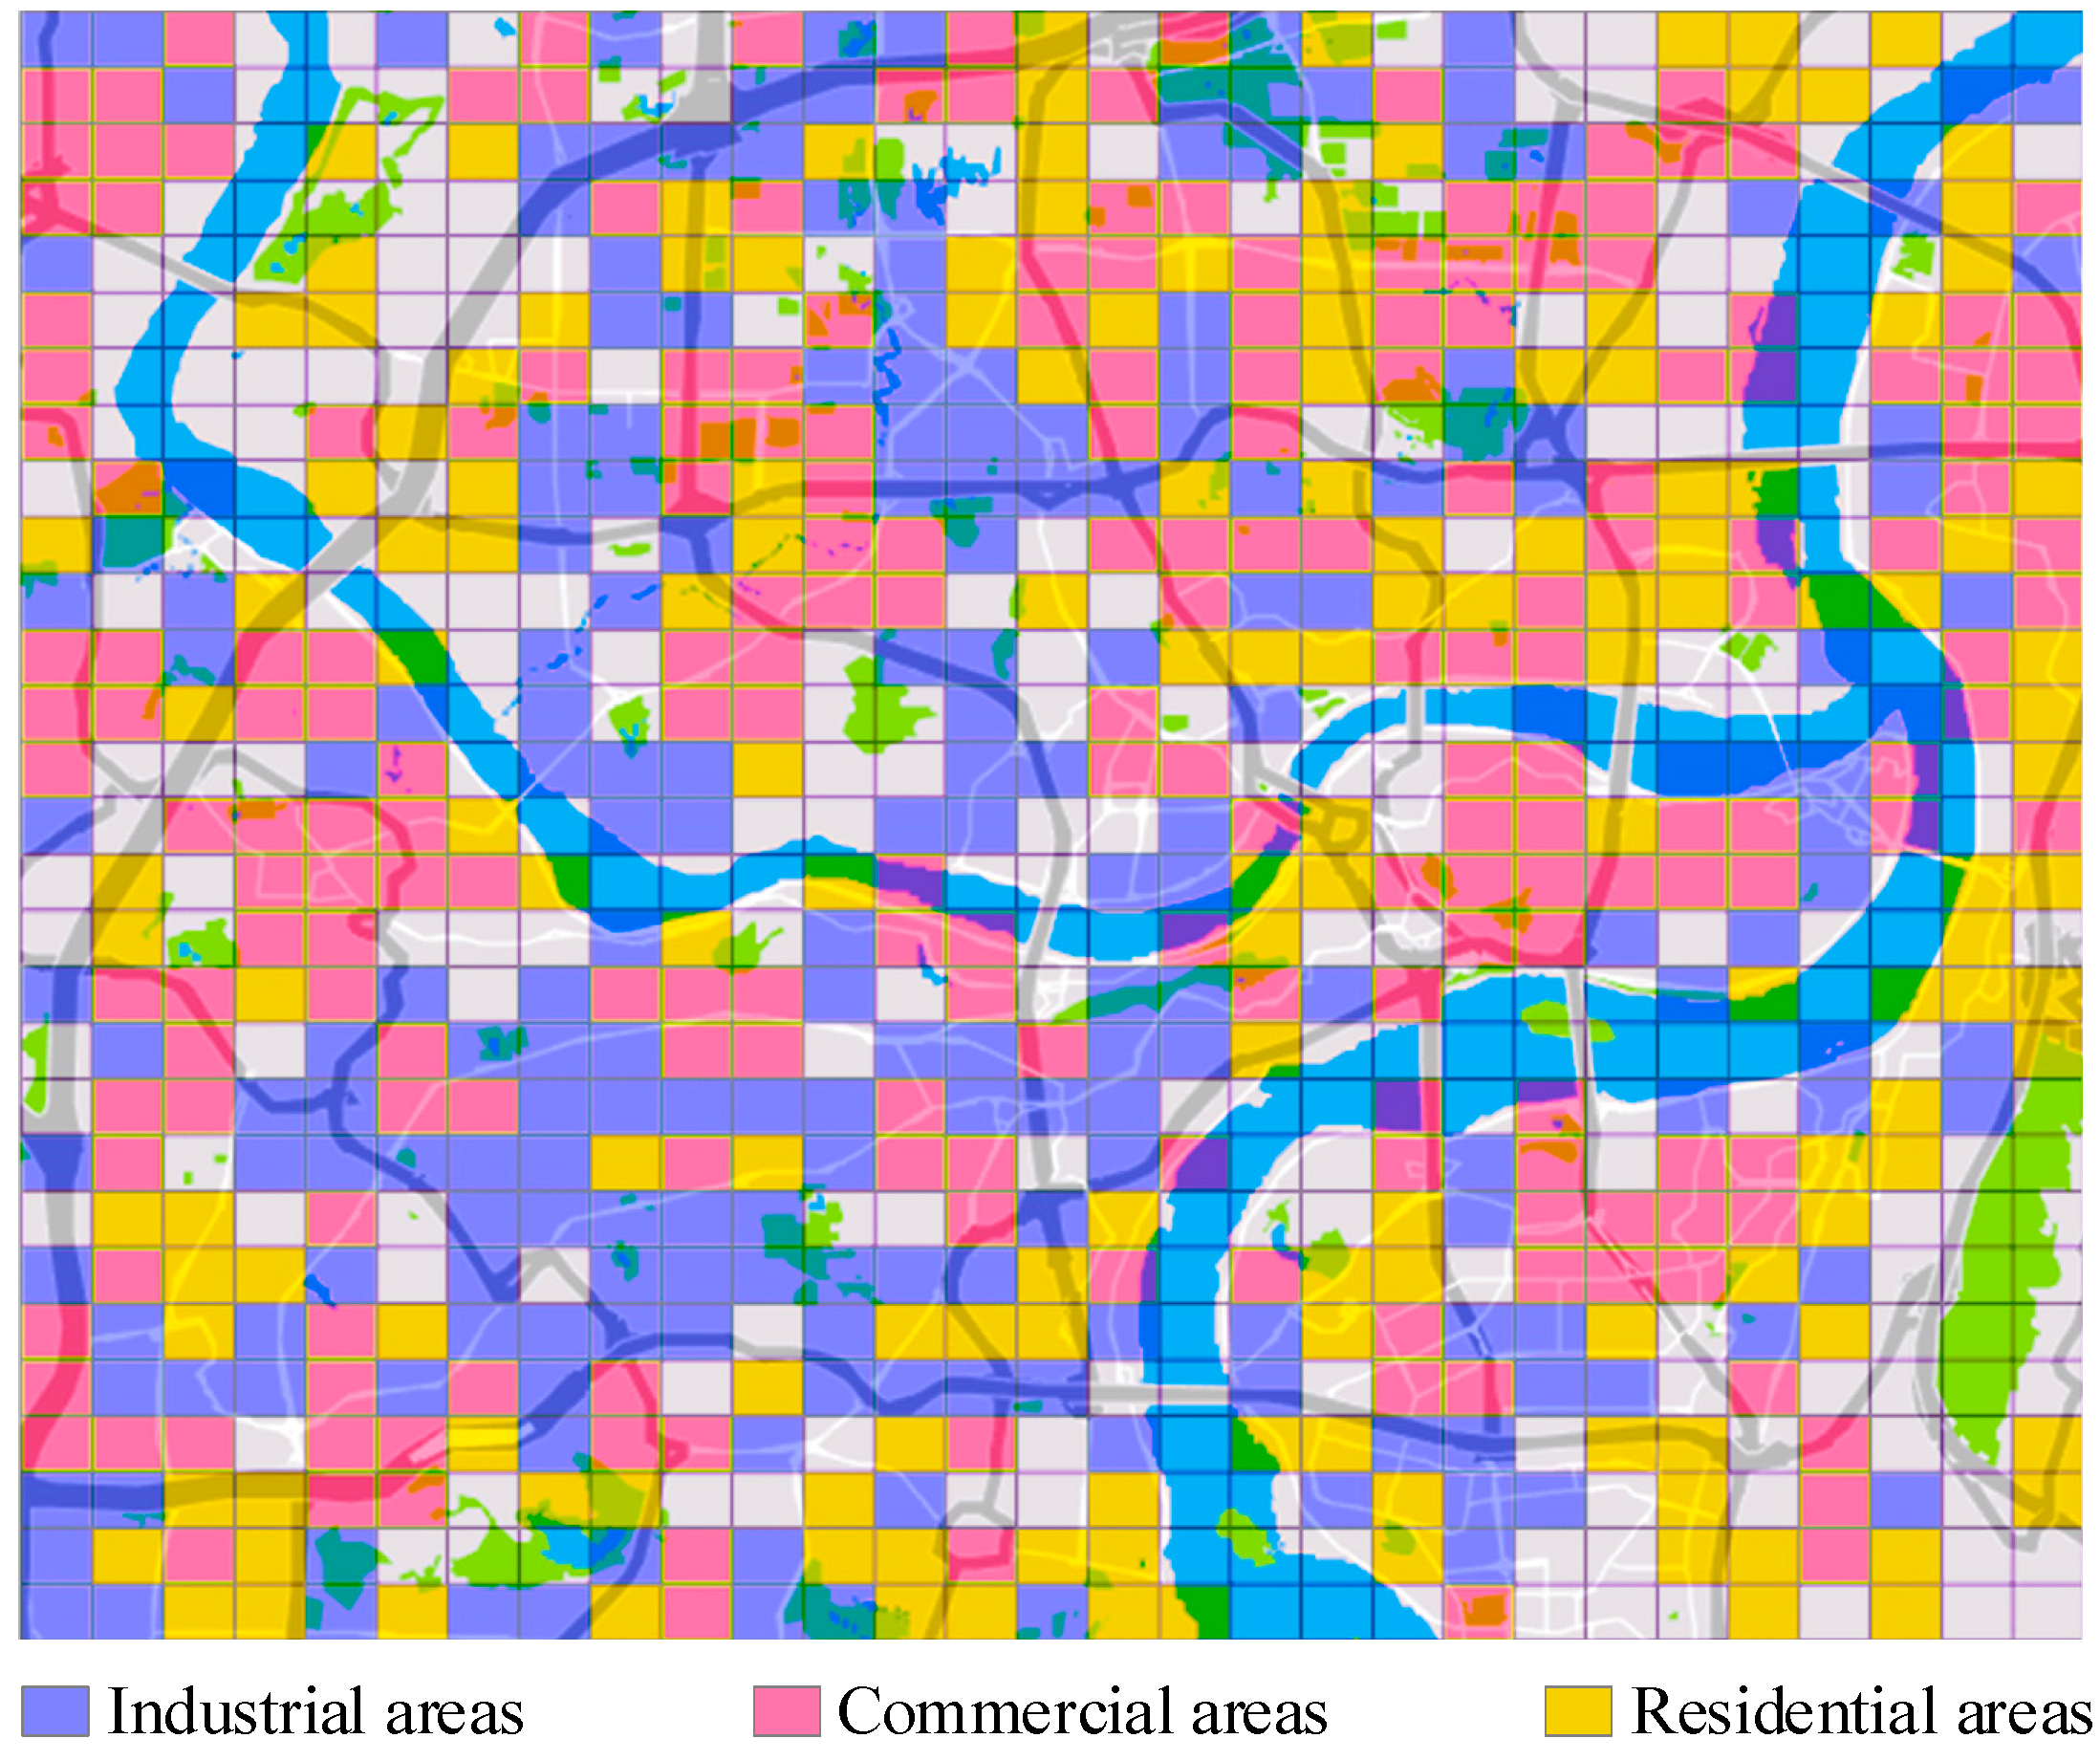
Urban POI division: considering the regional economy and the activities of experimental vehicles, we select the range of longitude (east): 106.440 145~106.604 805, latitude (north): 29.503 586~29.621 343 as the research scope. The circumference is 58.04 km, and the area is 208.52 km2. The DataMap is utilized to retrieve the various types of POI points in the designated area, and the method proposed in [28] is adopted to classify urban areas. The POI partition results are obtained as shown in Figure 3. Among the functional areas, industrial, commercial, and residential areas accounted for 37.73%, 36.57%, and 26.70%, respectively.

3.2. Driving Characteristics Mining

3.2.1. Trajectory OD Point Extracting

The coordinates of the OD points along with timestamps can reflect the travel hot spots and time distribution, respectively. For the pre-processed data set, each trajectory can be expressed as Equation (1):
Ω i = ( x 1 i ,   y 1 i ,   t 1 i ) ,   ( x 2 i ,   y 2 i ,   t 2 i ) , ,   ( x j i ,   y j i ,   t j i )
where: Ω i is the i-th trajectory set. ( x j i ,   y j i ) stands for the longitude and latitude of the j-th coordinate point in the i-th trajectory.   t j i is the time stamp corresponding to the j-th coordinate point in the i-th trajectory.
Based on Equation (1), all departure and arrival trajectory points in the data sets can be extracted as shown in the following formula:
S o = ( x 1 1 ,   y 1 1 ,   t 1 1 ) ,   ( x 1 2 ,   y 1 2 ,   t 1 2 ) , , ( x 1 N ,   y 1 N ,   t 1 N )
S d = ( x n 1 ,   y n 1 ,   t n 1 ) ,   ( x n 2 ,   y n 2 ,   t n 2 ) , , ( x n N ,   y n N ,   t n N )
where: S o and S d are the origin point and destination point sets of travel data. N is the total number of trajectories in the data set. n represents the end of the trajectory.

3.2.2. Mileage Distribution Describing

Limited by the power battery capacity and range anxiety, the mileages of EVs are different from that of FVs. Based on the trajectory data in Equation (1), we can calculate EV’s single-trip mileage and daily mileage:
d j i = R arccos [ cos ( y j i ) cos ( y j + 1 i ) cos ( x j + 1 i x j i ) + sin ( y j i ) sin ( y j + 1 i ) ]
D i = j = 1 n 1 d j i
where: d j i represents the distance from point j to j + 1 in the i-th trajectory, in km. R is the radius of the earth. D i denotes the travel distance of the i-th trajectory.

3.2.3. Driving Portrait Drawing

Based on Equation (4), the driving speed and acceleration of the EV user can be obtained. Additionally, the road speed profile, as well as driving characteristics of EVs, can be further described:
v j i = d j i Δ t   ,     j = 1 ,   2 , ,   n 1
a j i = v j + 1 i v j i Δ t   ,     j = 1 ,   2 , ,   n 2
where: v j i and a j i , respectively, denote the instantaneous velocity and acceleration of the i-th trajectory. Δ t is the sampling interval.

3.2.4. Traffic Flow Reckoning

The road traffic flow is determined by vehicle speed and traffic density. For road section i-j, when the traffic density is minimal, the vehicles on this road can travel at the maximum speed without being affected by other vehicles; when the traffic density reaches the vehicle-following density, the vehicle speed is limited by the density; when the traffic density reaches the blocking density, the vehicle stops.
Q i , j = ρ i , j V i , j f ,     V i , j V i , j f Q i , j = V i , j a V i , j 2 + b V i , j + c ,     V i , j q V i , j < V i , j f Q i , j = V i , j b V i , j + c ,     0 V i , j < V i , j q
where: Q i , j indicates the number of vehicles passing the road i-j equivalent hour. ρ i , j represents the traffic density. V i , j denotes the average speed. V i , j f and V i , j q are the free speed and vehicle-following speed of the road section, both of which are related to the road class. a ,   b ,   c represent the braking safety factor, driver reaction time, and driving safety distance, respectively. Please refer to the study [29] for detailed parameters.

3.3. Charging Characteristics Mining

3.3.1. Charging States Recognizing

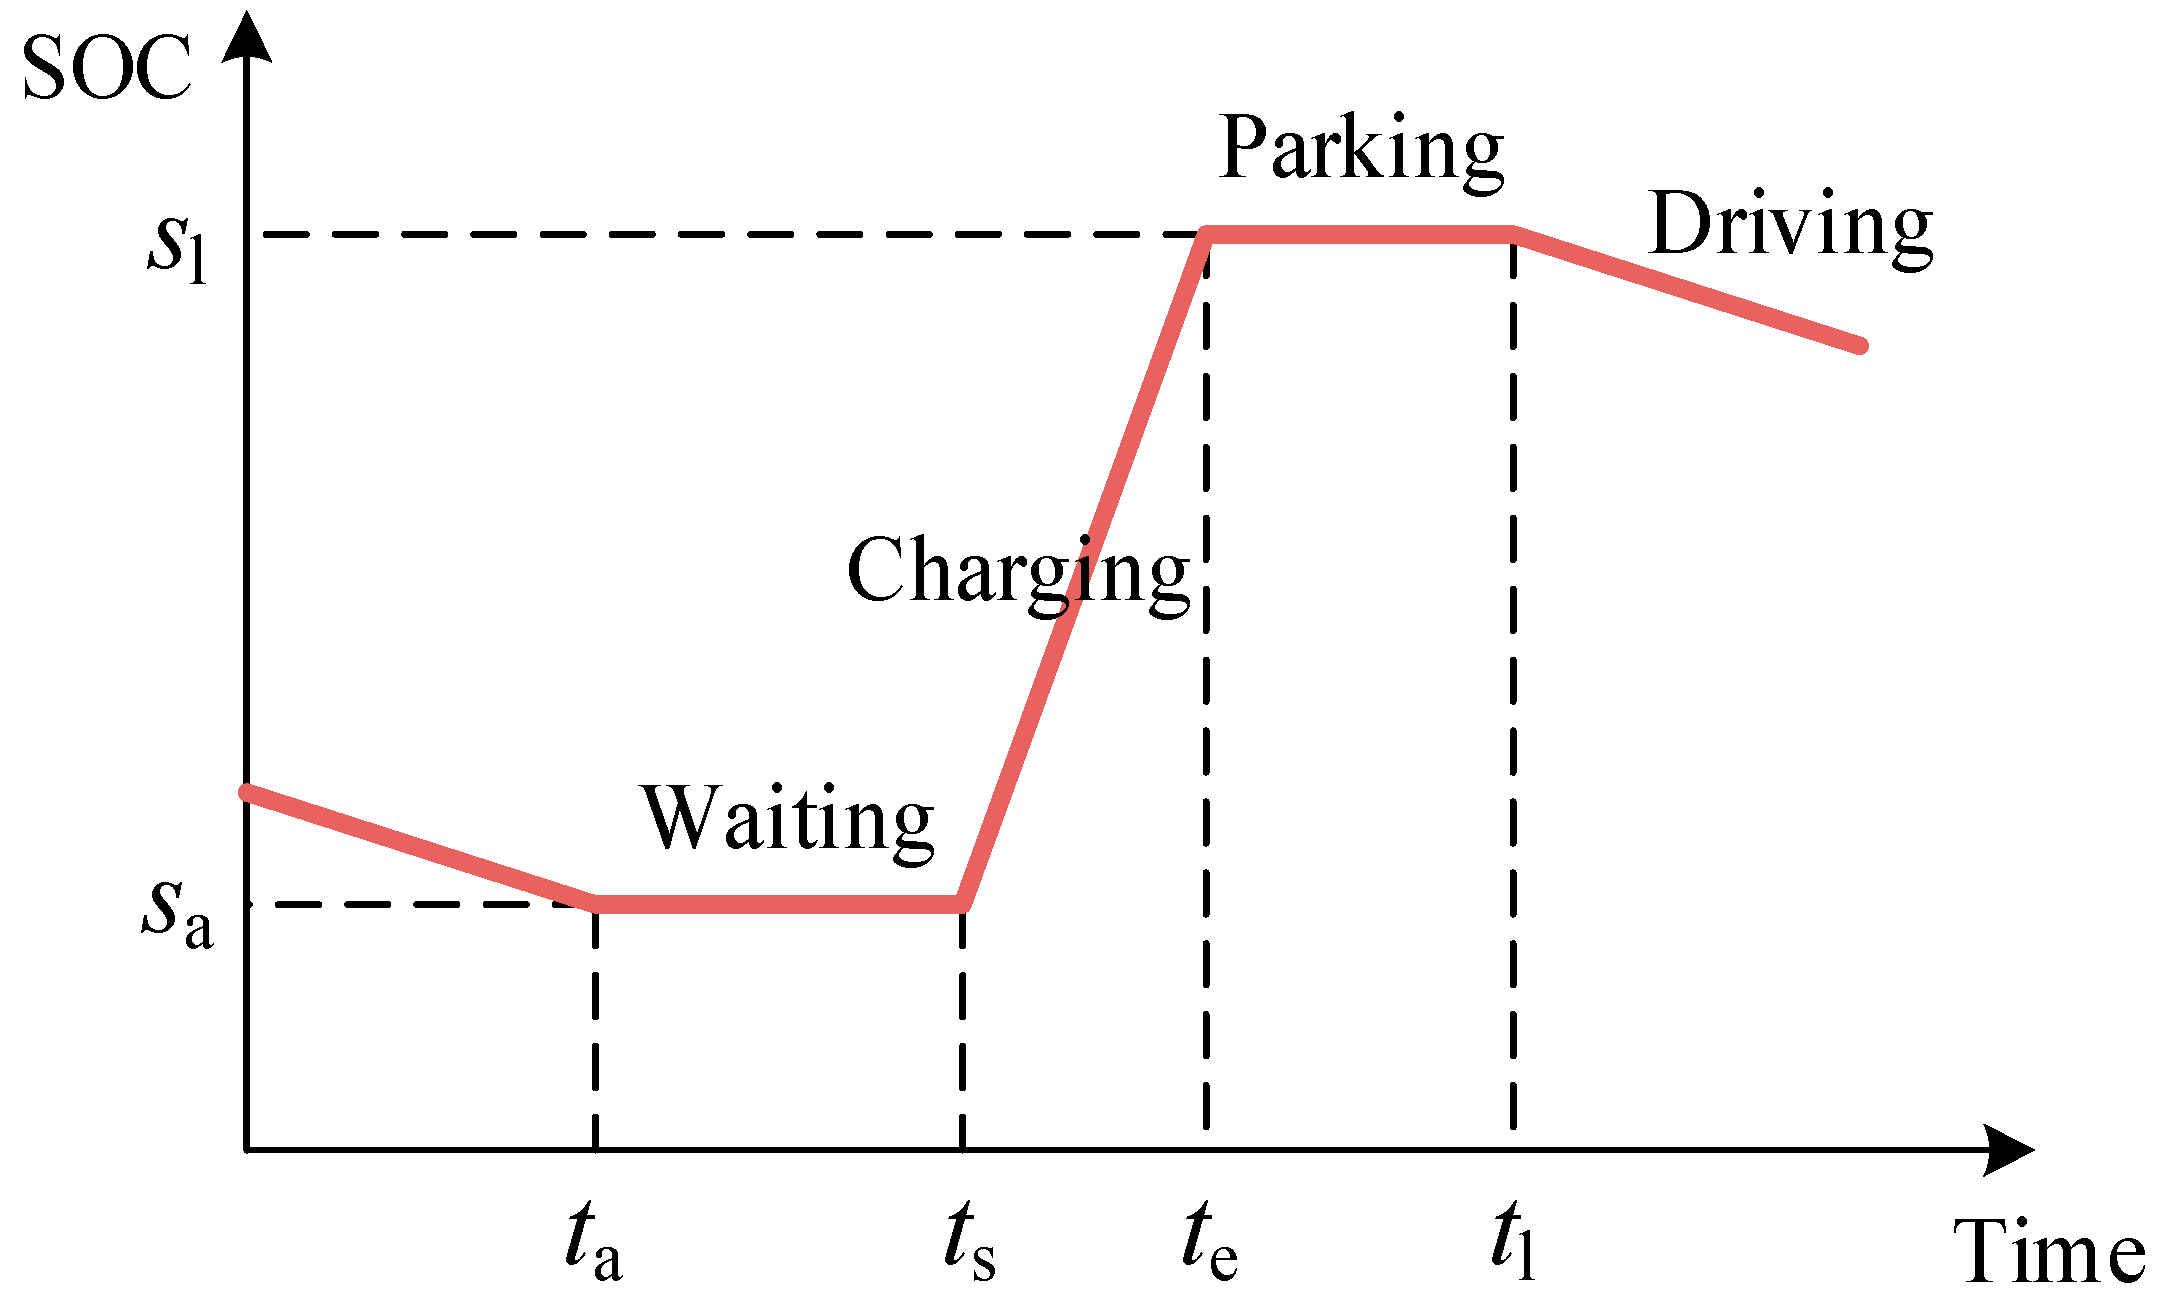
The parking data of EVs contains two states: normal parking and charging. The charging state recognition is the research focus of this section. The schematic diagram of EV charging state recognition is detailed in Figure 4. t a and t l are the arrival time and departure time, respectively. t s and t e are the start charging time and end charging time, respectively, s a and s l represent the battery SOC when the EV arrives and leaves the charging station, respectively.
It can be seen from Figure 4 that the trend of SOC is the key to EV charging states identification. Let δ j i indicate the EV charging states identification feature at time j of the i-th parking data:
δ j i = 1 T N j = 1 T N s j + 1 i s j i Δ t
where: s j i represents the SOC of the i-th parking data at time j. T N is the sliding window, and T N = 20. If δ j i > 0, it means the EV is charging; otherwise, it is in the waiting or parking state.
Depending on Equation (9), the parking data is identified, and the time set T, and the energy set S of the charging process can be obtained as follows:
T = ( t a 1 ,   t s 1 ,   t e 1 ,   t l 1 ) ,   ( t a 2 ,   t s 2 ,   t e 2 ,   t l 2 ) ,   ,   ( t a m ,   t s m ,   t e m ,   t l m )
S = ( s a 1 ,   s l 1 ) ,   ( s a 2 ,   s l 2 ) ,   ,   ( s a m ,   s l m )
where: t a m ,   t s m ,   t e m , and t l m denote the arrival, start charging, end charging, and departure time of the m-th charging record, respectively. s a m and s l m , respectively, denote the arrival and departure SOC.

3.3.2. Charging Time Calculating

At present, Chongqing has been equipped with 120 kW high-power charging piles. For an EV with a battery capacity of 40 kWh, the theoretical charging time is less than 20 min. However, the number of chargers in a charging station is generally about 10, and considering the equipment maintenance and other conditions, EV users have to wait during peak charging periods such as noon. The actual time staying at the charging station is much longer than 20 min. The EV user’s time at the charging station can be divided into waiting, charging, and parking time:
t w i = t s i t a i
t c i = t e i t s i
t p i = t l i t e i
where: t w i , t c i and t p i , respectively, indicate the waiting, charging, and parking time of the i-th charging record.

3.3.3. Charging Cost Statistics

The EV charging power can be calculated as shown in Equation (15):
P i = ( s l i s a i ) Q i t c i η
where: Q i stands for the capacity of the EV battery. η denotes the charging efficiency of the charging pile and assuming η = 0.95 . P i denotes the charging power of the i-th charging record. If P i < 30 kW, it is regarded as slow charging; otherwise, it is considered as fast charging.
Furthermore, to calculate the EV charging cost, we use Python to get the location and charging price information of all charging stations within the research area from the ChargeBar (www.bjev520.com, accessed on 25 May 2022). By matching charging records with charging station information, the electricity price of each charging record is obtained, and the charging cost can be calculated as below:
C i = ( s l i s a i ) Q i η p i ( t )
where: C i represents the charging cost of EV owner. p i ( t ) represents the charging price (including the electricity price and service fee) of the charging station corresponding to the i-th charging record. If the i-th charging record fails to match the charging station information, it is considered that the EV is charged at home and p i ( t ) is the residential electricity price.

3.4. Vehicle Usage Characteristics Mining

3.4.1. Coupled Traffic Characteristics Analyzing

As regards coupled traffic characteristics, aggressive driving behaviors (i.e., excessive speed, rapid acceleration) are the leading cause of traffic accidents. In addition, the driving behaviors of EV users can also affect the comprehensive energy consumption level of vehicles. Therefore, the analysis of coupled traffic characteristics has guiding significance for urban road planning, traffic diversion, and sustainable development. The maximum speed v max i , maximum acceleration a max i , and power consumption per unit mileage ε i , are taken as the critical factors for the analysis of coupled traffic characteristics. The power consumption per unit mileage can be expressed as Equation (17):
ε i = D i ( s 1 i s n i ) Q i
where: ε i represents the power consumption per unit mileage, in kWh/km. s 1 i and s n i represent the SOC at the start and end of the travel trajectory.

3.4.2. Travel Trajectory Clustering

Furthermore, to analyze the characteristics of the travel route for different drivers, we conducted a cluster analysis on the driving trajectories. The essence of trajectory similarity is the similarity of a series of position points. Factors such as driving direction and distance may affect the similarity between trajectories. To this end, the longest common subsequence (LCS) is introduced to define the similarity between travel trajectories, and the DBSCAN is adopted to cluster the trajectory data.
For the trajectory set, let A and B be two trajectories, and a i and b j be the trajectory points. The similarity between the two trajectory points can be expressed in Equation (18):
s i m ( a i , b j ) = 0                                                           ,   if   d D ,   L 2 ( a i d , b j d ) > s t d min d 1 N D d = 1 N D 1 L 2 ( a i d , b j d ) s t d min d   ,   otherwise
where: D represents the total dimension set of track points. N D denotes the total dimension. L 2 (     ) denotes the Euclidean distance. s t d min d indicates the minimum standard deviation of the data in dimension d.
The similarity of the two trajectory sub-segments can be expressed as shown in Equation (19):
L C S ( i , j ) = 0 , i = 0   or   j = 0 L C S ( i 1 , j 1 ) + s i m ( a i , b j ) , s i m ( a i , b j )   > e max L C S ( i , j 1 ) , L C S ( i 1 , j ) , othersize
where: L C S ( i , j ) represents the similarity of two trajectory sub-segments. E stands for the similarity threshold.
The similarity of the two trajectories L C S ( A , B ) can be obtained based on the recursive calculation of Equation (19). Then the distance between the two trajectories can be further defined as Equation (20):
d i s t L C S ( A , B ) = 1 L C S ( A , B ) min { N A , N B }
where: d i s t L C S ( A , B ) indicates the LCS distance of the two trajectories. N A and N B , respectively, represent the length of the two trajectories.
Based on the LCS distances, DBSCAN is employed to cluster travel trajectories in different scenarios to identify the driving habits of different EV users.

3.4.3. Charging Preference Evaluating

As stated above, the total time of each EV staying in the charging station can be divided into three parts, namely, waiting, charging, and parking time. In some cases, the EV user occupies the charging pile after completing the charging task and does not leave in time, resulting in parking time. However, the power battery is fully charged, so the parking time should not be counted as the time cost. The time cost of EV users can be expressed as Equation (21):
T total i = t w i + t c i
where: T total i represents the total time cost of the i-th charging data.
In fact, during the charging process, EV owners are most concerned about the time and cost spent on charging, which can reflect the tendency of different users to indicators (i.e., charging power and charging cost). In other words, the charging cost and charging time can reflect the charging preferences of different EV users. Therefore, we take charging time and charging cost as two important parameters and adopt DBSCAN to cluster the charging data of different users to explore the charging preferences.

4. Modeling Results and Analysis of EV User Characteristics

Based on the modeling and mining of EVs’ FDCs, this section analyzes and discusses the results from four aspects: driving characteristics, charging characteristics, vehicle usage characteristics, and effectiveness of behavior modeling.

4.1. EV Driving Characteristics

Firstly, Figure 5 exhibits the departure time distributions of the three types of EVs. The travel time of PREVs is distributed in double-peak hours, that is, the morning and evening rush hours of traffic travel. The travel peaks of PREVs are time-shifted on different days. On weekdays, the morning and evening peaks appear at 6:00–8:00 and 16:00–18:00, respectively, whereas on weekends are 8:00–10:00 and 18:00–20:00, respectively. The departure time of CEVs and PREVs are relatively similar, reflecting users’ daily travel demands. The difference is that the travel demand of CEVs on holidays is 19.51% higher than that on weekdays, and there is a higher travel demand during the day until 22:00. While the demand of PREVs on holidays is 17.56% lower than that on weekdays. The travel patterns of OEVs are utterly different from PREVs and CEVs. Due to their work attributes, the travel volume on weekdays is 3.04 times that on weekends.
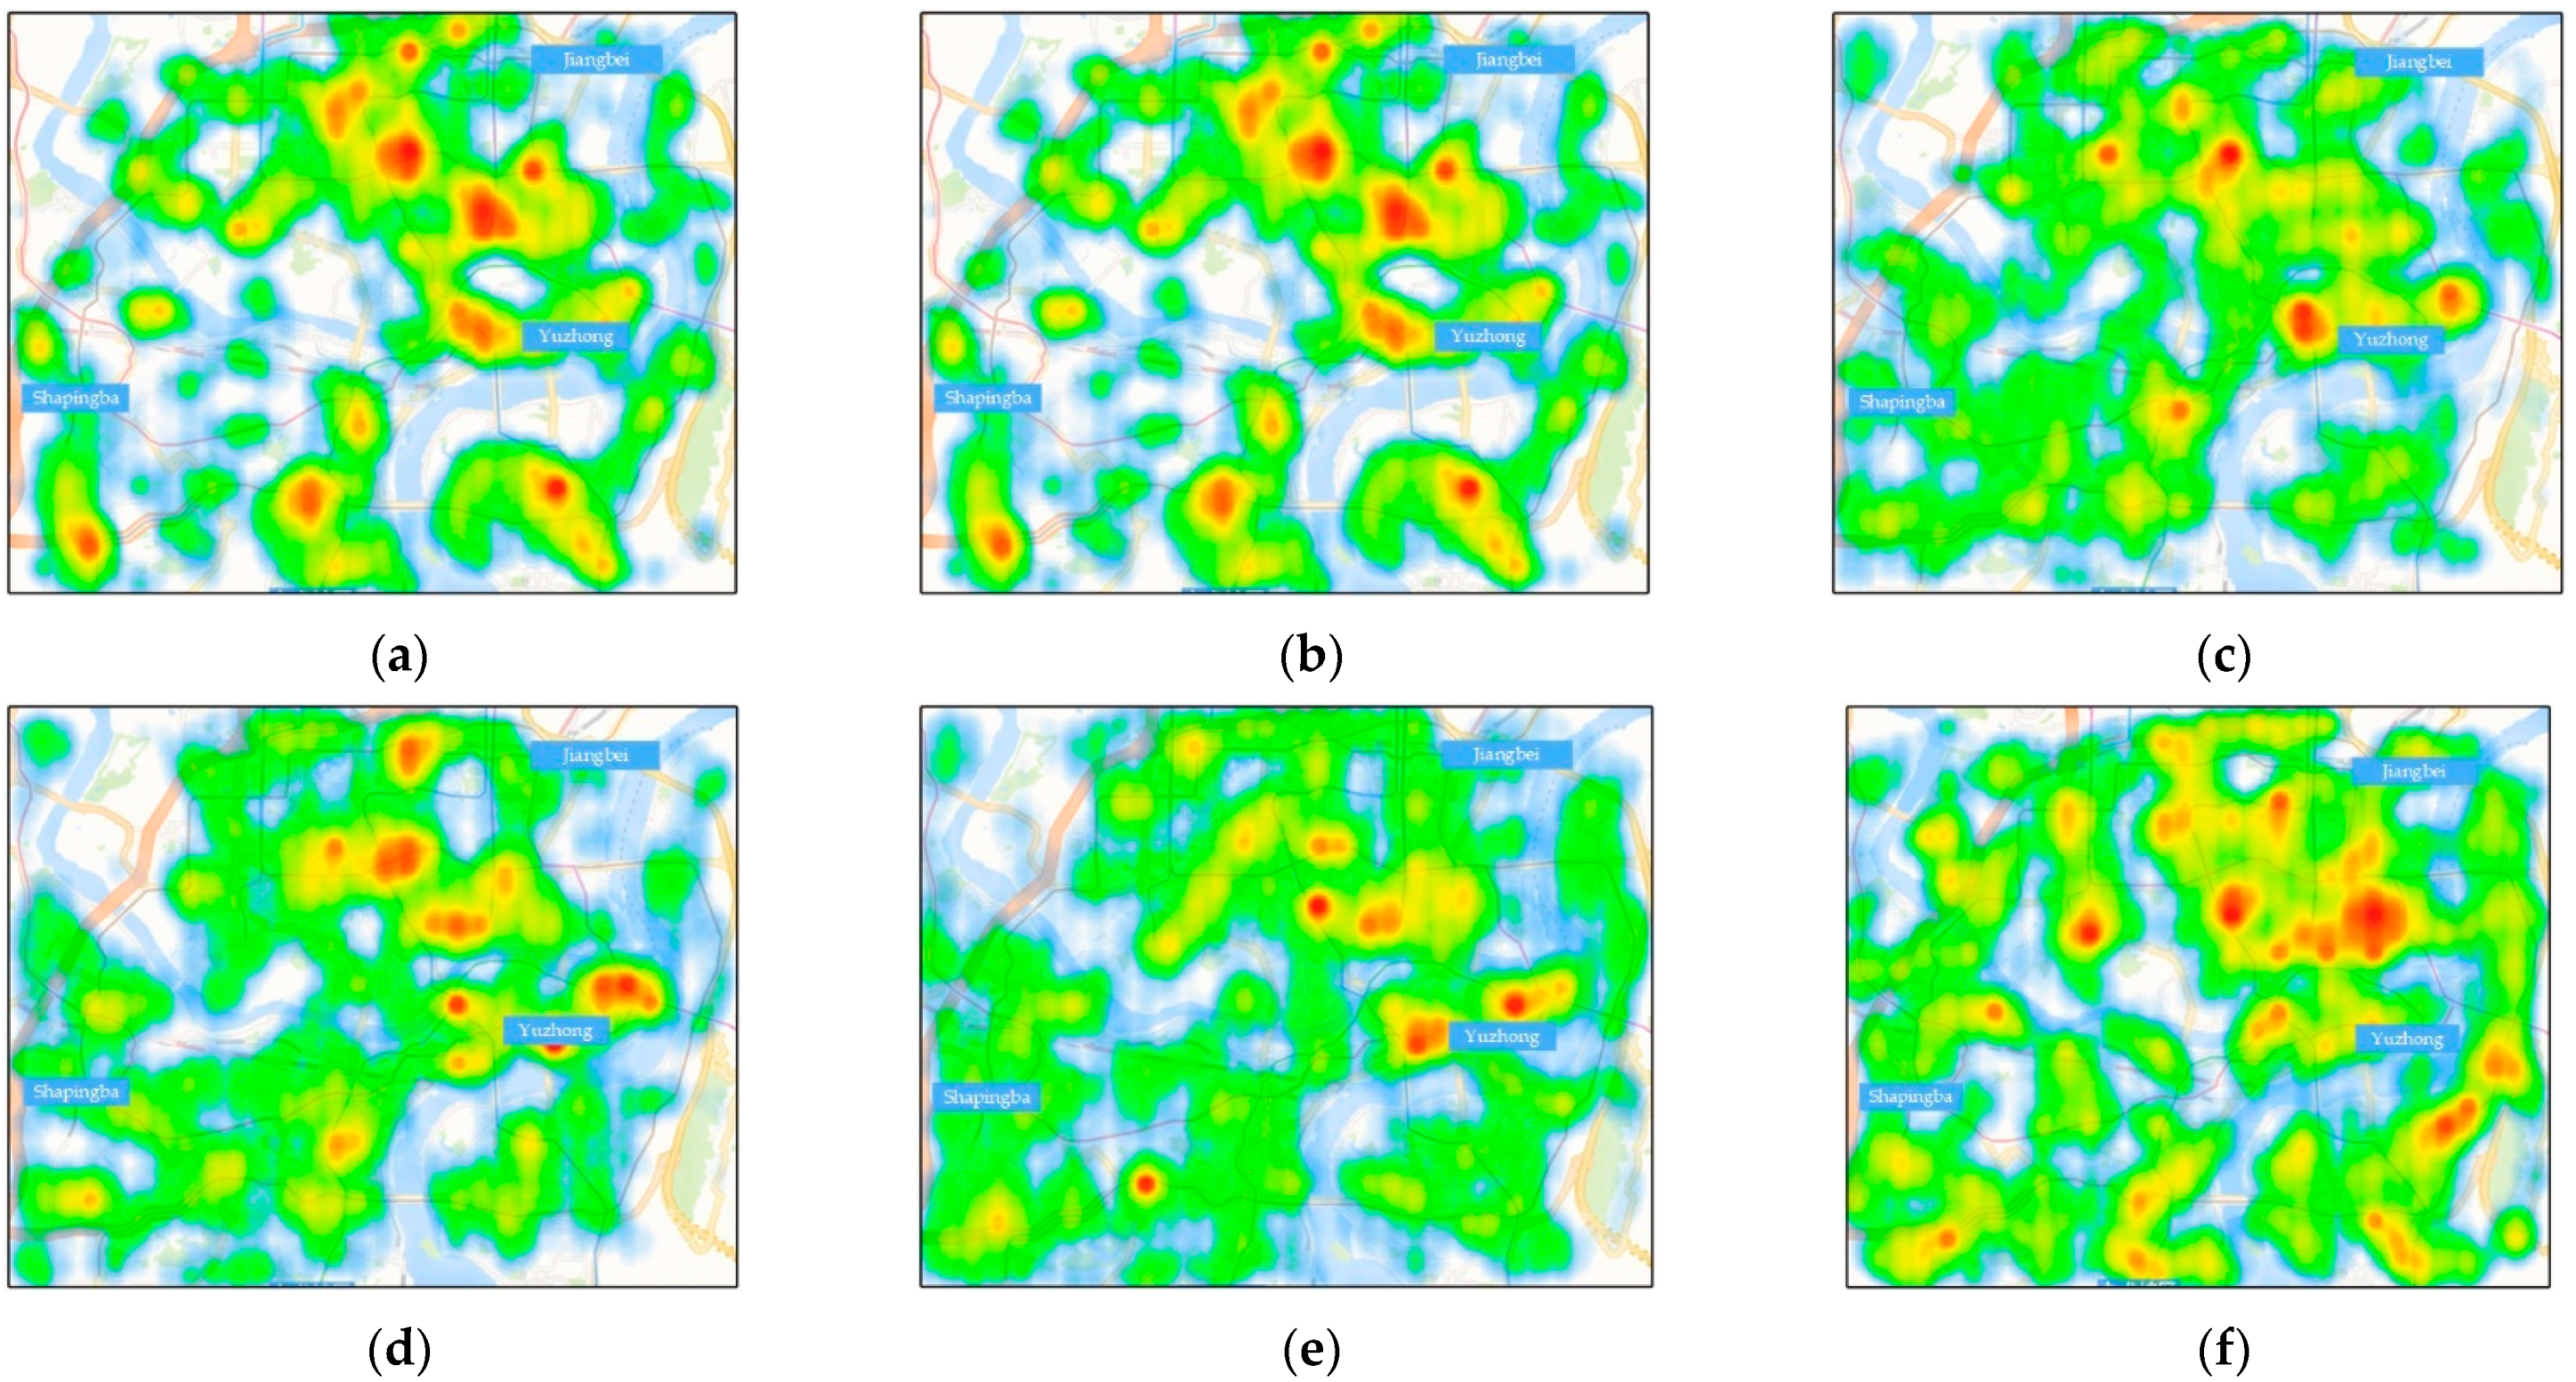
Furthermore, to explore the distributions and time-space transfer characteristics of EV travel hotspots, the travel distribution at different times can be obtained via statistical analysis of the travel OD, as shown in Figure 6. The travel hotspots are primarily concentrated in industrial and commercial areas, accounting for 34.90% and 34.75%, respectively, whereas residential areas account for a relatively small proportion of only 23.10%. The spatial transfer characteristics of travel hotspots at different times are pronounced. Residential areas account for the most significant proportion of departures during 8:00–9:00, accounting for 39.45%, whereas industrial regions account for 40.32% during 17:00–18:00. In terms of regional distribution, Yuzhong District, as the economic, political, and cultural center of Chongqing, is significantly more prevalent in travel than other regions, forming three hot areas centered on the Longhushidai, Chongqing station, and Jiefangbei.
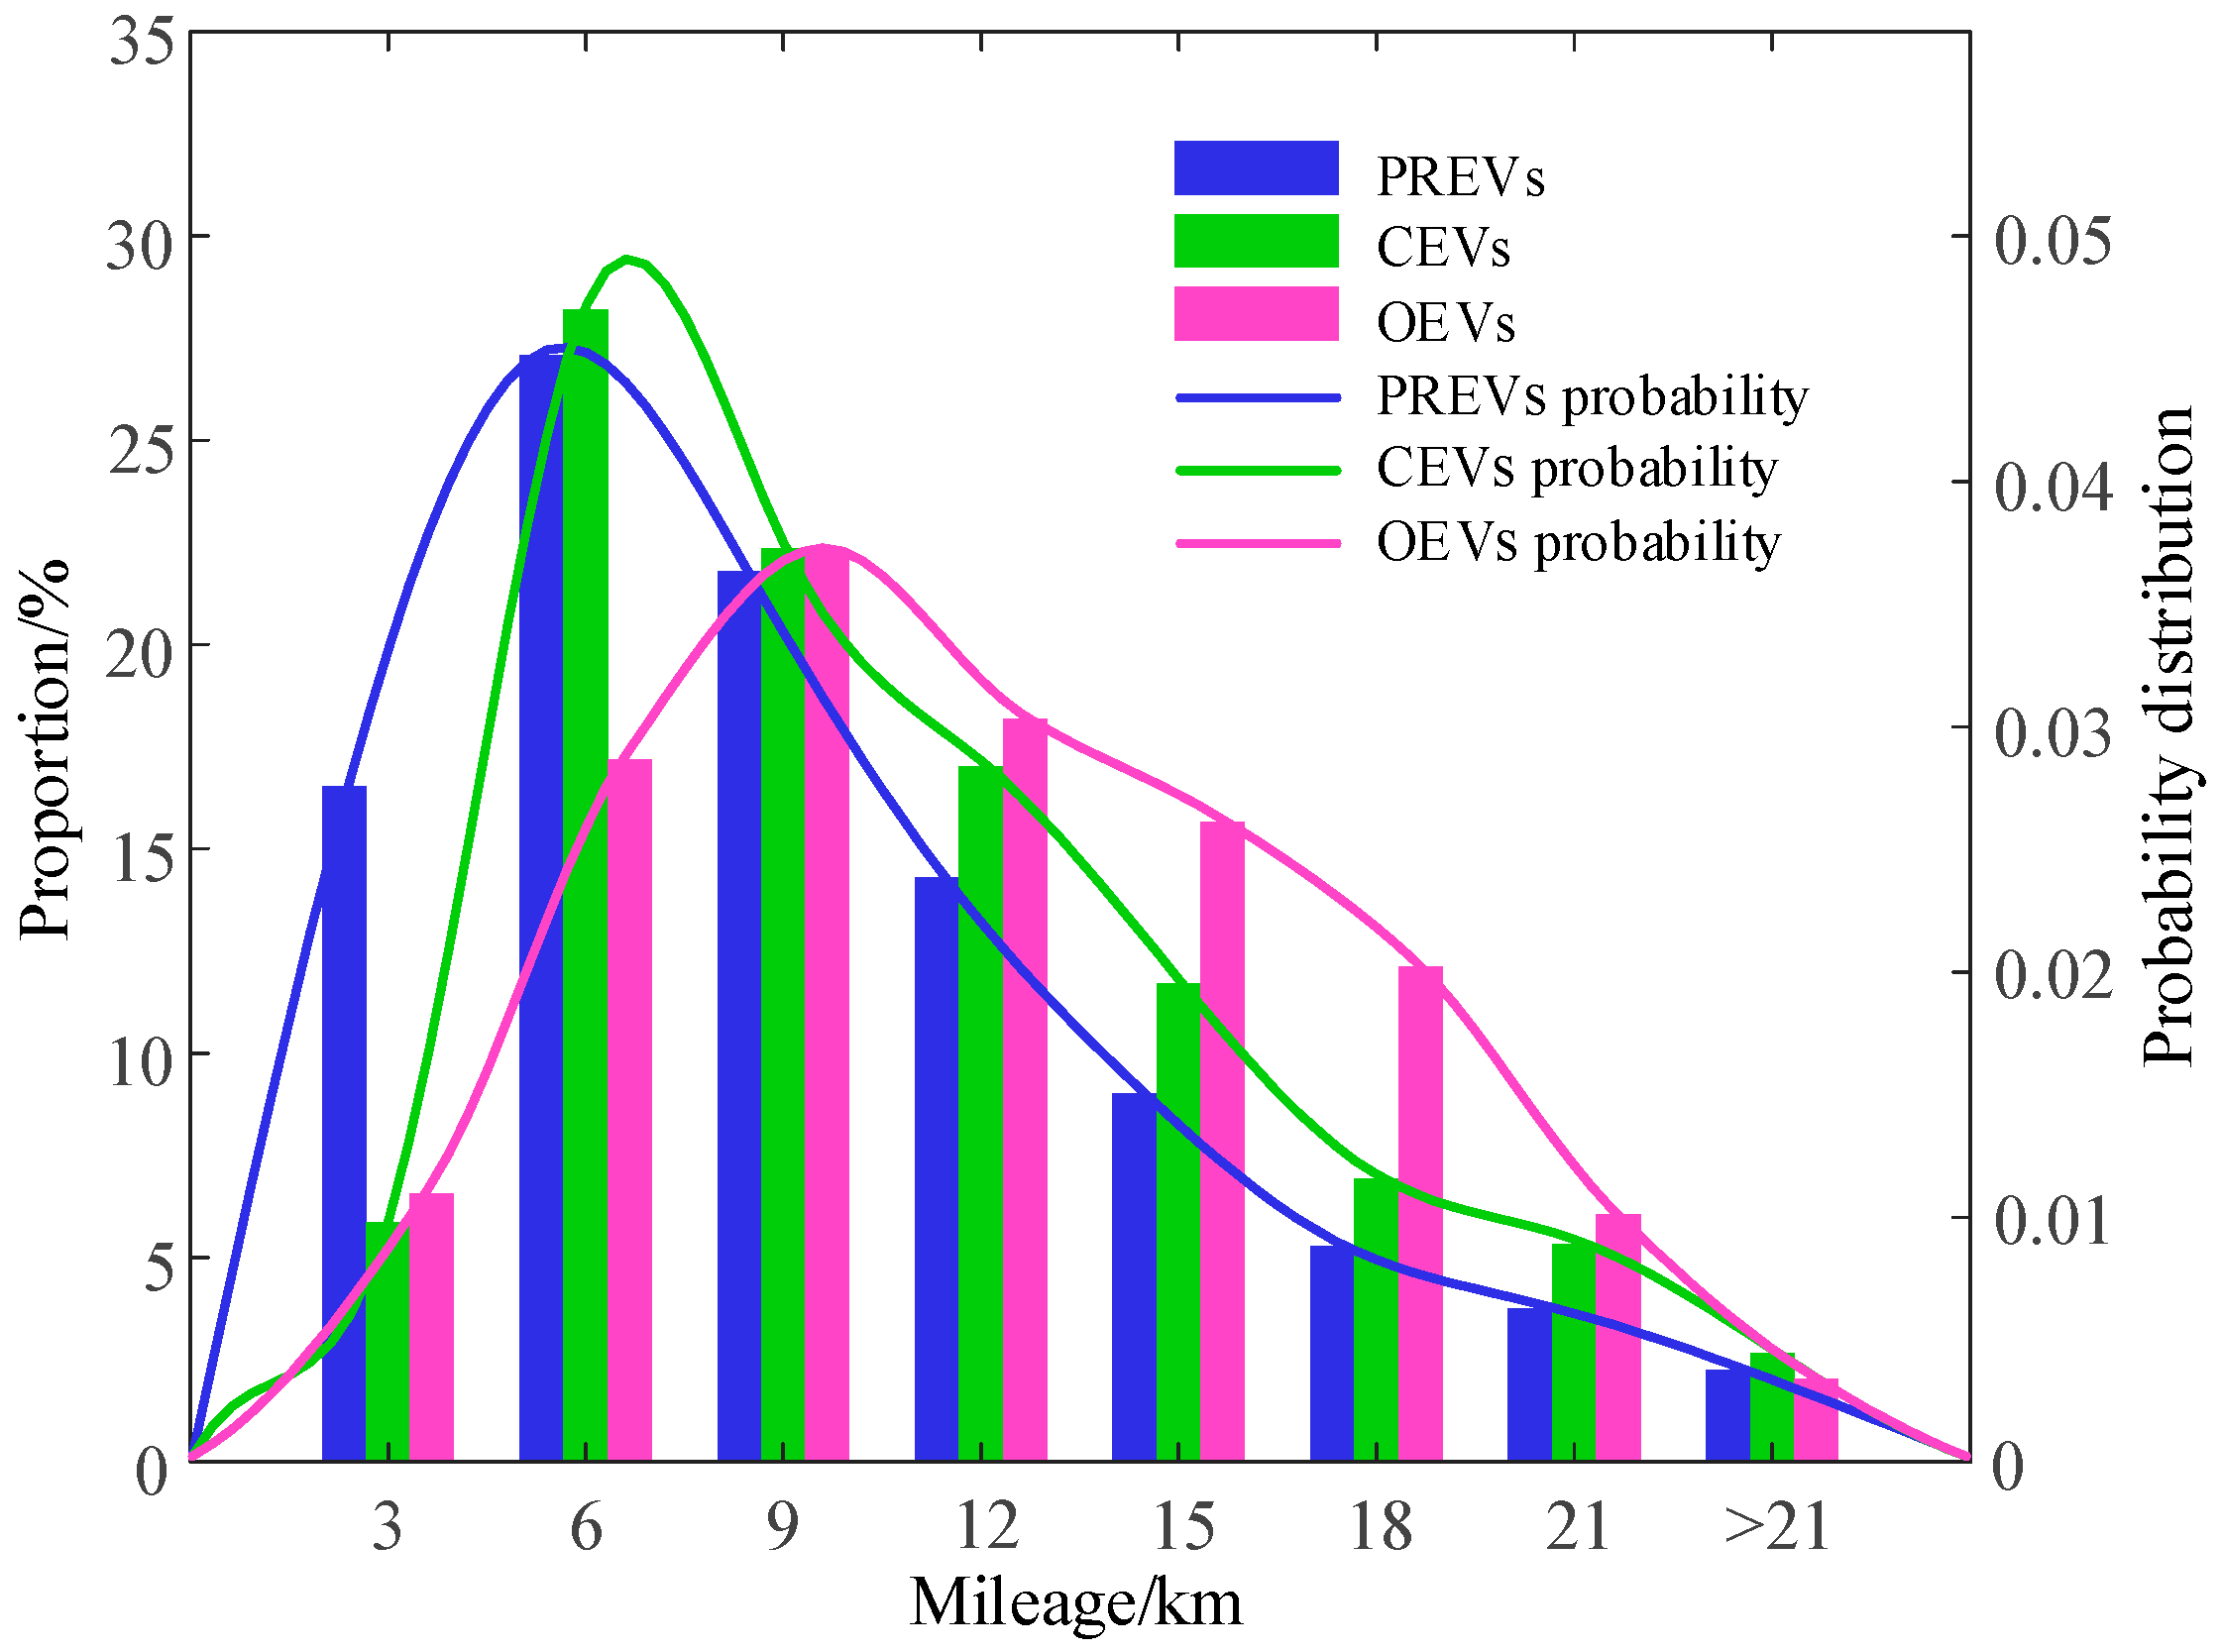
The single-trip mileage of different vehicles is illustrated in Figure 7. The average single-trip mileage of PREVs, CEVs, and OEVs is 10.53 km, 17.23 km, and 20.17 km, respectively. The single-trip mileage of PREVs in the range of 0–3 km and 3–6 km accounted for 16.54% and 27.07%, respectively. On the contrary, the proportion of CEVs in the range of 0–3 km is much lower than that of PREVs, which is only 5.85%, reflecting the lower demand of CEV passengers for trips within 3 km. The single-trip mileage of OEVs is longer than the other two, with a single-trip mileage of more than 9 km accounting for 54.04%.

4.2. EV Charging Characteristics

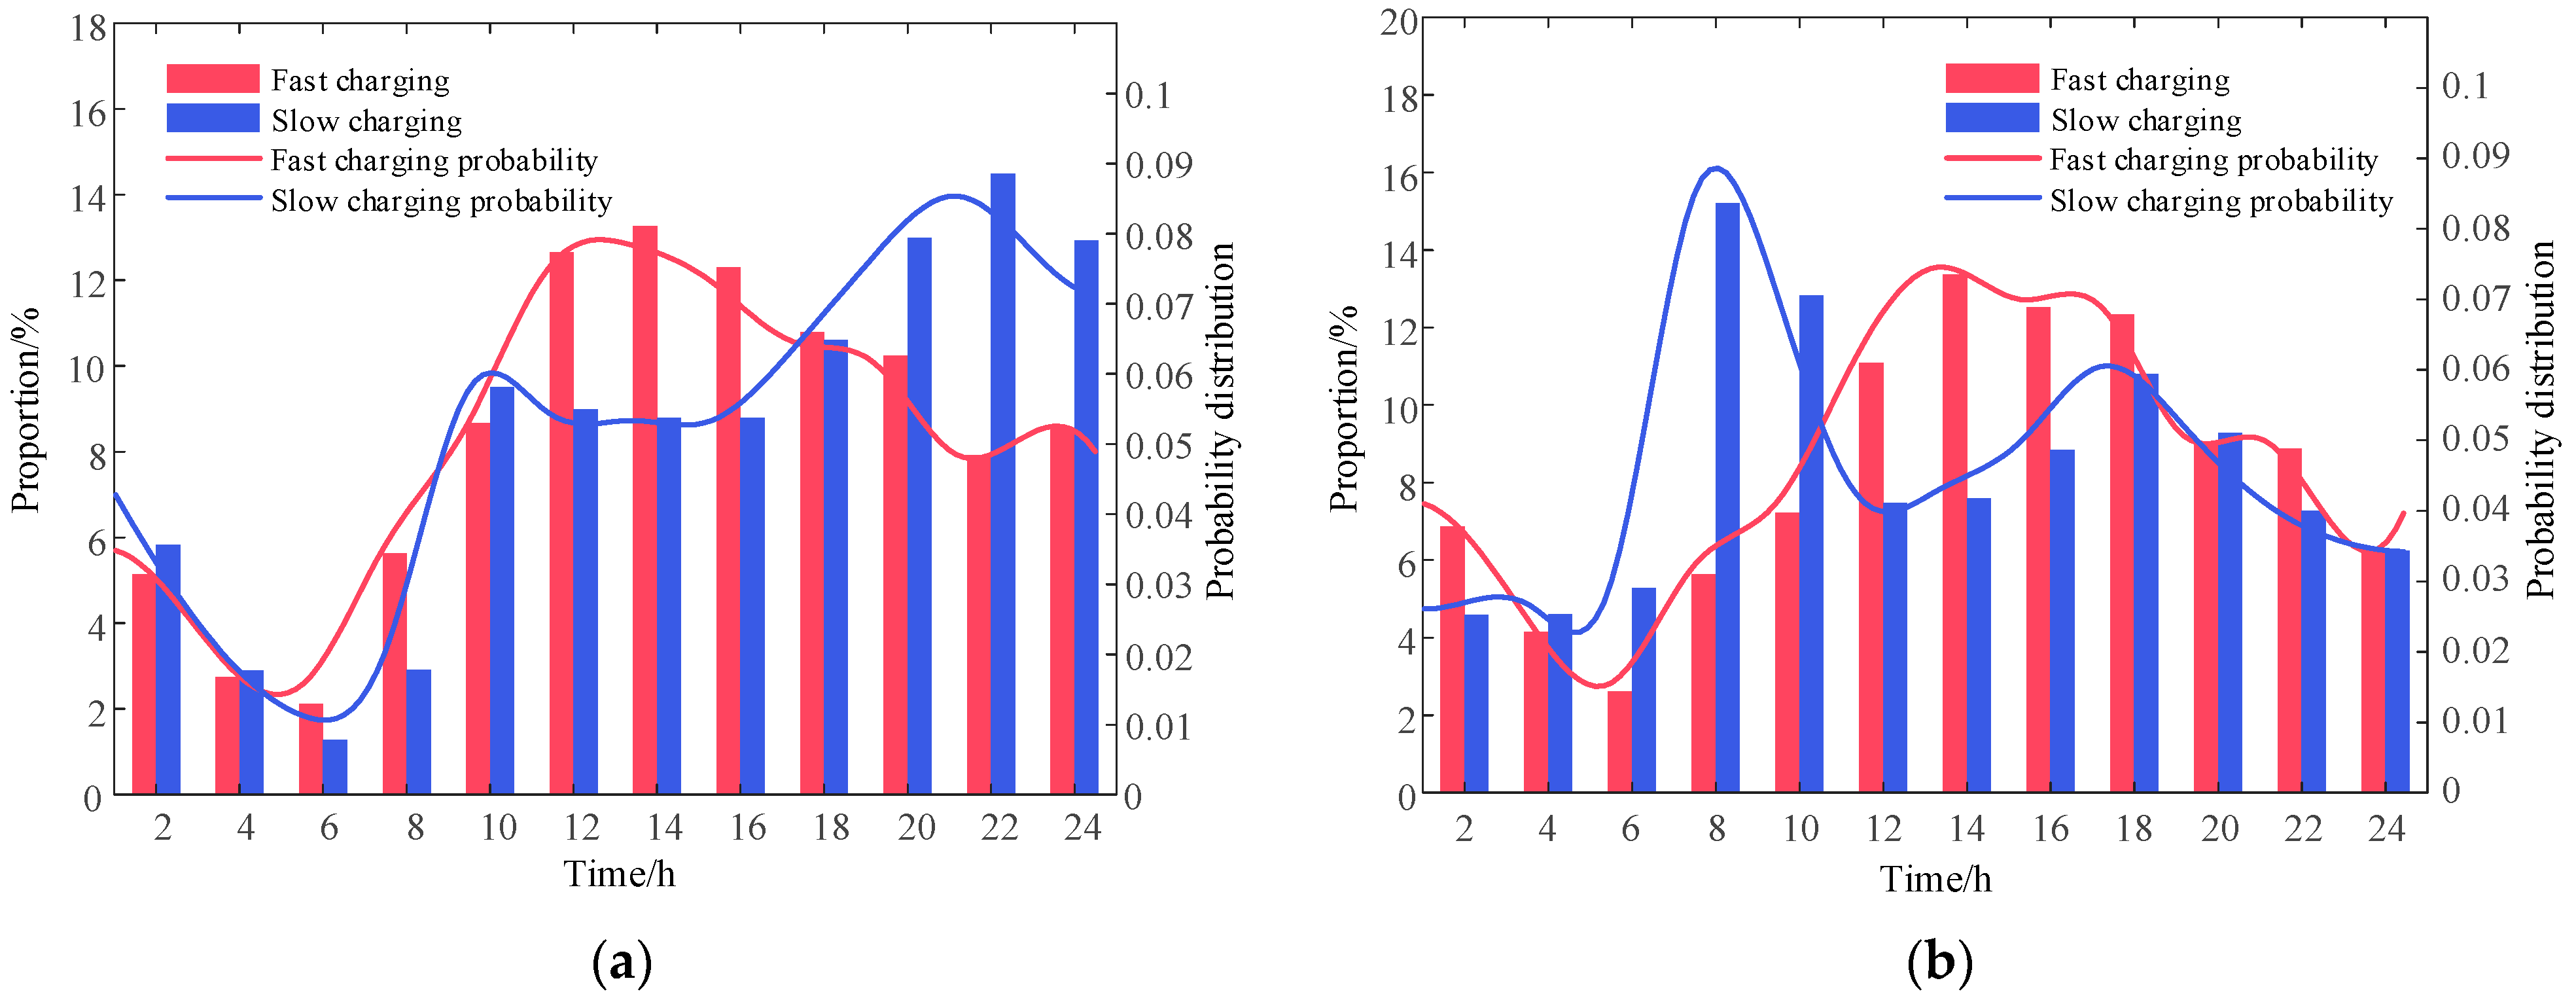
Figure 8 exhibits the charging time distributions of fast- and slow-charging users. It can be seen from Figure 8a that the charging peak of slow charging is mainly concentrated at 8:00–10:00 and 20:00–24:00, whereas fast charging is 10:00–16:00 during the day. Figure 8b demonstrates that slow-charging users mostly disconnect the charging at 6:00–8:00, and fast-charging users mainly finish charging at 10:00–18:00. Slow-charging users mostly choose to charge EVs when they arrive at the workplace in the morning or when the electricity price is lower in the evening and finish the charging during peak travel hours. There are widespread behaviors in which slow-charging users complete their charging tasks during the morning rush hour, accounting for 28.05% of the entire day. On the contrary, fast-charging users are concentrated in the daytime, and the finish time is shifted back by about 1 h from the start charging time.
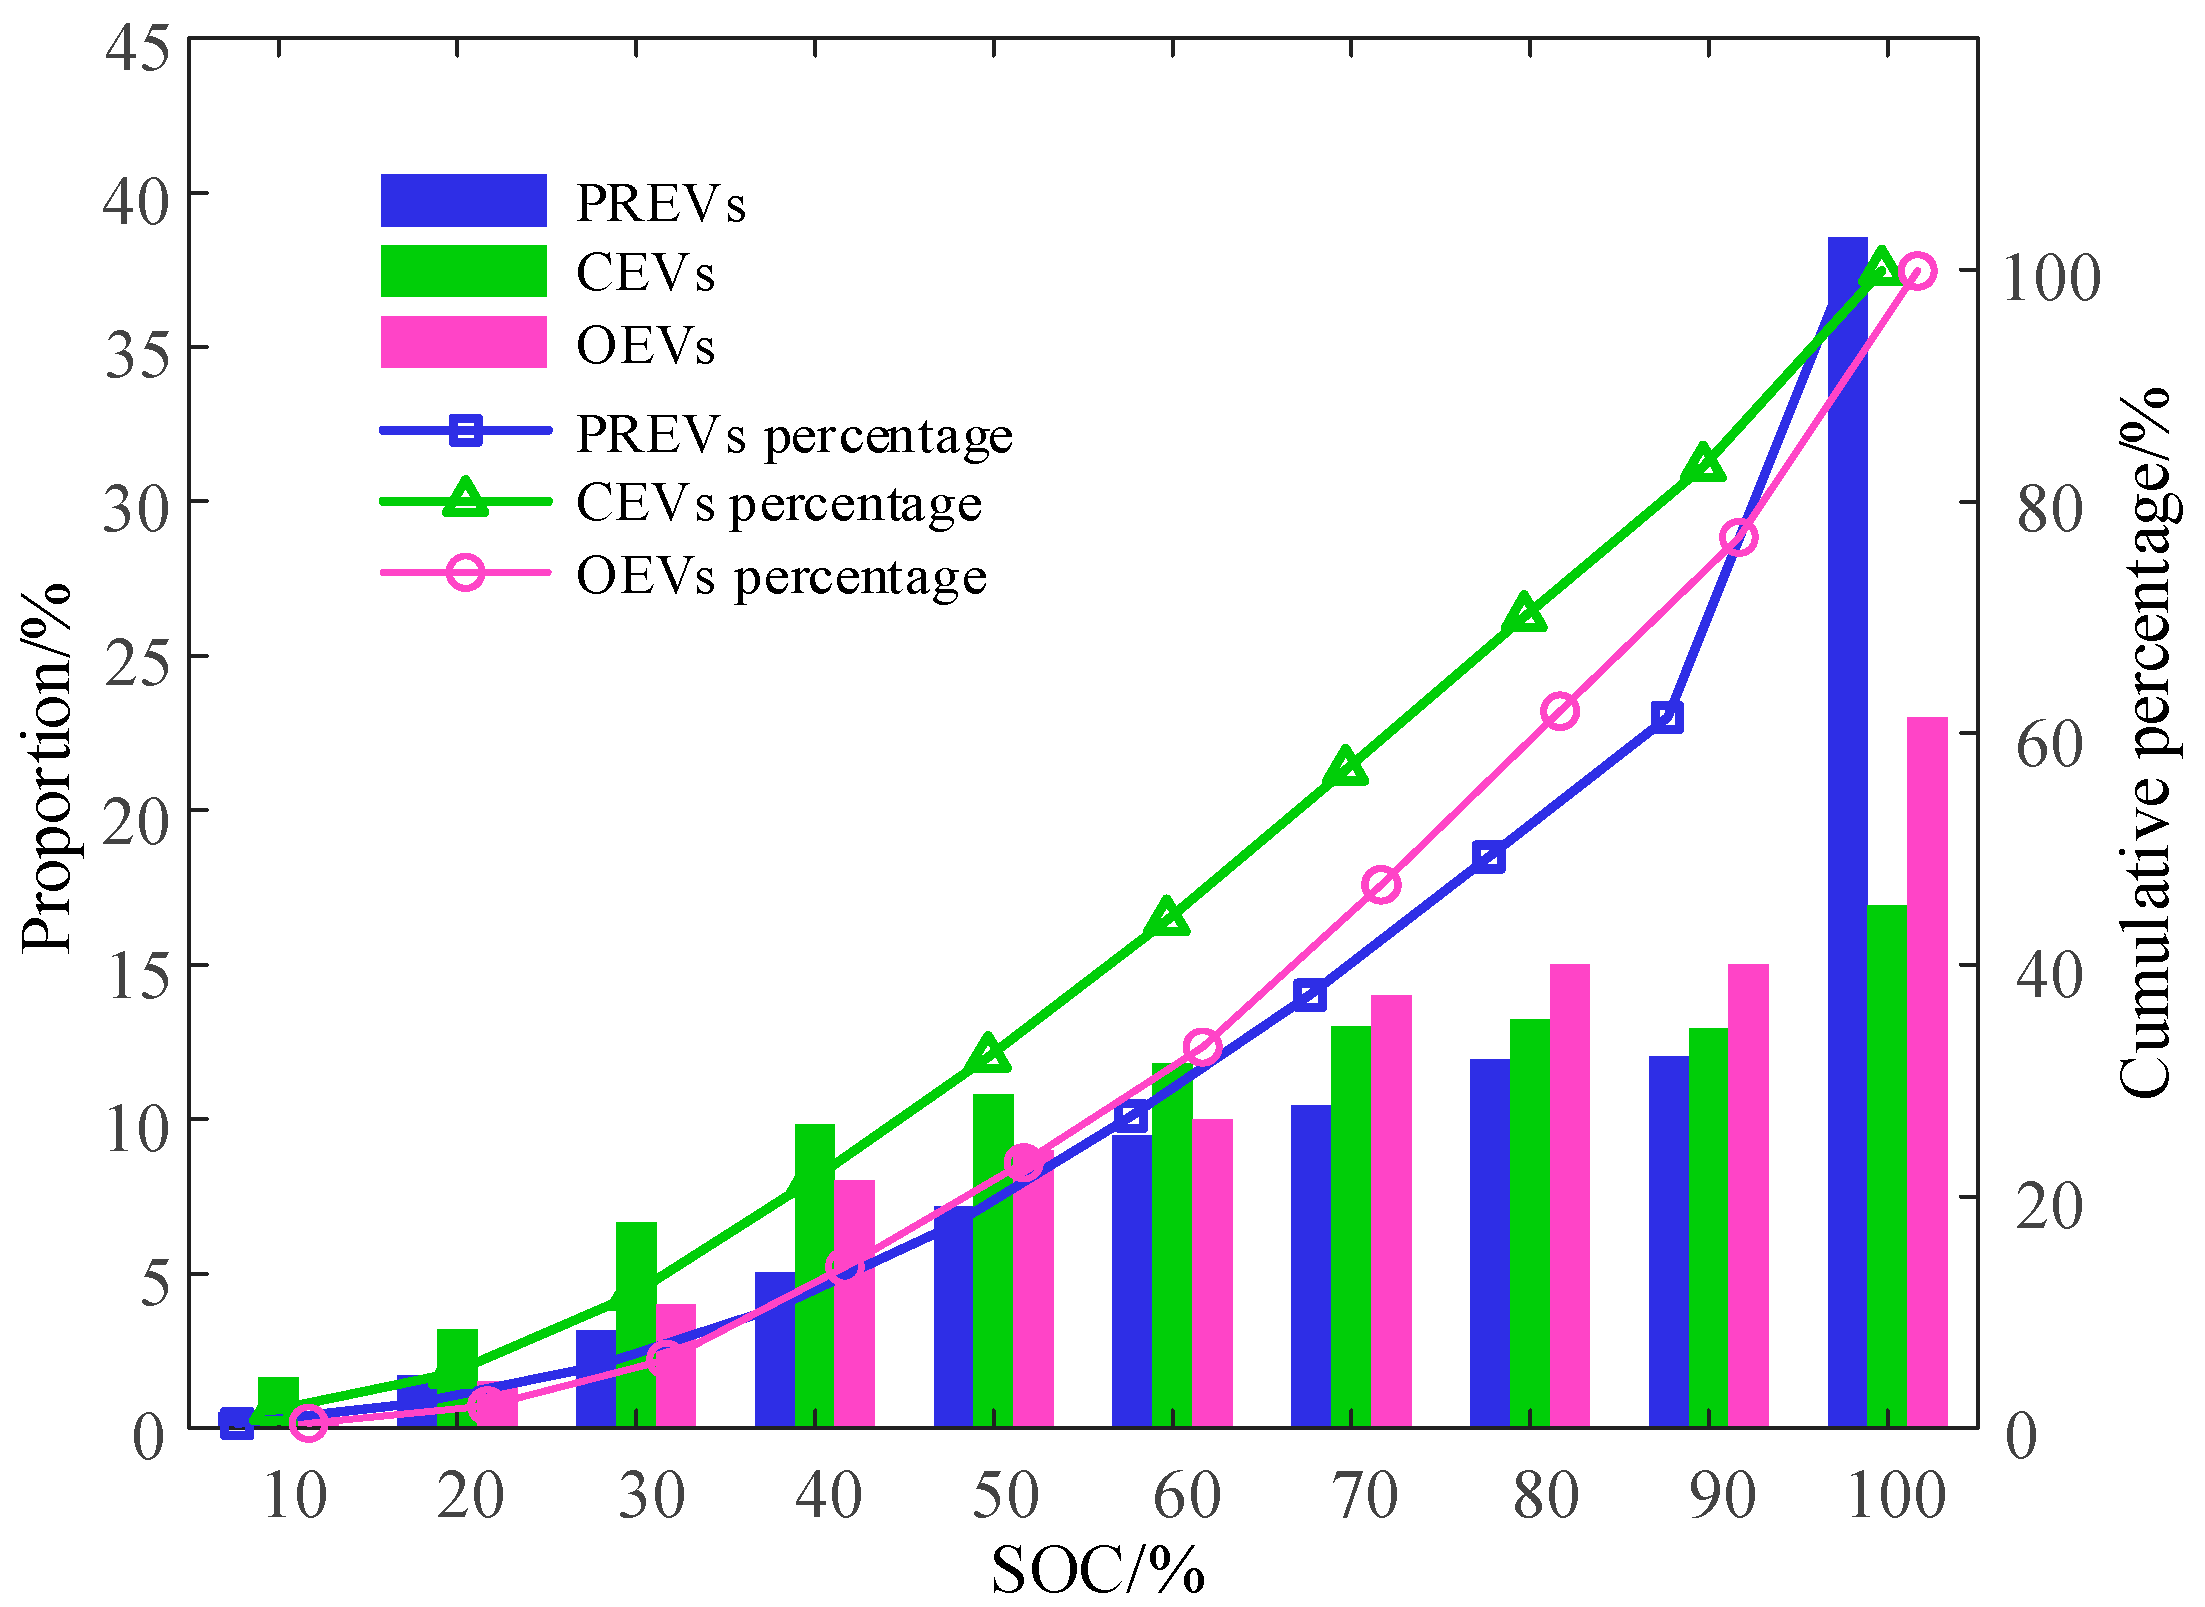
Furthermore, Figure 9 details the distributions of the first-trip SOC. The first-trip SOC of the three types of vehicles shows an increasing distribution trend, accounting for the largest proportion in the range of 90–100%. The trend of PREVs is the most significant, with SOC accounting for 38.55% in the range of 90–100%. The reason lies in the fact that PREV users often set off when the batteries are fully charged, and their travel attitude is more conservative. Considering the above analysis of slow-charging users, it is believed that the portraits of PREV users and slow-charging users are highly overlapped. As most CEVs implement a two-platoon plan, it is difficult for the vehicle to maintain a fully charged state when it first starts. The SOC accounts for only 16.92% in the range of 90–100%.

4.3. EV Vehicle Usage Characteristics

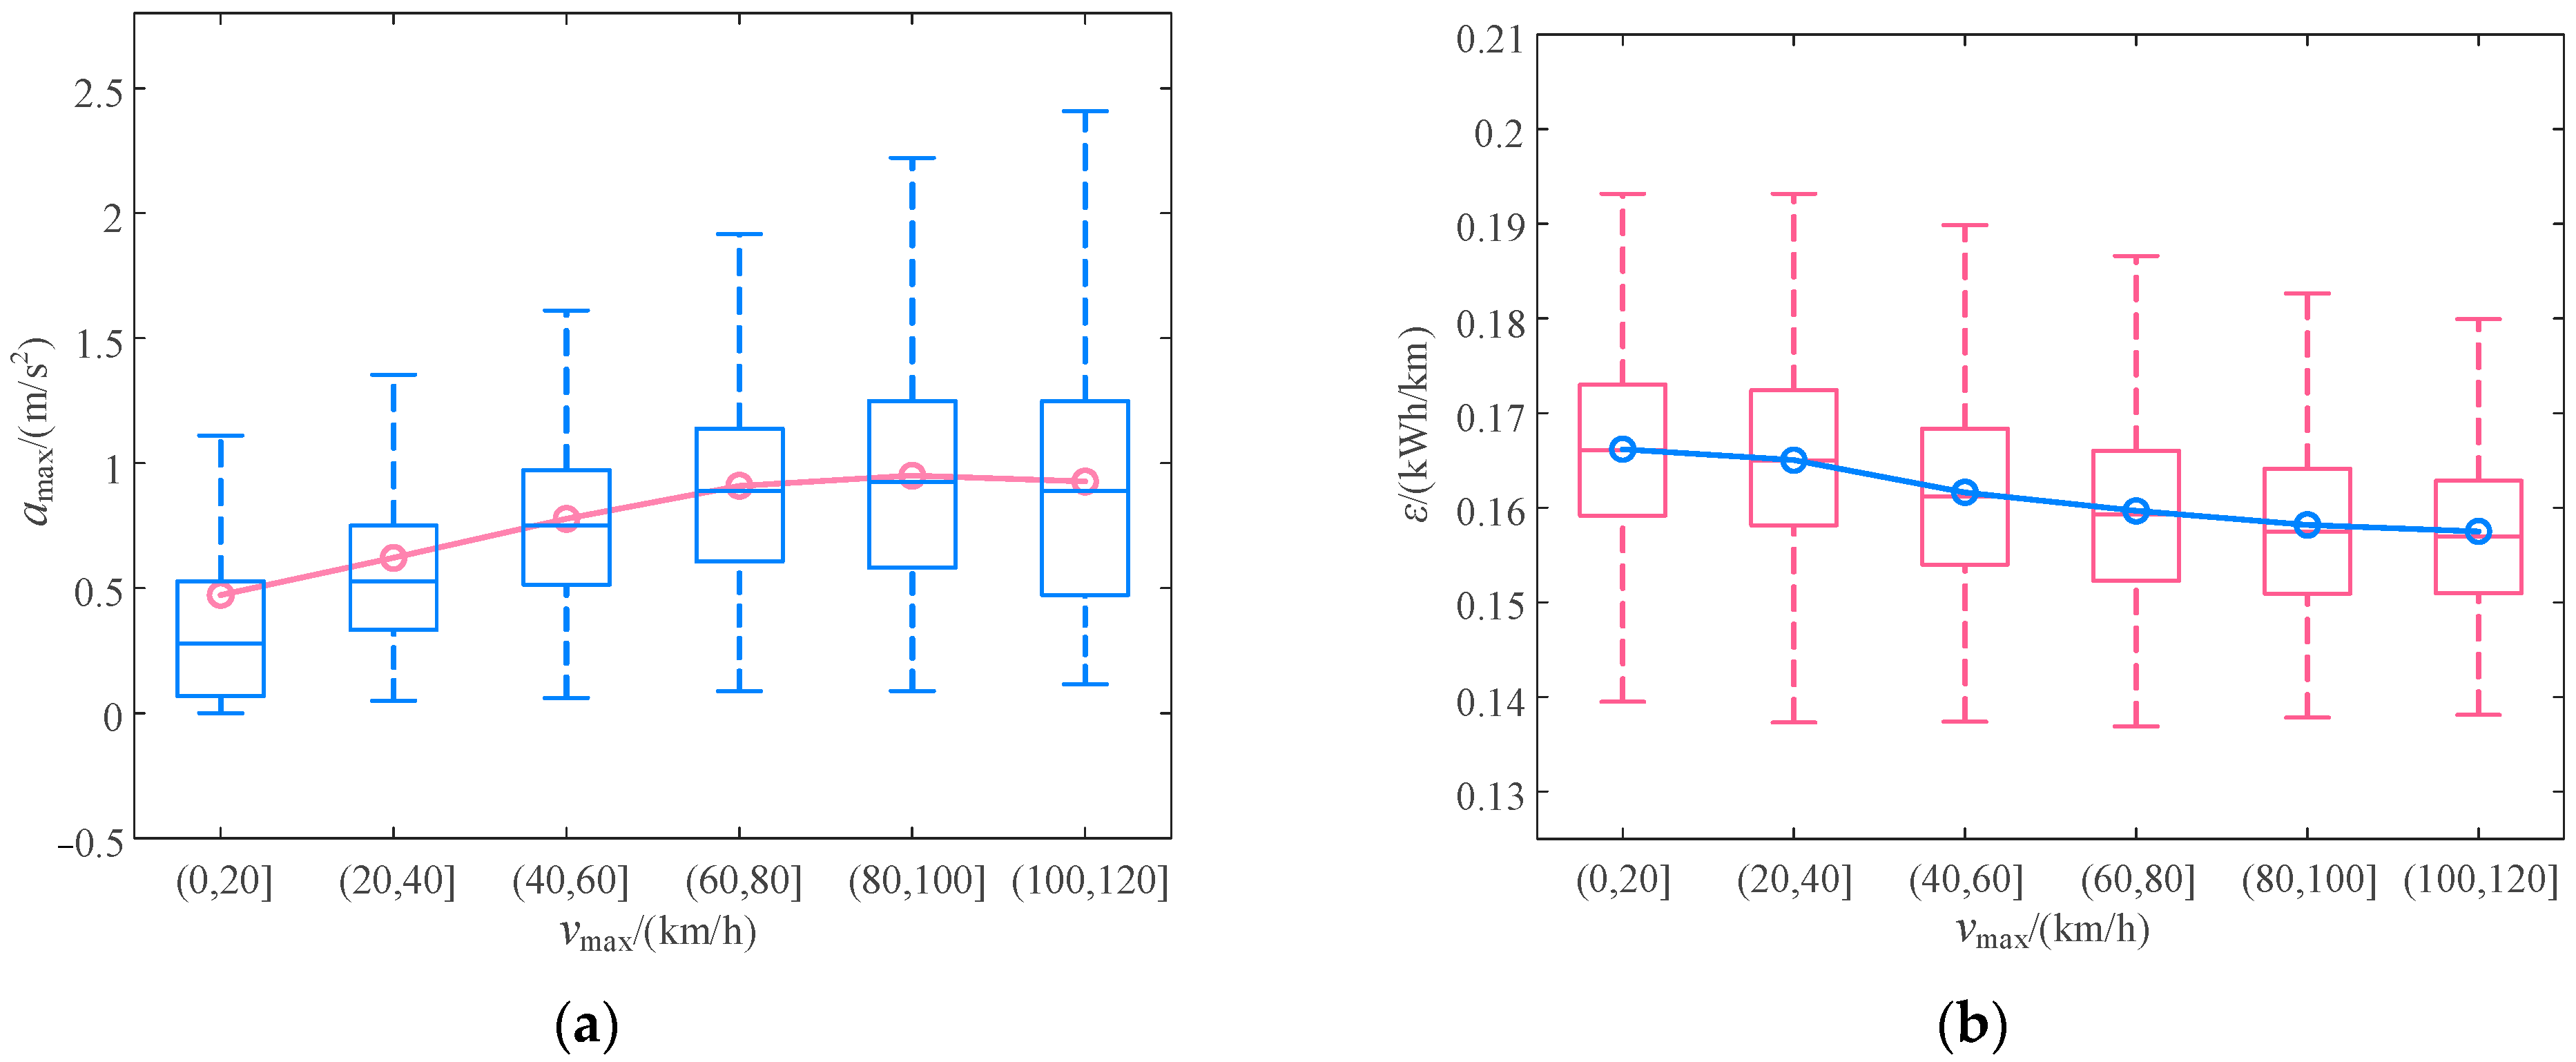
Taking maximum speed, maximum acceleration, and power consumption per unit mileage as the critical factors, Figure 10 depicts the statistical results of coupled traffic characteristics. As attested by Figure 10a, the maximum acceleration increases with the increase in the maximum speed and finally stabilizes at about 0.926 9 m/s2. It means that drivers traveling fast often take emergency braking or rapid acceleration (especially those near the upper maximum in the boxplot), which will significantly increase road traffic risks. On the contrary, as shown in Figure 10b, the power consumption per unit mileage decreases with the increase in the maximum speed and finally stabilizes at about 0.157 5 kWh/km. For each 20 km/h increase in the driving speed, the average energy consumption level will be reduced by 0.001 7 kWh/km. The results provide a quantitative reference for road management departments in weighing traffic safety and energy consumption levels.
Taking Nan’an District as an example to analyze the characteristics of the driving trajectory of EV users, the heat map of the trajectory passing through nodes 50 and 181 is shown in Figure 11. Furthermore, the established DBSCAN is used to cluster the driving routes at different times, and the clustering results are exhibited in Figure 12. The route clustering results of the three types of vehicles at different times all include route 1. Based on the Floyd algorithm, it is found that the length of route 1 is 3.6 km, which is the shortest route between nodes 50 and 181. Among the three types of EVs, the paths of OEVs are relatively fixed, followed by PREVs. Due to the unique operating mode of CEVs, their route selections are the most extensive. Regarding time distribution, drivers have more route choices during morning rush hours, whereas routes are more fixed during 14:00–16:00.
Furthermore, the charging preferences of different Evs are clustered, and the two most considerable clustering results of each type of vehicle are selected, as shown in Figure 13. The ratio of PREVs cluster 1 to cluster 2 is 0.37, and CEVs and OEVs are 2.89 and 0.44, respectively. It is worth noting that the fast- and slow-charging factors significantly impact the clustering results. Unlike PREVs and OEVs, CEVs cluster 1 accounts for the largest proportion, which means that CEV drivers have a greater demand for high-power fast chargers.

4.4. Effectiveness of Behavior Modeling

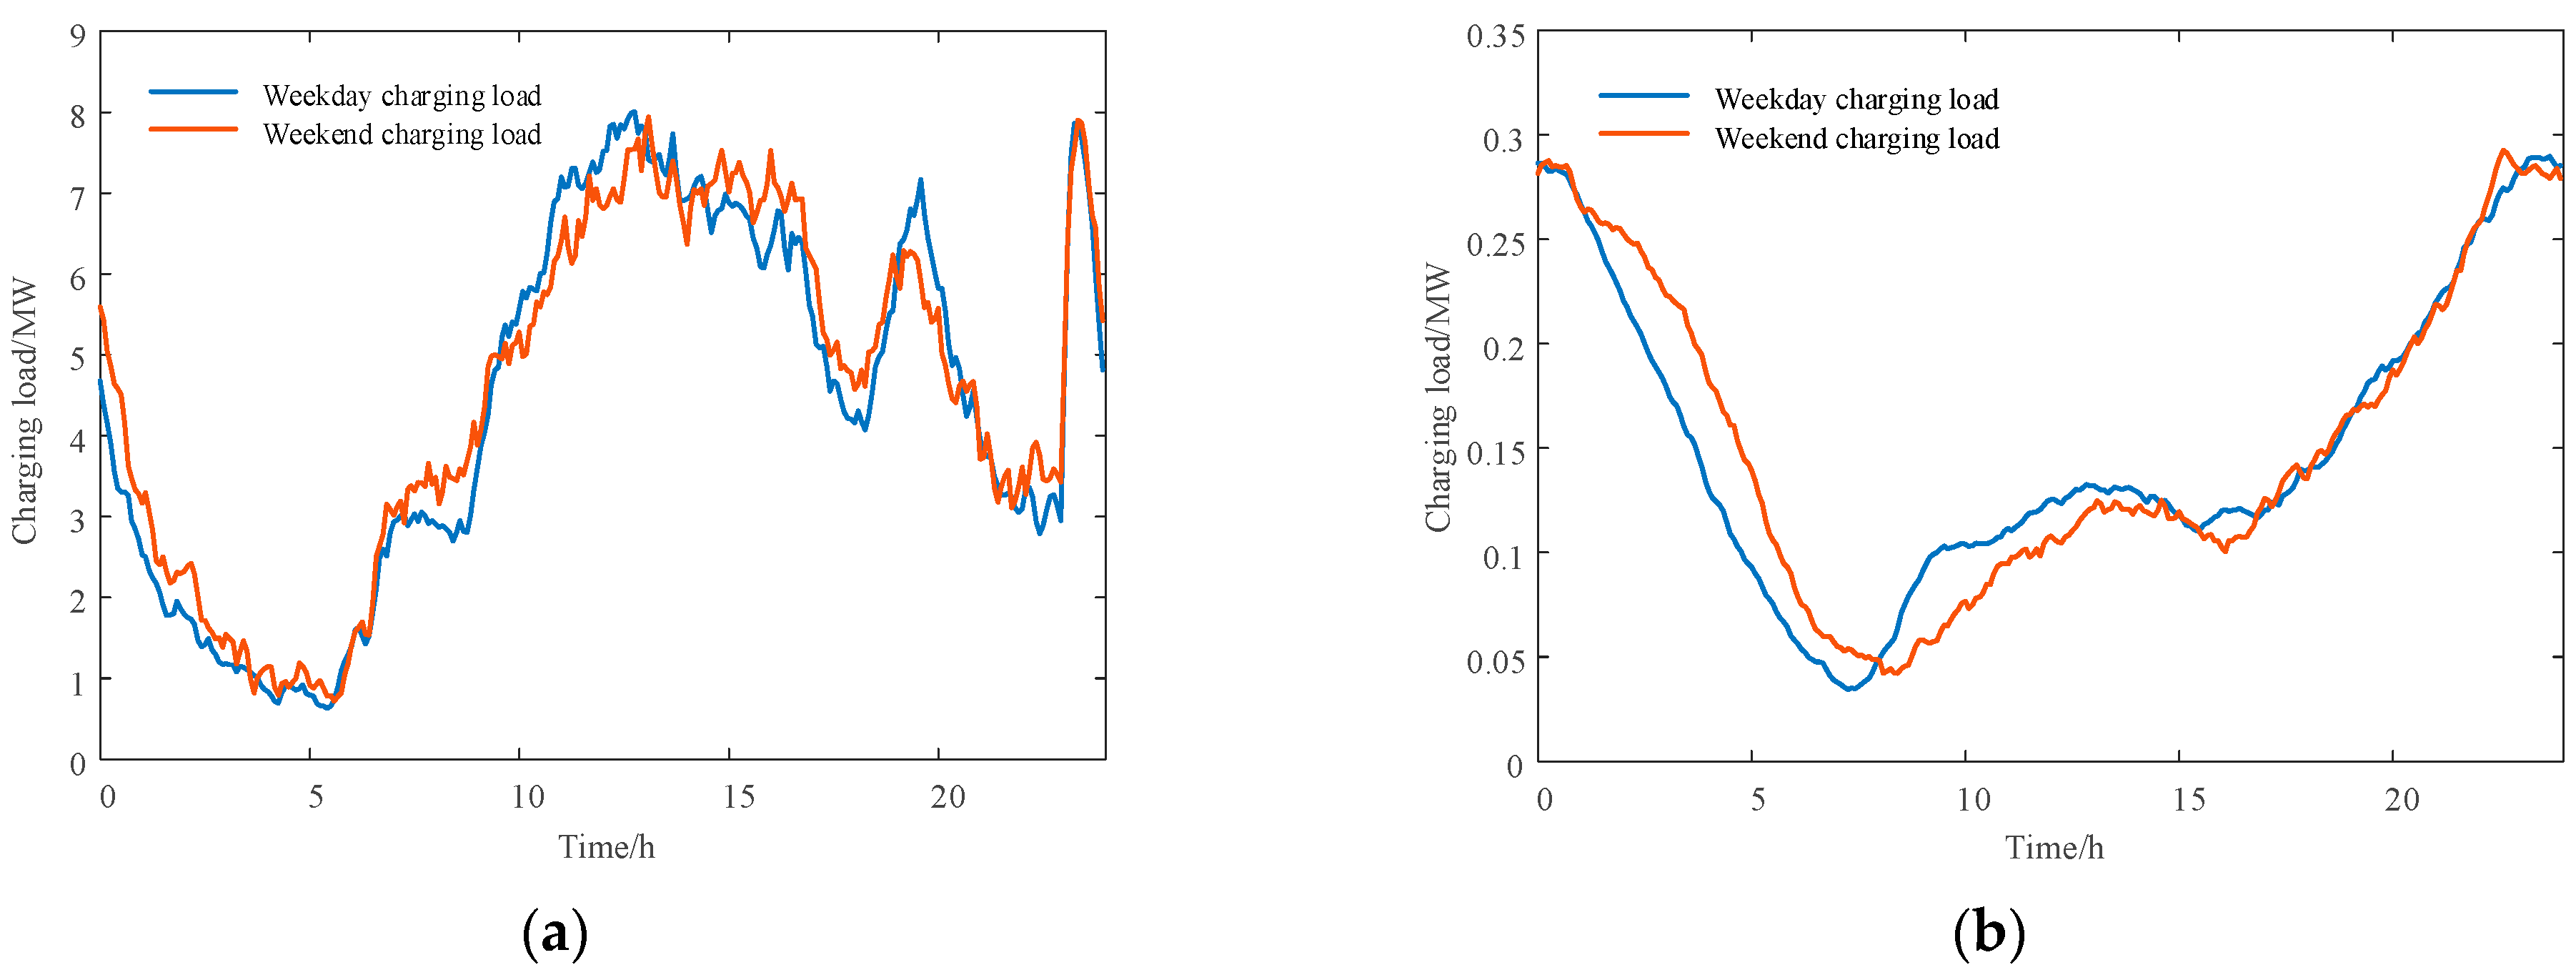
Finally, to verify the effectiveness of the proposed FDC-based model, we analyze the charging load and traffic flow from the two aspects of power grids and transportation networks. The time distributions of the charging load are shown in Figure 14. From Figure 14a, it can be found that the fast-charging load fluctuates obviously with the shape of three peaks and three valleys. The load peaks are at 13:00, 19:30, and 23:40, and the charging loads are 7.94 MW, 6.28 MW, and 7.87 MW, respectively. It is worth noting that the first two peak load periods are the noon where evening power consumption peaks, and the electricity prices are in the flat and peak periods, whereas 23:00–24:00 is the low-price period. The charging load increased rapidly after 23:00, mainly due to the lower charging electricity price. Compared with the fast-charging load, as shown in Figure 14b, the slow-charging load is mainly concentrated in the nighttime. The slow-charging load begins to grow at 18:00, reaches a peak of 0.29 MW at around 23:00, and then declines until the morning rush hour. In addition, since slow-charging users are mostly PREVs owners, the slow-charging load on weekdays significantly lags on weekends. The power trough occurs at around 8:15 on weekends and around 7:30 on weekdays. On the contrary, there is no significant difference between the fast charging load on weekdays and weekends.
Figure 15 details the spatial distribution of the EV charging load. Compared with different periods, the charging load exhibits spatial transfer characteristics. Specifically, from 8:00 to 9:00, the load is mainly concentrated in the industrial area, accounting for 38.45% of the total load. During 12:00–13:00, the load is mainly in the commercial area, and the industrial, commercial, and residential areas accounted for 32.17%, 43.75%, and 24.08%, respectively. In addition, consistent with popular travel areas, the charging load in Yuzhong District is significantly higher than that in other areas. At the same time, there is a higher charging demand near the intersection of subway lines in the Yubei District.
Finally, road Section 50–67 is taken as an example, and Figure 16 can be obtained by comparing the predicted results with the actual traffic flow [30]. Although the traffic flow distributions vary significantly on the three dates, the peak traffic flow is about 160 vehicles/5 min, representing the upper limit of the traffic-carrying capacity of the road section. On weekends, the morning and evening peaks are delayed by 2 h compared with that on weekdays. In contrast, the traffic demand in the afternoon of weekends and the morning of holidays is still high. Since traffic congestion is often accompanied by high pedestrian density and accident risk, road management departments should establish intelligent traffic management systems to alleviate traffic congestion and improve traffic efficiency through information sharing and integrated decision-making. It is worth noting that the distinct vehicle dynamics and characteristics between EVs and FVs are not considered [31]. Nevertheless, compared with the actual value of the traffic flow on this road section, the root mean square error of the proposed model under the three dates are 15.538, 13.690, and 12.293 vehicles/5 min, respectively, reflecting high prediction accuracy. It has guiding significance for urban road planning and traffic diversion.

5. Discussion

To fully exploit the comprehensive characteristics of EVs, this paper proposes a standardized and efficient FDC-based modeling method. The proposed method can effectively grasp the driving-charging process of different types of EVs and comprehensively describe the dynamic transfer characteristics of urban traffic flow and charging demand.
Our results provide a standardized and convenient way for the characteristics analysis of urban EVs. The travel time rules of EV drivers support the findings of Zhang et al. [18]. Furthermore, the inverse relationship between energy consumption and driving speed also supports the regression model proposed by Zou et al. [19]. Moreover, this research extends studies [14,17] by the finding that the low charging price will cause the peak charging load from 23:00 to 23:30, which is a potential problem that power supply companies should pay attention to.
Another promising finding is that our results demonstrate the possibility of closed-loop validation of data mining models. It is quite challenging to state the accuracy of data mining research [15], as most relevant articles follow an open-loop research route: data, modeling, and results analysis. However, through the analysis of the EV charging load and the comparison of road flow, the validity and applicability of the proposed model are verified in a closed loop.
A few limitations need to be addressed for future research. Firstly, this paper only obtained one month of EV data due to privacy issues, and more data helps with more detailed mining and verification. Secondly, it is necessary to perform a questionnaire survey to collect EV drivers’ preference parameters [23], so the influence of user psychological heterogeneity and other factors on the charging load can be deeply analyzed.

6. Conclusions

This paper proposes an FDC-based EV mining method. The validity of the method is verified by experiments on mining the driving, charging, and vehicle usage characteristics of multi-type EVs, and the conclusions are as follows:
  • Regarding driving characteristics, travel time distributions under different dates are unbalanced, with PREVs and CEVs being the most significant. The travel demand of CEVs on holidays is 19.51% higher than that on weekdays, whereas the demand of PREVs on holidays is 17.56% lower than that on weekdays. There are spatial shifts in travel hotspots at different times, and the transfer characteristics of residential and industrial areas are most apparent during the morning and evening travel peaks. In contrast, the commercial areas show high travel enthusiasm at all times of the day;
  • Regarding charging characteristics, fast-charging users primarily access charging during the daytime, whereas slow-charging users mostly choose to charge at night when the electricity price is lower and finish charging in the morning when they go to work. Slow-charging users who finish charging in the morning peak period accounted for 28.05%. Among the three types of vehicles, PREV users are more conservative about the battery level. They often stop charging and start their journey when the batteries are fully charged;
  • Regarding vehicle usage characteristics, we analyze the coupled traffic characteristics, route selection habits, and charging preferences. We believe that there is a negative correlation between road traffic safety and energy consumption level. Moreover, the results show that CEVs have the widest choice of routes, and they are also more inclined to choose fast charging, whereas PREVs and OEVs have relatively fixed route patterns, and they are more inclined to slow charging.
In brief, from the perspective of theoretical research, the results can provide a data source and user behavior model for smart charging control and electrified transportation system optimization. From the perspective of practical application, it gives a reference for the planning, operation, and management of power grids and transportation networks.

Author Contributions

Conceptualization, R.W. and Q.X.; methodology, R.W. and Q.X.; software, R.W.; validation, Z.C. and Z.Z.; formal analysis, R.W. and Q.X.; investigation, Z.C.; resources, Z.C.; data curation, B.L.; writing—original draft preparation, R.W. and Q.X.; writing—review and editing, Q.X., Z.Z. and B.L.; visualization, R.W.; supervision, Q.X.; project administration, Z.C. and Q.X.; funding acquisition, Z.C. All authors have read and agreed to the published version of the manuscript.

Funding

This research was funded by the National Natural Science Foundation of China (52077035).

Institutional Review Board Statement

Not applicable.

Informed Consent Statement

Not applicable.

Data Availability Statement

Not applicable.

Acknowledgments

The authors would like to thank the editor of this journal and the reviewers for their detailed and helpful comments.

Conflicts of Interest

The authors declare no conflict of interest.

References

  1. Ji, Z.; Huang, X. Plug-in electric vehicle charging infrastructure deployment of China towards 2020: Policies, methodologies, and challenges. Renew. Sustain. Energy Rev. 2018, 90, 710–727. [Google Scholar] [CrossRef]
  2. Xing, Q.; Chen, Z.; Zhang, Z.; Xu, X.; Zhang, T.; Huang, X.; Wang, H. Urban Electric Vehicle Fast-Charging Demand Forecasting Model Based on Data-Driven Approach and Human Decision-Making Behavior. Energies 2020, 13, 1412. [Google Scholar] [CrossRef] [Green Version]
  3. In 2020, There Are 33.28 Million Newly Registered Motor Vehicles in China, Including 4.92 Million New Energy Vehicles. Available online: https://app.mps.gov.cn/gdnps/pc/content.jsp?id=7647257 (accessed on 7 January 2021).
  4. International Energy Agency. Global EV Outlook 2021; International Energy Agency: Paris, France, 2021. [Google Scholar]
  5. Zhang, H.; Hu, Z.; Xu, Z.; Song, Y. An Integrated Planning Framework for Different Types of PEV Charging Facilities in Urban Area. IEEE Trans. Smart Grid 2016, 7, 2273–2284. [Google Scholar] [CrossRef]
  6. Infante, W.; Ma, J. Coordinated Management and Ratio Assessment of Electric Vehicle Charging Facilities. IEEE Trans. Ind. Appl. 2020, 56, 5955–5962. [Google Scholar] [CrossRef]
  7. Wang, J.; Bharati, G.R.; Paudyal, S.; Ceylan, O.; Bhattarai, B.P.; Myers, K.S. Coordinated Electric Vehicle Charging with Reactive Power Support to Distribution Grids. IEEE Trans. Ind. Inform. 2018, 15, 54–63. [Google Scholar] [CrossRef]
  8. Ji, C.; Yang, Q.; Ning, N.; Liu, Y.; Lyu, L. Mitigating Downward Reserve Deficiency of Power System via Coordinating EV Demand Response at Valley Period. IEEE Access 2020, 8, 112368–112378. [Google Scholar] [CrossRef]
  9. Chaudhari, K.S.; Kandasamy, N.K.; Krishnan, A.; Ukil, A.; Gooi, H.B. Agent-Based Aggregated Behavior Modeling for Electric Vehicle Charging Load. IEEE Trans. Ind. Inform. 2018, 15, 856–868. [Google Scholar] [CrossRef]
  10. Wang, M.; Ismail, M.; Zhang, R.; Shen, X.; Serpedin, E.; Qaraqe, K. Spatio-Temporal Coordinated V2V Energy Swapping Strategy for Mobile PEVs. IEEE Trans. Smart Grid 2018, 9, 1566–1579. [Google Scholar] [CrossRef]
  11. Pevec, D.; Babic, J.; Carvalho, A.; Ghiassi-Farrokhfal, Y.; Ketter, W.; Podobnik, V. A survey-based assessment of how existing and potential electric vehicle owners perceive range anxiety. J. Clean. Prod. 2020, 276, 122779. [Google Scholar] [CrossRef]
  12. Wang, Y.; Yao, E.; Pan, L. Electric vehicle drivers’ charging behavior analysis considering heterogeneity and satisfaction. J. Clean. Prod. 2021, 286, 124982. [Google Scholar] [CrossRef]
  13. Rautiainen, A.; Repo, S.; Jarventausta, P.; Mutanen, A.; Vuorilehto, K.; Jalkanen, K. Statistical Charging Load Modeling of PHEVs in Electricity Distribution Networks Using National Travel Survey Data. IEEE Trans. Smart Grid 2012, 3, 1650–1659. [Google Scholar] [CrossRef]
  14. Xia, Y.; Hu, B.; Xie, K.; Tang, J.; Tai, H.-M. An EV Charging Demand Model for the Distribution System Using Traffic Property. IEEE Access 2019, 7, 28089–28099. [Google Scholar] [CrossRef]
  15. Hilton, G.; Kiaee, M.; Bryden, T.; Dimitrov, B.; Cruden, A.; Mortimer, A. A Stochastic Method for Prediction of the Power Demand at High Rate EV Chargers. IEEE Trans. Transp. Electrif. 2018, 4, 744–756. [Google Scholar] [CrossRef] [Green Version]
  16. Arias, M.B.; Bae, S. Electric vehicle charging demand forecasting model based on big data technologies. Appl. Energy 2016, 183, 327–339. [Google Scholar] [CrossRef]
  17. Li, M.; Jia, Y.H.; Shen, Z.J.; He, F. Improving the electrification rate of the vehicle miles traveled in Beijing: A data-driven approach. Transp. Res. Part A Policy Pract. 2017, 97, 106–120. [Google Scholar] [CrossRef]
  18. Zhang, X.; Zou, Y.; Fan, J.; Guo, H. Usage pattern analysis of Beijing private electric vehicles based on real-world data. Energy 2019, 167, 1074–1085. [Google Scholar] [CrossRef]
  19. Zou, Y.; Wei, S.; Sun, F.; Hu, X.; Shiao, Y. Large-scale deployment of electric taxis in Beijing: A real-world analysis. Energy 2016, 100, 25–39. [Google Scholar] [CrossRef]
  20. Yang, T.; Xu, X.; Guo, Q.; Zhang, L.; Sun, H. EV charging behaviour analysis and modelling based on mobile crowdsensing data. IET Gener. Transm. Distrib. 2017, 11, 1683–1691. [Google Scholar] [CrossRef]
  21. Fieltsch, P.; Flämig, H.; Rosenberger, K. Analysis of charging behavior when using battery electric vehicles in commercial transport. Transp. Res. Procedia 2020, 46, 181–188. [Google Scholar] [CrossRef]
  22. Sun, X.-H.; Yamamoto, T.; Morikawa, T. Fast-charging station choice behavior among battery electric vehicle users. Transp. Res. Part D Transp. Environ. 2016, 46, 26–39. [Google Scholar] [CrossRef]
  23. Ashkrof, P.; Homem de Almeida Correia, G.; van Arem, B. Analysis of the effect of charging needs on battery electric vehicle drivers’ route choice behaviour: A case study in the Netherlands. Transp. Res. Part D Transp. Environ. 2020, 78, 102206. [Google Scholar] [CrossRef]
  24. Zhang, B.; Niu, N.; Li, H.; Wang, Z.; He, W. Could fast battery charging effectively mitigate range anxiety in electric vehicle usage? Evidence from large-scale data on travel and charging in Beijing. Transp. Res. Part D Transp. Environ. 2021, 95, 102840. [Google Scholar] [CrossRef]
  25. Fan, J.; Fu, C.; Stewart, K.; Zhang, L. Using big GPS trajectory data analytics for vehicle miles traveled estimation. Transp. Res. Part C Emerg. Technol. 2019, 103, 298–307. [Google Scholar] [CrossRef]
  26. Ko, J.; Guensler, R.; Hunter, M. Analysis of effects of driver/vehicle characteristics on acceleration noise using GPS-equipped vehicles. Transp. Res. Part F Traffic Psychol. Behav. 2010, 13, 21–31. [Google Scholar] [CrossRef]
  27. Jia, Y. Short-Term Demand Forecasting of Network Car Based on Spatio-Temporal Feature Analysis. Master’s Thesis, Beijing Jiaotong University, Beijing, China, 2019. [Google Scholar]
  28. Chi, J.; Jiao, L.; Dong, T.; Gu, Y.; Ma, Y. Quantitative identification and visualization of urban functional area based on POI data. J. Geomat. 2016, 41, 68–73. [Google Scholar] [CrossRef]
  29. Yang, T. Study on Reckoning the Section Traffic Flow on the Basis of the Technology of Probe Car. Master’s Thesis, Beijing Jiaotong University, Beijing, China, 2006. [Google Scholar]
  30. Lin, X.; Liu, T.; Wang, Z. Annual Report on Green Development of China’s Urban Transportation; Social Science Literature Press: Beijing, China, 2019. [Google Scholar]
  31. Xu, Y.; Zheng, Y.; Yang, Y. On the movement simulations of electric vehicles: A behavioral model-based approach. Appl. Energy 2021, 283, 116356. [Google Scholar] [CrossRef]
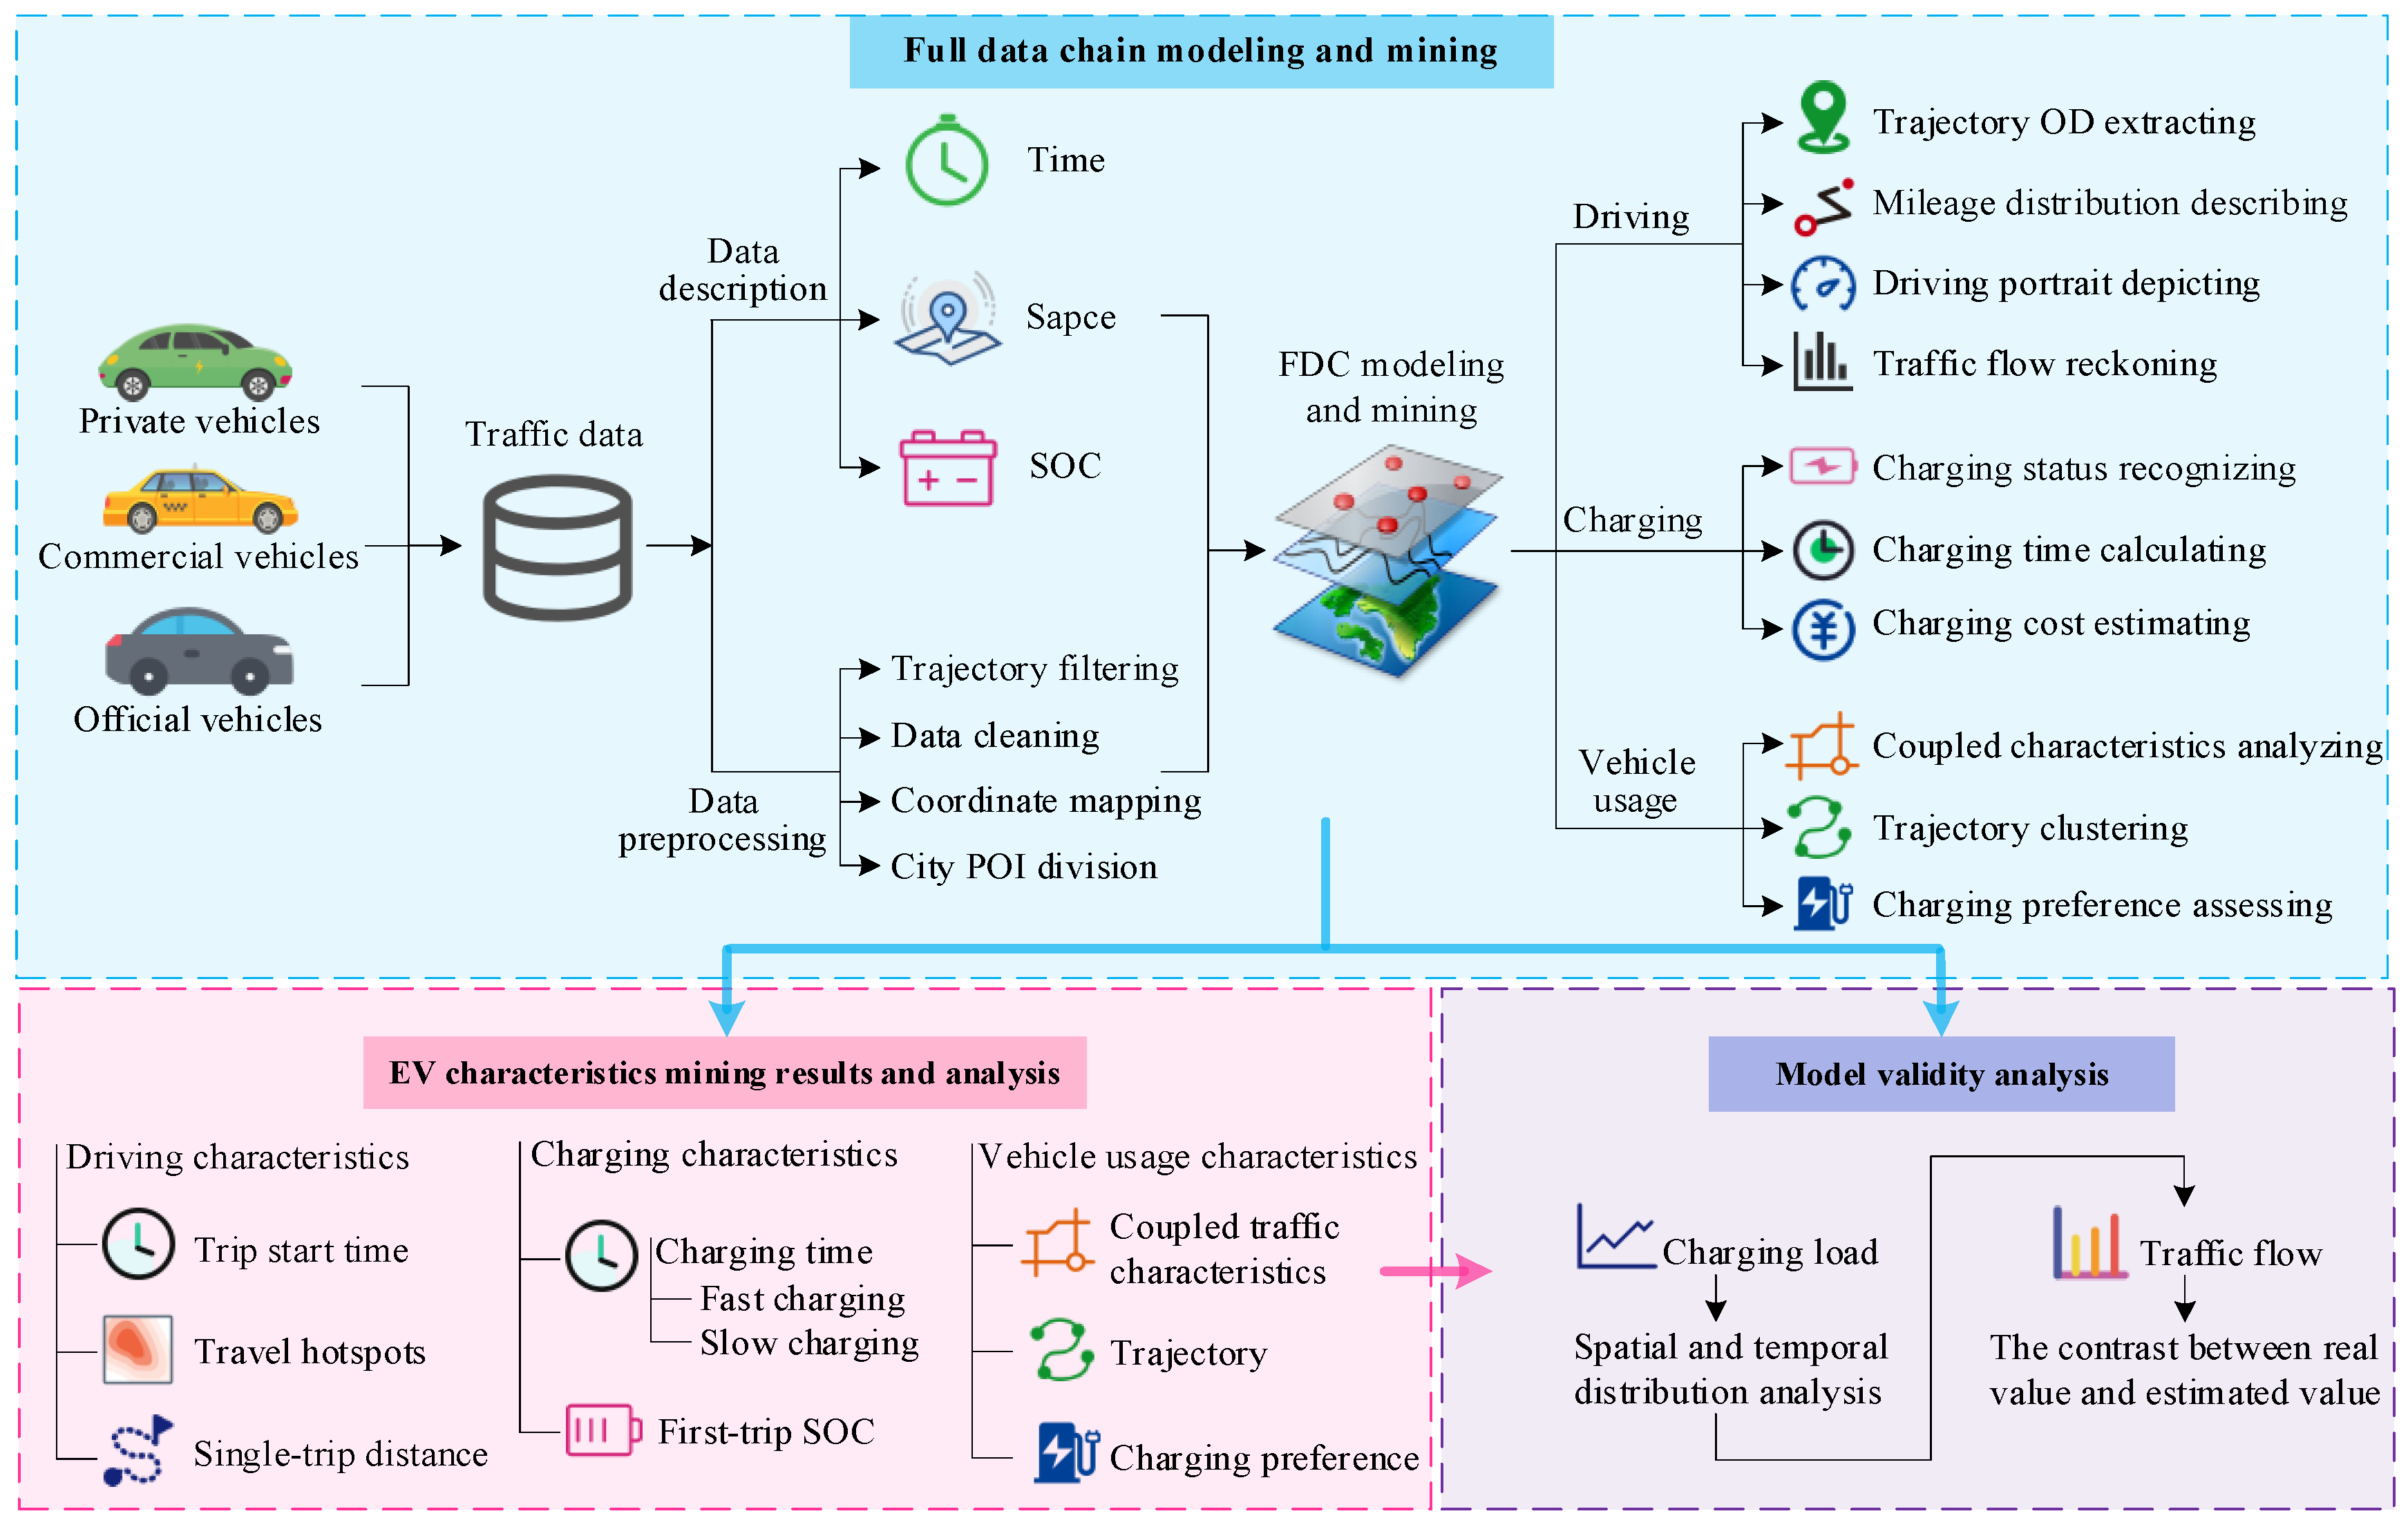
Figure 1. Architecture of the FDC-based EV modeling and analysis.
Sustainability 14 08600 g001
Figure 2. The FDC of EV user from the perspective of time, space, and energy.
Sustainability 14 08600 g002
Figure 3. Classification results of urban POI functional areas.
Sustainability 14 08600 g003
Figure 4. Schematic diagram of the EV charging states recognition.
Sustainability 14 08600 g004
Figure 5. Departure time distributions of different EVs. (a) Departure time of PREVs; (b) Departure time of CEVs; (c) Departure time of OEVs.
Sustainability 14 08600 g005
Figure 6. Travel hotspot distributions on weekdays. (a) Departure hotspots from 8:00 to 9:00; (b) Departure hotspots from 12:00 to 13:00; (c) Departure hotspots from 17:00 to 18:00; (d) Arrival hotspots from 8:00 to 9:00; (e) Arrival hotspots from 12:00 to 13:00; (f) Arrival hotspots from 17:00 to 18:00.
Sustainability 14 08600 g006
Figure 7. Single-trip mileage of different EV users.
Sustainability 14 08600 g007
Figure 8. Charging time distributions of EV users. (a) Start charging time of EV users; (b) Finish charging time of EV users.
Sustainability 14 08600 g008
Figure 9. First-trip SOC of different EV users.
Sustainability 14 08600 g009
Figure 10. Statistical results of coupled traffic characteristics. (a) Relationship between maximum acceleration and maximum speed; (b) Relationship between power consumption per unit mileage and maximum speed.
Sustainability 14 08600 g010
Figure 11. Travel route clustering result (node 50–181).
Sustainability 14 08600 g011
Figure 12. Route clustering results in different scenarios. (a) Route clustering results from 7:00 to 9:00; (b) Route clustering results from 14:00 to 16:00.
Sustainability 14 08600 g012
Figure 13. Charging preferences of different EV users. (a) Clustering results of PREV users; (b) Clustering results of CEV users; (c) Clustering results of OEV users.
Sustainability 14 08600 g013
Figure 14. Time distributions of fast and slow charging load. (a) Charging load distribution of fast-charging users; (b) Charging load distribution of slow-charging users.
Sustainability 14 08600 g014
Figure 15. Spatial distributions of charging load at different times. (a) Charging load distribution from 8:00 to 9:00; (b) Charging load distribution from 12:00 to 13:00; (c) Charging load distribution from 17:00 to 18:00.
Sustainability 14 08600 g015
Figure 16. Comparison of traffic flow on different days (road 50–67). (a) Comparison of traffic flow on weekday; (b) Comparison of traffic flow on weekend; (c) Comparison of traffic flow on holiday.
Sustainability 14 08600 g016
Table 1. Description of data set format.
Field NameField TypeField Description
Vehicle numberVarcharDesensitized anonymous coding
Instant timeDatatimeFormat: yyyy-mm-dd hh:mm:ss
Instant SOCIntegerFormat: dd, unit: %
Instant coordinatesDoubleFormat: dd.dddd, dd.dddd, WGS-84
Publisher’s Note: MDPI stays neutral with regard to jurisdictional claims in published maps and institutional affiliations.