1. Introduction
Although social sustainability is one of the three pillars of sustainable development, it receives less attention than the other dimensions: environmental and economic [
1,
2,
3]. Failure to consider social aspects during construction is associated with a series of risks that can compromise the project’s results in the medium term and generate side effects that could jeopardize the quality of life for future generations [
4,
5,
6]. In a study by Li et al. (2019), the authors questioned the original design of the construction project precisely because of the relatively low level of social sustainability [
7].
Although interest in research on social sustainability indicators has lagged behind economic and environmental sustainability indicators, many studies have been conducted to understand these indicators better in the past decade [
6,
7,
8,
9,
10,
11,
12,
13]. Many of these studies address the indicators from unique perspectives [
9,
10,
14,
15,
16,
17,
18,
19,
20,
21]. Finding a consensus among all construction stakeholders on sustainability indicators has been challenging [
22]. Therefore, the need for an internationally consolidated mechanism is evident in making temporal and geographical comparisons between different organizations.
The Global Reporting Initiative (GRI) is an international non-governmental organization whose mission is to develop and globally disseminate guidelines for preparing sustainability reports to be used voluntarily by companies worldwide [
23]. The GRI Sustainability Reporting Standards (GRI Standards) are designed to be used by organizations to report their economic, environmental, and social impacts. They are organized as interrelated standards that help a company prepare a sustainability report based on the reporting principles and focused on relevant topics [
24].
The interest in social sustainability indicators in Brazil has grown recently. However, few studies have been conducted on construction companies’ application and adherence to these indicators. To better understand this situation, a series of interviews, documental analysis, site visit, and data validation were performed to evaluate the familiarity of construction companies with the social sustainability dimension and its respective GRI indicators. In addition, the interviews gathered information regarding the GRI social indicators already collected by Brazilian construction companies, those indicators that could be collected according to the point-of-view of the construction administrators, and the level of effort required for such collection. Based on the analysis of this information, the study suggests prioritizing social indicators based on their levels of importance and influence.
In the following sections, relevant studies that contributed to the discussion of the social aspect of sustainability are presented, along with the social sustainability indicators selected for the study. Subsequently, the multi-case methodology is presented, which makes it possible to identify how companies perceive the social aspects of sustainability, as well as which social sustainability indicators are and can be applied in the context of the construction sector.
2. How Is Social Sustainability Being Evaluated?
According to Kaplan and Norton (1997), it is necessary to incorporate other non-financial indicators with the traditional financial indicators to measure a company’s intangible assets, such as customer satisfaction, customer retention level, or employee motivation [
25]. To encourage the use of social sustainability indicators, Savitz and Weber (2007) found out that, on many occasions, sustainability decisions result in an economically positive result for the business and the public, creating a win–win relationship. In these situations, companies are much more likely to implement sustainability measures [
26]. However, socio-environmental initiatives are not always associated with performance and economic reward in the short or medium term. For instance, when companies do not receive an immediate financial incentive to reward sustainable decisions, other intangible aspects must be considered, such as company leverage, company size, profit and sales, investment levels, advertising intensity, and multinationalism [
26].
In the past decade, multiple studies have focused on conceptualizing social sustainability indicators [
12,
14,
27,
28,
29,
30,
31,
32]. Valdes-Vasquez and Klotz (2012) mapped 50 processes that influence social sustainability, improved decision-making for the formation of the design team, and considerations for the end-user [
12]. More recently, several studies have been looking for ways to assess social sustainability in construction projects less subjectively [
9,
10,
14,
15,
16,
17,
18,
19]. A study by Dong and Ng (2015) used the Life Cycle Analysis (LCA) method for building construction projects in Hong Kong [
7]. In this study, worker health and safety were the most important social aspects. Sierra et al. also used a similar LCA methodology to assess social sustainability in public infrastructure in Chile [
6]. They identified stakeholder participation as the most relevant aspect of the demolition and design phases, local communities as the most relevant in the design phase, and human resources in the construction phase.
Morioka and Carvalho (2016) explored the factors that affected the interaction between sustainability indicators, including their relative priorities for decision-making [
16]. Specifically, they analyzed how companies incorporate them into their performance measurement systems. However, these authors noted that the processes used by most companies have still not been integrated with strategic maps and value creation, which keeps the sustainability indicators separate from the company’s performance measurement systems.
A study by Montalbán-Domingo et al. (2018) characterizes the current scenario of public procurement concerning the encouragement and facilitation of the inclusion of social criteria [
15]. These researchers also linked social sustainability to several benefits, including improved quality of life, transparency, skills training, equity, fair distribution of social construction costs, and enhanced capacity for disadvantaged people. However, the study found that there is still a need for public policies to promote social criteria.
Furthermore, a study by Kerscher and Schaefers (2015) concluded that corporate social responsibility (CSR) positively influences a corporation’s financial aspects, which is different from the traditional neoclassical idea [
33]. However, compared to the other dimensions of sustainability, the social dimension has some limitations, such as social and cultural heterogeneity, leading to an inevitable divergence in the measurement criteria. In addition, estimating social sustainability requires qualitative aspects [
10]. Because most of these studies are so recent, the perception and applicability of these concepts and social sustainability indicators are unknown. Therefore, this study focuses on the construction context in a developing country such as Brazil.
3. Materials and Methods
Specifically, this study was carried out in Pernambuco, a Brazilian state with almost 10 million inhabitants, with more than 40% living in the Recife Metropolitan Area [
34]. Similar to other states in developing countries, Pernambuco’s Gross Domestic Product is linked to the construction market [
35]. Northeastern Brazil is the second most populous region in Brazil. The Recife Metropolitan Area was studied because it is one of the wealthiest regions of the north, with a service-based economy that has seen an influx of large companies in the construction sector. The Recife Metropolitan Area has around 4.055 million inhabitants. This area is the central core of the economy, representing 35% of the northeastern Brazilian GDP, concentrated within a 300-km arc around the Pernambucan capital containing a sizeable regional consumer market [
36]. In 2010, Recife’s Municipal Human Development Index (HDI) was 0.77, the highest among northeastern capitals. This value places it in the high HDI category (between 0.700 and 0.799). In 2010, Recife ranked 210th among the 5565 municipalities in Brazil [
37].
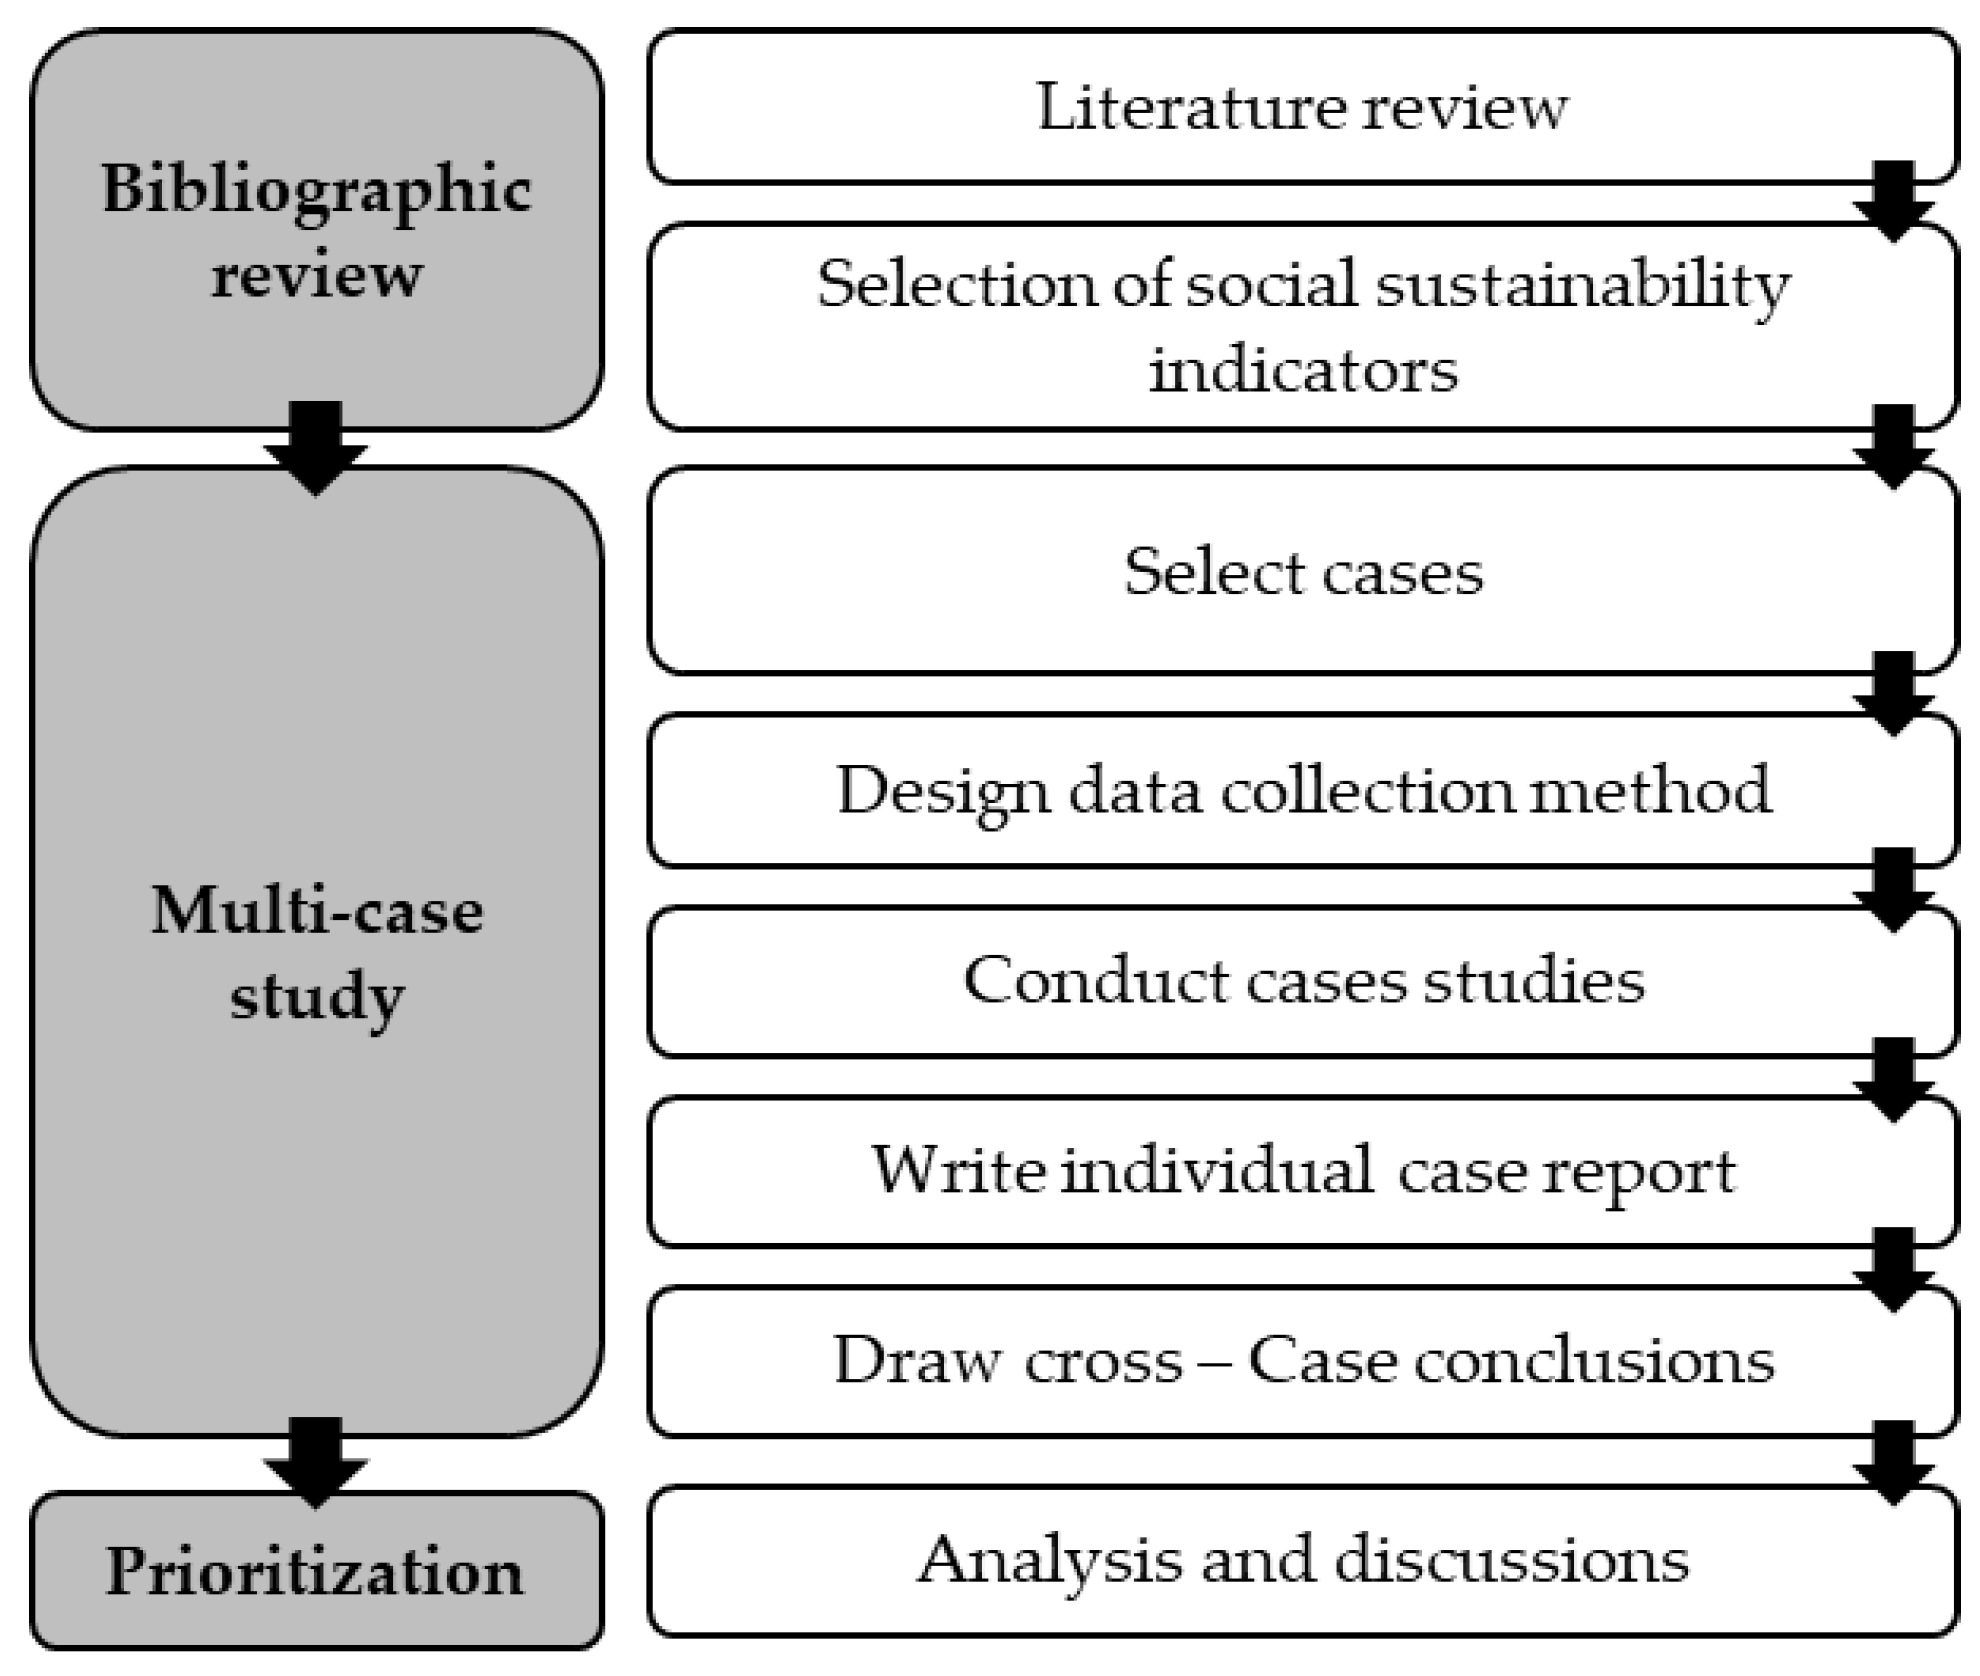
This study used a multi-case-study approach to identify social sustainability indicators applicable to large and medium-sized construction companies in the Recife Metropolitan Area. Specifically, the following steps were included in this study: literature review, selection of social sustainability indicators, case selection, elaboration of data collection instruments, data collection and verification, cross-case conclusions, and analysis and interpretation of data [
38].
Figure 1 shows the study’s workflow.
Social sustainability has been referred to as a “concept in chaos” due to the lack of a clear, standardized, and comprehensive conceptualization [
39]. Therefore, the social sustainability indicators of the Global Reporting Initiative were selected because they present a wide range of social sustainability aspects (19 categories), besides being a globally recognized and disseminated organization.
Appendix A lists the GRI social sustainability indicators selected to compare this research with other studies worldwide. The GRI Standards for social sustainability consist of 40 indicators, subdivided into 19 categories that maintain the measurement criteria. In addition to the 40 indicators from the GRI Standards, two additional indicators specific to the real estate sector and civil construction were added, also created by the Global Reporting Initiative [
40]. They are:
Number of people voluntarily and involuntarily displaced and/or reimbursed for development, per project (413-3X);
Type and the number of sustainability certifications, rating levels, and labeling for New Construction, Management, Occupation, and Redevelopment (417-4X).
Altogether, the GRI addresses 42 social sustainability indicators applied to construction companies, as shown in
Appendix A [
40,
41].
After selecting the indicators, a multi-case-study analysis was conducted with nine construction companies. The use of nine multiple cases allows a cross-case examination to be performed. The benefit of making this comparison among companies is to provide an in-depth understanding of the phenomenon and make it more generalizable. In addition, this study was designed to verify whether the companies in Brazil are already implementing these social indicators and how they could implement more with minimal effort.
The multiple case studies were conducted between July 2019 and January 2020 with the construction companies registered with the Association of Real Estate Market Companies of Pernambuco (ADEMI-PE) that made themselves available for the study. The studies involved a series of semi-structured interviews with the people in charge of sustainability in the organization, as well as analyses of documentation, site visits, and data validation.
All three large construction companies that operate in Pernambuco agreed to participate in the study. As for the medium-sized companies, only six, out of 50, were selected to participate in the case study as they had already addressed some efforts toward sustainable issues. A company with between 100 and 499 employees was considered to be medium-sized, and a large company was one with more than 500 employees. The companies were selected based on their activities in previous years, and all of the companies selected were constructing multistory buildings at the time of the study.
Following the selection of cases, a data collection instrument was elaborated. Then, the people responsible for sustainability in the companies were contacted to make documents available and conduct interviews. Afterward, the semi-structured interviews were conducted with company representatives, documental analyses were performed, and site visits were made in the Recife Metropolitan Area. The information collected in the interviews, documents, and site visits is summarized in
Table 1. Two-thirds of the companies referred an employee from the engineering sector to participate in this study, while just two had a solely dedicated sector for sustainability issues. All interviewees had a college degree and had managed construction projects in the construction industry for at least five years, most of them for at least ten years.
Table 2 displays the profiles of the companies that participated in the study, according to their size, the number of projects in executions, and their certifications related to quality, environmental, and occupational health and safety. As shown in
Table 2, Company A is the largest in this multi-case study due to its involvement with projects in various regions in Brazil and even in other countries. The questions about the perception of the level of importance and influence were answered according to a Likert Scale from 1 to 5, where “1” represented minimum importance/influence and “5” represented maximum importance/influence, as per
Table 3 and
Table 4.
The Global Reporting Initiative suggests prioritizing indicators by creating a bivariate scatter diagram [
24]. That diagram displays the perception of the indicator’s value regarding its importance in social dimensions and its influence on company decision-making. In addition, the data from these interviews allow the determination of which GRI social sustainability indicators were most likely to be used. After receiving the interview responses, documental analysis, and site visits, the cases were coded, tabulated, and statistically analyzed to interpret the results through cross-case analysis and examination. Finally, the social sustainability indicators applicable to construction companies in the Recife Metropolitan Area at the current stage of their development were identified.
4. Results
In general, responses were quite variable when asked about previous knowledge regarding the social aspect of sustainability. For instance, as shown in
Table 5, companies “A” and “G” together with company “D” addressed between five and six categories of social sustainability out of the total of 19 defined by the GRI. Those companies highlighted in green have an entire department for sustainability. On the other hand, five interviewees could only recognize one GRI category or none at all.
In the following sections, the importance and influence results are presented. First, a combined analysis was performed involving all large and medium-sized companies. This analysis made it possible to make a generic prioritization that considers all companies. Then, in
Section 4.5, the results from medium and large companies have been separated to highlight the differences between the various corporate environments.
4.1. Perception of GRI Social Indicators by Importance and Influence
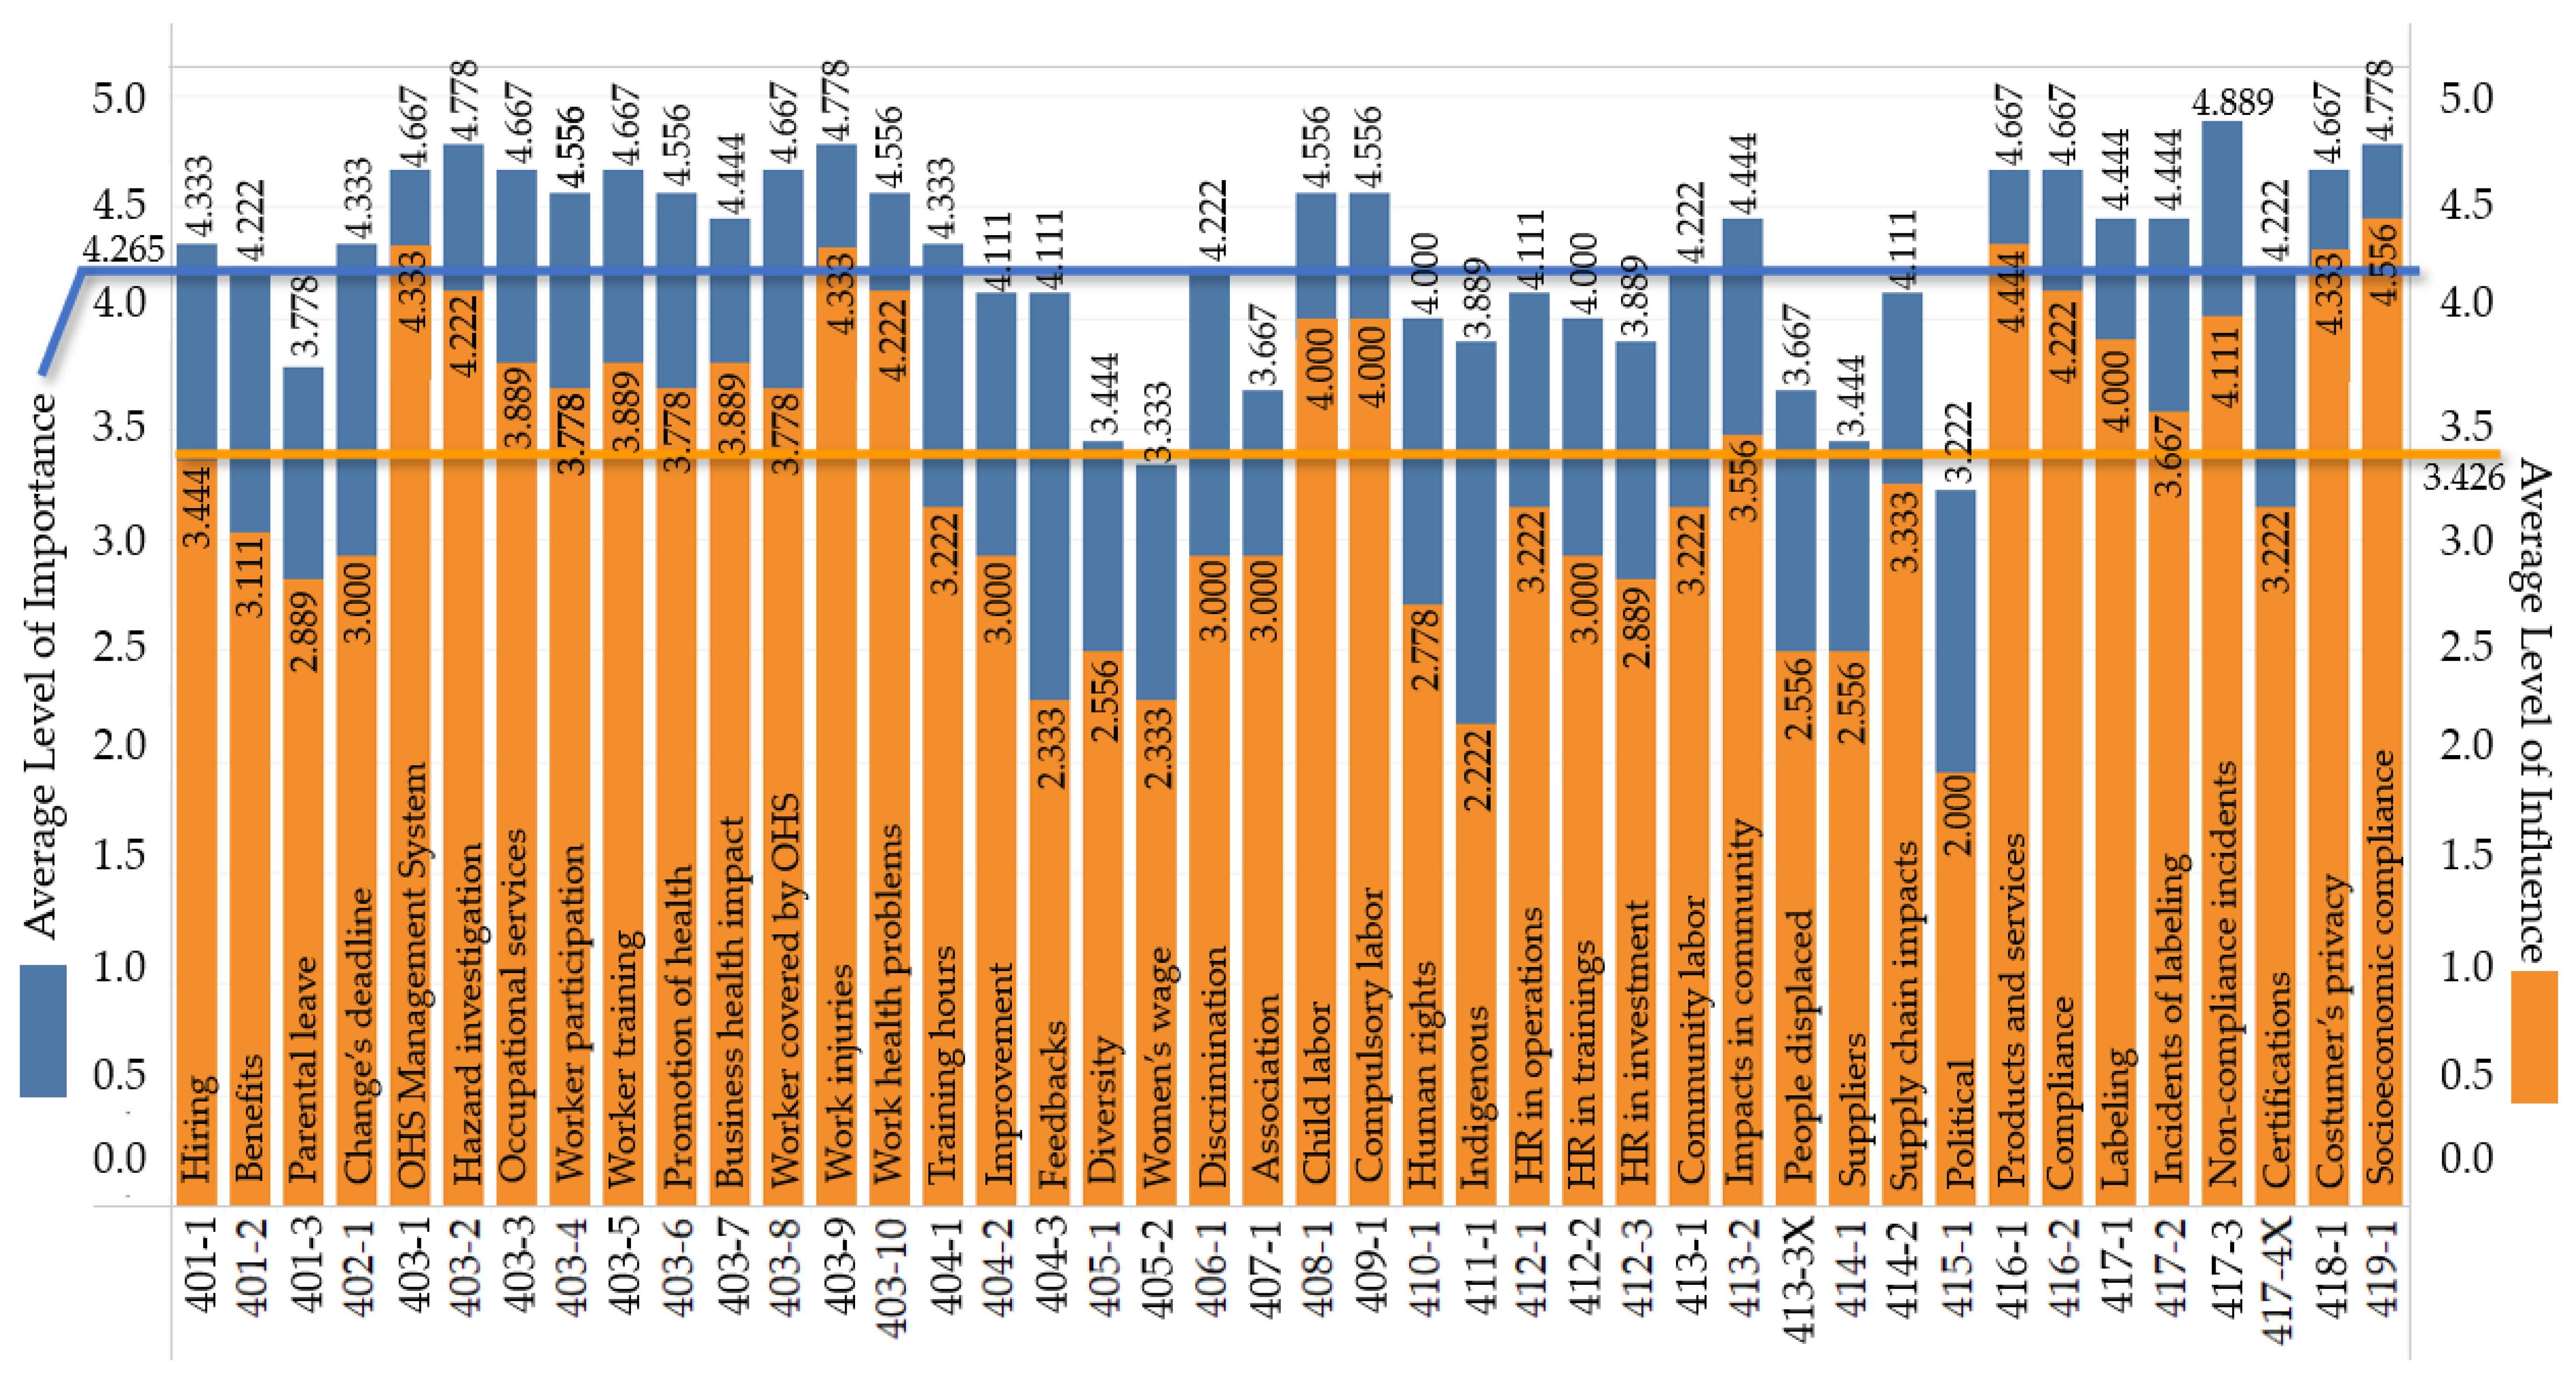
The companies’ perceptions of value for the 42 social sustainability indicators were identified during the interview stage, identifying how important those aspects are for the companies and whether they have already been considered in their strategic decisions. This analysis is essential because recognizing its importance is the first step in using an indicator.
Figure 2 shows a blue bar representing an average level of importance and an orange bar representing an average level of influence for each of the 42 indicators listed in
Appendix A. As shown in
Figure 2, all of the indicators, without exception, had an average level of importance greater than the average level of influence. For example, the average importance level of the indicators was 4.265, while the average level of influence was 3.426. These results indicate that despite recognizing the importance of such indicators, companies still do not consider them to the same extent during decision making. It demonstrates the importance of encouraging social indicators to give visibility to the social sustainability aspects that are already regarded as necessary, as shown by the respondents’ answers. However, because they are not currently being measured, there is no way to monitor the impacts that decisions will have on these aspects.
Among the social indicators considered, the most important are incidents of non-compliance concerning marketing communications (GRI indicator 417-3) with an average of 4.88; hazard identification, risk assessment, and incident investigation (403-2); work-related injuries (403-9) and non-compliance with laws and regulations in the social and economic area (419-1) with an average of 4.77; followed by occupational health and safety management system (403-1), occupational health services (403-3), worker training in occupational health and safety (403-5), workers covered by an occupational health and safety management system (403-8), assessment of the health and safety impacts of product and service categories (416-1), incidents of non-compliance concerning the health and safety impacts of products and services (416-2), and substantiated complaints.
As suggested by GRI, the social sustainability indicators were prioritized, as shown in
Figure 3, with the average level of importance on the vertical axis and the average level of influence on the horizontal axis. Lines representing the average values for level of importance (4.265) and level of influence (3.426) were added to divide it into four quadrants, with the indicators fitting into three of them: those with levels of both importance and influence greater than average (Quadrant 1); those with a level of importance greater than the average, but a level of influence below average (Quadrant 2); and, finally, indicators with levels of importance and influence that were both below average (Quadrant 3). The indicators can be separated according to the degree of attention given to them by the construction companies in the Recife Metropolitan Area, where the indicators in Quadrant 1 already receive a greater degree of attention, followed by the indicators in Quadrant 2, and finally, the indicators in Quadrant 3, which are those that present an opportunity for improvement.
4.2. Indicators Receiving the Highest Degree of Attention (Quadrant 1)
The indicators presented in this section had a level of importance and influence that were both greater than average. The color-coding on
Table 6,
Table 7 and
Table 8 represents the frequency of companies in each category, with dark green, indicating that all companies have collected data related to the indicators, and dark red, meaning that none of the companies have collected data. Specifically,
Table 6 shows that the companies are already sufficiently capable of controlling these indicators. However, only 11 of these were managed by most construction companies as specified in the GRI Standards. Of these 11, nine (81.8%) were within the occupational health and safety aspect (403) and were covered by compliance with OHSAS 18001 certification or through regulatory occupational health and safety standards.
Regarding the other two indicators, it was found in the interviews that operations with significant real and potential negative impacts on local communities (413-2) are controlled through a neighborhood report. However, this report is made to protect the company from possible damages alleged by the neighborhood. Substantiated complaints regarding breaches of privacy and loss of customer data (418-1) can only be measured for most companies because it does not exist. For 33% of the companies, these indicators were considered to require considerable effort to control.
In general, it was observed that only three categories of social sustainability were controlled in a manner similar to the GRI for most companies, even for those indicators considered most important and influential: occupational health and safety (403), local communities (413), and customer privacy (418). However, with little additional effort, most construction companies can collect all of the other indicators in this quadrant, which are not being collected at the GRI Standard level. In this way, companies could expand their range of social sustainability assessments with few additional resources.
Therefore, in addition to the three categories that most companies already collect, the following higher priority categories can also be collected: employment (401), child labor (408), forced or compulsory labor (409), customer health and safety (416), marketing and labeling (417), and socioeconomic compliance (419). Therefore, medium and large construction companies in the RMA already have the necessary infrastructure to control 21 social sustainability indicators, 50% of the total number of indicators selected, from nine different categories, 47.4% of the total number of categories. However, only 11 indicators from three different categories are currently being controlled by companies. Therefore, it would be possible for construction companies to significantly increase control of the social aspect of sustainability without a great deal of effort.
4.3. Indicators Receiving Intermediate Attention (Quadrant 2)
Quadrant 2 contains the indicators having an above-average level of importance, but a below-average level of influence, as listed in
Table 7. The two indicators in this table were considered to require little effort to obtain by most companies interviewed. These indicators are found in two GRI categories (management of labor relations and training and education) that do not have any indicators in Quadrant 1.
These two indicators receive an intermediate level of attention, and construction companies already have the infrastructure necessary to control them, making it possible to expand further the aspects of social sustainability that can be taken into account by their management system. This result means that, in addition to the 21 indicators in Quadrant 1, construction companies could easily manage 23 social sustainability indicators from a total of 11 social categories (58% of the total number of categories).
4.4. Indicators Receiving a Low Level of Attention (Quadrant 3)
The indicators in Quadrant 3 (listed in
Table 8) are considered to have a high level of importance and a below-average level of influence. None of these indicators are collected in a manner similar to the GRI Standard. However, most of these indicators (13 out of 19) were considered to be easily obtainable. Therefore, there is an excellent opportunity in Quadrant 3 for construction company management to improve their professional standing.
Quadrant 3 includes the only indicators considered to require significant effort to obtain, as well as one that most companies believe is not applicable, the indicator for incidents of a violation involving the rights of indigenous peoples (411-1). In addition, the companies did not consider it suitable because they operate exclusively in urban areas where no indigenous land is located, ignoring possible irregularities in the supply chain.
Another indicator that many companies (44%) considered not applicable was that of political contributions (415-1), because, according to the interviewees, their companies do not make such contributions. This result is intriguing compared to the corruption data in industry studies. However, it is worth mentioning that these conceptions of value are based on the perspectives of only one employee per company.
The indicators that require considerable effort to obtain are programs to improve employee skills and programs for transition assistance (404-2), percentage of employees receiving regular performance and career development reviews (404-3), new suppliers that were screened using social criteria (414-1), and sustainability certification type, number, and rating levels (417-4X).
4.5. Comparison between Large and Medium-Sized Companies
Figure 4 shows the average level of importance (chart “a”) and influence (chart “b”) for the three large-sized companies (orange line) and the six medium-sized companies (grey line) to show how a company’s size influences the perception of the importance and influence of such indicators. In particular,
Figure 4a displays that larger companies are more aware of the importance of these indicators. Only one indicator was perceived as less important by large companies than by medium-sized companies. All other indicators were considered to be more important by large-sized companies. Although this level of importance is consistent across almost all indicators, a bigger gap was identified for indicators in the categories of Occupational Health and Safety (403), Training and Education (404), Diversity and Equal Opportunities (405), Evaluation of Human Rights (412), Local Communities (413), and Marketing and Labeling (417). Some factors may explain these differences for specific categories. For example, for Occupational Health and Safety (403), all indicators were perceived by large companies to have the maximum level of importance, which is likely because the larger a company is, the more vulnerable it is to inspection. A different mindset within the companies was also identified for the other categories, suggesting that smaller companies do not have the same concerns with aspects beyond their core business.
Regarding the level of influence, in
Figure 4b, the only gap identified was for the Political Contributions (415-1) indicator, demonstrating that this aspect is almost not considered by smaller companies. Once again, everything from the Occupational Health and Safety (403) category is more influential in larger companies, suggesting that large companies are more aware of this aspect. Except for these two groups of indicators (Political Contributions and Occupational Health and Safety), a significant difference in perception of the influence of the indicators based on company size is not seen. This result suggests that, although large companies are more aware of their importance, those indicators are not more influential in their decision-making processes than those at medium-sized companies. Because the perception of importance is already higher at large companies, this study reinforces that implementing these indicators into the management processes would contribute to considering such categories in the decision-making processes.
4.6. Discussion
As Savitz and Weber [
26] suggested, companies had greater adherence to indicators associated with performance and economic reward in the short or medium term. Their compliance is because of fines, such as socioeconomic compliance, health, occupational safety, unauthorized labor (child or compulsory), and indicators related to the end-user. Nevertheless, companies that have a more significant concern for, and consequently give greater importance to, the social aspect of sustainability are also those that have a greater number of active construction sites, despite the economic crisis that the country is facing. This finding agrees with the results presented by Kerscher and Schaefers [
33], which concluded that corporate social responsibility (CSR) positively influences a corporation’s financial aspects. However, further studies correlating these data are needed.
Even though interest in the social aspect of sustainability is a relatively recent phenomenon, a literature review shows that several authors are concerned with this issue. However, at construction companies, social sustainability indicators are not yet properly understood and are limited to only a few implementations. The inclusion of indicators that mainly consider occupational health and safety was already in the companies’ interest, either due to normative requirements or company certifications. Other indicators were already receiving attention from companies related to local communities (413) and customer privacy (418).
In total, 11 indicators were already being collected that were similar to the GRI (nine of them referring to occupational health and safety), covering only three of the 19 categories related to social sustainability. However, companies can already collect 25 more social sustainability indicators without requiring additional resources, for 36 out of 42 indicators, encompassing 16 of the 19 social sustainability categories, according to the GRI Standard.
This study provides three groups of indicators (quadrants) that companies could use as a guideline to implement the social sustainability indicators under their stage of development. The companies that are not yet controlling any social sustainability indicators in their management processes should focus initially on the first quadrant (
Section 4.2 and
Section 4.3), composed of mandatory indicators. Then, companies should focus on the second group, where these initial indicators are already managed (
Section 4.4). Finally, the implementation phase could contain all indicators as most of them are not considered hard to collect. Therefore, the companies should evaluate their capacity to encompass as many as possible. If this is not possible, the quadrants provided in this study can be utilized as implementation phases.
Implementing these indicators will create a more sustainable environment and a broader strategic vision for the company. This implementation has begun to consolidate in the largest companies, which can use these indicators to ensure greater satisfaction for their employees, customers, neighbors, and even investors and achieve greater brand recognition and valuation. However, further studies that link the usage of these indicators and the stakeholder’s satisfaction are necessary.
5. Conclusions
Unlike previous studies on social sustainability, where the concern was focused on conceptualizing the categories and indicators or creating a less subjective assessment method, this study identified the application and adherence to social sustainability indicators in practice at large and medium-sized construction companies through a multi-case study. First, to examine the adherence and applicability, a set of social sustainability indicators were selected based on the relevance and widespread use of the Global Reporting Initiative’s reports. After that, a series of semi-structured interviews, documental analysis, and site visits were conducted.
In general, it was found that a significant degree of importance was given to the selected indicators. However, these indicators were not considered to be influential in the company’s strategic decision-making at the level of their importance. Furthermore, the lack of control of these indicators makes it difficult to perceive how the company’s decisions influence these aspects. Therefore, a priority matrix was developed according to the importance and influence of the indicators and effort to implement them. This tool can be used by those who want to start implementing social sustainability management. In addition, most of these indicators have been shown to be easily applicable by the companies, which would contribute to more sustainable decision-making.
This study can help disseminate knowledge and enable companies to see possibilities to improve their management systems by implementing these indicators. Furthermore, there was a higher degree of awareness of the social aspects of sustainability on the part of the larger companies that participated in this study. This level of awareness provides a model to be followed by companies aiming to reach new heights, helping small businesses mirror those on the frontier of learning.
Just as in the study by Kerscher and Schaefers (2015), the results suggest that the best-performing companies are those that most consider social sustainability. Future research should:
Analyze whether larger companies are considering social sustainability indicators because they already have more resources to make this control possible or if giving such importance to social aspects was instrumental in leading these companies to achieve better financial results.
Focus on the correlation between social indicators and a company’s financial performance.

 ,
, 


