1. Introduction
During the construction of an underground structure, the stability control of cavern surrounding rock is the primary scientific issue [
1]. How to effectively control the harmful deformation and catastrophic damage of rock masses through scientific, reasonable, and economically reliable excavation and support optimization methods is an unavoidable technical problem for large-scale underground engineering construction. The stability of the underground structure is affected by external and internal factors such as mechanical properties of rock mass, structural, in-situ stress, groundwater, excavation geometries, and safety requirements [
2,
3]. Empirical and numerical methods are widely used to access these parameters for supporting underground structures [
4]. Based on the practice of civil, transportation, hydropower, and mining engineering, different rock mass classification systems have been developed and they are considered power tools for supporting the design of the underground structure. The commonly used systems are rock structure rating (RSR) [
5], rock mass rating (RMR) [
6], Q system [
7], basic quality (BQ) [
8], hydropower classification (HC) [
9], et. al.
However, rock classification methods do not provide the plastic zone thickness and stress distribution around the excavation opening zone. Particular attention should be paid when using these subjective methods. On the other hand, the numerical approaches no matter continuum or discontinue modeling have the advantage of simulating ground complexities, such as the sophisticated geometries, the high in-situ stress, the abundant groundwater, and the interaction between surrounding rock mass and supporting structures. Xing et al. [
10,
11] studied the support of an underground mine in rock mass containing large discontinuities with the global reinforcement model in 3DEC. Yang et al. [
12] investigated the deformation, stress, and crack evolution characteristics of the roadway under unsupported and primary support conditions. A new “bolt-cable-mesh-shotcrete + shell” combined support was developed to handle the large deformation of the roadway. Kanik and Gurocak [
13] analyzed the support elements of the Macka tunnel with the Finite Elements Method (FEM). It shows that the optimum support systems are compatible with the support system recognized by the RMi rock mass classification systems. Moreover, the numerical approach can improve the understanding and evaluation of failure mechanisms, geotechnical risks, and the construction of more effective rock reinforcement systems [
14,
15].
Even though numerous numerical analyses have been performed on the stability assessment and support design for underground structures as mentioned above, the majority of the studies only considered the impact of a single engineering or geological factor or simply used two-dimensional (2D) modeling. The stability of excavations is significantly impacted by the 3D redistribution of excavation-induced stresses, which is a three-dimensional (3D) problem in the behavior of subterranean excavation in rock masses. For precise rock mass behavior prediction in numerical modeling, it is essential to simulate the 3D sequences of excavation and rock support. A 2D analysis or a 3D analysis that has been greatly simplified could produce numerical results that are not accurate to reality. The geology conditions of the underground structure are usually complicated. The conventional FEM cannot simulate the deformation of excavation underground with many soft rock layers well.
In the paper, the main powerhouse of the Panlong pumped-storage power station was selected as an implementation site for the empirical and numerical design of support of the underground structure. Field and laboratory tests followed empirical rock mass classification and numerical modeling was performed to determine the efficacy of the design support.
2. Geology Investigation of the Underground Powerhouse
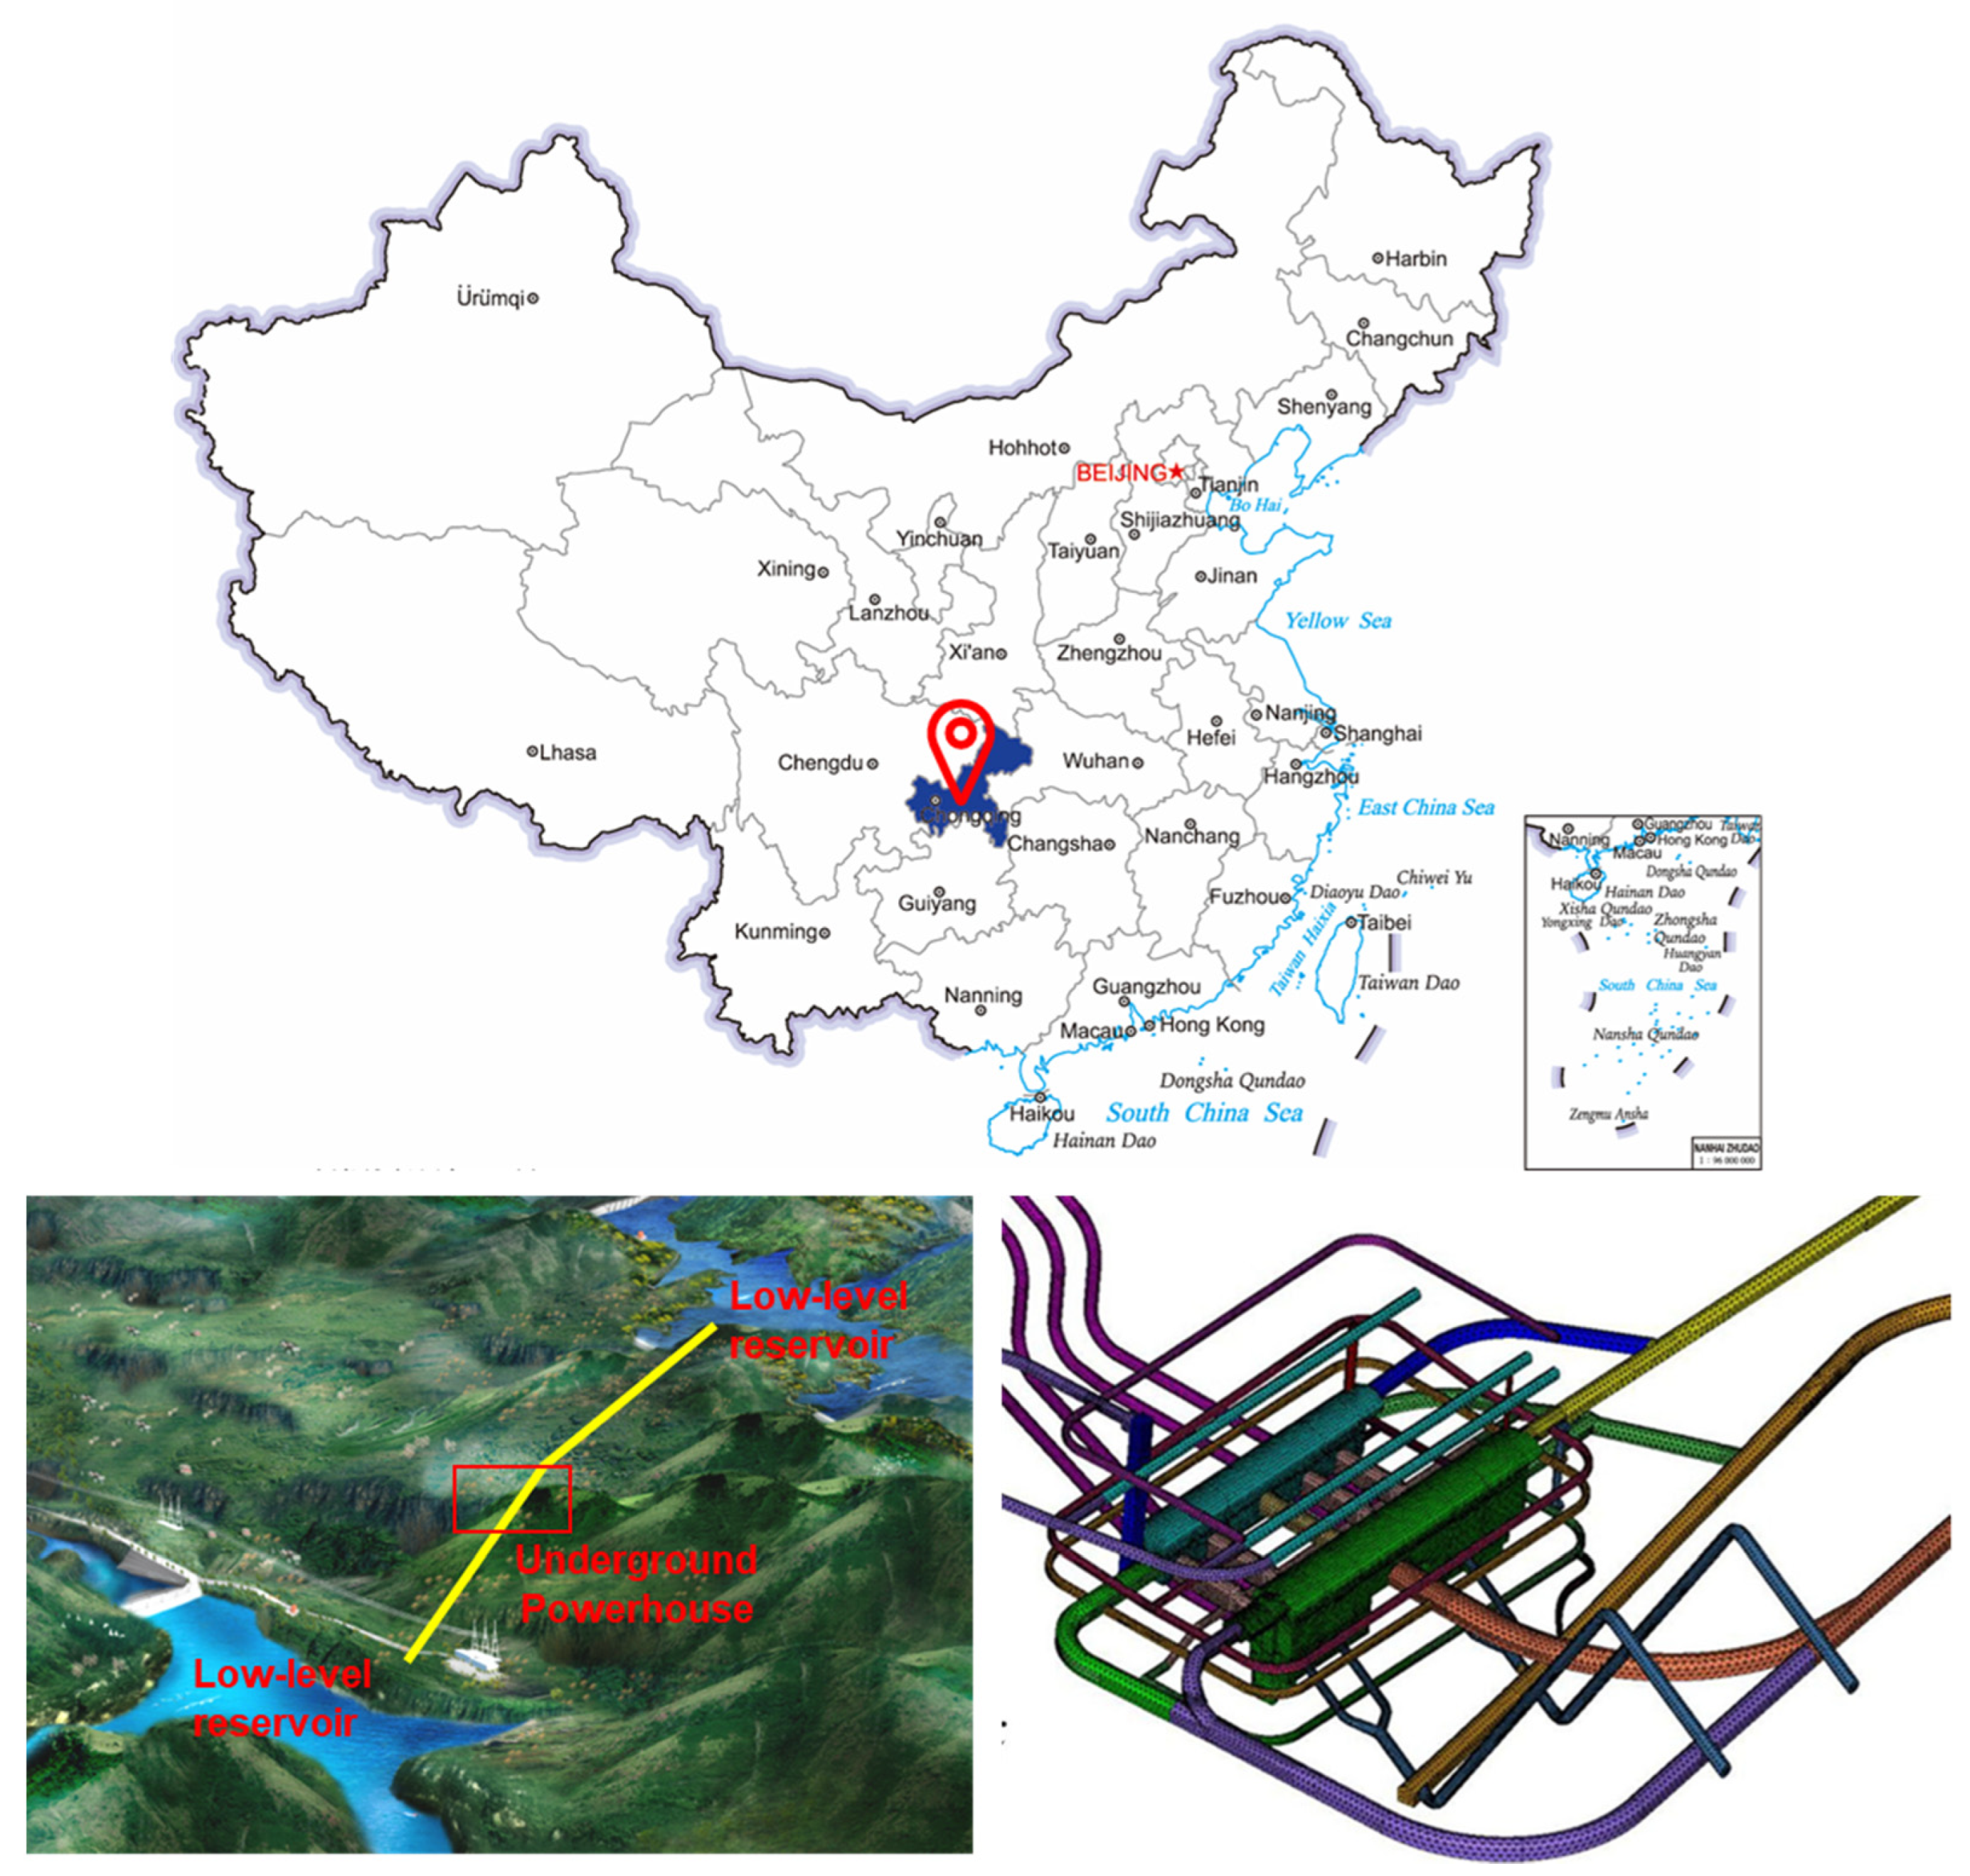
The Panlong Pumped-storage Power Station is located in Zhongfeng Town, Qijiang District, southwest of Chongqing, about 80 km away from the main urban area of Chongqing. The power station has an installed capacity of 1200 MW. After the power station is completed, it will undertake the tasks of peak regulation, valley filling, frequency regulation, phase regulation, and accident backup of Chongqing’s power grid. It will be an important backbone power source in Chongqing’s future power grid. The pivotal project is mainly composed of buildings such as upper and lower reservoirs and water transmission and power generation systems.
The location of the underground powerhouse of the Panlong pumped-storage power station is presented in
Figure 1. The underground powerhouse adopts a rear-end layout, and the main buildings include the main powerhouse, headrace tunnel, and pressure shaft, and tailrace tunnel. The longitudinal axis direction of the main powerhouse is N80°W, and the excavation size is 171.00 × 25.00 × 52.425 m (length × width × height). The two large caverns of the main powerhouse and the main transformation tunnel are 55 m apart and arranged in parallel. The installation site is located at the right end of the main plant. The ground auxiliary plant, switch station, and outlet yard are arranged together. It is located on the right bank of Wangjiawujigou in the upper reaches of Lianghekou, about 150 m away from the inlet/outlet of the lower reservoir.
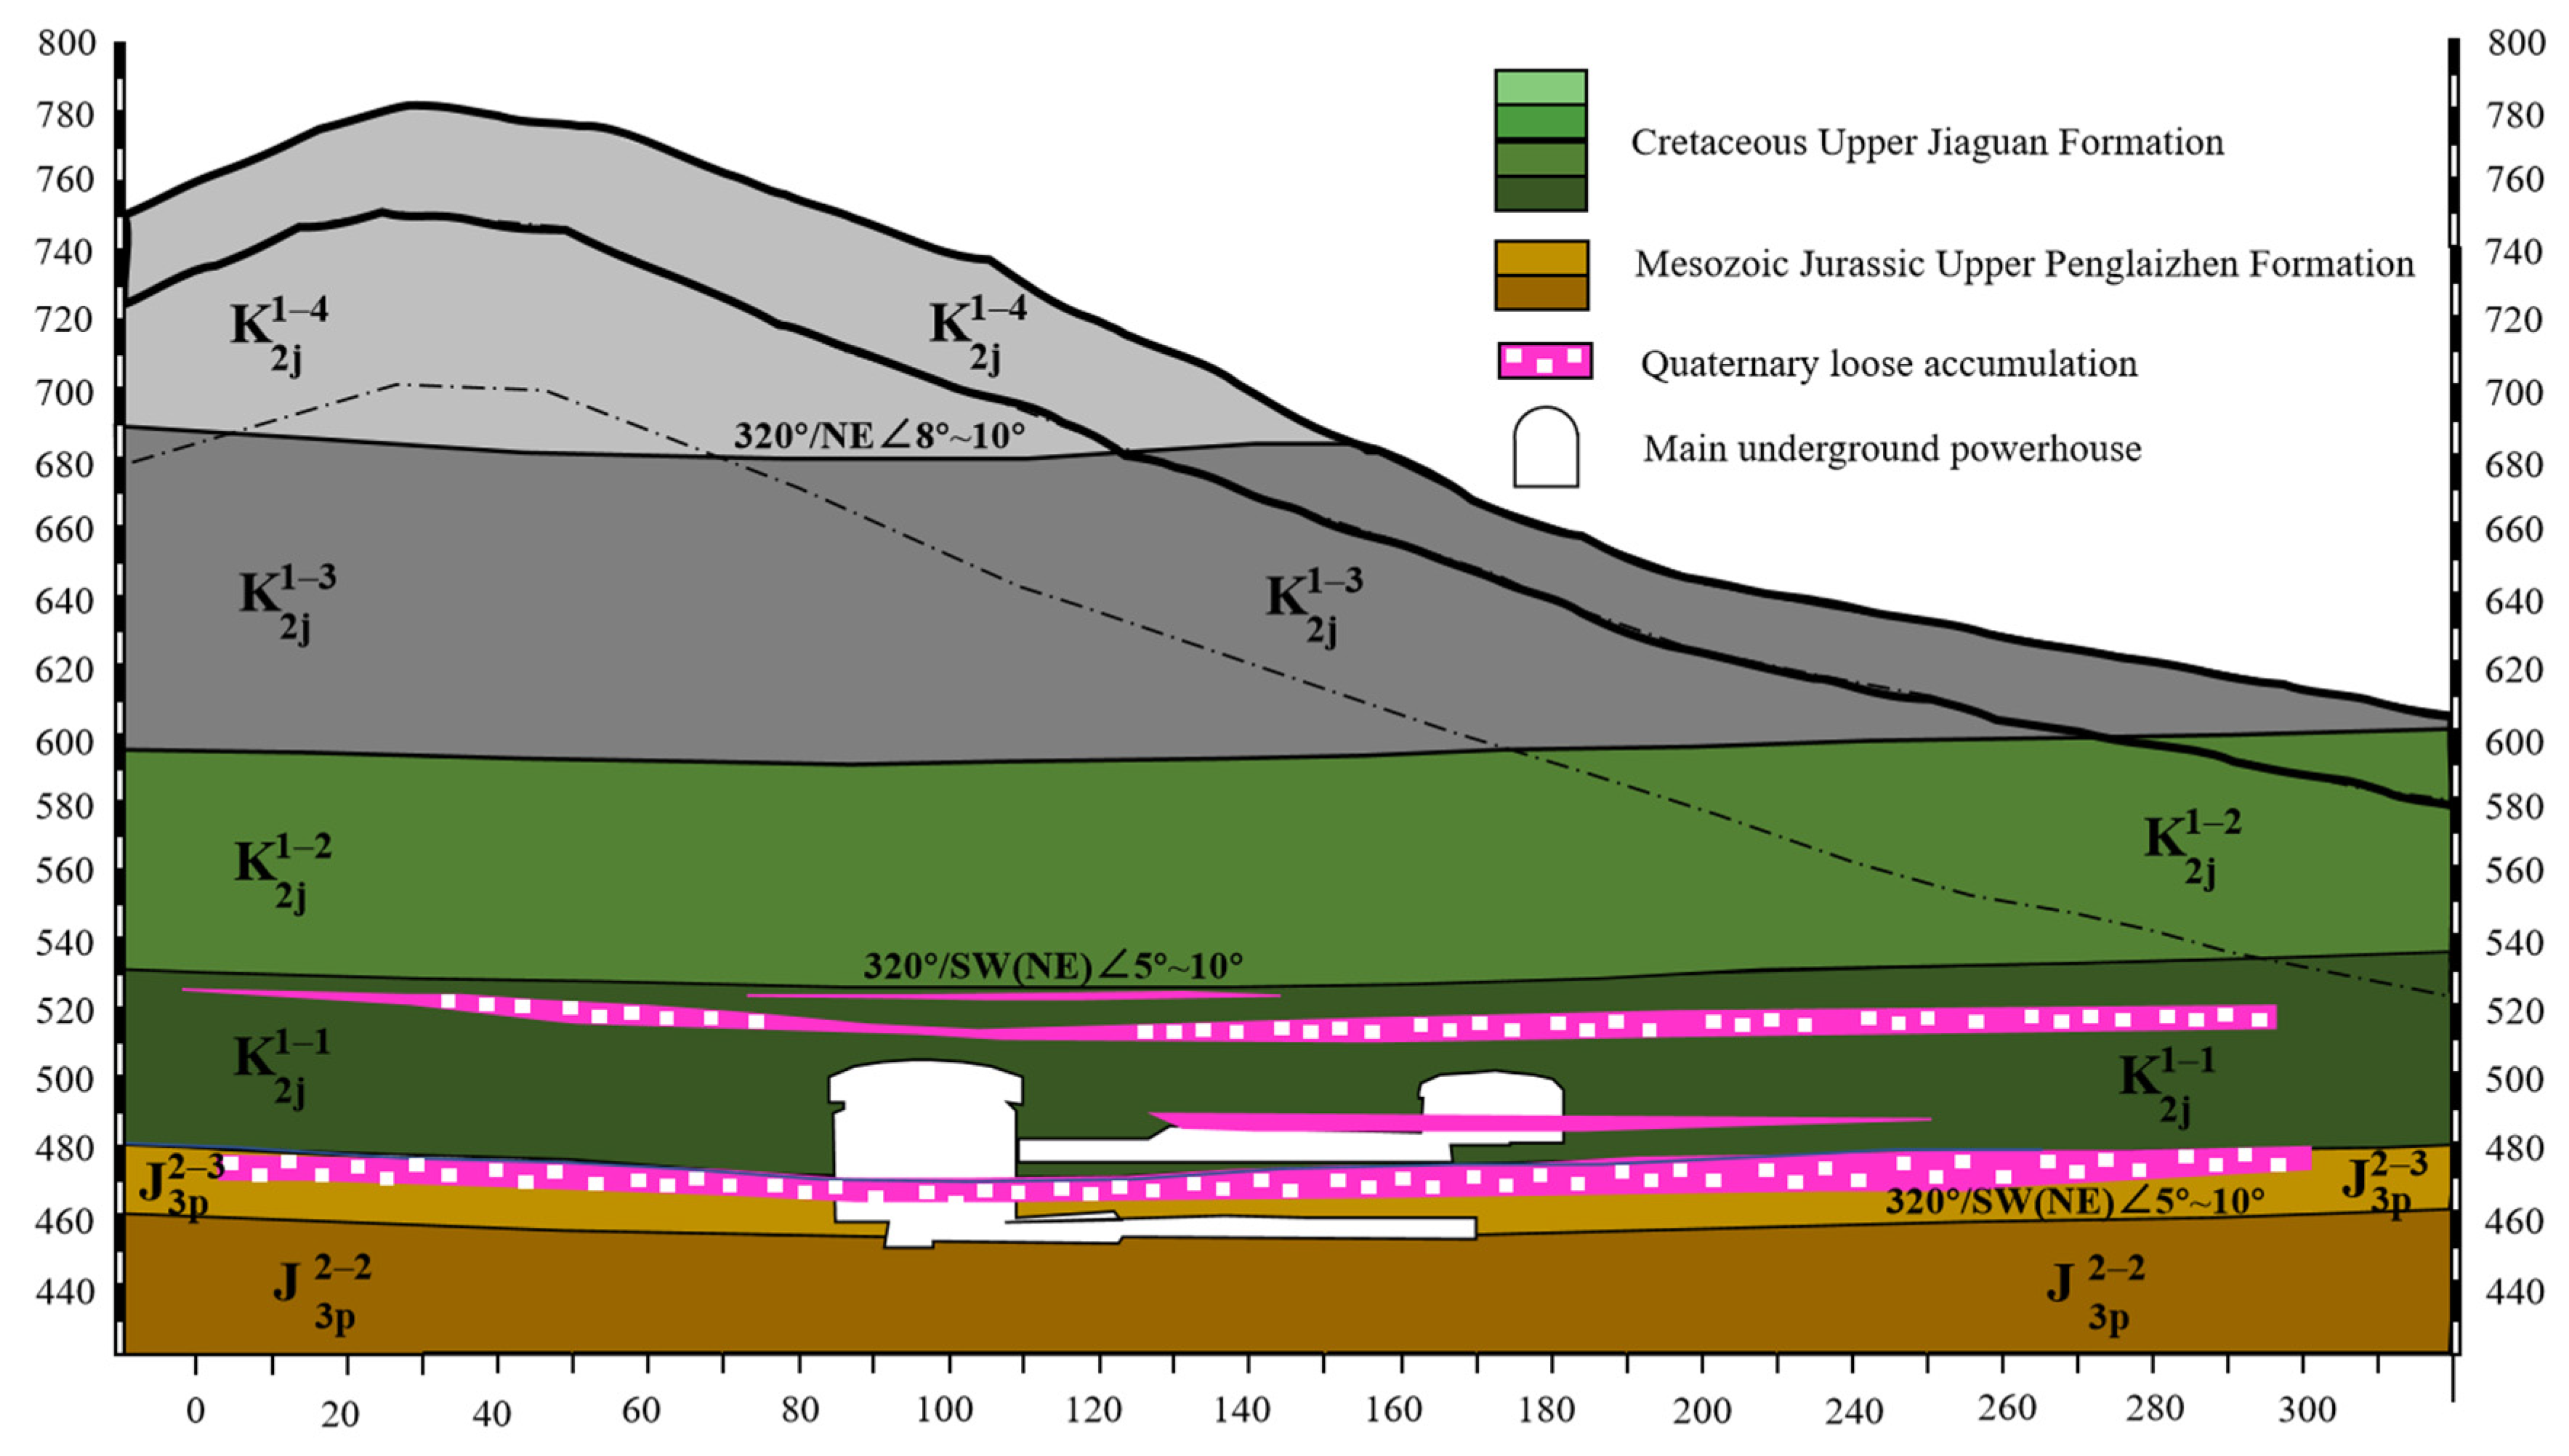
The project is located at the northeast wing of the Zhongfengsi syncline (axial northwest) and the southeast wing of the Huajinshan syncline (axial northeast). According to the engineering geological cross-section drawing of the main underground powerhouse (
Figure 2), the exposed strata are the Mesozoic Jurassic Upper Penglaizhen Formation (
J3p) and Cretaceous Upper Jiaguan Formation (
K2j), and the unevenly distributed Quaternary loose accumulation. The lithology of the underground powerhouse area in the middle and lower-middle and lower part of the Jiaguan Formation (
) middle and fine-grained sandstone, gravelly coarse sandstone, conglomerate intercalated with argillaceous siltstone and silty mudstone, and the second member of the Penglaizhen Formation. The top of the section (
) is purple-gray, gray-green sandstone, siltstone, argillaceous siltstone, and mudstone. The elevation of the boundary between the two is 473.59–469.90–479.82 m from south to north. The main and auxiliary powerhouse caverns above the bus bar layer are the Jiaguan group stratum, and the installation elevation (466.00 m) below is the Penglaizhen group stratum.
The geological structure of the main underground powerhouse is simple and there are no regional faults and large-scale faults passing through the study area. According to the statistics of exploring caves in the underground powerhouse area, the main structural planes are rock layers and joint cracks. The rock layers are gentle, and the orientations are mainly with a strike of N15°–25°W and a dip angle of 4–10°. Each group of joint cracks in the project area is dominated by steep dip angles, with straight faces and longer extensions, which are mainly developed in medium to thick sandstones. The joints in siltstone and conglomerate are short, small, and undeveloped. Four main joint cracks develop with the following attitudes: (1) a strike of N50°–70°W, a tendency of SW and a dip angle of 60–85°, (2) a strike of N70°–90°W, a tendency of SW and a dip angle of 50–85°, (3) a strike of N30°–50°W, a tendency of SW and a dip angle of 60–80°, (4) a strike of N65°–85°E, a tendency of SE and a dip angle of 70–85°.
Figure 3 shows the rose diagram and stereographic projection of the joints and fissures in the plant area. There are 386 joints with a length of more than 1 m, the development density is 0.42/m, and the spacing is 2.4 m. The joints are mostly closed, with local micro-opening and no filling.
In summary, the lithology of rock in the project area is sandstone, siltstone, mudstone, conglomerate, etc. The main factors affecting the engineering geological characteristics of rock masses are the mineral composition of the rock, mechanical strength of rock, weathering degree; development and mechanical properties of structural planes in the rock mass, integrity and deformation characteristics of rock mass; in situ stress state and groundwater characteristics, etc. Therefore, in-situ and laboratory tests were carried out to identify the physical and mechanical properties of the rocks. Details are shown as follows.
To evaluate the mineral composition of rocks, X-ray diffraction (XRD) analyses of the powdered rock were conducted in the laboratory, and the results are shown in
Figure 4. Sandstone and siltstone are mainly composed of quartz while mudstone is dominated by clay. Particularly, Clay minerals are mainly composed of chlorite and montmorillonite mixed-layer minerals and illite and montmorillonite mixed-layer minerals which means that mudstone has a certain degree of expansion and contraction. However, the sandstone and siltstone are more brittle due to the existence of quartz.
Laboratory tests were performed on the core samples prepared from the drilling based on the methods suggested by ISRM [
17]. The physical and mechanical properties including unit weight, porosity, uniaxial compressive strength, tensile strength, softening coefficient, Young’s modulus, and Poisson’s ratio were investigated. Moreover, the rock quality designation (RQD) was determined from the drillings and scan-line surveys based on the method proposed by Priest and Hudson [
18] (
Table 1). Most of the rock porosity in the underground powerhouse is about 6%. The saturated compressive strength
Rc of sandstone is 41.7–113.0 MPa, with an average value of 68.4 MPa, and is dominated by hard rock. The
Rc of siltstone is 34.4–42.6 MPa, with an average value of 38.5 MPa, and belongs to medium-hard rock. The saturated compressive strength of the conglomerate is 23.5–35.2 MPa, and the average value is 31.6 MPa, which belongs to medium-hard rock. The saturated compressive strength of mudstone is 4.48–16.0 MPa, and the average value is 8.80 MPa, which is belong to soft rock.
As the strength of mudstone is much lower, the mechanical properties of the structural plane between mudstone and sandstone or concrete control the stability of the underground powerhouse. Therefore, the in-situ shear tests were conducted in the exploration adits followed by the method suggested by ISRM [
17] to study the shear strength of the structural plane. Five samples were tested, and the results are shown in
Figure 5 (
Figure 5a is the structural planes between mudstone and sandstone, and
Figure 5b is the structural planes between mudstone and concrete). The cohesion and friction angle of mudstone are sandstone is 0.17 MPa and 21.5°, respectively. The cohesion and friction angle of the structural plane between mudstone and concrete are 0.54 MPa and 21.5° according to the linear fitting results. However, we find that the logarithmic function can describe the shear strength of the structural plane between mudstone and concrete better. We can see that the cohesion of the structural plane between mudstone and sandstone is extremely low.
The deformation moduli
of the rock masses were calibrated through the rigid bearing plate method suggested by the Ministry of Land and Resources [
19]:
where
p is the pressure applied on the rigid bearing plate, MPa,
b is the diameter of the plate, cm,
W is the total deformation of rock mass, cm,
ω is a coefficient related to the stiffness and shape of the rigid bearing plate, in this paper,
ω = 0.785 according to the Chinese National Standard GB/T 50266-2013 (2013).
is the Poisson’s ratio of the rock mass. 28 tests were conducted in situ and the results showed that the average deformation modulus of sandstone, conglomerate and siltstone are 14.9, 6.55, and 6.71 GPa, respectively. In addition, the determined deformation moduli change little in horizontal and vertical directions, suggesting that the anisotropy of sandstone is not obvious. It should be noted that the deformation modulus of mudstone was not conducted due to the limitation of such rock mass. Therefore, it was determined by the following equation [
20]:
where
GSI is the geological strength index, and
D is a coefficient describing the disturbance degree of the rock mass subject to blast damage and stress relaxation. It can be determined according to the method suggested by Hoek and Brown [
21]. Details of these two parameters are given in
Section 4.
Due to the existence of discontinuities and filling materials in the rock mass, the P-wave velocity of rock mass is slower than that of intact rock. Therefore, the relationship between initial p-wave velocity and the reduced p-wave velocity is widely used to reflect the physical and mechanical properties of the rock mass. The Poisson’s ratio
of rock mass was measured through the seismic reflection method suggested by (Bowles, 1988). With the determined seismic vertical wave velocity (
) and horizontal wave velocity (
), the Poisson’s ratio can be expressed as,
The wave velocity of the rock mass can be identified through acoustic test methods such as the single-hole method, cross-hole method, and hammering method [
22]. As the acoustic test results are significantly influenced by drilling direction, the cross-hole method was conducted to determine the p-wave velocity of rock mass in the study area and the typical results are given in
Figure 6. The elastic wave CT in the underground powerhouse area shows that the wave velocity of the rock mass is mainly distributed between 3750–4500 m/s; the rock mass integrity is good. The area of wave velocity of 3000–3750 m/s is distributed in a gentle dip angle layer, and the distribution elevations are mainly 476.00–486.00 m, 516.00–526.00 m, and 456.00–466.00 m. Combined with borehole imaging results, it is caused by mudstone, argillaceous siltstone, and poorly cemented conglomerate. The borehole CT test results showed that the area of wave velocity less than 3000 m/s only accounted for 0.25% of the total scan area. It may be caused by joint fissures in the rock mass. The extremely low wave velocity area (
< 3000 m/s) was not found in the borehole elastic wave CT scan area.
It is generally accepted that in-situ stress has a significant influence on the stability of the underground structure. The stress relief method and hydraulic fracturing stress method are two widely used techniques to estimate the in-situ stress by ISRM [
23]. Compared with the stress relief method, the hydraulic fracturing stress method does not have the limitation of the borehole depth and has lower excavation disturbance to the surrounding rock mass. Therefore, it was employed to estimate the in-situ stresses of the studied area. The results showed that the maximum principal stress of the underground powerhouse is between 5.47 MPa and 6.76 MPa, and the inclination angle is 75.99–82.15°, which is close to the vertical direction. The azimuth angle is 103.90–116.69°, and the overall performance is fluctuating in the east-west direction. The magnitude of the intermediate principal stress and the minimum principal stress is between 5.08–6.50 MPa and 3.84–5.02 MPa, respectively, the inclination angles of the minimum principal stress are all small and close to the horizontal direction.
The theoretical calculation value of the self-weight stress within the elevation range of 472.00–528.00 m in the underground powerhouse (γ·H, γ is 2.7 × 10⁴ N/m3, the thickness of the overlying rock mass is between 227–283 m) is between 6.13 MPa and 7.64 MPa. The measured value of the stress component in the vertical direction is between 5.26 MPa and 6.5 MPa. It is obvious that the measured value is slightly lower than the theoretical calculation value, but the measured value is consistent with the maximum principal stress value.
The groundwater in the plant area is mainly bedrock fissure water, and the water-bearing rock mass is sandstone. The groundwater level is 550.00–700.00 m, high in the north and low in the south, and it is discharged from the lower reservoir in Shijiagou. According to the results of the water transmission power generation system and underground powerhouse drilling water pressure test results and PD1 exploration of flat caves, there are no obvious signs of groundwater activity along the joint cracks. The water permeability of the rock mass is weak.


