Article

Geodetector-Based Livability Analysis of Potential Resettlement Locations for Villages in Coal Mining Areas on the Loess Plateau of China

1
School of Geological Engineering and Geomatics, Chang’an University, Xi’an 710064, China
2
Institute of Geography and Geoecology (IFGG), Karlsruhe Institute of Technology (KIT), Kaiserstrasse 12, 76131 Karlsruhe, Germany
*
Author to whom correspondence should be addressed.
Sustainability 2022, 14(14), 8365; https://doi.org/10.3390/su14148365
Submission received: 16 May 2022 / Revised: 23 June 2022 / Accepted: 5 July 2022 / Published: 8 July 2022

Abstract

:
The resettlement of residents within the construction area of large projects is an important task related to people’s welfare. Livability is often used as an evaluation indicator when selecting resettlement areas. According to the results of the China Development Plan and 300 questionnaires, the human settlement factors that constitute livability include the living environment, ecological health, infrastructure, public facilities, and economic development, data on which can only be obtained from existing villages, and therefore cannot be used to directly assess the livability of potential resettlement areas. In fact, these human settlement factors are formed by the complex influences of numerous geographical factors (e.g., slope, slope orientation, accessibility, etc.), and it is scientific and reliable to use these geographical factors, which can be determined for each location, to carry out the livability assessment of potential resettlement areas. To this end, this paper takes the village resettlement project in the Dafosi coal mining area on the Loess Plateau of China as an example, calculates the livability scores of the existing villages around the coal mine using the entropy weighting method, and quantitatively analyzes the relationship between the livability scores and the selected geographic factors using a spatial correlations analysis method named Geodetector. It further uses the weighted overlayed function to superimpose the main geographic factors in order to obtain a livability grading map of the potential resettlement area. The results were successfully applied to the above resettlement project. We also verified the accuracy of this paper’s assessment method by adding 184 natural villages, and the method can be applied to other types of resettlement area livability assessment.

1. Introduction

All types of large-scale projects have resettlement and livability assessment issues, and many areas with safety risks, such as nuclear plants, landfills, and natural disaster risk areas, require the same resettlement efforts. We consider a coal mine subsidence area as a research example. China is the largest coal mining country in the world, and the western Loess Plateau is one of the world’s main coal-mining area. According to the “2022–2028 China Coal Industry Market Development Research and Future Plan Report”, China produced about 4 billion tons of coal in 2021, accounting for 47% of the total global coal production, of which coal mines in the Loess Plateau account for more than one third. The Loess Plateau region is characterized by complex and varied landscapes, gullies and ravines, lacking water resources, and a fragile ecological environment. Each year, ground collapse areas caused by underground coal mining sum up to approximately 500 km2, endangering the safety of mining construction facilities and the daily life of the residents, and leading to the deterioration of the regional ecological environment [1,2,3,4,5]. At present, when mining coal under a township region with a high settlement density in China, coal mining techniques such as infill mining and strip mining are often used to alleviate surface deformation and ensure building safety. Using the above coal mining techniques has the drawbacks of low operating efficiency, high production costs, and low coal mining efficiency. Furthermore, traditional villages on the Loess Plateau are scattered and the main buildings are made of brick and tile with a low deformation resistance. Therefore, the most common solution to prevent the negative consequences of coal mining in village areas is village resettlement [6]. That is, the villages are concentratedly resettled to a more livable area outside the mining area before mining commences.
In past research, the resettlement works have been divided into three categories [7]: development-induced resettlement [8,9], urbanization-driven resettlement [10,11], and ecological resettlement [12,13]. For ecological resettlement, after the 2004 Chuetsu Earthquake, the local government carried out a resettlement project. In the course of their work, the local government found that the collective resettlement project was financially cheaper than a small-scale residential area renovation project. In collective resettlement projects, three-quarters of the total construction cost of new site development is borne by the national government, and the individual households participating in the project build their own houses [14]. Mining-induced displacement and resettlement should be classified as development-induced resettlement. The criteria for resettlement location selection are mostly based on quantitative and semi-quantitative methods following national standards, expert opinions, and previous experiences. However, these methods are not necessarily based on scientific knowledge. Hence, a science-based and efficient system for evaluating the suitability of potential resettlement areas would be desirable. The key to solving the resettlement location selection problem is to establish an effective evaluation index system and corresponding evaluation methods to comprehensively assess the suitability of resettlement areas. The shifting behavior of social space can also be analyzed in terms of human interactions and wealth distribution across multiple scales using fine-grained data. Balsa-Barreiro et al. analyzed rural population migration by mapping population dynamics at local scales using Spatial Networks. In their work, the presence of urban dynamics in areas rarely addressed in the mainstream literature on urban studies is identified [15,16].
As an assessment criterion, the concept of livability was introduced, which serves as a key parameter for assessing the suitability of the living area.
To model livability, the first tasks are figuring out which aspect of human resettlement factors should be involved and defining the exact meaning of livability. Alavizadeh et al. researched the definition of livability carefully and investigated the status of livability from the viewpoint of the rural population in villages of Kashmar County [17]. Livable resettlement locations are those where residents are able and willing to settle long-term. In a livable resettlement location, residents enjoy perceived quality housing, reliable utilities, nearby social infrastructure, neighborhoods, security, and a sense of permanence. Generally, livability includes two core concepts: quality of life, which is based on opportunity and achievement, and an optimized external and internal environment that directly affects the lives of residents. Thus, livability can be defined as the ability of a place to achieve the desired or ideal quality of life for the people who live in it. In other words, it is a combination of concern for the environment and quality of life [18,19]. Hence, the evaluation model of livability should take into account some human settlement factors that can have an impact on the residents’ quality of life, including, for example, the dwelling environment, ecological health, infrastructure, public facilities, and economic development. In earlier studies, factors such as living area per capita, population density, vegetation cover per capita, livestock and poultry breeding area per capita (livestock breeding has a high cost for ecological health [20]), road area per capita, village road hardening rate, number of nursing home beds per capita, number of village health room beds per capita, arable land per capita, and the proportion of villagers engaged in the coal industry (mining jobs can bring better economic income to villagers) were considered as human settlement factors [21,22].
In most studies conducted so far, models were semi-quantitative and semi-deterministic. For example, Analytic Hierarchy Process (AHP) [23,24], the Delphi method [25], and the entropy weight method [21,26] have been applied. Basu et al. proposed a geographically weighted principal component analysis to evaluate the spatial pattern of urban livability in Raiganj, India [27]. Some studies have implemented machine learning algorithms such as neural networks to obtain or estimate livability [28]. However, these livability evaluation models always contain human settlement factors and geographic factors together. In Wang’s study, six aspects are considered as the influencing factors of rural livability: natural environmental conditions, sanitation status, infrastructure condition, public service level, housing condition, and human social amenity. Both geographic factors (natural environmental conditions) and human settlement factors are introduced [29]. Obviously, the human settlement factors should be the result of complex interactions between geographic factors. Due to the complex relationship between geographical factors and human settlement factors, through consulting experts and China’s rural planning and development guidance [30], we learned that excluding government investment and other factors, geographical factors have a great impact on rural livability, and most of the human settlement factor will change greatly under the influence of geographical factors. These livability evaluation models rarely have their evaluation indicators analyzed and filtered, so that their accuracy and rigor may be influenced. Otherwise, in our research area, there is no human settlement factor in the open space that may become a resettlement location, but the existence of geographical factors does not have any relationship with the existence of villages. If the aim is to estimate potential livability for areas where currently there is no village, geographic factors may serve as a proxy. To predict habitability within the entire study area, a weighted assessment must be made with geographic factors. The geographic factors we picked are mostly based on references and experience, and maybe they do not have enough of an impact on livability. Hence, to filter out more contributing geographic factors, the Geodetector is introduced.
The Geodetector [31,32] (www.Geodetector.org, accessed on 15 May 2022) is a new statistical method for reveal the spatial heterogeneity of geographic phenomena. Its basic principle is to assume that the study area is divided into several sub-regions and has spatial heterogeneity if the sum of the variance of the sub-regions is smaller than the sum of the variance of the overall study area. The model includes factor detection, interactive factor detection, risk detection, and ecological detection. If an influencing factor has a significant degree of influence on a dependent variable, then the spatial distribution of the influence factor and the dependent variable have similarities. Geodetector can quantitatively determine the dominant factors, and quantifying the influence of two interacting variables on a specific target variable is also an important function of Geodetector.In recent years, many achievements have been made all over the world in the study of spatial heterogeneity and its causes with Geodetector, the factors influencing spatial distribution of soil erosion have been quantitatively analyzed via Geodetector [33], Fang et al. used Geodetector to investigate the stratified spatial heterogeneity between street network metrics at multiple scales and the four components of urban vitality [34], and Zhao et al. used Geodetector to select the predictor variables that truly affect the P M 2.5 spatial distribution prediction [35]. However, no article has been published on the use of Geodetector to assess the livability of village resettlement locations in mining subsidence areas. In general, Geodetector can be implemented for quantitatively analyzing the influence of geographical factors on livability. With the factor detector, a q-statistic is obtained which measures the association between the independent and dependent variables of the Geodetector. In our work, the independent variables are the geographical factors and the dependent variable represents the livability scores obtained by human settlement factors.
In this paper, the village resettlement location selection project in the Dafosi mining area on the Loess Plateau is taken as an example. Using the entropy weight method to weigh the human settlement factors together, the livability of the existing villages was obtained. However, since human settlement factors are only present in the existing villages throughout the potential resettlement location selection study area, to predict the livability of the entire study area it was necessary to establish a model which links livability with geographic factors (Z) to estimate livability for currently unsettled areas. The geographic factors were obtained from various databases and include terrain slope, slope orientation, the shortest distance to a river, the distance from the groundwater level, the shortest distance to the road above the county road level, the shortest distance to a school, the shortest distance to hospitals and clinics, the shortest distance to malls and markets, and the shortest distance to tourist attractions. As some of the geographic factors may not correlate well enough with livability, it is necessary to conduct a correlation analysis and determine driving forces. The relationship between the livability score of existing villages (dependent variable Y) and geographic factors (independent variable Z) was further investigated. Using the Geodetector, the interrelationships of geographic factors were obtained, and the geographic factors with high attribution to livability were filtered out to construct a model of the relationship between livability (Y) and geographic factors (Z) in the coal mining subsidence area of the Loess Plateau. Finally, by using the selected geographic factors, ArcGIS was used for overlay analysis to obtain a geographic livability grading map of the entire resettlement location selection area. In order to ensure that the selected area has enough vacant land for resettlement, the potential resettlement location should avoid the existing villages with excessive housing distribution density, the spatial distribution of settlement houses has to be obtained through remote sensing images, and ArcGIS is used to obtain the kernel density map of each village and to overlay it with the livability grading map in order to get the optimum resettlement location and submit it to the policy-making department of the government for the resettlement location decision.

2. Study Area and Data

The study area was selected to cover an area of approximately 10 km outside of the boundary of the Dafosi coal mine area. This coal mine is located at the border between Bin and Changwu counties in Shaanxi Province, with a total area of approximately 105 km2. It covers the area between 107°47′–108°0′ E and 35°0′–35°5′ N. Regarding the local policy in China, the village resettlement locations cannot cross the scope of county-level administrative regions. Hence, 37 traditional villages in a 10 km radius around the Dafosi coal mine subsidence area on the Loess Plateau were selected, as shown in Figure 1.
The study area is a typical hilly gully landscape. The terrain is undulating and the elevation varies from 750 m to 1270 m. The average elevation of the groundwater is about 700 m. The area has a semi-arid climate with an average annual precipitation of 560 mm. Fractional vegetation cover is at a medium level, grassland and arable land have the largest occupation.
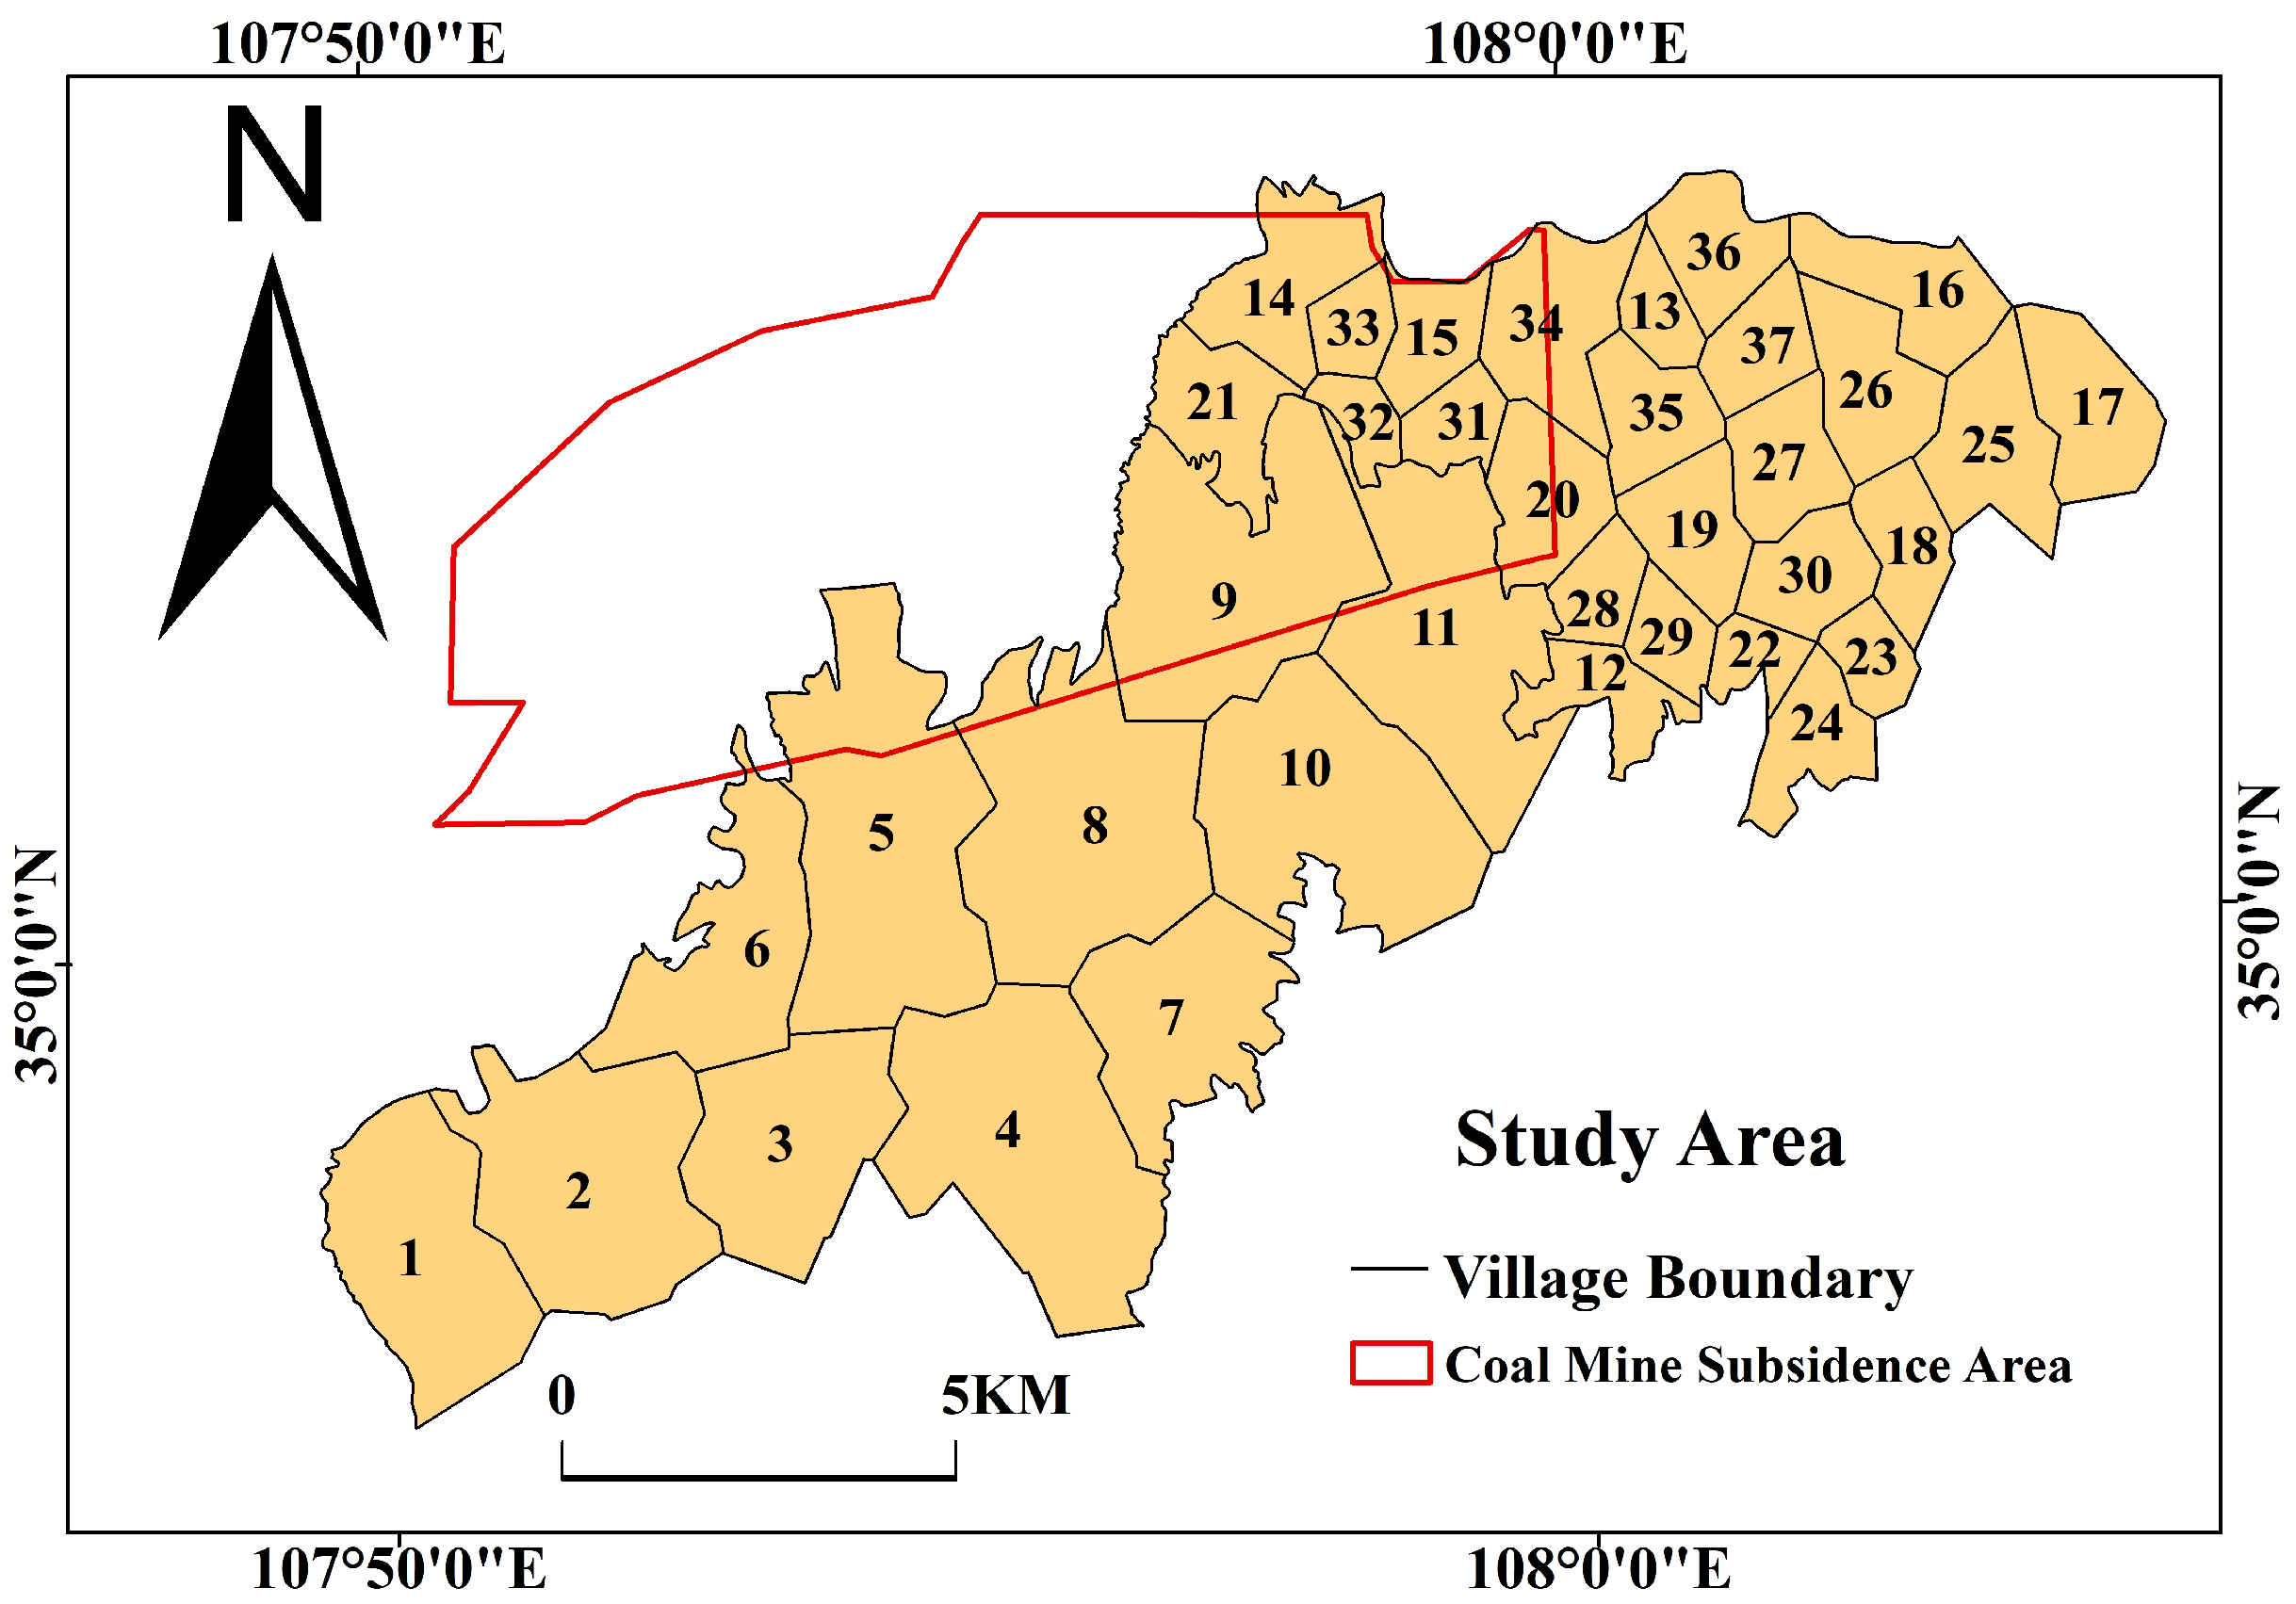
The annual coal production of the Dafosi mine is 8 million tons, the No. 4 coal at the depth of 350–450 m is the main mining layer, with an average mining thickness of 9 m, and the long-walled working face mining technique is applied [36]. After mining, an obvious collapse area has appeared on the terrain, and the maximum ground subsidence in the collapse area will exceed 3 m. The evaluation of the livability of the resettlement area selection must be made in advance. According to the mining production plan, 16 adjacent working faces will be mined in the 10 years from 2021 to 2030, with a total area of about 12 km2. According to the basic principle of mining subsidence, the surface collapse area caused by underground face mining is located directly above the mining area, but its scope is significantly larger than the area of the mining location [37]. To successfully resettle all the villages from the collapse area to the newly selected area in advance, the authors of this paper were commissioned by the Dafosi Mining Company to identify areas suitable for resettlement. The company participated in a research project on the livability of the village resettlement location selection area in this mining area. The village number in the study area and the range of the coal mine collapse region where the villages resettlement needs to be implemented are shown in Figure 2 below. All villages overlapping with the red area have to be resettled within the black areas outside of the red area.
According to the site investigation, a total number of 63 families within the coal mining collapse area must be resettled. According to the new rural planning requirements formulated by the local government, the resettlement area should cover more than 0.1 × 10 6 m2.

3. Methods

3.1. Data Sources and Processing

Among the geographic factors, terrain slope and slope orientation data were obtained from an Advanced Land Observing Satellite (ALOS) digital elevation model (DEM) at a spatial resolution of 12.5 m (download at https://search.asf.alaska.edu/, accessed on 15 May 2022); surface water system data were obtained from the National Basic Geographic Information Center (download at http://www.ngcc.cn/ngcc/, accessed on 15 May 2022); underground water system data were obtained from Groundwater Resource Information Service Network (http://www.groundwater.cn/, accessed on 15 May 2022). The vectorized maps of 37 villages were obtained through the API address resolution method of Baidu Maps; the population data were obtained from the China County Statistical Yearbook 2019; the arable land area, house area, and vegetation coverage were inferred from Landsat 8 remote sensing images to extract the arable land, house area, and Normalized Difference Vegetation Index (NDVI) factor of each village. The above remote sensing images were downloaded from https://earthexplorer.usgs.gov/, accessed on 15 May 2022; traffic data (railroads, highways, national highways, etc.) were obtained from the National Earth System Science Data Center and downloaded from http://www.geodata.cn/, accessed on 15 May 2022). Vector data of schools, hospitals, tourist sites, procurement sites, livestock breeding areas, etc. in the study area were obtained from the rivermap webpage (www.rivermap.cn, accessed on 15 May 2022). Based on other references as well as the China Development Plan and the results of 300 questionnaires, we divided the human settlement factors into five major categories and ten subcategories. All of the human settlement factors are listed in Table 1.
With respect to the geographical factors, we assumed that terrain slope affects the site area building layout and land remediation costs as well as sunshine hours, solar radiation intensity, building orientation, and ventilation conditions. The surface water system affects agricultural irrigation conditions; the groundwater level affects the convenience of drilling wells for drinking water for rural residents, and the distance of the site from traffic arteries, schools, hospitals, and shopping malls directly affects the convenience of residents’ life and relocation costs. The proximity of the site to tourist attractions has an important impact on the subsequent job opportunities and income of the residents. Therefore, in this paper, nine geographic factors are selected as independent variables for detection: the slope factor ( Z 1 ), slope orientation factor ( Z 2 ), distance to surface water system factor ( Z 3 ), groundwater level factor ( Z 4 ), transportation accessibility factor ( Z 5 ), education resource accessibility factor ( Z 6 ), medical resource accessibility factor ( Z 7 ), procurement radius factor ( Z 8 ), and tourism resource accessibility factor ( Z 9 ). The calculation method for each factor is shown in Table 2.

3.2. Roadmap

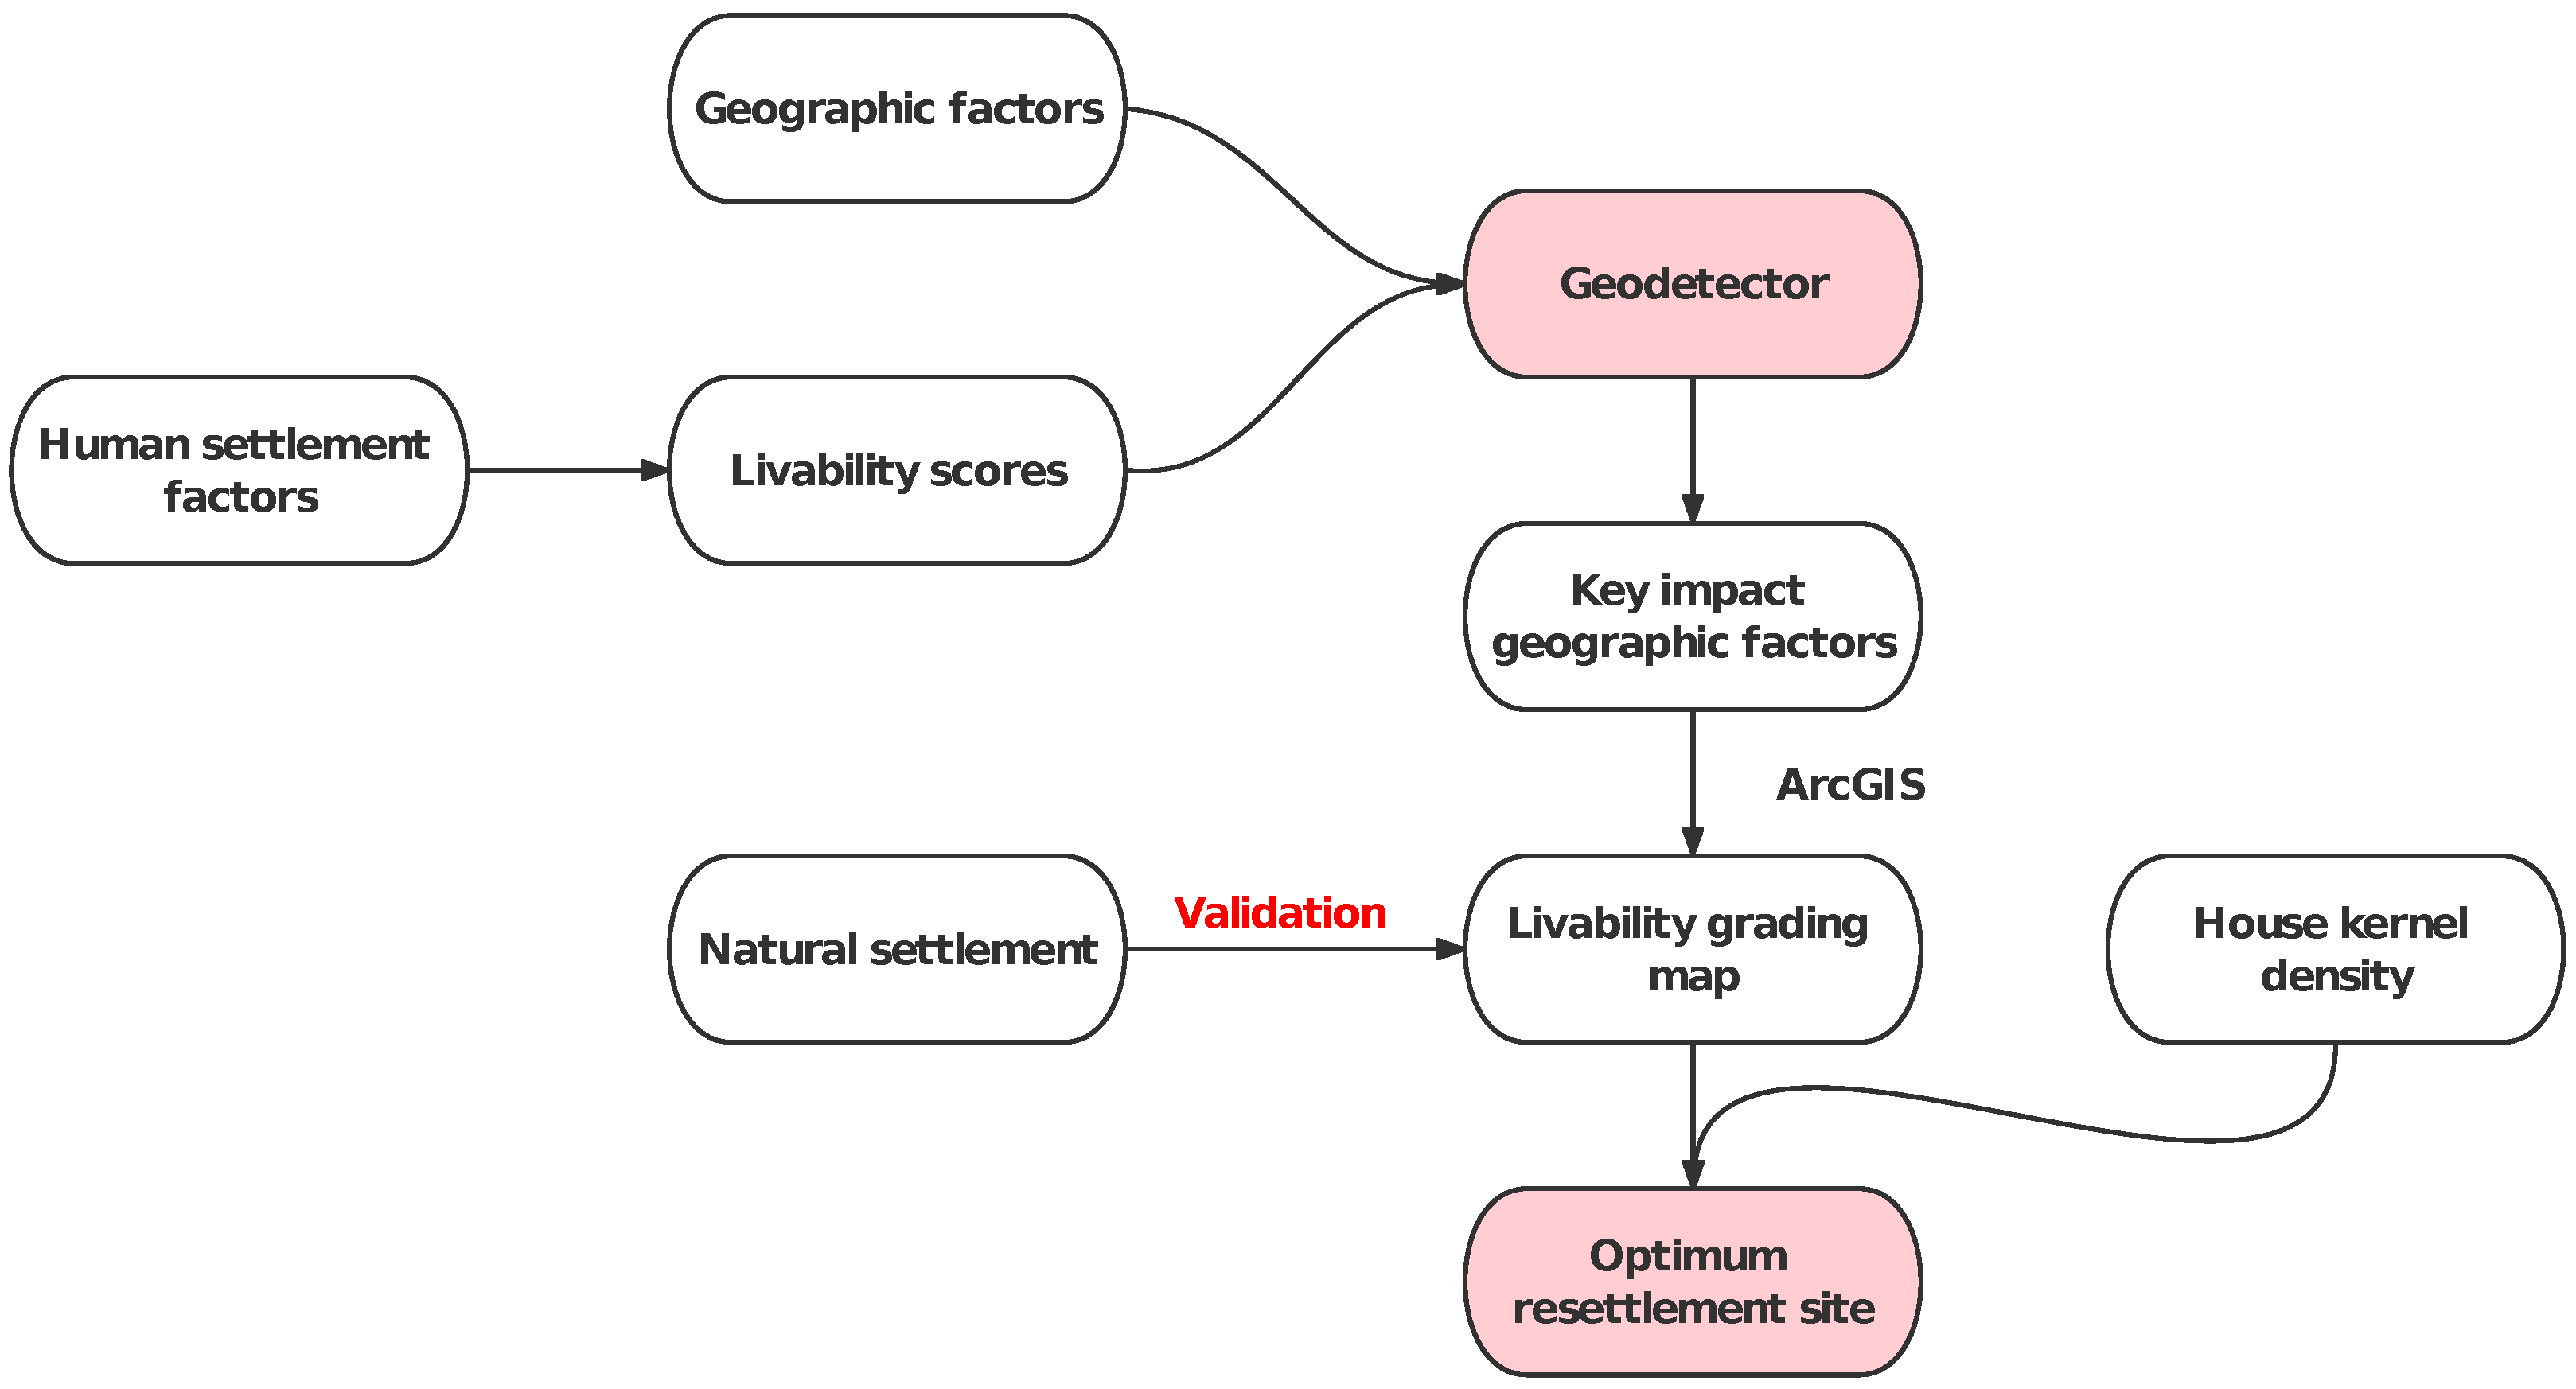
For the 37 villages in the study area, based on other articles as well as the China Development Plan and the results of 300 questionnaires, the human settlement factors (X) for the five aspects of the living environment, ecological health, infrastructure, public facilities, and economic development were selected to establish the evaluation system of the livability of each natural village in the study area. Based on the actual data collected, the livability of each village was evaluated using the entropy weight method. The study area was gridded to form regular grid points, and nine geographic factors including terrain slope, slope orientation, water system, groundwater level, roads, schools, medical points, shopping points, and tourism points were overlaid with the grid points in GIS. Then, the data were added to the grid points after buffer analysis and discretization in ArcGIS, and the impact of a single factor, as well as multi-factor overlay on livability, was detected using Geodetector to obtain the ranking of the impact of each geographic factor. The geographic factors with greater influence were selected, and after overlay analysis, the graded map of livability was calculated by the joint function. The grading map is overlaid with the kernel density map of houses in the study area, and the resettlement location selection area with a reasonable livability score and area is selected. We also validated the method by introducing 184 natural settlements and comparing them with the livability grading map obtained from ArcGIS, and found that only 8 natural settlements do not belong to high livability areas. The accuracy of the model reached 95.65%. The technical route map of the study is shown in Figure 3.

3.3. Entropy Weight Method

Originally derived from the thermodynamic concept in physics, entropy mainly reflects the degree of the chaos of a system and is now widely used in research fields such as sustainable development evaluation and socioeconomics. In information theory, entropy is a measure of the degree of the chaos of a system, while information is a measure of the degree of order, and the two are equal in absolute value and opposite in sign. In the index data matrix, X = x i j n × m , which is composed of n schemes to be evaluated and m evaluation factors, the greater the dispersion of the data, the smaller the information entropy, the greater the amount of information provided, the greater the influence of the indicator on the comprehensive evaluation, and the greater the weight should be. The entropy weight method to determine the index weights can overcome the randomness and guessing problems that cannot be avoided by the subjective assignment method, and can also effectively solve the problem of overlapping information among multiple variables. The entropy weight method is more objective than the AHP.
A livability evaluation model was established for 37 villages in the study area, and the weight was determined by the entropy weight method. The advantage of this method is that the weight is determined according to the variability of the human settlement factors, which is more objective than AHP. The process of determining the factor weight by the entropy weight method is as follows:
Normalizing the data for each factor, assuming that the factor after Normalization is Y i j , then
Y i j = x i j min ( x i ) max ( x i ) min ( x i ) .
According to the definition of information entropy in information theory, the information entropy of a set of data is as follows:
E j = 1 ln n i = 1 n p i j ln p i j ,
where p i j = Y i j / i = 1 n Y i j , if p i j = 0 , then lim p i j 0 p i j ln p i j = 0 .
According to the calculation formula of information entropy, the information entropy of each factor is calculated as E 1 , E 2 , , E n . Calculating the weight of every factor via information entropy:
w i = 1 E i k E i i = 1 , 2 , , n .
The livability of each village in the study area is measured by combining the normalized values of each factor, and the calculation formula is
Y i = i = 1 n w i p i j .
In this paper, combining the national conditions of China and the characteristics of the regional human settlement geography of the Loess Plateau, the data set for the evaluation of the livability of each village was established from 10 human settlement factors and 5 aspects of the living environment, ecological health, infrastructure, public facilities, and economic development level, which are of concern to rural residents, as shown in Table 1.

3.4. Geodetector

Geodetector is a statistical tool to measure Spatial Stratified Heterogeneity (SSH) which represents the phenomenon that the within-strata are more similar than the between-strata.
The three software modules of the Geodetector, factor detector, interaction detector, and ecological detector, were used to analyze the driving forces and quantitatively attribute the livability of the study area.
The factor detector is used to detect the SSH of the study area and the driving force of a geographic factor on the livability of the study area, measured by the q-statistic, with a value range of [ 0 , 1 ] . The expressions are
q = 1 S S W S S T = 1 h = 1 L N h σ h 2 N σ 2 ,
where the strata of variable Y or factor X are classification or partitioning; N h and N are the numbers of elements in strata h and the whole area, respectively; S S W means within the sum of squares, S S T means the total sum of squares. For the value of the q-statistic, larger values indicate a more pronounced SSH of Y. If the strata are generated by independent variable X, then a larger value of q indicates a stronger explanatory power of the independent variable X for attribute Y, and vice versa. For the livability evaluation problem, the q value indicates the strength of the explanation of the degree of SSH of the dependent variable (livability) by the influence factor.
The interaction detector reveals whether the risk factors X 1 and X 2 (and more X) have an interactive influence on a response variable Y, i.e., the amount of change in livability under the joint action of impact factor X 1 and X 2 . The types of X 1 and X 2 interactions are shown in Table 3.
The ecological detector identifies the difference of the impacts on the livability between different influencing factors. The variance calculated for each subregion divided by one determinant is compared with the variance calculated for the region divided by another determinant. The expression is as follows:
F = N X 1 N X 2 1 S S W X 1 N X 2 N X 1 1 S S W X 2 ,
where N X 1 and N X 2 denote the number of samples of factor X 1 and X 2 , respectively; S S W X 1 and S S W X 2 denote the sum of variance of strata formed by X 1 and X 2 within the same strata, respectively.
The village livability scores in the study area (Y) were used as the dependent variable and the nine geographic factors (Z) were used as independent variables. Since the dependent variable in the Geodetector is a numerical quantity and the independent variable is categorical, the independent variable needs to be discretized when it is a numerical quantity and transformed into a categorical variable using classification. To obtain relatively better classification results, this paper uses a combination of expert experience and the natural breakpoint method to classify the independent variables:
p i = 1 n π R 2 j = 1 n K j 1 D i j 2 R 2 2 ,
where K j is the housing density of each village; D i j is the distance between village i and village j; n is the number of villages in the range of bandwidth R. R is the regular regional bandwidth, whose value should consider the actual distribution among natural villages in the Loess Plateau habitat environment, and in this paper, after experimental comparison and analysis, R = 1000 m was selected as the bandwidth. The regular sampling points were generated in ArcGIS (v10.2; Esri, Redlands, CA, USA) as the input data of kernel density estimation. The larger the calculated value of p i , the higher the density of village houses near i. The selection of resettlement locations should avoid areas with a high density of village houses.

4. Results

4.1. Evaluation of the Livability of Each Village and Its Results

According to the information from the China Shaanxi Rural Economic and Social Development Yearbook and field survey data, the corresponding factor values of 37 villages were obtained. They were then normalized by the maximum value of a certain factor value in the study area, so that the factor value of X 1 X 10 corresponding to each village is between 0 and 100. The information entropy of X 1 X 10 was further calculated, defined as E 1 E 10 , and the results are shown in Table 4.
According to the information entropy in Table 4, according to Equation (3), the weights w 1 , w 2 , …, w 10 of each factor were calculated, and the results are shown in Table 5.
From the weight values of each factor in Table 5, it can be seen that the five human settlement factors of living area per capita ( X 1 ), population density ( X 2 ), road area per capita ( X 5 ), arable land area per capita ( X 9 ), and the proportion of villagers engaged in the coal industry ( X 10 ) have larger weight values, indicating that these five factors have the most significant impact on the livability of villages.
According to Equation (4), the livability of each village in the study area was calculated, and the results are shown in Table 6, which shows that the villages can obtain a relatively high livability score. It is reasonable that the villages in this area must be built in a relatively livable location. Due to the smaller scale of our study area, although the livability scores are closer, the data accuracy will be higher and the factor data are very accurate, almost error-free.
In Table 6, the villages with higher livability are Village No. 28, No. 26, No. 27, and No. 30, which have larger living areas per capita, medium population density, better road hardening in the village, convenient traffic conditions, larger arable land per capita for villagers, a large proportion of villagers engaged in the coal mining industry, and higher income per capita.

4.2. Results of Quantitative Attribution Detection of Village Livability

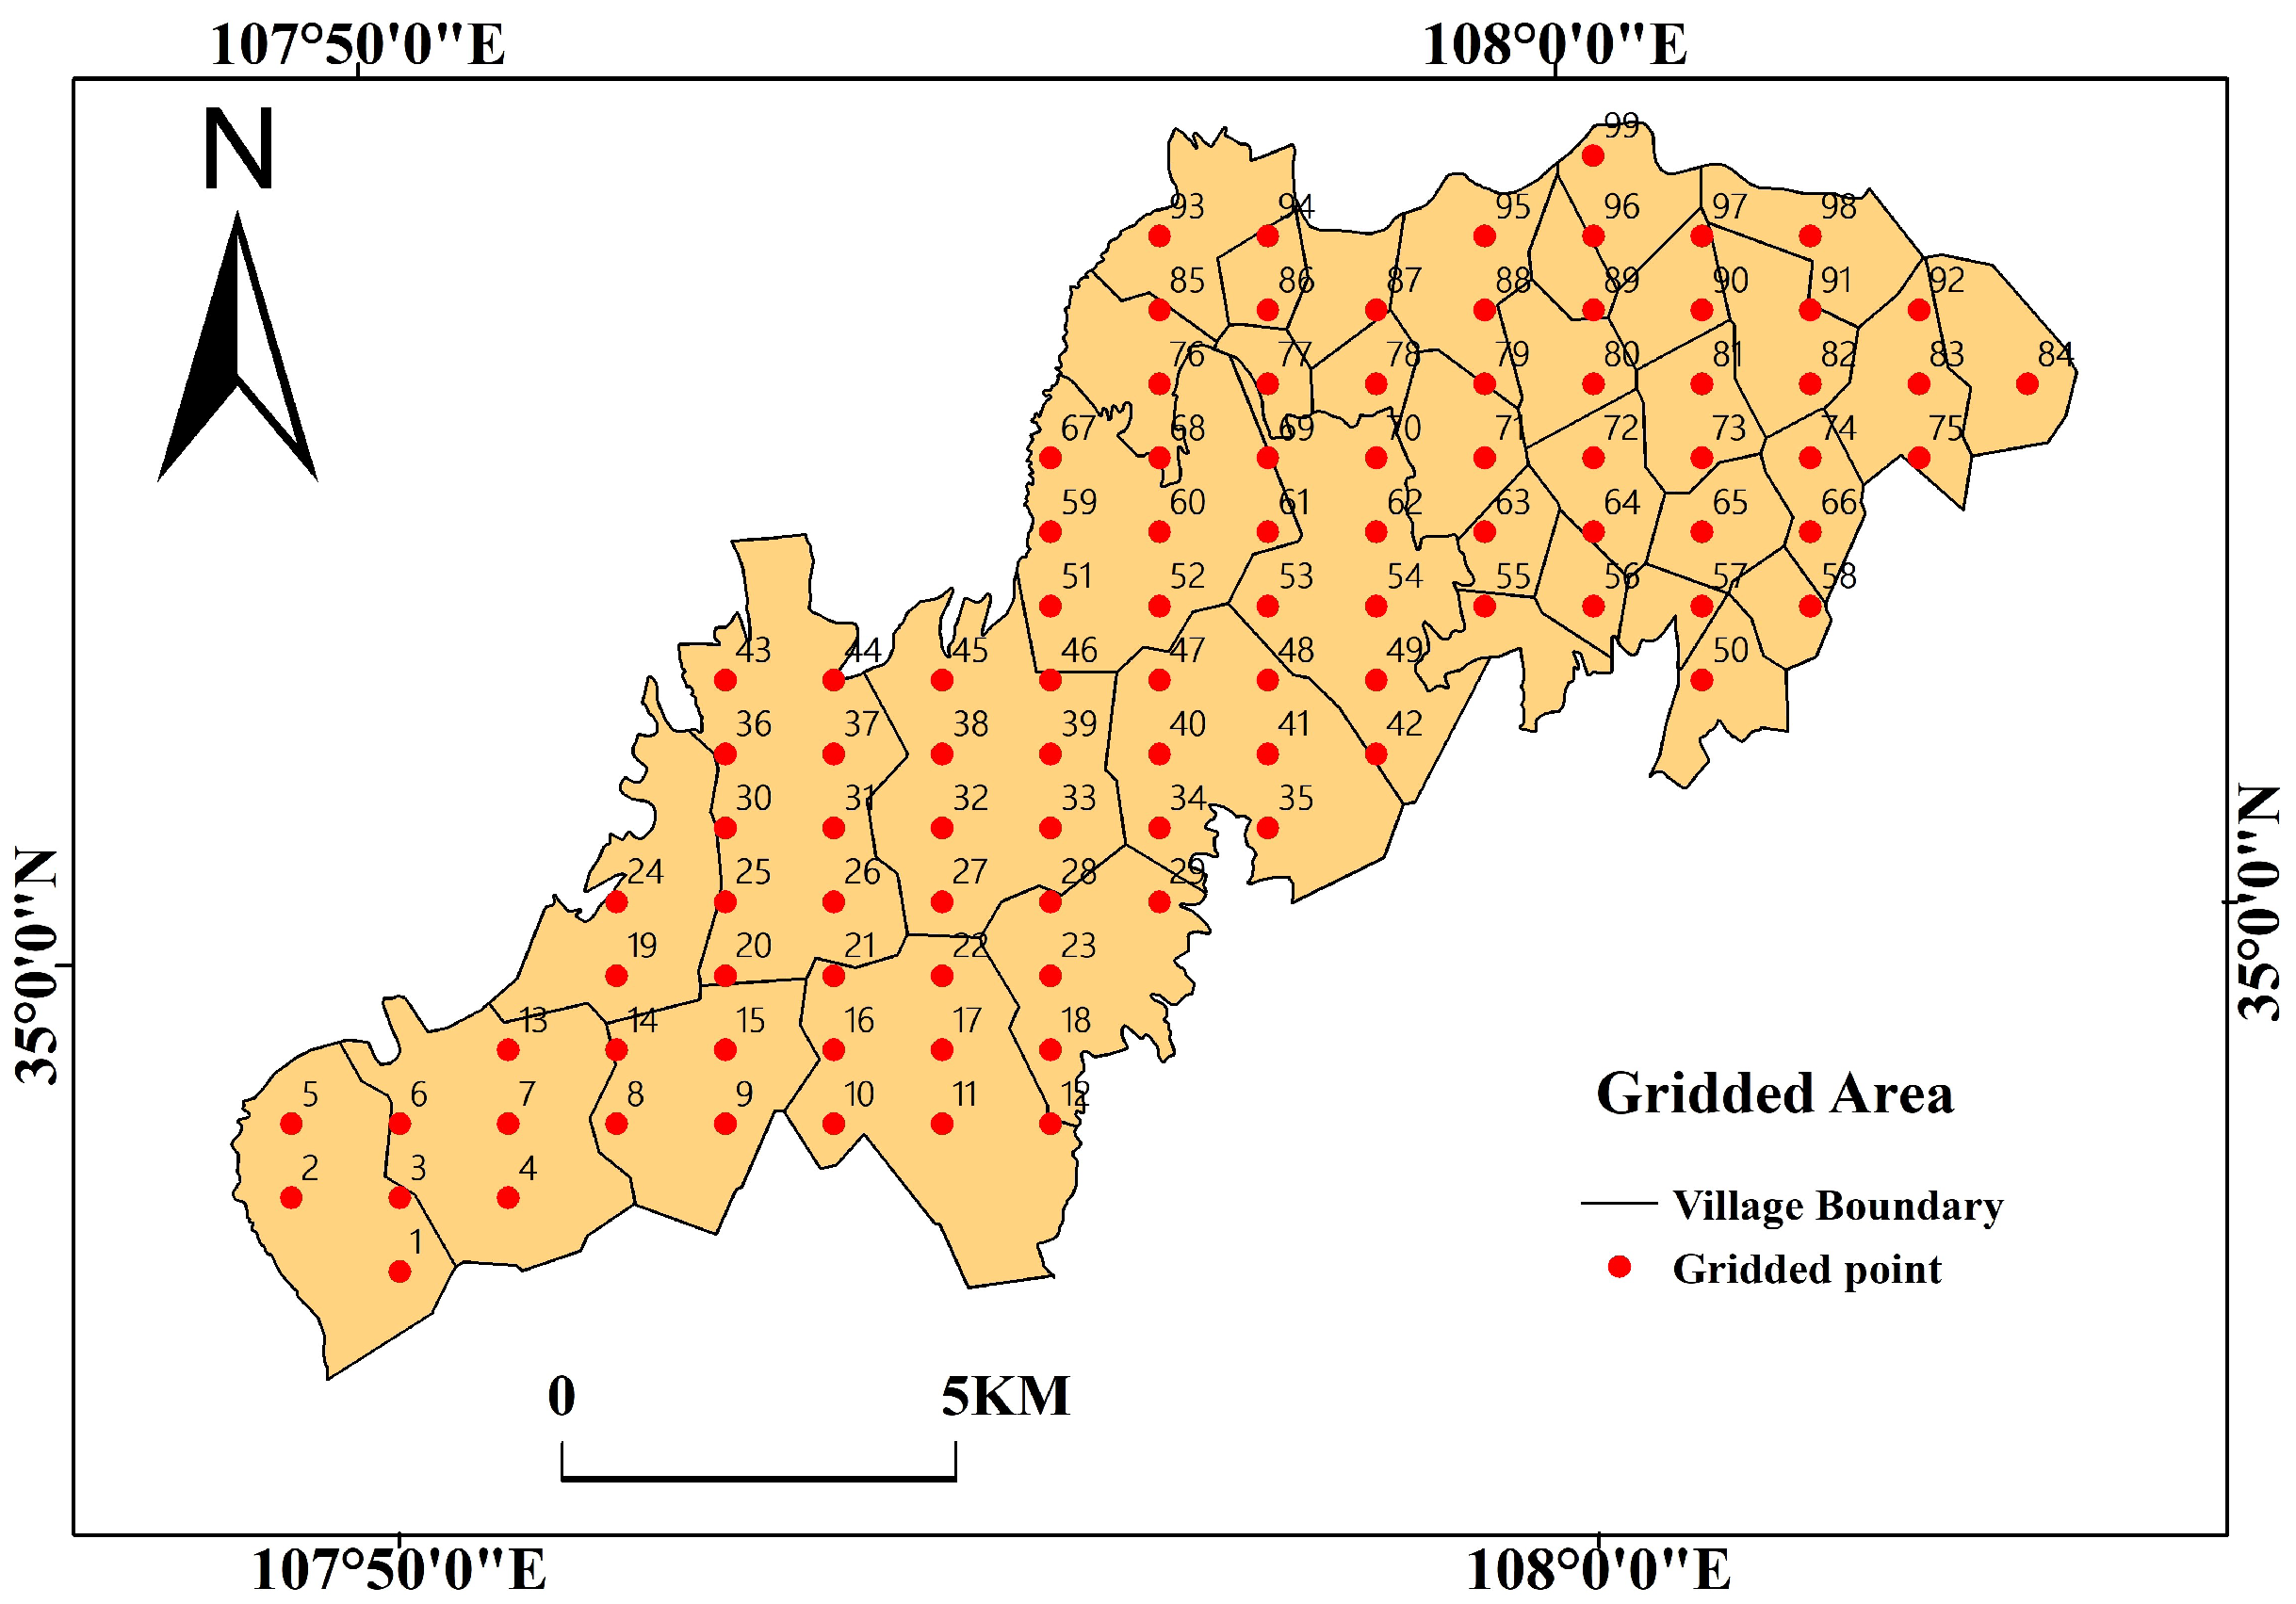
Driving force analysis and quantitative attribution of village livability in the study area were performed with the help of the Geodetector. To spatially match the dependent variable (Y) with the independent variable (Z), the livability (Y) of each village obtained above was uniformly spatially discretized, then superimposed and gridded with the geographic factor (Z), and the (Y,Z) of each gridded point was extracted. The grid density was set to 1378 m horizontally and 940 m vertically, with 99 grid points, considering the balance of overlay accuracy and efficiency, as shown in Figure 4.
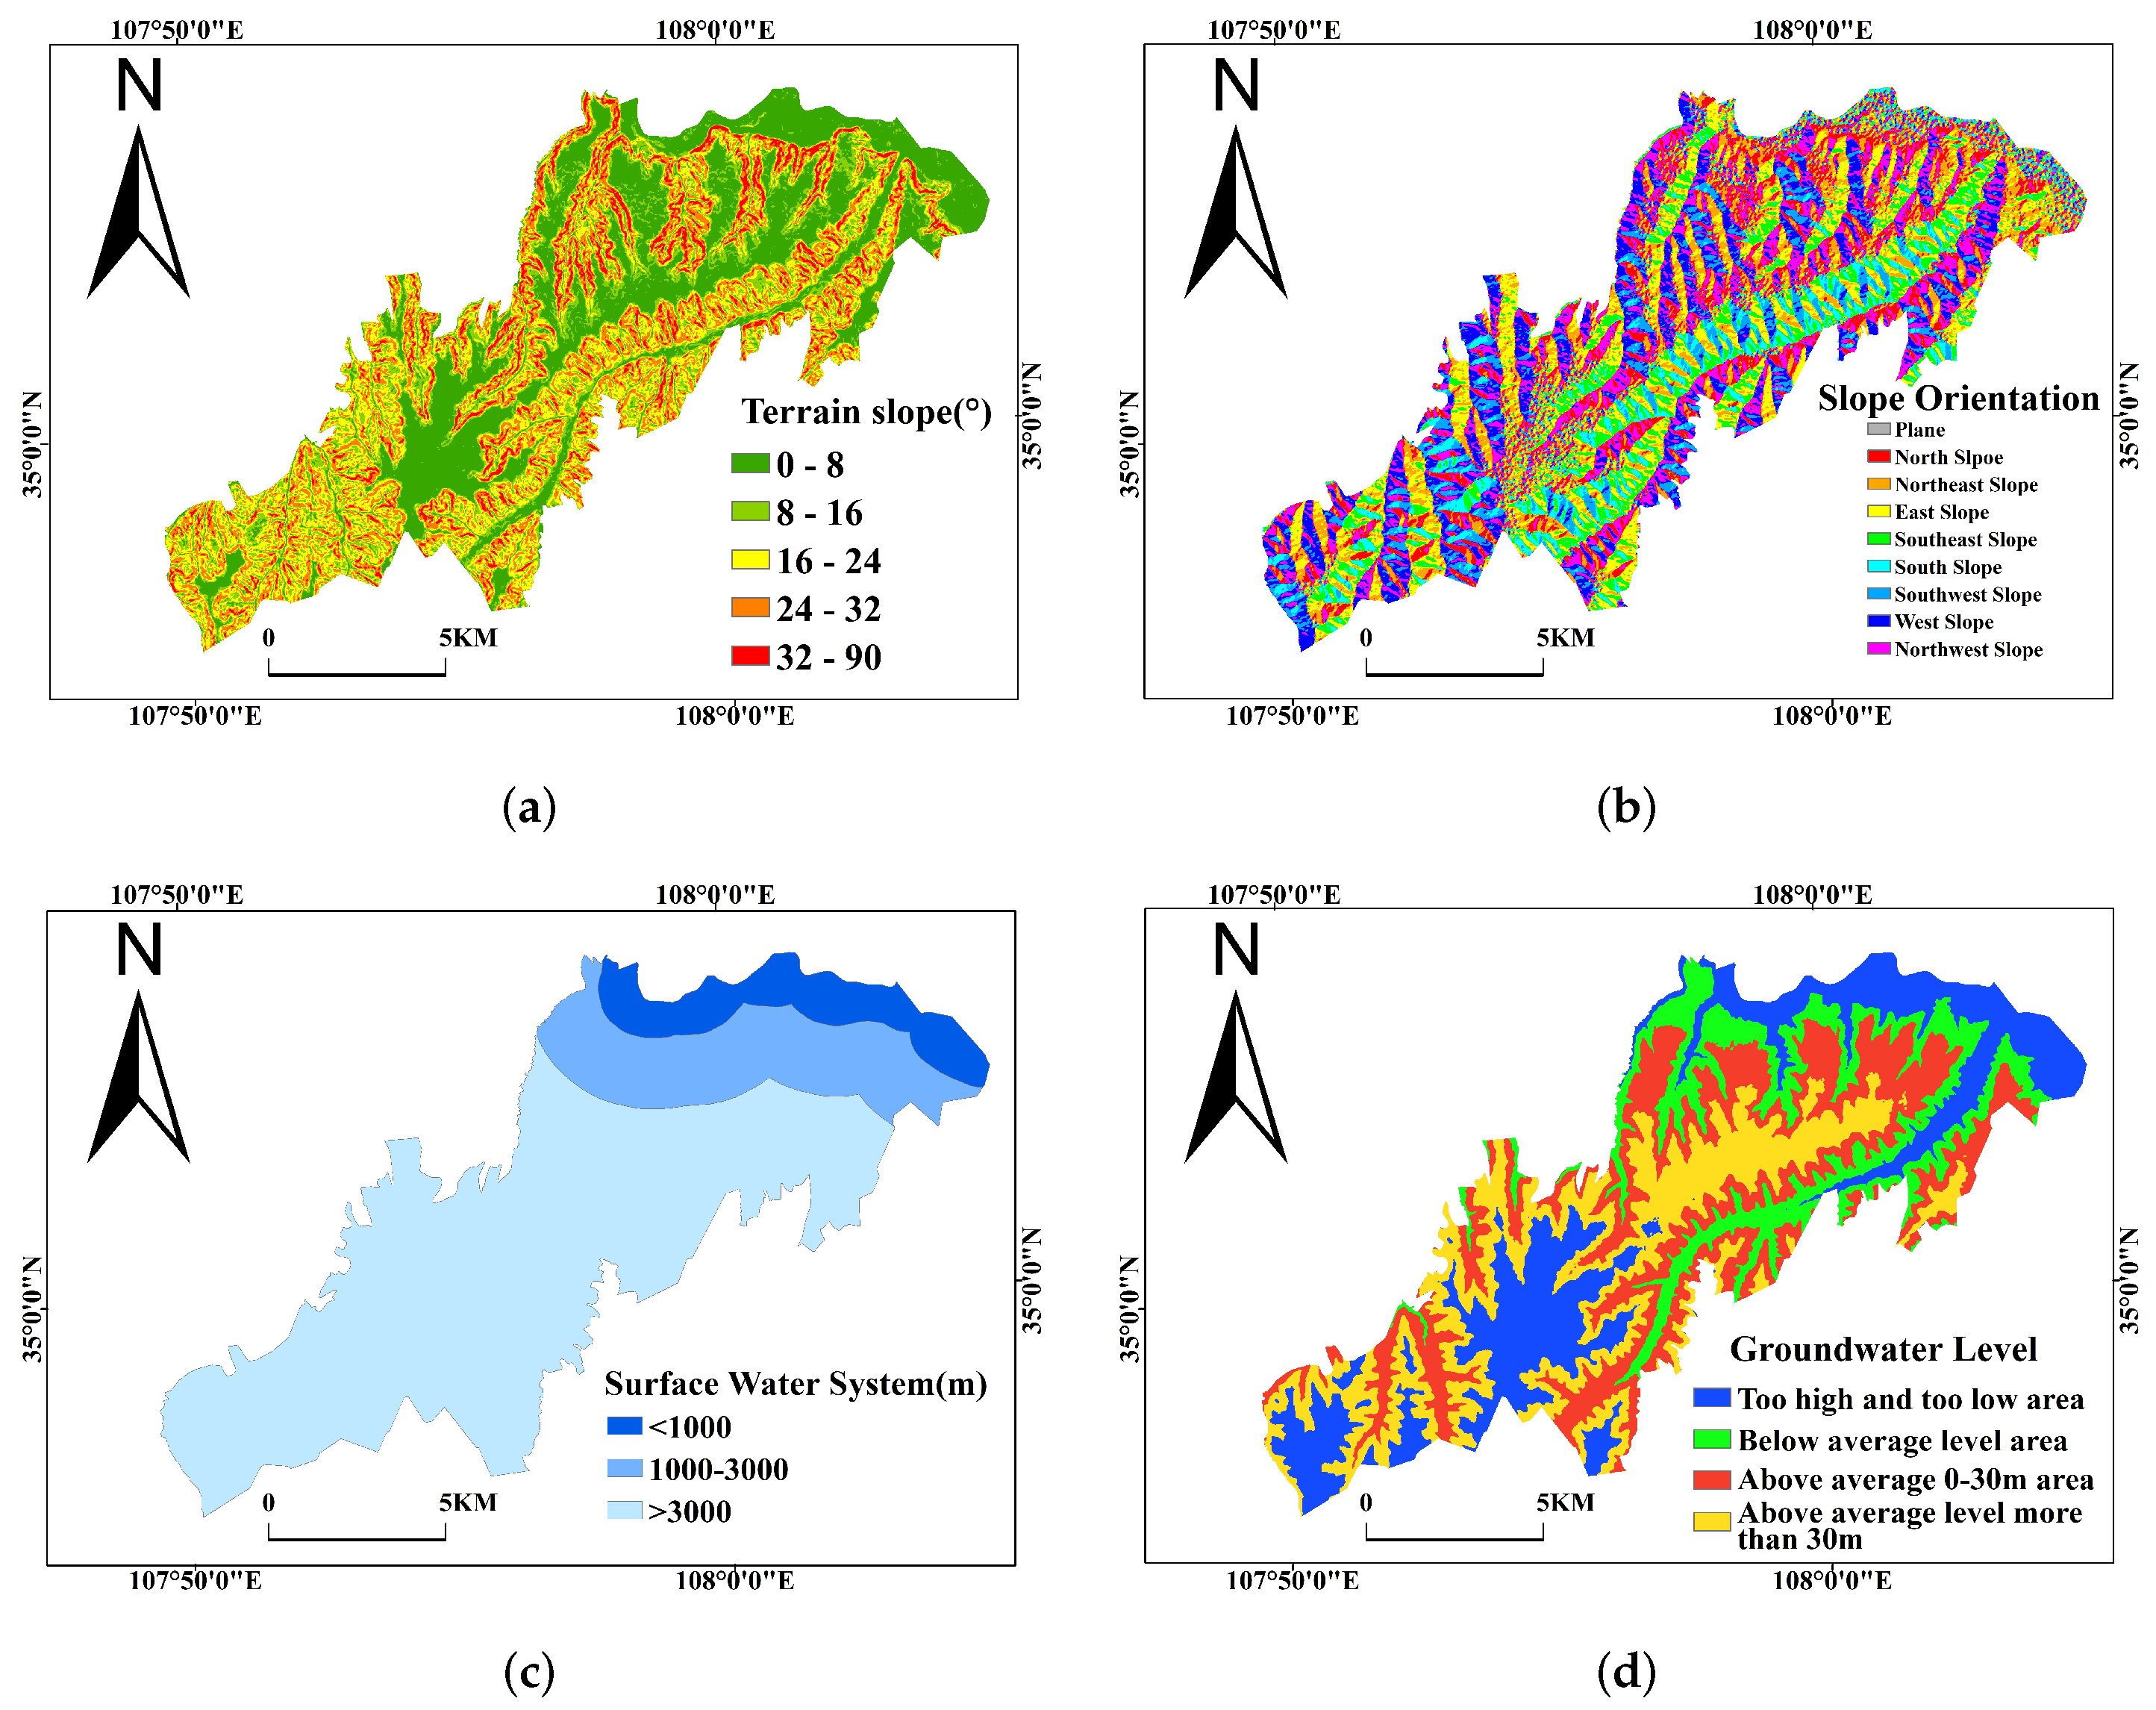
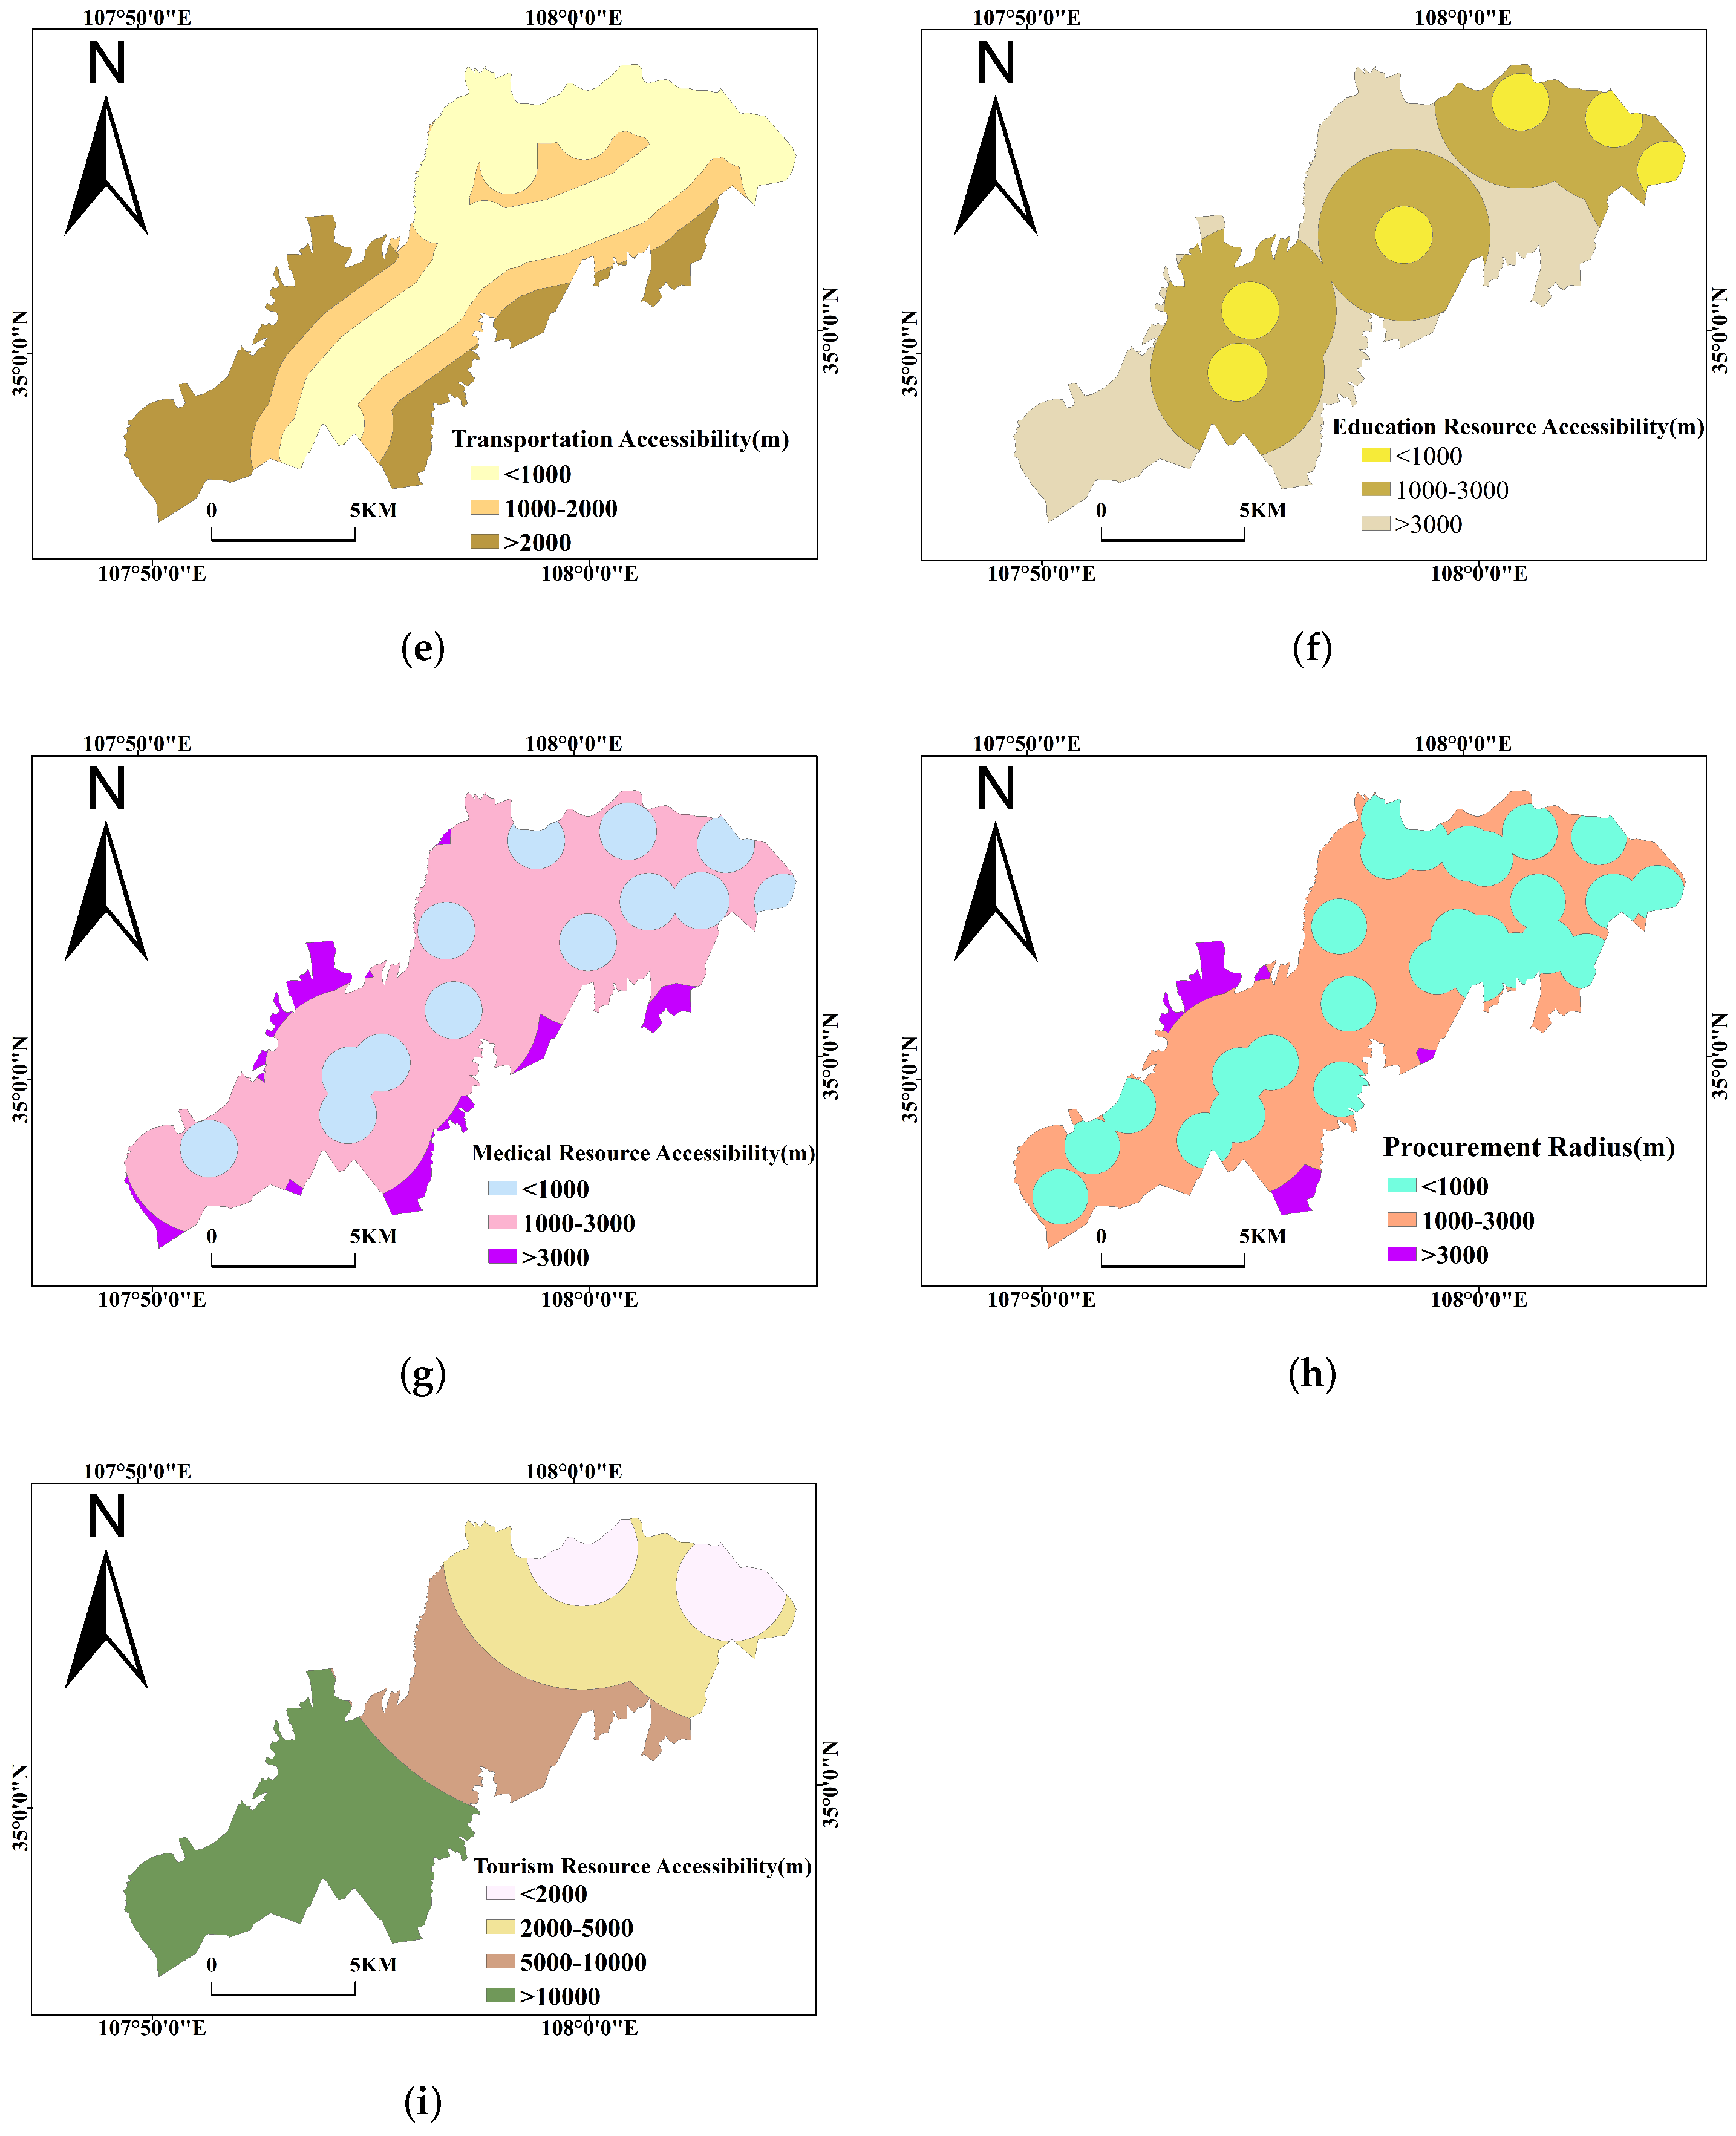
The data of the nine geographic factors ( Z 1 Z 9 ) were subjected to buffer analysis in ArcGIS 10.2 to obtain the distribution of each factor, as shown in Figure 5. The values of each factor type were further assigned to 99 grid points.
The factor detection module of the Geodetector was used to calculate the correlation coefficient q-statistic of the livability of each village with the geographic factor, as shown in Table 7.
The results show that the q-statistics for accessibility to tourism resources ( Z 9 ), accessibility to medical resources ( Z 7 ), procurement radius ( Z 8 ), and accessibility to transportation resources ( Z 5 ) were significantly greater than for terrain slopes ( Z 1 ), groundwater level ( Z 4 ), accessibility to educational resources ( Z 6 ), surface water system ( Z 3 ), and slope orientation ( Z 2 ). The correlation between these four geographic factors and the livability of villages in the study area is high.
The correlations between the nine geographic factors were detected using the interaction detector, and the correlation coefficient values of the interactions between the geographic factors were obtained, as shown in Table 8.
In Table 8, the five pairs of geographic factors with the highest interaction correlation are transportation resource accessibility ( Z 5 ) ∩ procurement radius ( Z 8 ), with a value of 0.330; slope ( Z 1 ) ∩ access to tourism resources ( Z 9 ), with a value of 0.298; slope ( Z 1 ) ∩ access to medical resources ( Z 7 ), with a value of 0.296; slope orientation ( Z 2 ) ∩ access to medical resources ( Z 7 ), with a value of 0.289; and slope ( Z 1 ) ∩ slope orientation ( Z 2 ), with a value of 0.287, and all of them are nonlinearly enhanced.
The correlation between each geographic factor and the spatial distribution of livability was analyzed using an ecological detector, and the calculated results are shown in Table 9.
In Table 9, Y denotes a significant difference and N denotes no significant difference. Among them, the correlations between slope orientation ( Z 2 ) and groundwater level ( Z 4 ), slope orientation ( Z 2 ) and accessibility of educational resources ( Z 6 ), slope orientation ( Z 2 ) and accessibility of medical resources ( Z 7 ), groundwater level ( Z 4 ) and accessibility of medical resources ( Z 7 ), groundwater level ( Z 4 ) and accessibility of medical resources ( Z 7 ), as well as groundwater level ( Z 4 ) and procurement radius ( Z 8 ) are not significantly different from the spatial distribution of livability; the correlations between the remaining geographic factors and the spatial distribution of livability are significantly different. Combined with the factor detection results, four geographic factors, namely, accessibility to tourism resources ( Z 9 ), accessibility to medical resources ( Z 7 ), purchasing radius ( Z 8 ), and accessibility to transportation resources ( Z 5 ), have significant correlations with the spatial distribution of livability.

4.3. Resettlement Location Selection Result

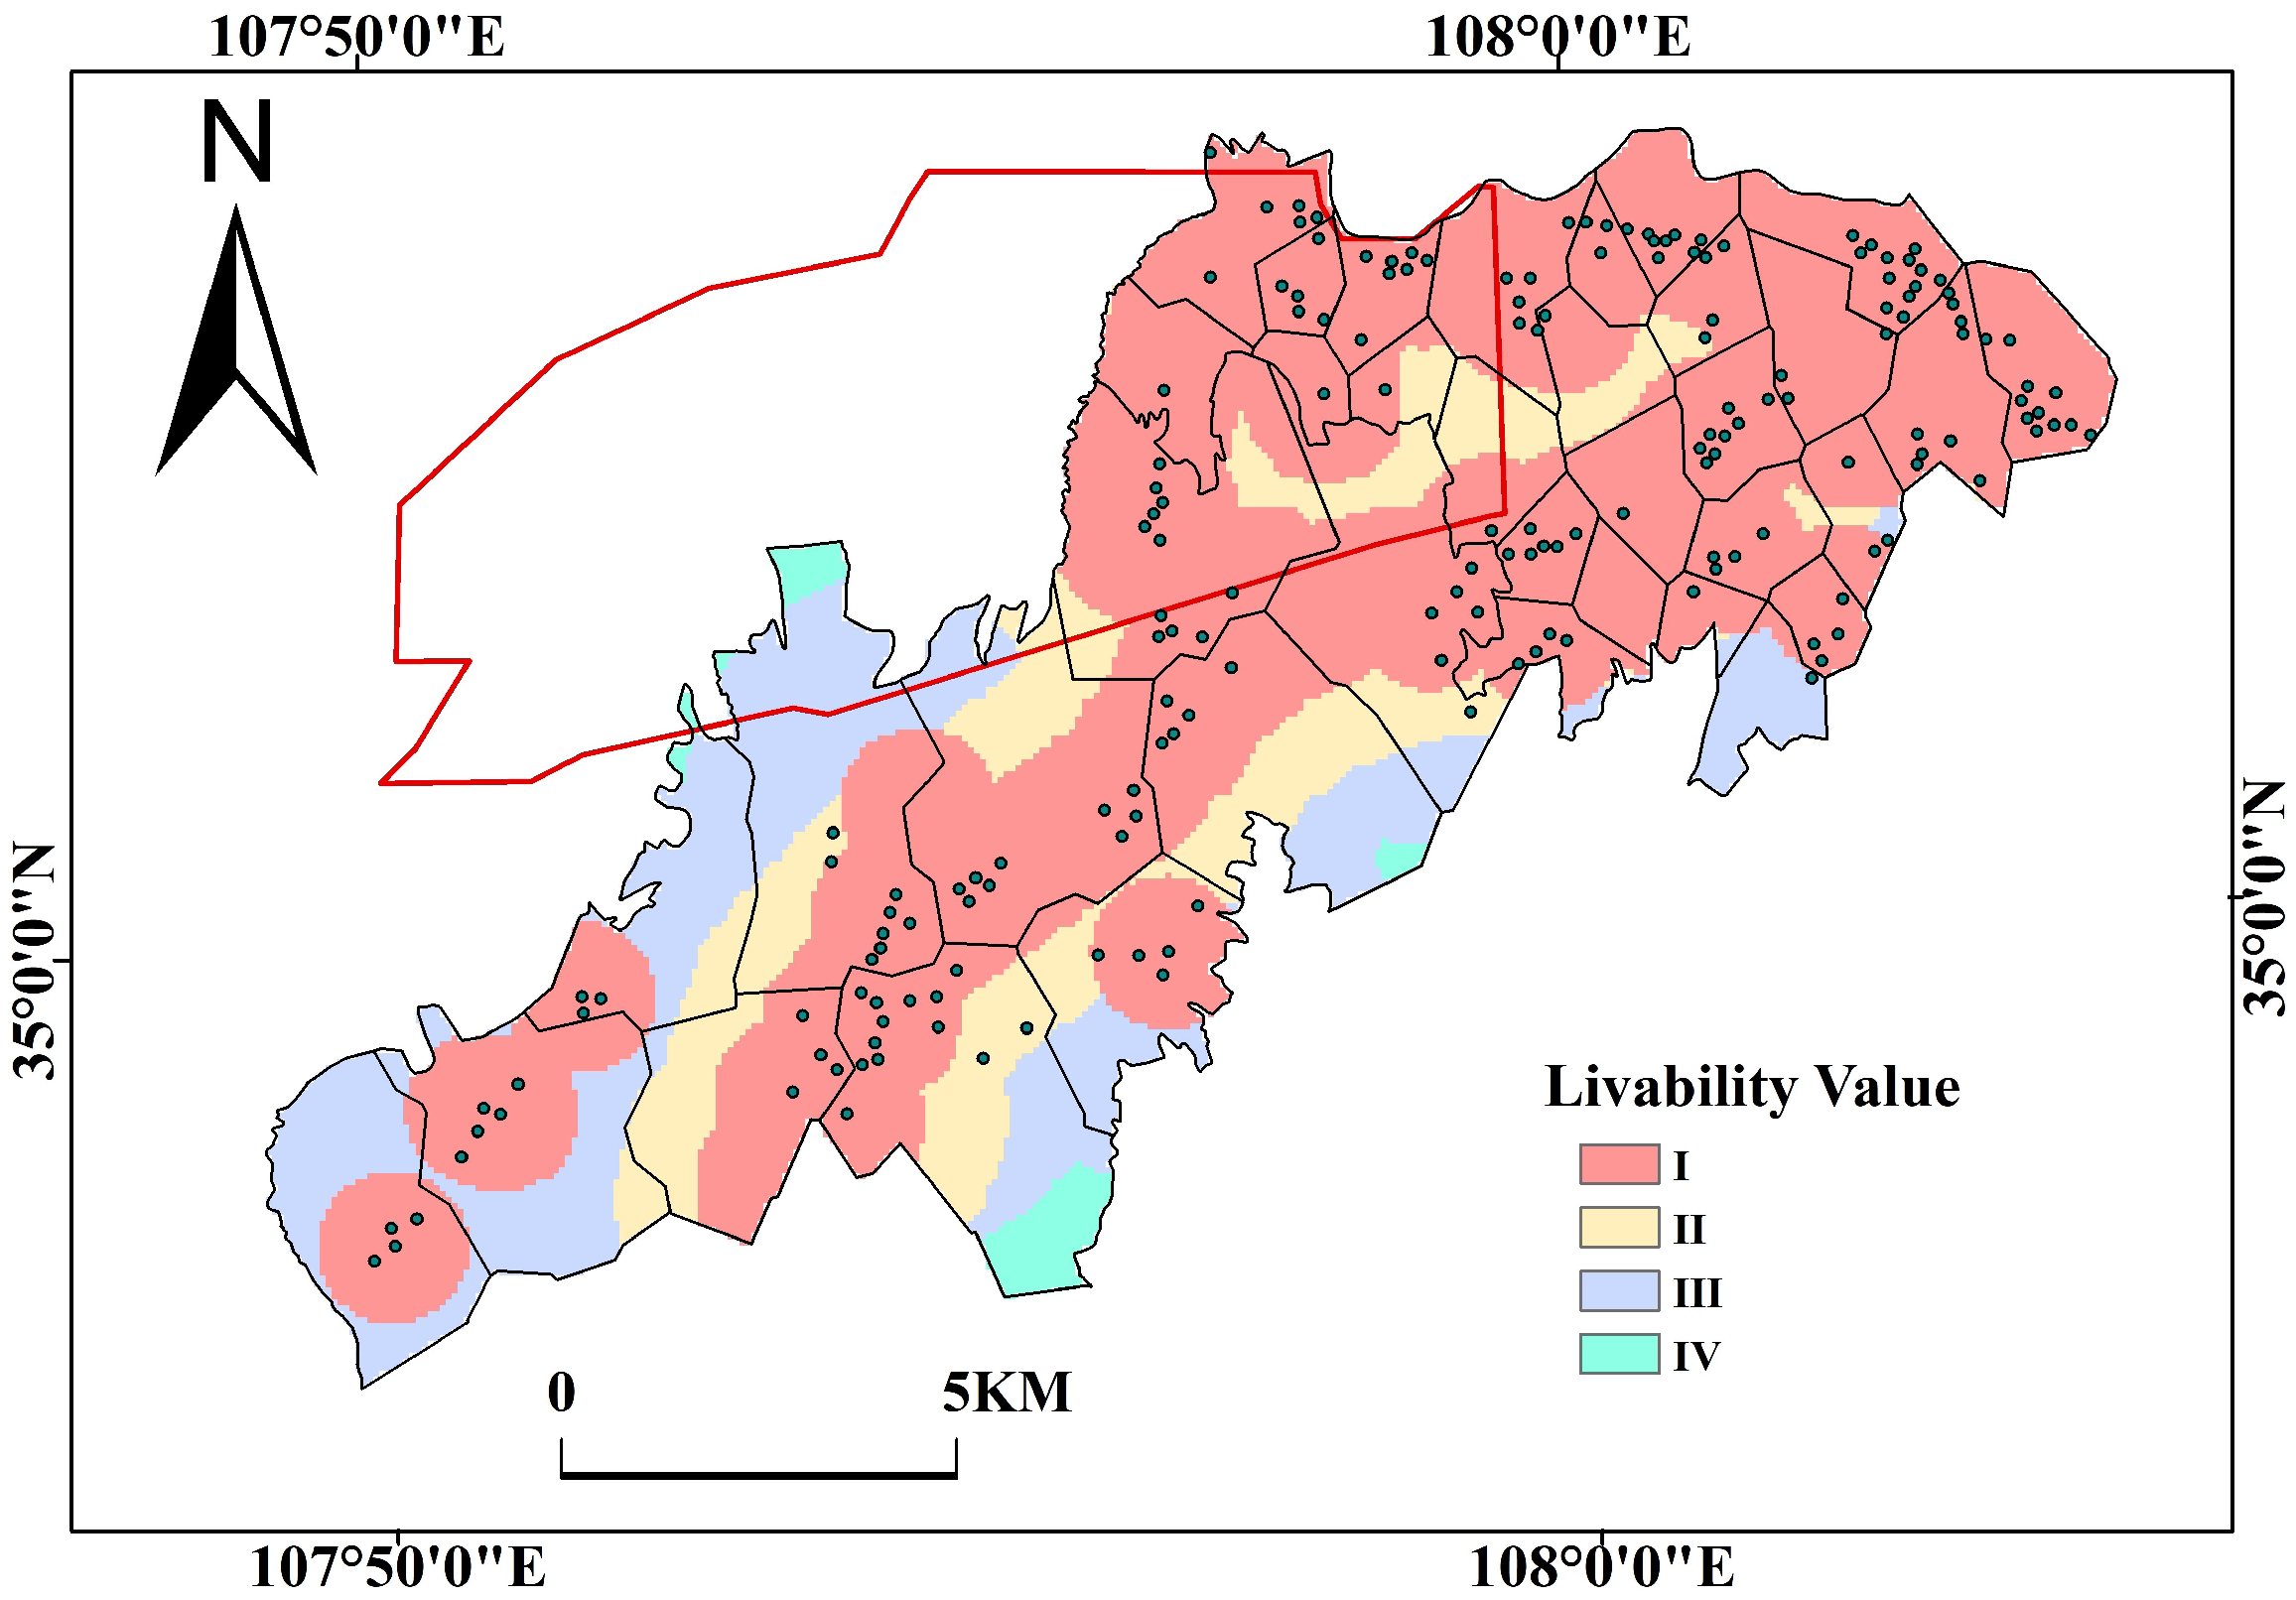
The four main geographic factors, accessibility to tourism resources, accessibility to medical resources, procurement radius, and accessibility to transportation resources, were analyzed in ArcGIS in order of their q-statistic in a weighted overlay to obtain a geographic livability grading map, which was divided into the four levels of 1, 2, 3, and 4. The weighted overlay was implemented in ArcGIS based on different factor q-statistics, using the tools of reclassification and raster calculator to complete the weighted overlay. According to the livability score from high to low, the results are shown in Figure 6.
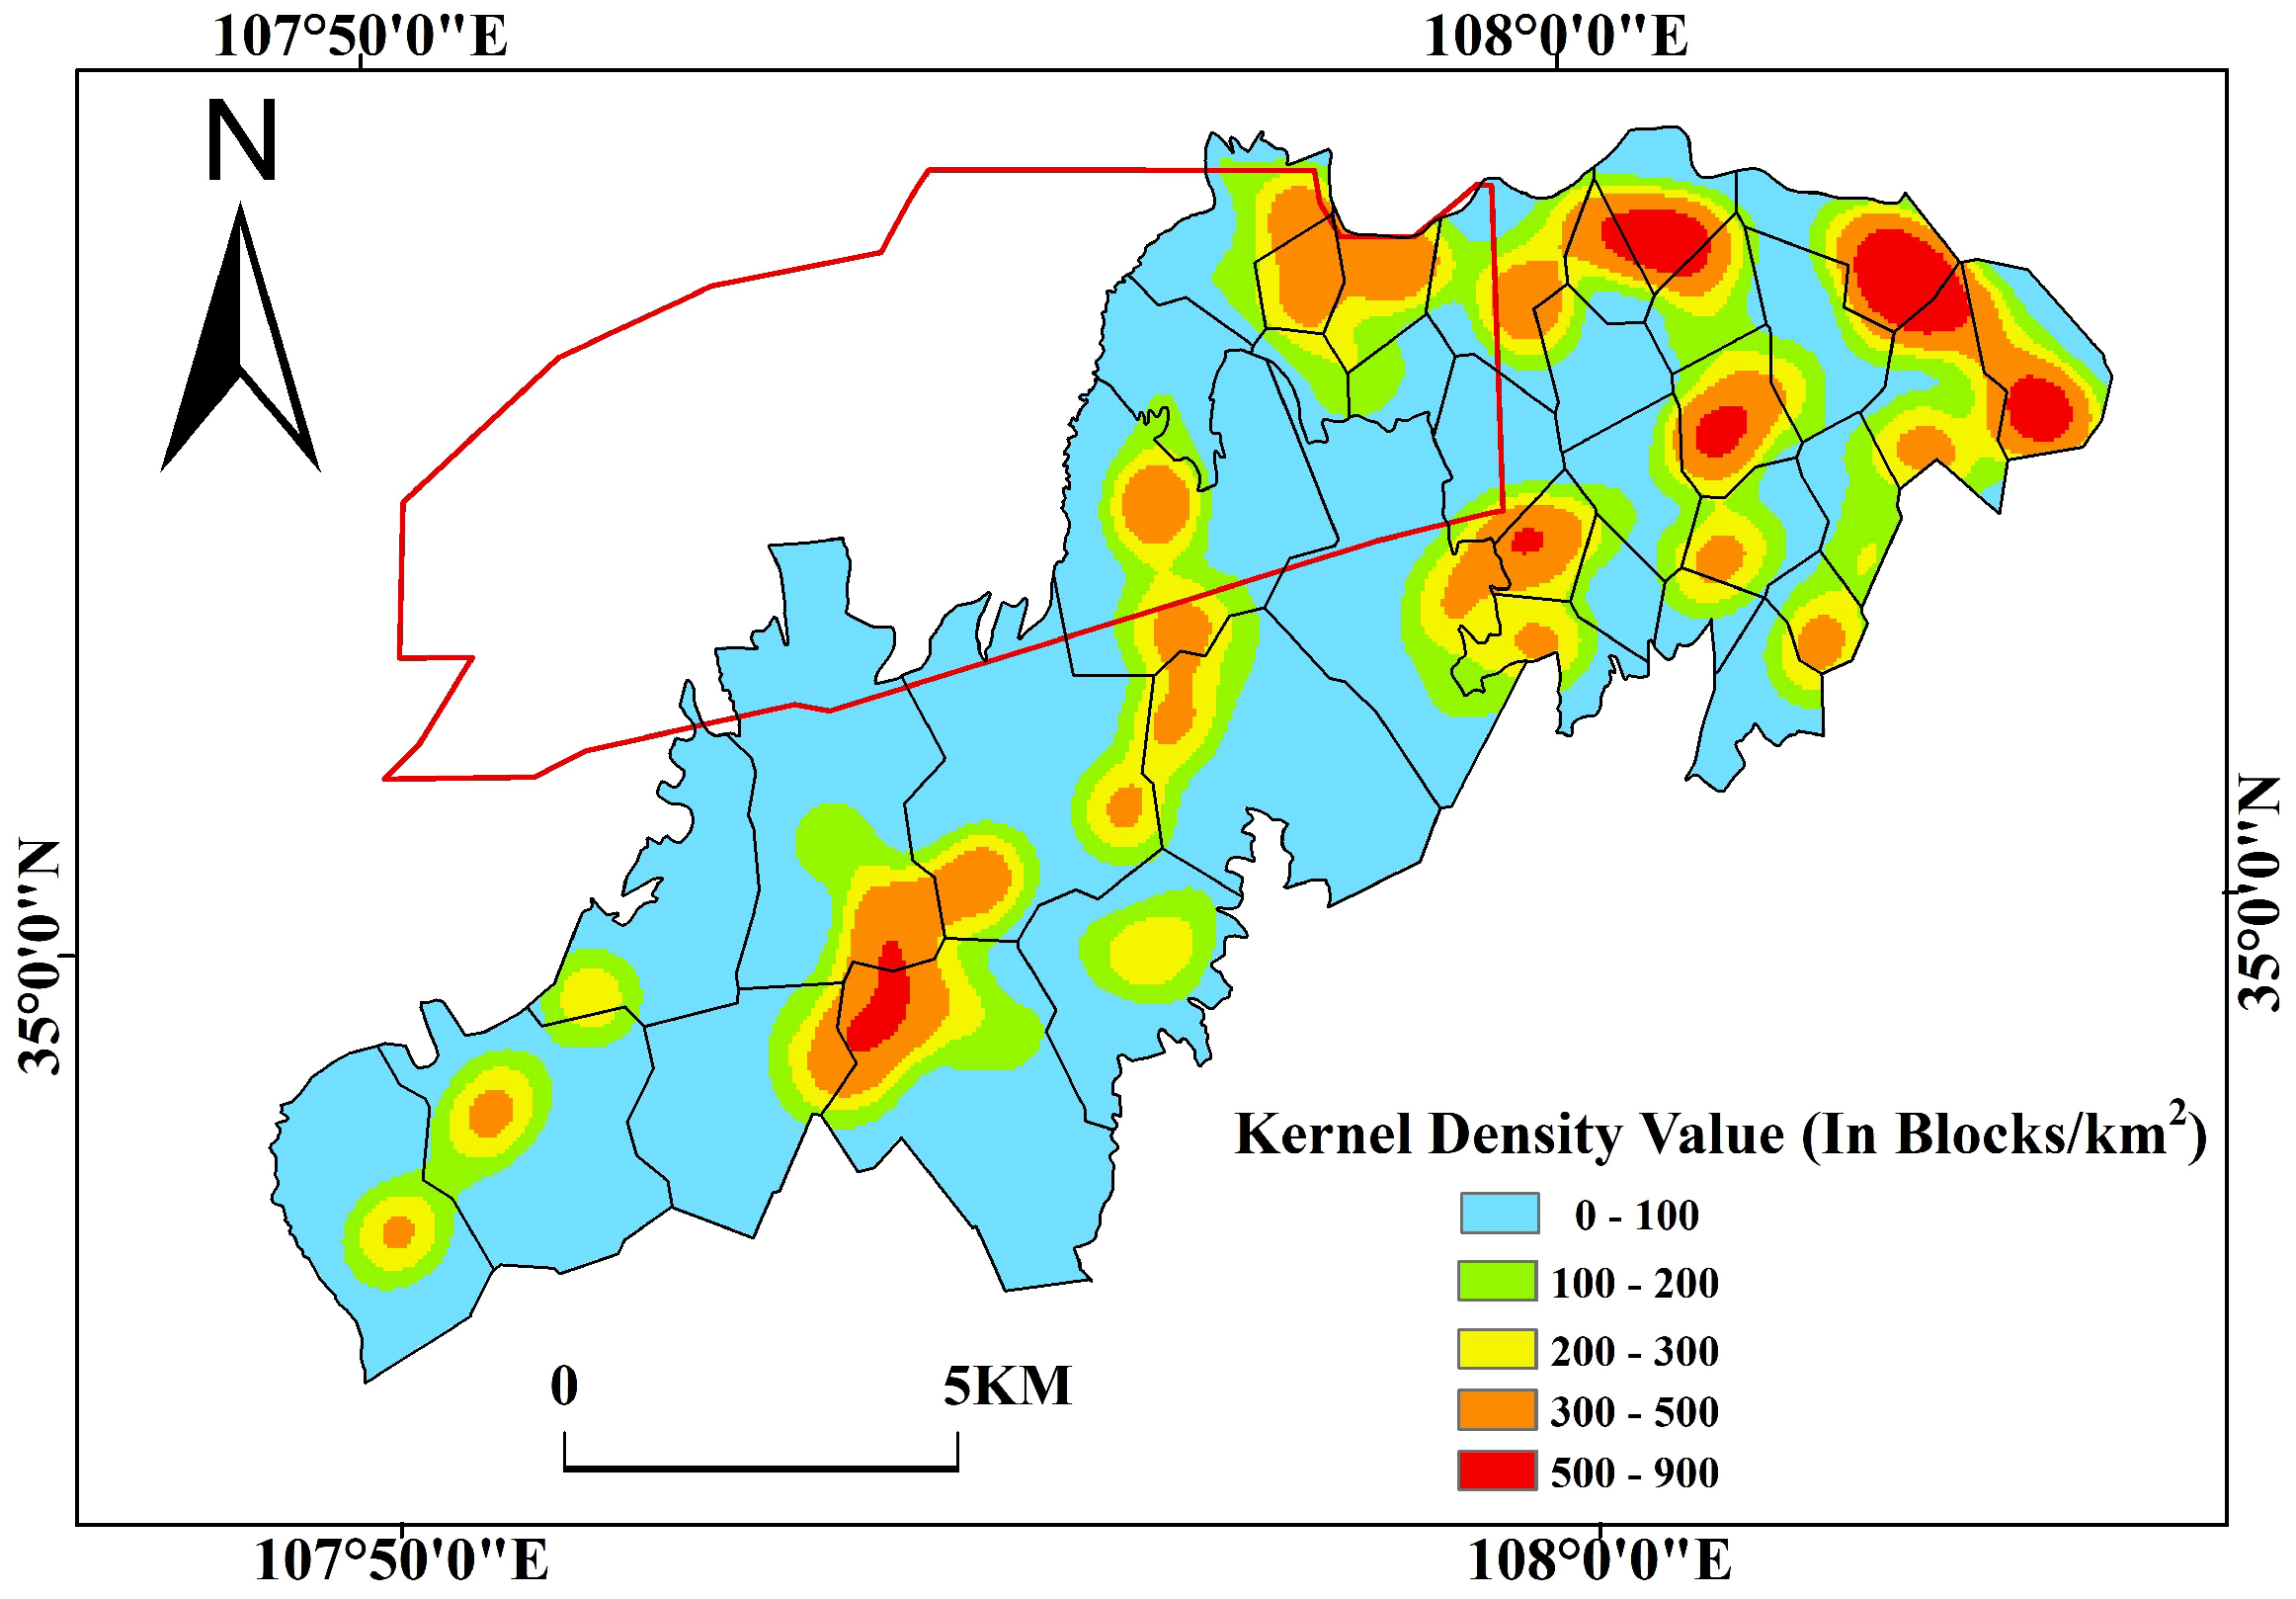
The housing density of each village was used as the weight for kernel density estimation to identify the core areas with higher housing density within each village, and the housing density was divided into five levels according to the kernel density value (in blocks/km2), and the results are shown in Figure 7.
The kernel density distribution map of the study area was overlaid with the livability map, and the minimum planning area of the resettlement location selection area of 0.1 × 10 6 m2 was used as the searching window to search for the optimum resettlement location according to the following principles:
  • located outside the boundary of the Dafosi coal mine;
  • located in the high livability zone (Zone I in Figure 6) and no less than 500 m from the low livability zone;
  • located in the area where the kernel density value of houses is less than 100 (blue area in Figure 7), preferably an open space;
  • the distance from the original village location in the collapse area does not exceed the working radius of the villagers to go to the fields for farming—since the villagers farming land in the resettlement location is still at the original location, the maximum labor radius for the villagers to go to the field for daily farming is set at 10 km.
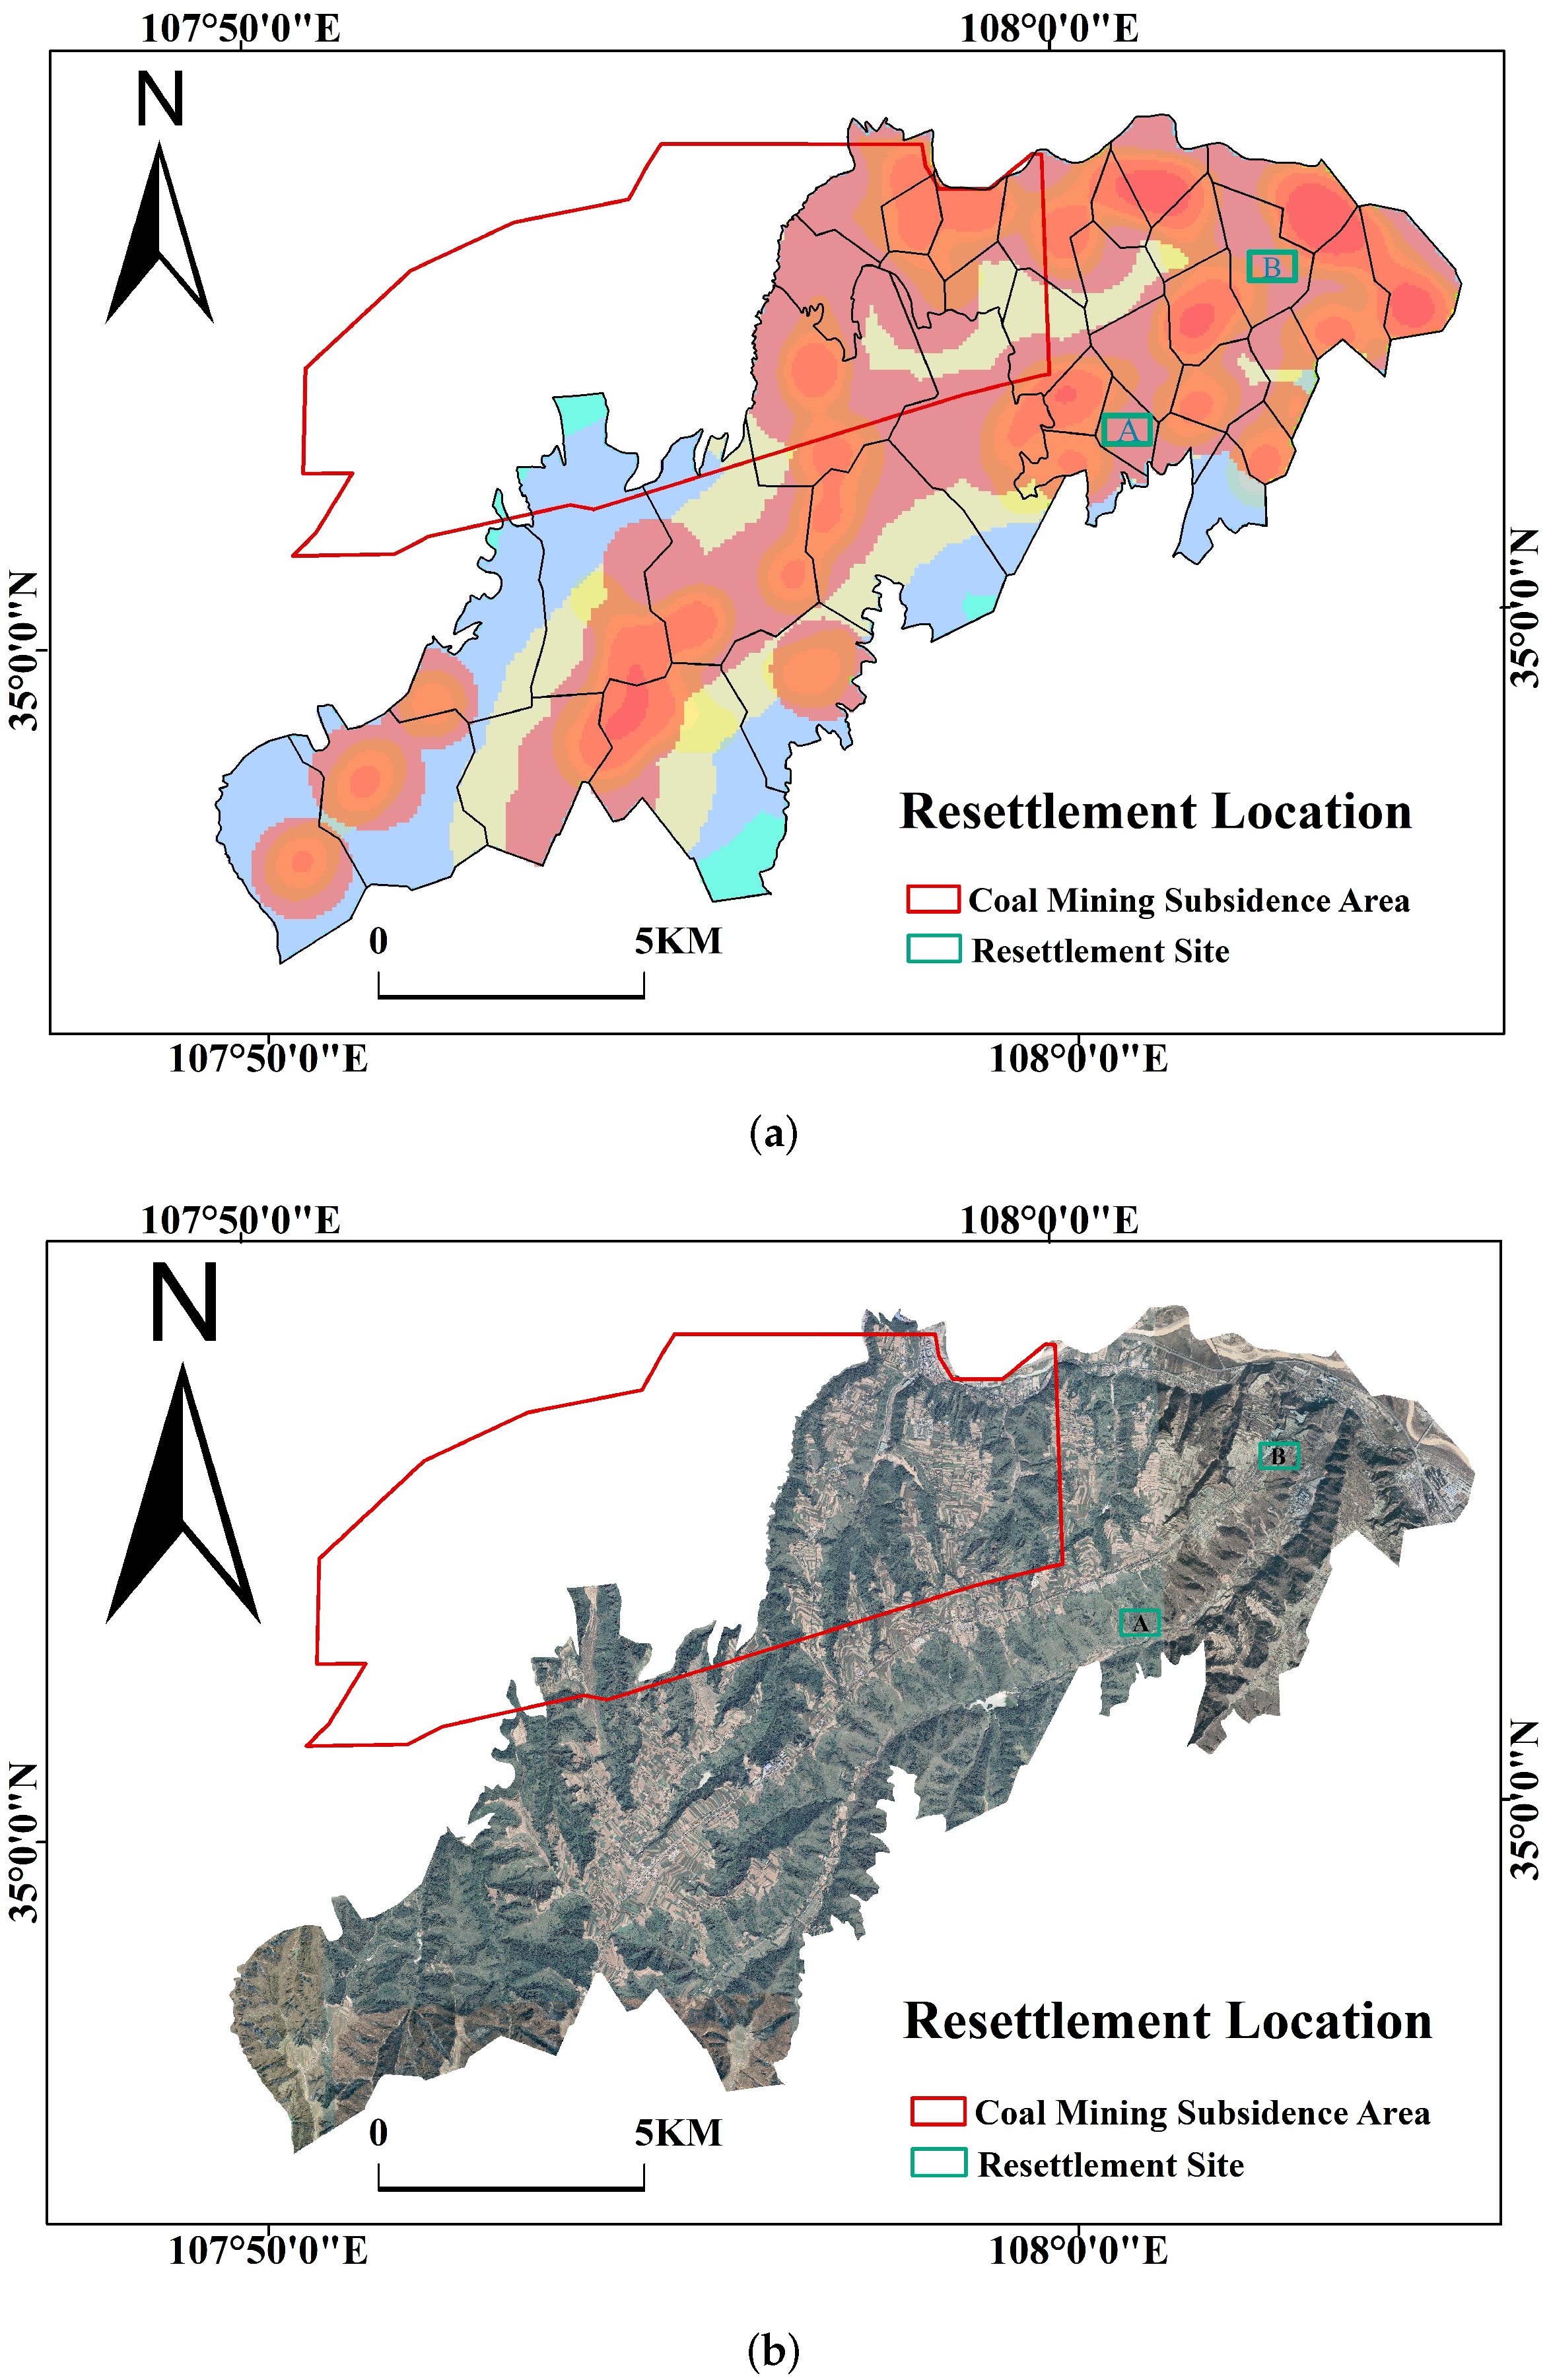
Based on the principles of operations research, and expert advice, we used GIS software to search for two new eligible location selection regions, A and B, according to the requirements of the above principles, as shown in Figure 8. Since the working radius of region A is smaller than that of region B, it is recommended to the decision department that region A be designated as the resettlement location.

4.4. Validation

We also validated the method by introducing 184 natural settlements as the validation data set and comparing them with the livability grading map obtained from ArcGIS. Converting the livability grading results into bimodal values, only level 1 is considered a high livability area, with a value of 1. The other levels are considered low-livability areas, with a value of 0. In this validation data set, only eight villages are classified as low-livability areas in the livability grading map, which means that only eight natural settlements in the data set were assigned the value 0. Thus, the accuracy of our livability model is 95.65%. This means that our method can achieve a very high accuracy livability prediction. The results are shown in Figure 6.

5. Discussion

5.1. Analysis of Human Settlement Factor for the Livability of Villages in Coal Mining Area

Among the human settlement factors affecting the livability of villages in coal mining areas on the Loess Plateau, the five factors of living area per capita ( X 1 ), population density ( X 2 ), road area per capita ( X 5 ), arable land area per capita ( X 9 ), and the proportion of villagers engaged in the coal industry ( X 10 ) have larger weight values. This shows that the dwelling environment, infrastructure, and economic development level of villages in the coal mining area on the Loess Plateau have the greatest influence on livability. From the evaluation results, it can be seen that the development of rural China is still lagging behind that of urban areas, and the villagers’ requirements for quality of life are still limited to basic material life, while the requirements for ecological environment, public health, and public facilities are still relatively low. Living area per capita is the human settlement factor that has the highest weight, while population density, road area per capita, arable land per capita, and the proportion of villagers engaged in the coal mining industry represent villagers’ basic requirements for survival and are also important human settlement factors that affect livability. The field survey shows that villagers rely on agricultural production, the service industry, or the coal mining industry for their income, and then build additional houses or roads to improve the livability of the village. It is noteworthy that, if there is a high number of villagers engaged in the coal mining industry, then there is a higher risk of disease. However, the proportion of the number of beds in nursing homes and village health centers in the evaluation results is small, which indicates that the economy of rural areas in the Loess Plateau of China is relatively backward, and the villagers’ demand for medical treatment and retirement is still low, which conforms to the life pattern of rural residents in the backward areas of Western China.
It should be noted that the core of the resettlement location selection for villages is to identify the area with the best livability within the optional area. Since human resettlement factors, are dynamic, variable, and uncertain, these factors are essentially the results of the interaction between a series of objectively existing geographic factors. The above human settlement factors are derived from data collection and field investigation of the human settlement environment of existing villages, while the livability evaluation of the potential resettlement locations is conducted for space outside the villages, and the human settlement factors of these places cannot be obtained directly. Therefore, to carry out a geographic livability evaluation in unknown areas, it is necessary to use an objective and determinable series of geographic factors to construct a livability evaluation model for the potential resettlement locations.

5.2. Geographic Factor Analysis of the Potential Resettlement Location Selection Area

The livability of 37 villages in the study area was used as the dependent variable for detecting the interaction effects among the geographic factors, and the sample size taken was large enough that there was no significant representativeness bias. Afterwards, the Geodetector was used to obtain the main influencing geographic factors for livability. These geographic factors were then used for overlay analysis to directly obtain the livability evaluation results of the potential resettlement locations, thus effectively avoiding issues caused by missing or uncertain data on human settlement factors. The detection results show that tourism resources are one of the main geographic factors of livability. Dafosi is a tourist attraction, located in the study area, which indicates that the tourism industry has a great influence on livability. The reason is that the tourism industry can drive the development of various industries such as farming, education, medicine, construction, etc. Setting the resettlement location close to the tourism industry can increase the prosperity of the village and indirectly improve the livability of the village. Geographic factors such as medical factors, procurement, and transportation also have a great impact on livability, which directly determines the convenience of villagers’ lives after resettlement. The terrain slope has a great impact on livability because of the gullies and ravines on the Loess Plateau and the large changes in terrain slope. The resettlement of villages should avoid areas with large slopes to facilitate the construction of roads and houses in the chosen area and to reduce construction costs. It is noteworthy that slope orientation and groundwater level are less correlated in the spatial distribution of livability, indicating that the requirements for building orientation and groundwater level are low and do not need to be considered as important factors in the selection of a village resettlement location.

5.3. Analysis of the Optimum Resettlement Location Based on the Livability Grading Map

Based on the results of geographic factor detection and overlay analysis (overlaying the existing village’s housing kernel density map on the livability grading map of the study area), the two resettlement locations obtained by GIS search are located near Village No. 29 and No. 26, respectively. Since many villagers are engaged in the coal mining industry for a living, and considering the working radius of the villagers from the resettlement location to the arable land near the original location before resettlement, the "A" area, which is closer to the original location, was chosen as the resettlement location. In the evaluation process of the resettlement location, the kernel density map of the existing village houses can effectively avoid the problem that, after selecting the ideal location, there is an insufficient land area for resettlement or that more existing village houses need to be demolished. It should be noted that, in the livability grading map obtained by overlaying geographic factors selected based on Geodetector, the villages with the highest geographic livability are located near the villages No. 29 and No. 26, while the villages No. 28, No. 27, and No. 30 have the highest geographic livability scores based on the evaluation within the existing village human settlement factor system, but they are all located very close to villages No. 29 and No. 26, respectively. On the one hand, this indicates that there is a small deviation between the livable areas determined by the evaluation of existing village human settlement factors and those detected by geographic factors, mainly because the geographic factor within each village is also spatially stratified and heterogeneous, and there is a slight difference between the geographic factor of dense housing areas and surrounding spaces. However, the spatial distance between the two results is close enough to indicate that the human settlement factors are interactively influenced by the geographic factor and are highly correlated. This indicates that using Geodetector to detect geographic factors and overlay geographic factors to obtain livability grading map yields a good level of certainty and operability in the evaluation of village location in the coal mining area on the Loess Plateau. Furthermore, it is more applicable to the situation where there is no existing village as a reference, and when it is difficult to collect human settlement factors of existing villages. Hence, with our method, it is much easier to obtain directly influential factors for a potential resettlement location evaluation.

6. Conclusions

In this paper, we consider livability as a geographic phenomenon and dependent variable, which can be made up of a series of human settlement factors, and the series of geographic factors that directly affect the livability as independent variables. We constructed a quantification evaluation model of the livability of the village resettlement location selection area based on the weighted overlay of geographic factors with the entropy weight method and the Geodetector, including the following three aspects:
  • A comprehensive evaluation model for livability based on the weighted combination of a series of human settlement factors. Based on the analysis of the human settlement environment characteristics of the Loess Plateau and the current situation of China’s rural development, the complex and macro concept of “livability” is decomposed into human settlement factors, and livability scores of the existing villages, and the entropy weight method was used to obtain these livability scores.
  • A Geodetector-based livability driving force and quantitative attribution model. The connotation is to treat the livability of existing villages as a geographic phenomenon, using the Geodetector for attribution analysis of the geographic factors which affect livability in order to obtain the correlation coefficients between livability and geographic factor, and to establish a quantitative relationship between livability and objective as well as deterministic geographic factors.
  • Optimum resettlement location selection evaluation model based on the overlay of geographic factors. The weighted overlay of the main geographic factor generates the livability grading map. The livability grading map is also validated with the existing settlement, and high accuracy is obtained. The kernel density map of existing village houses is overlaid and analyzed, and the optimum resettlement location for village relocation and resettlement is obtained by setting reasonable location selection constraints.
In summary, the potential resettlement location livability evaluation model proposed in this paper quantifies the complex relationship between livability, human settlement factors, and geographic factors for the first time, as a change from the traditional method of mixing two different types of factors, human settlement factors and geographic factors for weighted evaluation, providing better objectivity and certainty of evaluation results. The model provides a scientific evaluation method for village resettlement location selection in Western China, especially in coal mine subsidence areas.

Author Contributions

Conceptualization, J.T. and L.S.; methodology, J.T.; software, J.T.; validation, J.T.; formal analysis, J.T.; investigation, J.T.; resources, J.T.; data curation, J.T.; writing—original draft preparation, J.T.; writing—review and editing, L.S.; visualization, J.T.; supervision, L.S.; project administration, L.S.; funding acquisition, L.S. All authors have read and agreed to the published version of the manuscript.

Funding

This research was funded by the National Science Foundation of China (Grant No. 51674195).

Institutional Review Board Statement

Not applicable.

Informed Consent Statement

Not applicable.

Data Availability Statement

Not applicable.

Conflicts of Interest

The authors declare no conflict of interest.

References

  1. Wang, F.; Jiang, B.; Chen, S.; Ren, M. Surface collapse control under thick unconsolidated layers by backfilling strip mining in coal mines. Int. J. Rock Mech. Min. Sci. 2019, 113, 268–277. [Google Scholar] [CrossRef]
  2. Zhou, D.W.; Wu, K.; Cheng, G.L.; Li, L. Mechanism of mining subsidence in coal mining area with thick alluvium soil in China. Arab. J. Geosci. 2015, 8, 1855–1867. [Google Scholar] [CrossRef]
  3. Wu, Q.; Pang, J.; Qi, S.; Li, Y.; Han, C.; Liu, T.; Huang, L. Impacts of coal mining subsidence on the surface landscape in Longkou city, Shandong Province of China. Environ. Earth Sci. 2009, 59, 783–791. [Google Scholar]
  4. Wu, Q.; Jia, C.; Chen, S.; Li, H. SBAS-InSAR based deformation detection of urban land, created from mega-scale mountain excavating and valley filling in the Loess Plateau: The case study of Yan’an City. Remote Sens. 2019, 11, 1673. [Google Scholar] [CrossRef] [Green Version]
  5. Wang, J.; Wang, P.; Qin, Q.; Wang, H. The effects of land subsidence and rehabilitation on soil hydraulic properties in a mining area in the Loess Plateau of China. Catena 2017, 159, 51–59. [Google Scholar] [CrossRef]
  6. Owen, J.R.; Kemp, D. Mining-induced displacement and resettlement: A critical appraisal. J. Clean. Prod. 2015, 87, 478–488. [Google Scholar] [CrossRef] [Green Version]
  7. Yang, Y.; de Sherbinin, A.; Liu, Y. China’s poverty alleviation resettlement: Progress, problems and solutions. Habitat Int. 2020, 98, 102135. [Google Scholar] [CrossRef]
  8. Jackson, S.; Sleigh, A. Resettlement for China’s Three Gorges Dam: Socio-economic impact and institutional tensions. Communist Post-Communist Stud. 2000, 33, 223–241. [Google Scholar] [CrossRef]
  9. Wilmsen, B.; Webber, M.; Yuefang, D. Development for whom? Rural to urban resettlement at the Three Gorges Dam, China. Asian Stud. Rev. 2011, 35, 21–42. [Google Scholar] [CrossRef]
  10. Liu, S.; Zhang, P.; Lo, K. Urbanization in remote areas: A case study of the Heilongjiang Reclamation Area, Northeast China. Habitat Int. 2014, 42, 103–110. [Google Scholar] [CrossRef]
  11. Qian, Z.; Xue, J. Small town urbanization in Western China: Villager resettlement and integration in Xi’an. Land Use Policy 2017, 68, 152–159. [Google Scholar] [CrossRef]
  12. Fan, M.; Li, Y.; Li, W. Solving one problem by creating a bigger one: The consequences of ecological resettlement for grassland restoration and poverty alleviation in Northwestern China. Land Use Policy 2015, 42, 124–130. [Google Scholar] [CrossRef]
  13. Schmidt-Soltau, K. Conservation–related resettlement in Central Africa: Environmental and social risks. Dev. Chang. 2003, 34, 525–551. [Google Scholar] [CrossRef]
  14. Iuchi, K. Planning resettlement after disasters. J. Am. Plan. Assoc. 2014, 80, 413–425. [Google Scholar] [CrossRef]
  15. Balsa-Barreiro, J.; Morales, A.J.; Lois-González, R.C. Mapping population dynamics at local scales using spatial networks. Complexity 2021, 2021, 8632086. [Google Scholar] [CrossRef]
  16. Balsa-Barreiro, J.; Menendez, M.; Morales, A.J. Scale, context, and heterogeneity: The complexity of the social space. Sci. Rep. 2022, 12, 9037. [Google Scholar] [CrossRef]
  17. Alavizadeh, S.A.M.; Kiumars, S.; Ebrahimi, E.; Alipour, M. Analysis of Livability of Rural Settlements (Case Study: Villages of Kashmar County). J. Res. Rural Plan. 2019, 8, 97–114. [Google Scholar]
  18. Palagi, S.; Javernick-Will, A. Pathways to livable relocation settlements following disaster. Sustainability 2020, 12, 3474. [Google Scholar] [CrossRef] [Green Version]
  19. Zhan, D.; Kwan, M.P.; Zhang, W.; Fan, J.; Yu, J.; Dang, Y. Assessment and determinants of satisfaction with urban livability in China. Cities 2018, 79, 92–101. [Google Scholar] [CrossRef]
  20. Fleischner, T.L. Ecological costs of livestock grazing in western North America. Conserv. Biol. 1994, 8, 629–644. [Google Scholar] [CrossRef] [Green Version]
  21. Li, X.; Yang, H.; Jia, J.; Shen, Y.; Liu, J. Index system of sustainable rural development based on the concept of ecological livability. Environ. Impact Assess. Rev. 2021, 86, 106478. [Google Scholar] [CrossRef]
  22. Faiz, A.; Faiz, A.; Wang, W.; Bennett, C. Sustainable rural roads for livelihoods and livability. Procedia-Soc. Behav. Sci. 2012, 53, 1–8. [Google Scholar] [CrossRef] [Green Version]
  23. Saaty, T.L. What is the analytic hierarchy process? In Mathematical Models for Decision Support; Springer Verlag: Berlin/Heidelberg, Germany, 1988; pp. 109–121. [Google Scholar]
  24. Liang, L.; Deng, X.; Wang, P.; Wang, Z.; Wang, L. Assessment of the impact of climate change on cities livability in China. Sci. Total Environ. 2020, 726, 138339. [Google Scholar] [CrossRef]
  25. Wey, W.M.; Huang, J.Y. Urban sustainable transportation planning strategies for livable City’s quality of life. Habitat Int. 2018, 82, 9–27. [Google Scholar] [CrossRef]
  26. Yurui, L.; Luyin, Q.; Qianyi, W.; Karácsonyi, D. Towards the evaluation of rural livability in China: Theoretical framework and empirical case study. Habitat Int. 2020, 105, 102241. [Google Scholar] [CrossRef]
  27. Basu, T.; Das, A.; Pereira, P. Urban livability index assessment based on land-use changes in an Indian medium-sized city (Raiganj). Geocarto Int. 2021, 1–25. [Google Scholar] [CrossRef]
  28. Chen, Z. Evaluating sustainable liveable city via multi-mcdm and hopfield neural network. Math. Probl. Eng. 2020, 2020, 4189527. [Google Scholar] [CrossRef] [Green Version]
  29. Wang, Y.; Zhu, Y.; Yu, M. Evaluation and determinants of satisfaction with rural livability in China’s less-developed eastern areas: A case study of Xianju County in Zhejiang Province. Ecol. Indic. 2019, 104, 711–722. [Google Scholar] [CrossRef]
  30. Wang, Y. Institutional interaction and decision making in China’s rural development. J. Rural Stud. 2020, 76, 111–119. [Google Scholar] [CrossRef]
  31. Wang, J.F.; Li, X.H.; Christakos, G.; Liao, Y.L.; Zhang, T.; Gu, X.; Zheng, X.Y. Geographical detectors-based health risk assessment and its application in the neural tube defects study of the Heshun Region, China. Int. J. Geogr. Inf. Sci. 2010, 24, 107–127. [Google Scholar] [CrossRef]
  32. Wang, J.F.; Zhang, T.L.; Fu, B.J. A measure of spatial stratified heterogeneity. Ecol. Indic. 2016, 67, 250–256. [Google Scholar] [CrossRef]
  33. Zhao, Y.; Liu, L.; Kang, S.; Ao, Y.; Han, L.; Ma, C. Quantitative Analysis of Factors Influencing Spatial Distribution of Soil Erosion Based on Geo-Detector Model under Diverse Geomorphological Types. Land 2021, 10, 604. [Google Scholar] [CrossRef]
  34. Fang, C.; He, S.; Wang, L. Spatial Characterization of Urban Vitality and the Association with Various Street Network Metrics from the Multi-Scalar Perspective. Front. Public Health 2021, 9, 579. [Google Scholar] [CrossRef]
  35. Zhao, R.; Zhan, L.; Yao, M.; Yang, L. A geographically weighted regression model augmented by Geodetector analysis and principal component analysis for the spatial distribution of PM2.5. Sustain. Cities Soc. 2020, 56, 102106. [Google Scholar] [CrossRef]
  36. Lai, X.; Zhang, L.; Zhang, Y.; Shan, P.; Wan, P.; Mu, K. Research of the Backfill Body Compaction Ratio Based on Upward Backfill Safety Mining of the Close-Distance Coal Seam Group. Geofluids 2022, 2022, 8418218. [Google Scholar] [CrossRef]
  37. Sui, L.; Ma, F.; Chen, N. Mining subsidence prediction by combining support vector machine regression and interferometric synthetic aperture radar data. ISPRS Int. J. Geo-Inf. 2020, 9, 390. [Google Scholar] [CrossRef]
Figure 1. Schematic diagram of the geographical location of the study area.
Sustainability 14 08365 g001
Figure 2. Distribution of villages and coal mining subsidence areas around the Dafosi mine, numbers in the figure represent the village numbers.
Sustainability 14 08365 g002
Figure 3. Route map for the livability of resettlement areas evaluation based on Geodetector.
Sustainability 14 08365 g003
Figure 4. Quantitative attribution detection grid for livability.
Sustainability 14 08365 g004
Figure 5. Distribution map of each geographic factor. (a) Z 1 : terrain slope, (b) Z 2 : slope orientation, (c) Z 3 : surface water system, (d) Z 4 : groundwater level, (e) Z 5 : transportation accessibility, (f) Z 6 : education resource accessibility, (g) Z 7 : medical resource accessibility, (h) Z 8 : procurement radius, (i) Z 9 : tourism resource accessibility.
Sustainability 14 08365 g005aSustainability 14 08365 g005b
Figure 6. Livability grading in the study area (the points represent the settlements, the red line includes the coal mining subsidence area).
Sustainability 14 08365 g006
Figure 7. Kernel density distribution map of houses in each village, the red line includes the coal mining subsidence area.
Sustainability 14 08365 g007
Figure 8. GIS-based search for optimum resettlement location selection. (a) Resettlement site, (b) satellite map.
Sustainability 14 08365 g008
Table 1. Criteria layer and factor of village livability evaluation.
Criteria LayerFactor Layer
Dwelling environment ( X 1 , X 2 )Living area per capita ( X 1 )
Population density ( X 2 )
Ecological health ( X 3 , X 4 )Vegetation cover per capita ( X 3 )
Livestock and poultry breeding area per capita ( X 4 )
Infrastructure ( X 5 , X 6 )Road area per capita ( X 5 )
Village road hardening rate ( X 6 )
Public facilities ( X 7 , X 8 )Number of nursing home beds per capita ( X 7 )
Number of village health room beds per capita ( X 8 )
Economic development ( X 9 , X 10 )Arable land per capita ( X 9 )
The proportion of villagers engaged in the coal industry ( X 10 )
Table 2. Geographic factor interpretation and its calculation method.
Factor (Z)Explanation and Computational Method
Z 1 : terrain slope ( )Extraction slope value data from DEM
Z 2 : slope orientation ( )Extraction slope orientation data from DEM
Z 3 : surface water system (m)Shortest distance to a river
Z 4 : groundwater level (m)Distance from groundwater level
Z 5 : transportation accessibility (m)Shortest distance to a road above the county road level
Z 6 : education resource accessibility (m)Shortest distance to a school
Z 7 : medical resource accessibility (m)Shortest distance to hospitals and clinics
Z 8 : procurement radius (m)Shortest distance to malls and markets
Z 9 : tourism resource accessibility (m)Shortest distance to tourist attractions
Table 3. Criterion and Interaction.
CriterionInteraction
q X 1 X 2 < min q X 1 , q X 2 Non-linear attenuation
min q X 1 , q X 2 < q X 1 X 2 < max q X 1 , q X 2 Single factor non-linear attenuation
q X 1 X 2 > max q X 1 , q X 2 Two-factor enhancement
q X 1 X 2 = q X 1 + q X 2 Independent
q X 1 X 2 > q X 1 + q X 2 Nonlinear enhancement
Table 4. Information entropy corresponding to each factor.
Factor X 1 X 2 X 3 X 4 X 5 X 6 X 7 X 8 X 9 X 10
Information entropy E j 0.9300.8720.8960.9360.9400.8930.8790.9620.9600.933
Table 5. Weight value of each factor.
Factor W 1 W 2 W 3 W 4 W 5 W 6 W 7 W 8 W 9 W 10
Weight0.0880.1600.1310.0800.0750.1330.1510.0470.0500.084
Table 6. Livability scores of the villages in the study area.
Village NumberLivabilityVillage NumberLivabilityVillage NumberLivability
184.961486.672788.71
284.871586.172889.34
385.541685.842987.58
487.601785.583088.51
585.961885.463186.75
684.721984.593287.85
782.282087.543386.47
886.802186.323485.39
985.082285.513584.97
1087.612386.793685.48
1187.712485.123784.18
1286.612587.42
1385.962688.58
Table 7. Results of the correlation detection between livability and each geographic factor.
Geographic Factor Z 1 Z 2 Z 3 Z 4 Z 5 Z 6 Z 7 Z 8 Z 9
Correlation coefficient q0.0580.0170.0320.0450.0740.0390.1090.0800.129
Table 8. Results of interaction detection among geographic factors.
Geographic Factor Z 1 Z 2 Z 3 Z 4 Z 5 Z 6 Z 7 Z 8 Z 9
Z 1 0.058
Z 2 0.2870.017
Z 3 0.0840.1630.032
Z 4 0.1820.1940.1080.045
Z 5 0.1340.2530.1220.2410.074
Z 6 0.1330.2430.0920.1200.1090.039
Z 7 0.2960.2890.1950.2470.2250.2400.109
Z 8 0.1800.1750.1270.2420.3300.1790.176 *0.080
Z 9 0.2980.2060.157 *0.2640.2080.2210.197 *0.167 *0.129
Adding “*” indicates a two-factor enhancement, while not adding “*” indicates a non-linear enhancement of the two-factor interaction.
Table 9. Results of correlation detection between geographic factors and spatial distribution of livability.
Z 1 Z 2 Z 3 Z 4 Z 5 Z 6 Z 7 Z 8
Z 2 Y
Z 3 YY
Z 4 YNY
Z 5 YYYN
Z 6 YNYYY
Z 7 YNYNYY
Z 8 YYYNYYY
Z 9 YYYYYYYY
Publisher’s Note: MDPI stays neutral with regard to jurisdictional claims in published maps and institutional affiliations.