Article

Technological Innovation Efficiency in China: Dynamic Evaluation and Driving Factors

1
School of Economics, Fujian Normal University, Fuzhou 350117, China
2
School of Economics & Management and Law, University of South China, Hengyang 421001, China
3
Department of Marketing, Sumy State University, 40007 Sumy, Ukraine
*
Author to whom correspondence should be addressed.
Sustainability 2022, 14(14), 8321; https://doi.org/10.3390/su14148321
Submission received: 9 June 2022 / Revised: 30 June 2022 / Accepted: 4 July 2022 / Published: 7 July 2022
(This article belongs to the Collection Technological Innovation and Economic Growth)

Abstract

:
Innovation is the engine and accelerator that drives high-quality economic and enterprise development. In recent years, the output of scientific and technological innovation in China has been high, but the phenomenon of low efficiency and low quality of innovation occurs frequently. In this study, first, technological innovation efficiency (TIE) was measured. Then, a dynamic evaluation and analysis of spatial-temporal characteristics of efficiency were performed. Lastly, the driving factors of innovation efficiency were explored. TIE was calculated dynamically in 30 provinces of China from 2011 to 2019 based on the improved super-efficiency SBM-DEA model. Then, the kernel density estimation method was adopted to analyse the spatial-temporal differentiation characteristics and dynamic evolution process of provincial efficiency. The findings confirm that from 2011 to 2019, the top five provinces for TIE in China were Beijing (1.0), Shanghai (0.96), Hainan (0.96), Jilin (0.94) and Tianjin (0.91). The provinces with lowest average efficiency were Qinghai (0.77), Ningxia (0.73) and Inner Mongolia (0.73). The significant differences in the level of technological innovation in different regions were caused by the long-term and in-depth implementation of the government’s strategy of revitalising science and driving innovation in parts of areas. The findings of kernel function confirm that the TIE in most parts of China was gradually polarised. Furthermore, the results show that for every 1 unit of government R&D funding support, the average marginal utility of the expected TIE will reach 0.192, which is more significant in the central and western regions. On this basis, combined with environmental factors of innovation market, infrastructure, financing and enterprise innovation potential, the article also extracts the driving factors that affect the differences in provincial efficiency. The findings provide a reference for guiding provinces to carry out innovation activities independently and improve innovation quality and efficiency.

1. Introduction

Under the multiple and complex backgrounds of global economics, environmental protection and the difficulties of industrial transformation, the sixth plenary session of the 19th Central Committee of the Chinese Communist Party once again emphasised the core position of innovation in the overall situation of China’s modernisation drive. To make innovation become the first driving force to “achieve high-quality development”, China should adhere to the innovation-driven development strategy and strengthen the national strategic, scientific and technological strength [1]. As a key element in accelerating the transformation of kinetic energy between the new and the old in the new era, promoting regional innovation is the essential intention of the five major development concepts, and it has great significance to the realisation of coordinated development and common prosperity [2,3,4,5].
Under the high-intensity systemic investment in innovation, China’s overall innovation capability continues to rise. According to the National Bureau of Statistics of China [6], China ranks first in research and experimental development (R&D) activities in the world’s major economies. Furthermore, China is the leader in both the proportion of government funds and the number of people engaged in R&D. As the main forces engaged in R&D activities, enterprises were invested directly with 76.4% of China’s R&D funds to carry out innovation activities, which is only exceeded by South Korea (80.3%) and Japan (79.4%) in the world. In addition, the intensity of R&D investment in China increased from 0.65% to 2.24% of growth domestic product (GDP) from 1998 to 2019, even higher than the average of 2.12% in the European Union (EU). In the same period, the number of patent applications granted increased from 68,000 to 2.457 million, rapidly growing nearly 35-fold. From the perspective of innovation output, China is at the forefront of the world regarding the scale of patent authorisation and the number of international papers published. However, it is puzzling that China’s national innovation index has always been outside the top 10 in the world (in 2021, it ranked 12th). With the increasingly fierce scientific and technological competition between China and the United States of America (USA), the negative list of some core technologies from the USA has highlighted the problem of “sticking neck” in China’s key technologies. It reflects the fact that although China has a large amount of innovations, many are low-quality innovations. There are core technologies still controlled by others. The surging output of innovation in China has not been accompanied by the improvement of innovation quality, which also shows that China’s technological innovation is facing the dilemma of innovation inefficiency caused by the input–output mismatch. Technological innovation efficiency (TIE) is a key indicator to measure the output level of innovation input factors per unit time. Compared with other developed countries, China’s innovation efficiency is still far away in terms of TIE.
The purpose of this study is to fill the gap between quality and efficiency of TIE by considering the proportion changes between input and output of the production process in the framework of TIE. It is relevant to consider the Schumpeter theory of technological innovation “quantity” under the background of innovation-driven strategy [7,8]. However, they paid little attention to innovation quality and efficiency. So, how do we use appropriate technical methods to measure innovation efficiency? What are the characteristics of innovation efficiency in different provinces in China from the perspective of time and space? Furthermore, which factor will significantly affect the induction and promotion of technological innovation? These problems form the focus of this article. Different from the previous simple measurement of TIE, this paper adopts the super-efficiency Slacks-Based Measure (SBM) model. It is based on non-radial, non-angle and non-expected output. It takes the relaxation variable into the objective function, which can not only solve the problem of input relaxation but also solve the problem of unexpected output and achieve the goal of maximising economic benefit. In a word, the method has a good effect on calculating the actual efficiency value [9]. Therefore, this paper focuses on the input–output index evaluation system of technological innovation firstly and dynamically calculates the efficiency level of TIE in 30 provinces of China from 2011 to 2019 based on the improved super-efficiency Slacks-Based Measure–Data Envelopment Analysis (SBM-DEA) model. Then, TIE’s temporal and spatial differentiation characteristics and dynamic evolution process are described in detail using the kernel density estimation method. In the end, starting from the four dimensions of innovation market environment, infrastructure, financing environment and enterprise innovation potential, this paper extracts factors that have a key impact on TIE. The study constructs a panel Tobit regression model to provide a reference for different provinces to carry out independent innovation activities.
Thus, the paper’s structure is as follows: introduction—highlighted actuality of the TIE analysis; literature review—analysis of the theoretical framework of TIE’s assessment; methods—explanation of the stages and instruments for TIE analysis, time dimension evolution of TIE and drivers of TIE; results—the explanation of core findings; discussion—comparison of analysis with previous studies; conclusion—core findings, recommendations and limitations of the investigation.

2. Literature Review

In general, efficiency is the ratio between outputs and the costs required to produce them [10]. The study [11] applied a DEA model to analyse the technological innovation efficiency of China’s high-tech industries. The scientists working on [11] confirmed that required resourses (capital, labour, knowledge, etc.) for innovations are less than the generated output when comparing similar technologies in the sector. Furthermore, in the papers [12,13], the innovative activity of companies was analysed as a goal-directed process. Such an approach allows simultaneous estimating of initial, intermediate and output data during the entire period of industrial production. The paper [14] defined the TIE as the capability to maximize the results from innovations compared to innovation cost. The study [15] confirmed that industry technological innovation efficiency was the core driver of sustainable development of the mining industry in China. The authors developed a DEA model to confirm that technological innovation efficiency impacted sustainable development of the mining industry. Thus, within the investigation, the TIE was analysed as the proportion changes between input and output of the production process.
In recent years, a large number of low-efficiency or even ineffective innovation behaviours (such as dormant patents and innovation bubbles) have emerged under the guidance of existing innovation policies [16]. Promoting technological innovation being more efficient and high-quality has become the fundamental way to solve the lack of stamina of current economic and social development [17] as well as curb the unchecked spread of innovation bubbles. However, before improving TIE, increasing the level of innovation efficiency has become the first concern that should be addressed. From the perspective of method, the non-parametric DEA method is generally used to separate the technical efficiency from the production efficiency. The Solow residual method is also used to analyse its regression residual to characterise technological progress [18]. The super-efficiency SBM-DEA model can better consider the unexpected output. It allows comparison of an effective decision-making unit (DMU) whose efficiency is not less than 1, which solves the problem that the previous DEA model may cause deviation in the radial selection and angle selection, and has become a reliable method to measure efficiency.
From the selection of indicators, the existing research mainly uses a single index to measure enterprises’ innovation capability or performance, such as R&D investment, the number of patent applications or patents authorised and the number of science and technology employees [19,20]. Patents, especially invention patents, have become common indicators when measuring micro-subject innovation output. Generally, the number of invention patents is used to measure the number of innovations, and the citation of invention patents is used to measure the quality of innovation [19]. Although patent data can more accurately measure the output of innovation activities rather than input, only using patent citation to measure patent quality is not accurate enough. Worse, some enterprises often misquote or over-quote patents to better cater to the examination of patent examination institutions. Therefore, there are still many drawbacks to only taking the number of patent citations as patent quality and then regarding it as the innovation output.
After completing the efficiency measurement, some scholars use the two-stage Tobit model to explore the factors that affect the efficiency of TIE and finally give targeted countermeasures and suggestions. For example, the study [21] used the non-radial and non-angle DEA model, including unexpected output, to measure the ecological efficiency of urban agglomerations in the Yangtze River Economic Belt from 2005 to 2015, and it empirically analysed the impact of green-technology innovation on ecological efficiency through the Tobit model. The paper [22] analysed the effect of material and energy consumption reduction on innovation efficiency, considering both innovation inputs and outputs, and then utilised data of 388 manufacturing enterprises in Korea and performed DEA and Tobit regression analysis. The study [23] used the two-stage network DEA model to measure the green innovation efficiency of China’s local high-tech manufacturing industry and established a Tobit regression model to analyse the role of different technology transfer modes in improving green innovation efficiency. The study [24] used the Bootstrap-modified DEA–Tobit model to evaluate the green-technology innovation efficiency of 21 biomass power generation enterprises in 2018 and analysed the influencing factors.
Considering the shortcomings of the traditional DEA method and the deficiency of individual indicators, this paper will use the improved SBM-DEA model to measure the TIE of each province based on comprehensively considering multiple innovation input–output indicators and a non-expected output index system. Compared with previous studies, the paper has the following main contributions: firstly, the evaluation system of technological innovation, including unexpected output, is constructed, which addresses the deviation of efficiency value caused by non-expected output. TIE in different provinces is dynamically calculated using the improved super-efficiency SBM model, which overcomes the difficulty that all DMU could not be compared horizontally in the past. The panel Tobit model is used to analyse the important variables that may affect the TIE. The key factors leading to the differences in technological innovation between provinces are investigated from an empirical point of view. Secondly, the temporal and spatial differentiation characteristics and dynamic evolution process of provincial real TIE are described in detail using the kernel density estimation method. The differences in and possible reasons for innovation efficiency in different provinces are analysed, which may provide some reference for each province to improve innovation quality and efficiency.

3. Materials and Methods

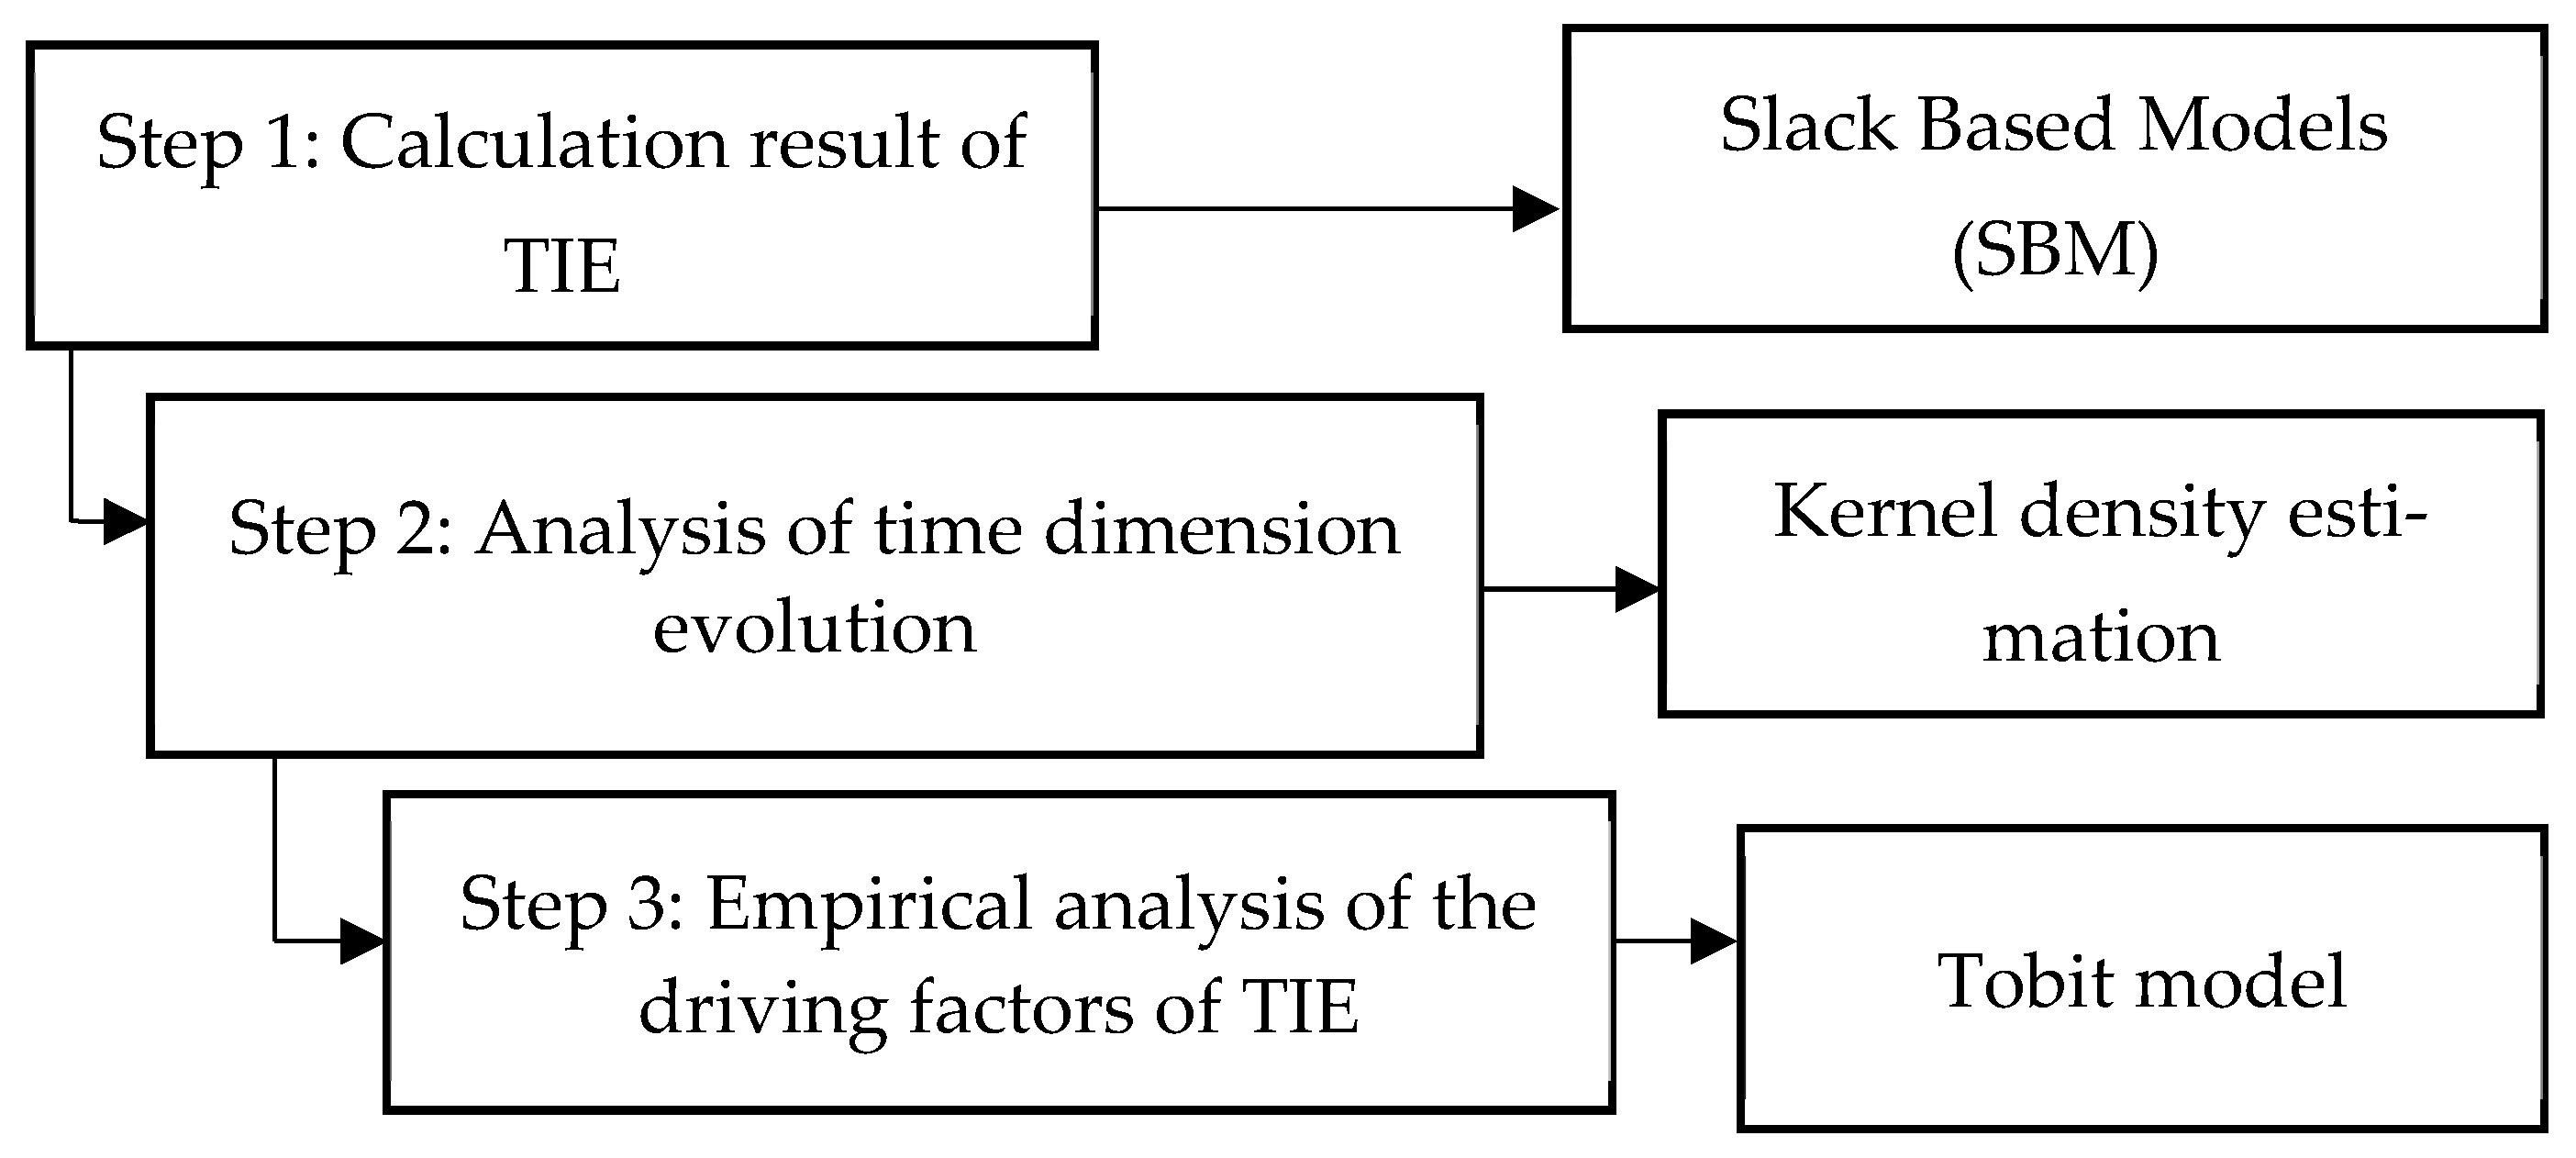
3.1. Research Methods

DEA is a standard efficiency evaluation method [25]. However, in the past, the traditional DEA model was often unable to rank effective DMUs accurately, nor could it include the unexpected output in the model to accurately calculate the efficiency value. There may be some deviation in the selection of radial and angle. Nevertheless, these problems are easily solved with the emergence of the improved super-efficiency SBM model [26]. The specific SBM model is built as follows.
Adopting the formalization by [27,28], consider N DMUs ( j = 1, …, N) observed in T (t = 1, …, T) periods using m inputs ( i = 1, …, m, X = ( x 1 , x 2 , , x m ) R m + ) and S outputs, which including expected output S 1 ( Y = ( y 1 , y 2 , , y s 1 ) R s 1 + ) and non-expected output S 2 ( Z = ( z 1 , z 2 , , z s 2 ) R s 2 + ). Assuming that the non-expected output is joint weak disposability, the expected output Y and input X are strongly disposable, the expected output Y and non-expected output Z are zero-sum convex sets and closed sets, and the production possible sets are:
P = { ( x , y , z ) | x X λ , y Y λ , z Z λ ; λ 0 }
λ is the weight vector of the cross-sectional observation in the above equation. For a specific DMU, the SBM model is as follows:
ρ = min 1 1 m i = 1 m S i x i 0 1 + 1 S 1 + S 2 ( r = 1 S 1 S r g y r 0 g + r = 1 S 2 S r b y r 0 b )
S . t .   x 0 = X λ + S , y 0 g = Y λ S g , y 0 b = Y λ + S b ,   S 0 , S g 0 , S b 0 , λ 0
ρ   ( 0 ρ 1 ) in Formula (2) represents the efficiency value of DMU technological innovation in each province. While S and S b represent the relaxation of input and non-expected output, respectively, S g   indicates the deficiency of expected output, while the relaxation variable refers to the difference between the actual value and the expected value of the input variable.
Kernel density estimation is a non-parametric method for estimating probability density function. The smooth peak function fits the observed data points to simulate the actual probability distribution curve. Let x 1 , x 2 ,   ,   x n satisfy an independent and identically distributed F with n sample points, and x represents the mean value. While taking f ( x ) as the probability density function, the kernel density estimation can be depicted as follows:
f h ( x ) = 1 n i = 1 n K h ( x x i ) = 1 nh i = 1 n K ( x x i h )
K ( . ) is the kernel function, h > 0 is the smoothing parameter, also called the bandwidth or window, and K h ( x ) = 1 h K ( x h ) is a scaling kernel function. For the convenience and rationality of density function estimation, kernel functions are usually required to meet the following conditions:
K ( x ) = K ( x ) ,   K ( x ) 0   Sup | K ( u ) | < + ,   K ( u ) du = 1
The kernel function is a smooth-conversion and weighted function [29,30,31]. Gaussian kernel estimation is the most widely used one above several other functions. In this paper, the Gaussian kernel function is also used to estimate TIE’s distributed dynamic evolution process in various provinces of China.
f ( x ) = 1 2 π exp ( x 2 2 )
In the process of density function estimation, it is essential to choose the appropriate bandwidth because of its sensibility. Generally, the denser the distribution is, the narrower the chosen bandwidth should be. Otherwise, we should choose the wider bandwidth [32]. In practice, we often use Formula (8) to select the appropriate bandwidth, and the following conditions are usually satisfied between the bandwidth h and the observation n:
lim N h ( n ) = 0 , lim N nh ( n ) = n
In order to further explore which innovative environmental factors could affect the efficiency, it is necessary to carry out a regression analysis. However, because the efficiency calculated by the DEA model is usually limited to [0,1], if ordinary OLS regression is used, the estimated values of parameters will be biased and inconsistent [33]. Therefore, to solve the problem of data blocking, Tobin [34] put forward the restricted-dependent-variable Tobit model in 1958, which is detailed as follows:
y * = β x i + ε   y i = y i * ,   if   y * > 0   y i = 0 ,     if   y * 0
In this model, ε satisfies the normal distribution( N ( 0 , σ 2 ) , β is the regression parameter vector, x i is the independent variable vector, y i * is the dependent variable vector, and y i is the efficiency value vector. This model can effectively analyse regression problems in which the dependent variable is in a fixed interval, and the judgment results will be close to the actual parameters.
Considering what is mentioned above, the framework of the study is shown in Figure 1.

3.2. Index Selection and Data Sources

TIE, in this article, is defined as the input–output efficiency of technological innovation activities, namely, the relative capability of a firm to maximise innovation outputs given a certain quantity of innovation inputs [14]. Technological innovation is a complex dynamic system of multiple agents and multiple input–output factors [35]. The input in the whole process involves many indicators such as talent, capital [36], knowledge, technology and information. Drawing lessons from the practices of [7,8,37], this paper considers the investment indicators selection based on three aspects, talent investment, capital investment and energy input, and uses the full-time equivalent of R&D personnel in industrial enterprises above the designated size, the stock of internal expenditure and the total energy consumption to characterise three indicators of each province, respectively. Meanwhile, the R&D expenditure is accounted for by the perpetual inventory method [38]:
srd i , t = rd i , t + srd i , t 1 ( 1 ϕ )
where srd i , t   represents the stock of investment of region i in technical renovation at year t ; rd i , t   represents the annual added investment in technical renovation or R&D activities in region i at year t ; srd i , t 1 represents the stock of investment of region i in technical renovation at year t 1 ; ϕ represents the depreciation rate for investment, which is generally set up as 15 percent.
The scientific and technological output is expressed by published scientific and technological papers [39,40,41] and the number of patent applications. The economic output is expressed by the sales income from new products of industrial enterprises above the designated size, and the environmental pollution index calculated by the entropy method is used to express non-expected output. In addition, due to China’s lack of environmental data in 2019, this paper uses the linear fitting method to supplement the missing data.
In the practice of innovation-driven development strategy, enterprises have become the main force of technological innovation to achieve sustainable development [42,43,44,45,46,47]. In view of the characteristics of innovation, and based on existing research, this paper constructs the environmental variable system that affects the innovation of each province from four dimensions: innovation market environment, innovation infrastructure [48], innovation financing environment and enterprise innovation potential. See Table A1 (Appendix A) for details.
Considering the heterogeneity of the market environment in each place and existing research, this paper selects the indicators of economic development level, regional openness and market competition intensity to describe the basic market environment of each province. Theoretically, the more relaxed and developed the market environment is, the more conducive it is to the germination of enterprise innovation behaviour. In general, the innovation level of a region is closely related to its economy, the productivity of economically developed areas is higher, and these areas’ innovation activities should also be more active [49]. Innovation activities often require a great amount of intellectual resources and material capital. Economically developed areas can gather many outstanding talents and rich funds, so enterprises usually have a more vital drive for technological innovation under this condition [7]. To a certain extent, the intensification of market competition can force enterprises positively to carry out innovation activities to gain more market advantage. However, in this process, it may also arouse competition for human resources, capital and energy, augmenting innovation cost and then causing innovation efficiency to decline. Therefore, market competition will affect industrial enterprises’ TIE externally.
In addition, scientific and technological infrastructure is the material basis and information guarantee of technological innovation [50], and the level of regional information construction also determines knowledge spillover efficiency [49]. In the era of the digital economy, the Internet has become the most important way for people to obtain information, and the development level of regional networks can measure the convenience of access to information. The more developed the regional information network is, the more convenient it is for innovation. Therefore, this paper brings Internet penetration into its model.
Schumpeter’s innovation theory holds that the availability of funds plays an important role in technological innovation. Innovation activities quickly face severe external financing constraints because of income uncertainty, information asymmetry and high regulatory costs, while financing constraints significantly inhibit enterprise innovation activities [8,17]. Therefore, the regional innovative financing environment is particularly important and should be considered.
According to the theory of evolutionary economic geography, the growth of innovation in a region is a dynamic process of continuous accumulation and growth of knowledge [49]. Moreover, some studies have pointed out that high-tech enterprises and high-level talents still dominate technological innovation. Therefore, it is undeniable that the entrepreneurial level of high-tech enterprises will significantly affect the potential and strength of regional innovation.
To sum up, the regression model of this paper can be set as follows:
score * = i = 1 N β i x it + ε it
where score means the TIE; x it represents the variables of PGDP, Rely, Compet, Tech, Internet and Fund; ε it represents the residual term.
This study selected 30 provinces and cities in China from 2010 to 2019 as the research sample (Tibet, Hong Kong, Macau and Taiwan are excluded due to a severe amount of missing data). Since 2011, the starting point standard of industrial enterprises has changed from 5 million to 20 million yuan of annual primary business income, so this paper limits the data collection period to 2011 to 2019.
The data processing and statistical analysis were completed by the software Stata 15.0. Based on the fact that the input and output of innovation activities have a specific time lag [51], the research [52] processed the output variable in a lag period. When using Maxdea software to measure the TIE of each province, the input index uses the data from 2010-18, while the output index uses the data from 2011–2019. From Table 1, it can be seen that the value of TIE measured by the super-efficiency SBM model is between [0.683 and 1.010], and the average value of efficiency is 0.86. The most important data standard deviation is PGDP, whose maximum value is about seven times the minimum. From the descriptive data results of other variables, we can see significant differences in the innovation environment among different provinces.
In order to eliminate the adverse effects from data dimensions, extreme values and outliers, logarithmic processing was carried out, except for percentage variables. Furthermore, the extreme data of 1% above and below the continuous variable were treated with Winsorized tail reduction [7]. Before logarithmization, the data related to the money were processed based on the 2010 deflator so that we could compare intertemporal data conveniently.

4. Results

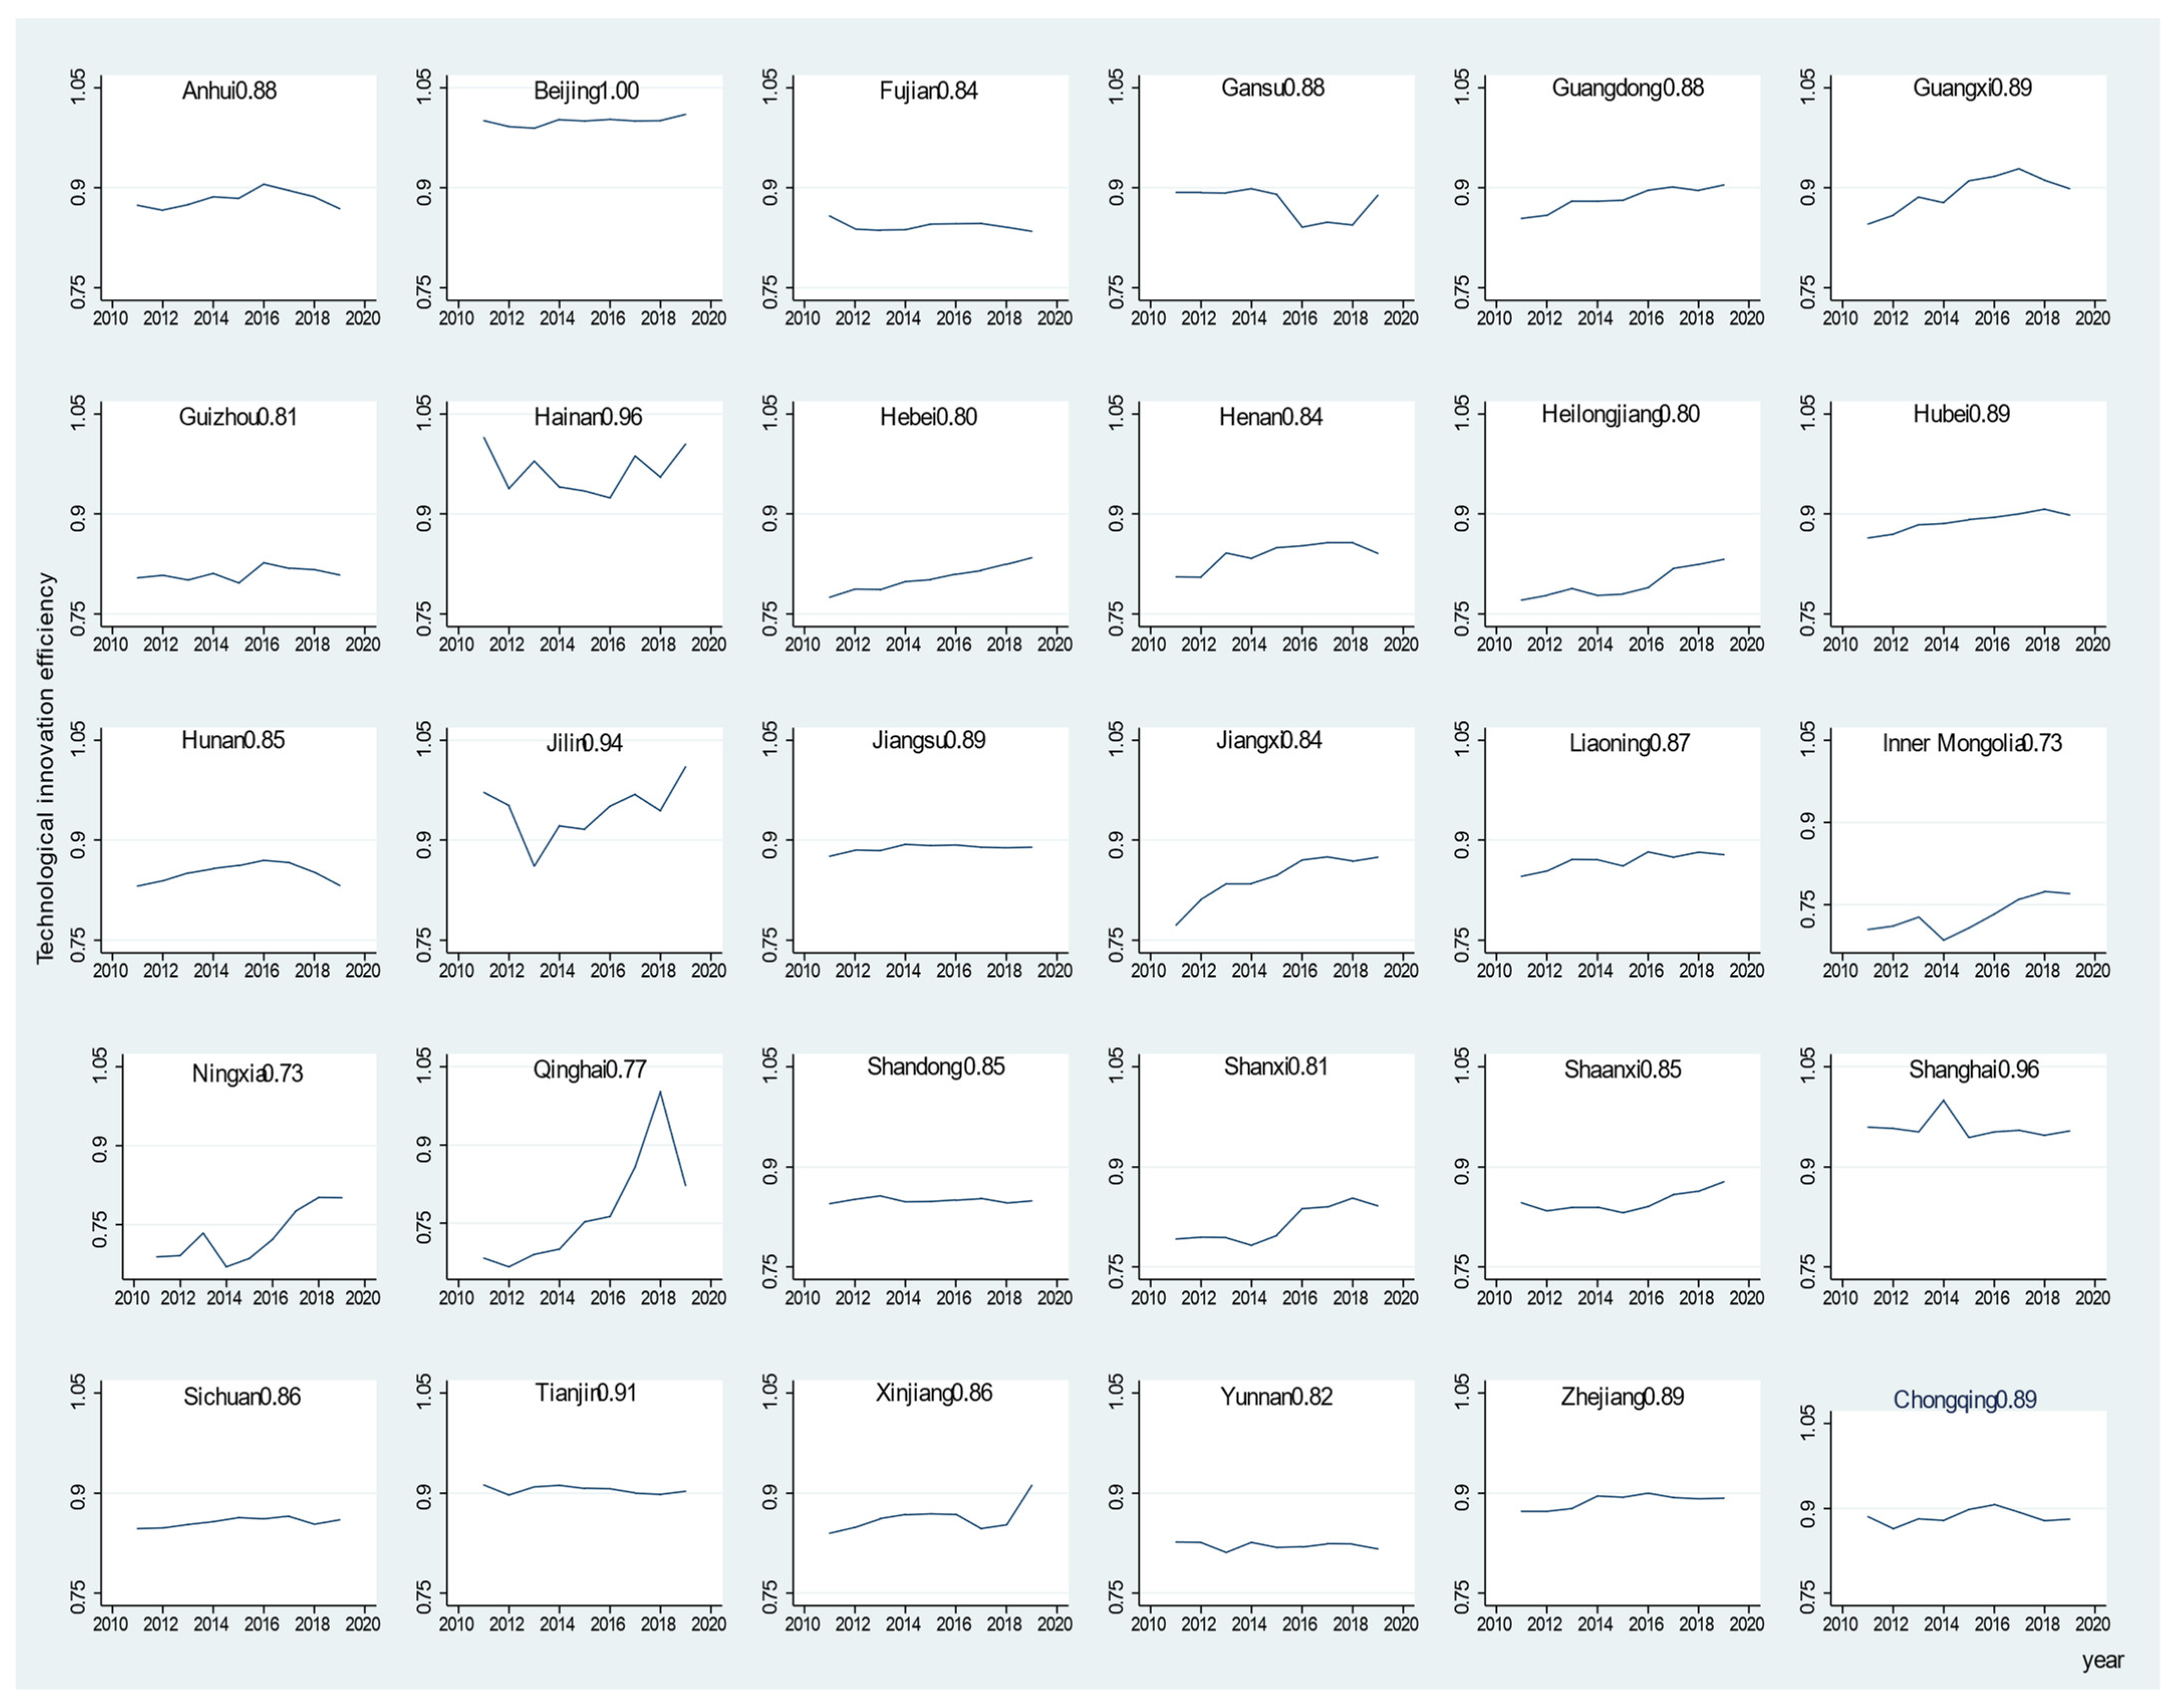
4.1. Calculation Results of TIE

The TIE of 30 provinces in China was calculated by Maxdea software, and the results are shown in Table A2 and Figure A1 (Appendix A).
From the overall innovation performance of each province, on the whole, most areas’ TIE is high. From 2011 to 2019, the top five provinces of TIE in China were Beijing (1.0), Shanghai (0.96), Hainan 0.96, Jilin—0.94 and Tianjin—0.91, respectively. They are still mainly concentrated in the eastern region, which has a more developed economy, denser population and higher education level, especially in Beijing, which has been ranked first for a long time and has stable performance. Comparatively speaking, the three provinces with lowest average efficiency are Qinghai (0.77), Ningxia (0.73) and Inner Mongolia (0.73), which are located in the underdeveloped west region. Thus, it can be seen that there are significant differences in the level of technological innovation in different regions. They are caused by the long-term and in-depth implementation of the government’s strategy of revitalising science and driving innovation in parts of areas. Furthermore, government keeps adhering to the industrial development direction of high-tech, green and innovative development. This could move TIE close to the overall frontier, while others still have effective options for improvement.
From the perspective of the dynamic evolution trend of technological innovation in China’s three major economic regions, a significant “east-middle-west” ladder decreasing feature and a non-equilibrium spatial distribution pattern of innovation efficiency exist. Despite the slight fluctuation, the TIE of most eastern provinces can still withstand the downward pressure of the economy and realise the improvement of the input–output index ratio and the steady improvement of efficiency. At the same time, the efficiency of Guangdong, Hebei, Jiangxi and other provinces has been on the rise. The central and western provinces such as Gansu, Shaanxi, Inner Mongolia, Xinjiang, Ningxia and Heilongjiang, which have had a relatively weak foundation for innovation in the past, have constantly adjusted the input resources based on the innovation-driven development strategy in recent years. Their structure of innovation investment has been further optimised, so their TIE has been improved.
However, it cannot be neglected that the TIE of central districts such as Anhui, Hunan and Henan has declined significantly in recent years. Compared with the eastern provinces, the TIE level is low, and the growth stamina is insufficient. The overall situation of efficiency improvement in these provinces is still severe.

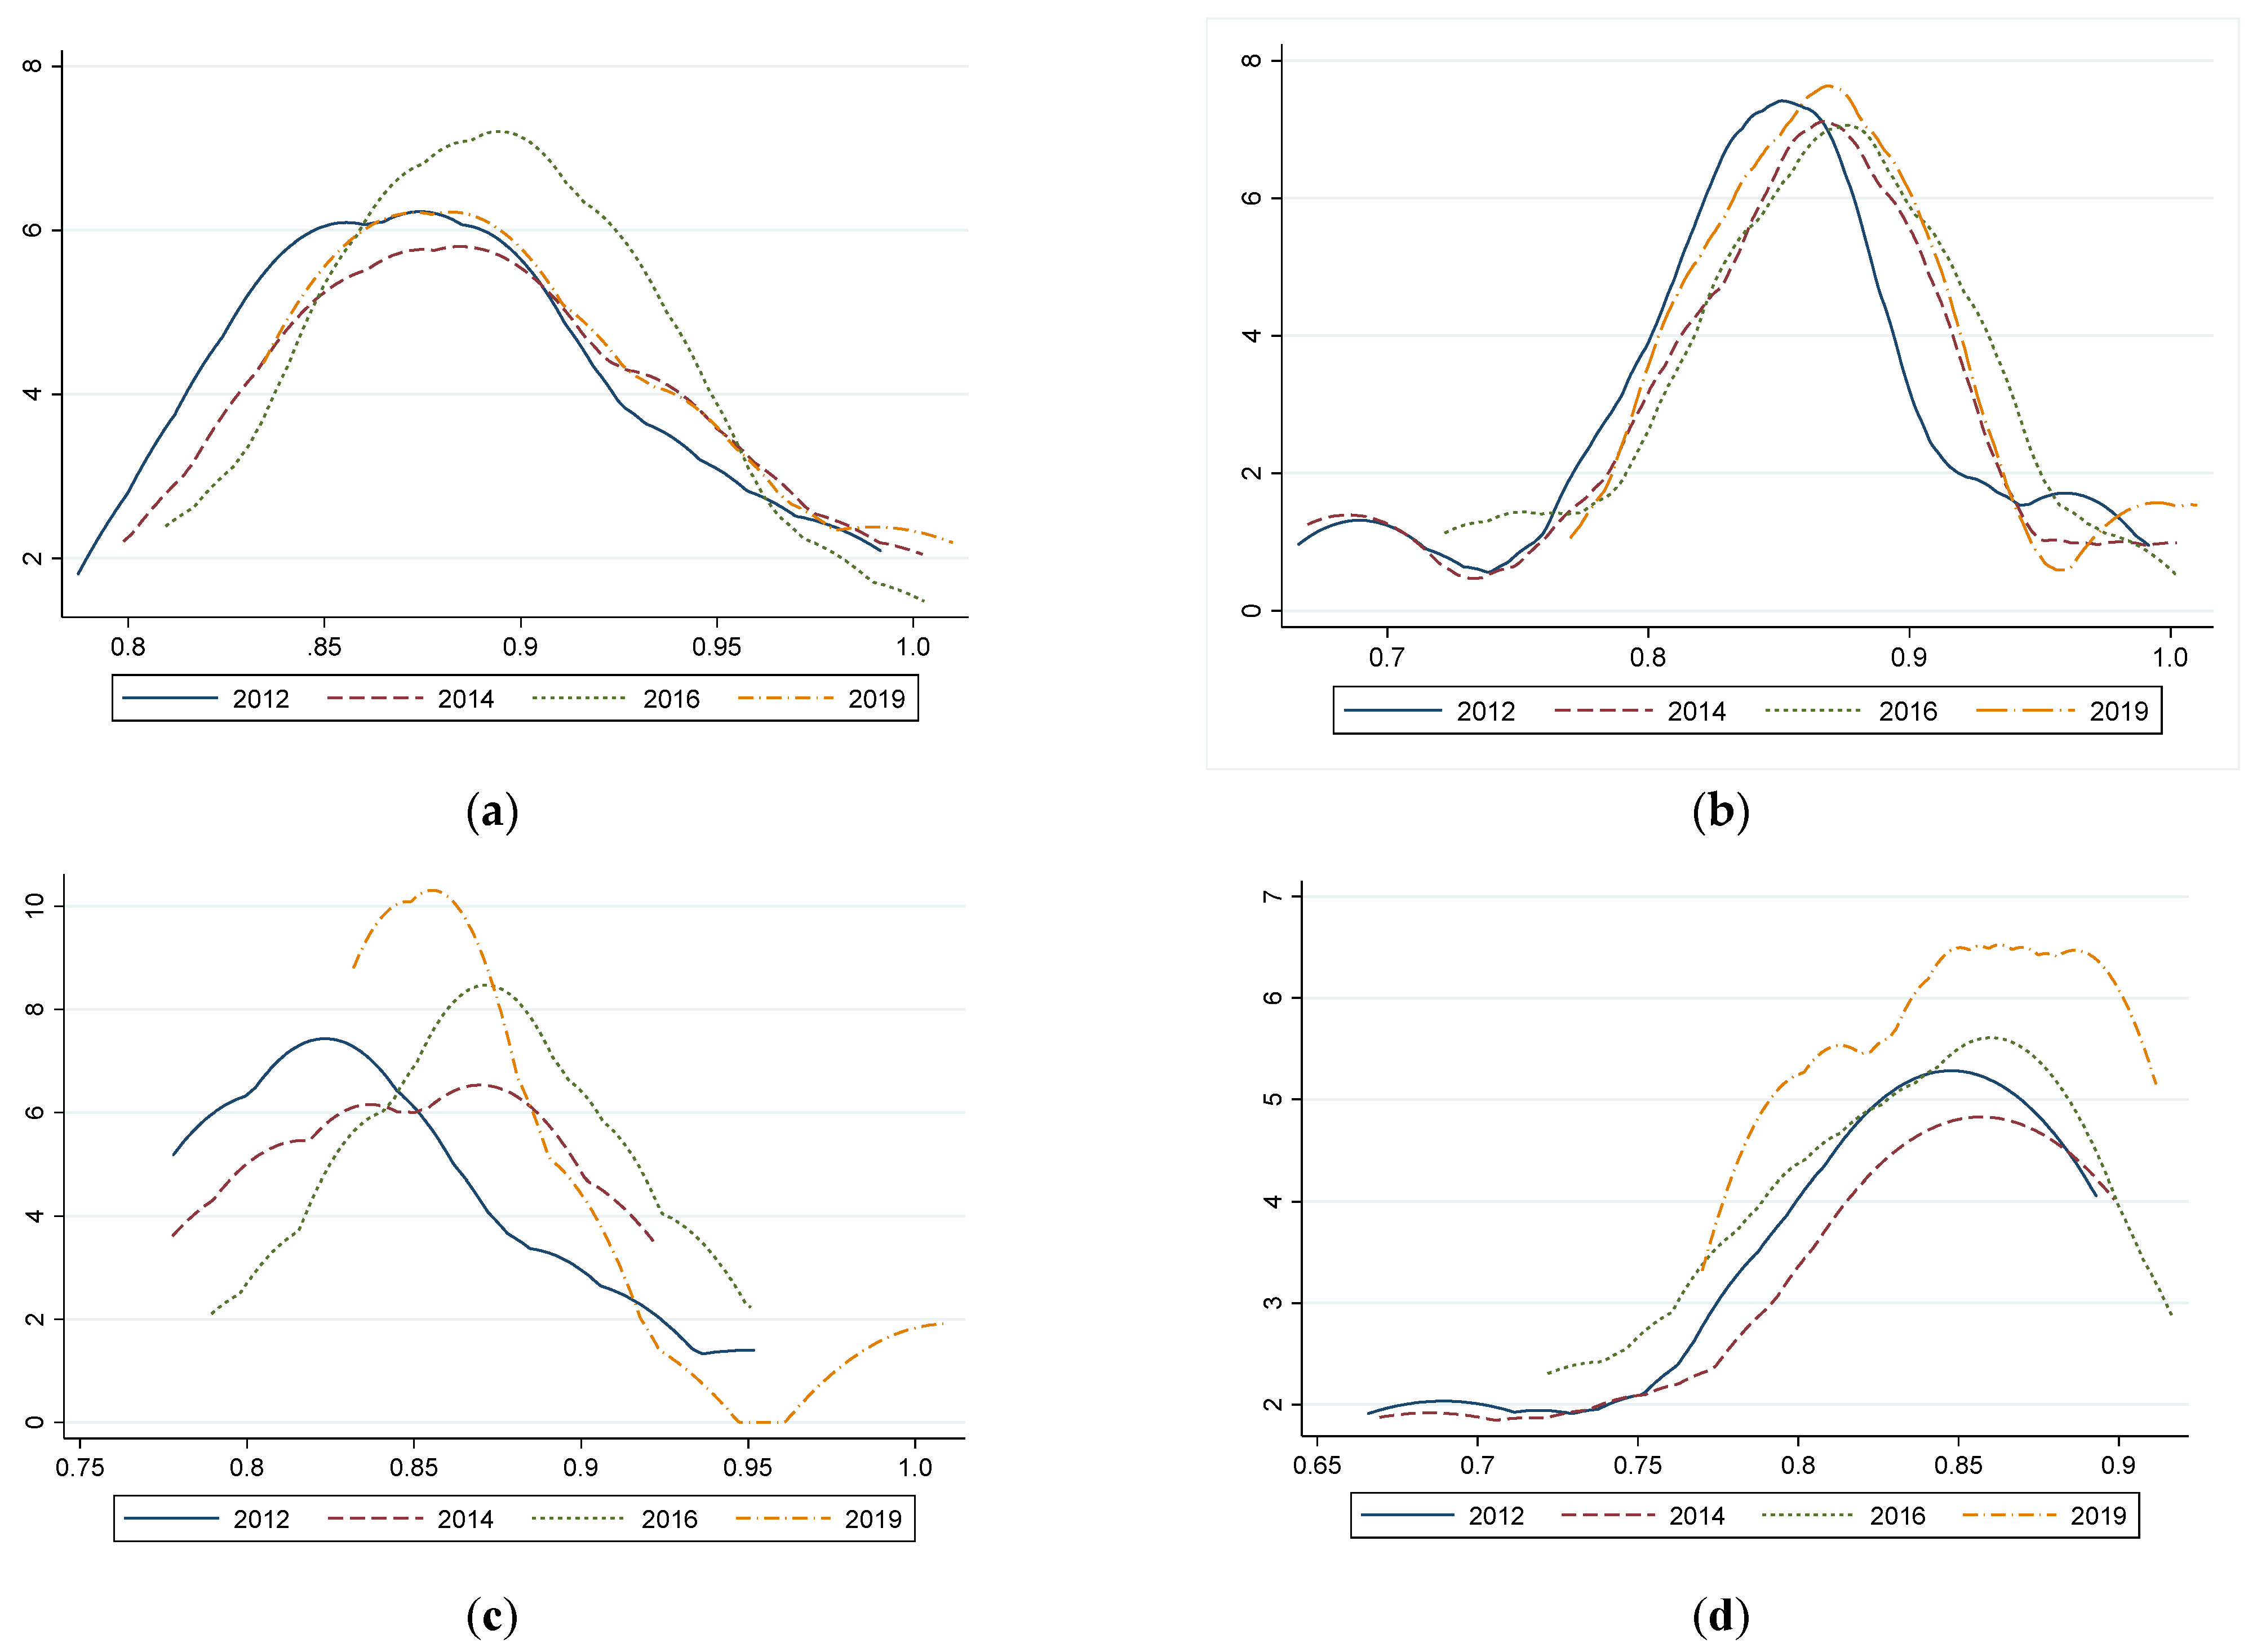
4.2. Analysis of Time Dimension Evolution Based on Kernel Density Estimation

In order to describe the dynamic evolution characteristics of the TIE of each province more comprehensively from the perspective of time dimension, the paper took the year 2012, 2014, 2016 and 2019 as the sample observation points. It used the kernel density function to estimate the kernel density curve of each DMU’s innovation efficiency. The results are shown in Figure 2, where Figure a to d represents the kernel density curves of the national, eastern, central and western regions, respectively.
The findings (Figure 2a) allow for concluding that the peak value of the curve at the national level increases with time, the peak shifts slightly to the right, and the right tail gradually shortens. Furthermore, the tail shows an obvious double-peak trend, which suggests that the TIE in most parts of China is gradually polarised.
Furthermore, the peak value of the curve in the first three sample observation sites of the eastern region increases over time, and the peak shifts significantly to the right (Figure 2b). Especially in 2016, the peak reaches the highest level, and the right tail shows a trend of elongation, which indicates that the overall situation of TIE in the east tended to be better from 2012 to 2016. The longer trailing shows that the polarisation of efficiency here is improved. However, there is an apparent uncoordinated problem with TIE [7].
The curve’s trend in the central region changes from unimodal to bimodal during 2012–2019 (Figure 2c), with the peak rising considerably and shifting slightly to the right, the kurtosis becoming narrower. The right tail is constantly lengthening, which indicates that the TIE improved, and there is little difference within the region. In 2019, its peak value not only increases significantly but also shifts to the left, indicating that the efficiency distribution of TIE in the central region tends to be dispersed with time. The efficiency values of some provinces are concentrated at a high level. In contrast, others are concentrated at a lower level, and the tendency of polarisation is becoming more and more obvious.
The nuclear density curve of TIE in the western region shows a slender left tail and disappears. The peak rises and then shifts to the right (Figure 2d). From 2012 to 2016, parts of provinces’ efficiency are at a low level, which seriously affected the regional improvement of the overall innovation capability and competitiveness. However, after 2016, the situation gradually changed, and the curve in 2019 shows a multi-peak shape. The distribution of efficiency values tended to be concentrated, indicating that the TIE gradually improved significantly. The regional differences in efficiency during the sample period first expanded and then narrowed.
To sum up, TIE’s temporal and spatial differentiation characteristics are apparent in different regions. As far as the region is concerned, since 2011–2019, the TIE of the whole country and the eastern region increased for a few years, but its value decreased slightly from 2016–2019, while the efficiency of the central region has become increasingly polarised, and the trend is strengthened. On the contrary, the western region improved steadily, which is expected to break the stereotyping of long-term inefficiency of technological innovation input and output in the underdeveloped western provinces.

4.3. Empirical Analysis of the Driving Factors of TIE

This paper adopts the panel Tobit model to analyse the key factors that will affect local technological innovation, and the specific empirical results are shown in Table 2. Due to its limited length, this paper will focus on the empirical results of Model (1).
From the perspective of the innovation market environment, the level of regional openness and the intensity of market competition positively drive TIE. In addition, the promoting effect of market competition intensity is significant at the statistical level of 10%. In comparison, the positive effect of regional opening up is still significant at 1%, indicating that for every 1% increase in the degree of regional openness and market competition intensity, its average marginal utility to the expected TIE will reach 0.073 and 0.012, respectively. Some studies have found that the improvement of the degree of openness is conducive to the absorption and utilisation of advanced external technology, especially in talent and capital resources. Therefore, the higher the degree of dependence on foreign trade, the more significant the technology spillover effect will be, and the more technological innovation will appear. The higher the intensity of market competition is, the more enterprises will be brought into the market, and the more fierce the market competition will be. In order to gain a competitive first-mover advantage, enterprises are more focused on technological innovation. To a certain extent, the intensification of competition can force enterprises to take initiative to carry out innovative activities. However, the sub-regional empirical results show that TIE in the eastern region is neither sensitive nor significant to the market environment factors, and the excellent market environment and perfect market mechanism do not stimulate more innovation behaviour.

5. Discussion

Contrary to the studies [11,12,13,24,25,26], this investigation was based on the SBM-DEA model. It allows for analysing the proportion changes between input and output of the production process in the framework of TIE.
Previous studies have shown a severe resource mismatch within innovative enterprises. The mismatch effect of resource market distortion is far greater than the inter-enterprise resources reallocation effect caused by enterprise innovation [53]. In addition, the level of economic development harms TIE, but it is not statistically significant. The higher the market level and the more developed the economy, the more conducive they are to the incubation of enterprises’ new technological achievements, but long-term research has found that innovation activities confront information asymmetry, externalities, income uncertainty, high risk, etc. Once innovation is obtained, due to technology spillover or other reasons, enterprises cannot enjoy innovation benefits exclusively [37]. Therefore, in different stages, the specific effects of economic development level on enterprise innovation may not be consistent.
For enterprises’ innovation potential, the entrepreneurial level significantly positively affects the TIE. When the proportion of high-tech enterprises increases by 1%, TIE’s average positive marginal utility increases by 0.291. The entrepreneurial level is prominent in promoting technological innovation in the eastern region. It shows that guiding local enterprises vigorously to transition to high-tech methods, eliminating backward production capacity, and setting up more enterprises with advanced science and technology and low resource consumption can essentially improve efficiency.
In terms of innovation infrastructure, Internet penetration contributes to innovation. However, it is not significant in this model, and the impact of information infrastructure on the eastern and western regions is quite different. The high Internet coverage in the eastern region is more conducive to improving efficiency, while the western region is the opposite, which may be due to it being sparsely populated. The Internet penetration rate is low (the eastern average is 0.602, while the western average is only 0.452), the infrastructure is not refined, and its positive effect on innovation has not yet been released.
The empirical results show that greater government R&D funding support intensity is more conducive to local technological innovation behaviour. For every 1 unit of government R&D funding support, the average marginal utility of the expected TIE will reach 0.192, which is more significant in the central and western regions. According to the statistical data, the average government subsidy level in the eastern region is much lower than in other places. With a good economic foundation, high living standards and developed private lending, funds for technological innovation depend more on the enterprises than the government.

6. Conclusions

This paper dynamically measures the TIE of 30 provinces in China from 2011 to 2019 based on the improved super-efficiency SBM-DEA model. It uses kernel density estimation to analyse the spatial-temporal differentiation characteristics and the dynamic evolution process of provincial TIE. On this basis, combined with the innovation market environment, innovation infrastructure, innovation financing environment, enterprise innovation potential and other factors, this article deeply explores the key driving factors of TIE. It has been found that there is a significant "east-middle-west" decreasing non-equilibrium spatial distribution pattern of TIE in China, and the spatial-temporal differentiation of efficiency in different regions is obvious. Secondly, it is found that the degree of regional openness, the intensity of market competition, government support and the level of enterprise entrepreneurship can significantly improve TIE. Based on the above empirical results, this paper puts forward the following suggestions.

6.1. For Government

China should increase the government support for technological innovation and endowment of regional innovation resources. This could be realised by providing financial subsidies and taxation, which was also proposed by [51]. The government should become the main body of the top-level design in the innovation system.
As the leaders in innovation, high-tech enterprises play an essential role. The government should develop policy for high-tech enterprises’ development. The number of high-tech enterprises will help invigorate regional resources and improve the allocation efficiency of input resources, as well as the efficiency of regional technological innovation.
Economic globalisation is an irreversible trend of this era, and General Secretary Xi Jinping has stressed that China should persist in opening its doors for construction. The higher the degree of economic opening to the outside world, the higher TIE might be. Some studies have shown that opening wider to the outside world is more conducive to the improvement of China’s industrial environmental performance rather than deterioration [23], which also means that further opening to the outside world is a reliable way to promote sustainable economic and social development in China’s backward areas.

6.2. For Practice

Some regions should build a sharing cooperation mechanism and scientific and technological innovation platform. They could enhance the regional original innovation capability and promote the diffusion and transformation of innovation achievements. It is necessary to improve the construction of information infrastructure and provide a good hardware environment for cultivating innovation. As the material basis and information guarantee of technological innovation, information infrastructure has become a significant force in promoting regional innovation. The innovation spillover effect led by the Internet should be taken seriously. At present, society has entered the era of the digital economy. As the primary carrier of knowledge and information, the Internet and other infrastructure is of great significance to speed up the construction of modern information networks and further promote technological innovation.

6.3. For Society

Increasing of TIE allowed achieving direct and indirect effects. Thus, the penetrating of effective innovations among society lead to improving quality of life, accessibility to the knowledge, providing well-being, etc. Furthermore, technological innovation reduces destructive impacts on the environment [47], which subsequently reduces morbidity and mortality. Notably, the ability of society to implement innovations determines the level of social, cultural and economic development of a country.
Despite the actual findings pertaining to the drivers of TIE, this study had several limitations. In further investigation, it would be necessary to consider the cointegration analysis between all variables that impact TIE. Furthermore, the number of drivers should be extended (social, digital, ecological, etc). This allows for identifying the relevant and significant drivers for boosting countries’ innovative development.

Author Contributions

Conceptualisation, Q.W., Y.C., H.G., O.L. and T.P.; methodology, Q.W., Y.C., H.G., O.L. and T.P.; formal analysis, Q.W., Y.C., H.G., O.L. and T.P.; investigation, Q.W., Y.C., H.G., O.L. and T.P.; writing—original draft preparation, Q.W., Y.C., H.G., O.L. and T.P.; writing—review and editing, Q.W., Y.C., H.G., O.L. and T.P.; visualisation, Q.W., Y.C., H.G., O.L. and T.P. All authors have read and agreed to the published version of the manuscript.

Funding

This research was funded by the grants from the Hunan Provincial Department of Education (21A0262).

Institutional Review Board Statement

Not applicable.

Informed Consent Statement

Not applicable.

Data Availability Statement

Not applicable.

Conflicts of Interest

The authors declare no conflict of interest.

Appendix A

Table A1. Variables and data.
CategoryVariableMeaningCalculation Method and Data ResourcesUnits
Input variablesEquTalent investmentFull-time equivalent of R&D personnel of industrial enterprises above designated size ayear/person
IfuCapital investmentFunds for R&D expenditure a10,000 yuan
EnergyEnergy inputTotal energy consumption cstandard coal thermal value (kJ/kg)
Output variablesPaperScience and technology outputPublished scientific and technological papers (including papers published abroad) apiece
PatentNumber of patent applications apiece
ProEconomic outputSales revenue of new products of industrial enterprises above designated size a10,000 yuan
PolluUnexpected outputEnvironmental pollution index dtun
Environmental variablesPgdpLevel of economic developmentThe logarithm of real GDP per capital bCNY/person
RelyDegree of regional opennessThe ratio of total imports and exports to regional GDP b%
CompetMarket competition intensityThe number of industrial enterprises above the designated size aUNITS
TechEnterprise entrepreneurship levelThe proportion of high-tech enterprises in industrial enterprises above designated size b%
InternetLevel of information infrastructureInternet penetration rate b%
FundGovernment fundsThe ratio of government R&D expenditure to regional R&D expenditure b%
Note: the statistical yearbook of the data source is abbreviated as: a—China Science and Technology Yearbook, b—China Statistical Yearbook, c—China Energy Statistical Yearbook, d—China Environmental Yearbook.
Table A2. TIE in all provinces during 2011-2019.
YearDMUScoreYearDMUScoreYearDMUScoreYearDMUScoreYearDMUScore
2019Anhui0.8692019Guizhou0.8082019Hunan0.8322019Ningxia0.8012019Sichuan0.86
2018Anhui0.8862018Guizhou0.8162018Hunan0.8522018Ningxia0.8022018Sichuan0.854
2017Anhui0.8962017Guizhou0.8182017Hunan0.8662017Ningxia0.7762017Sichuan0.866
2016Anhui0.9052016Guizhou0.8272016Hunan0.872016Ningxia0.7222016Sichuan0.861
2015Anhui0.8842015Guizhou0.7962015Hunan0.8622015Ningxia0.6862015Sichuan0.863
2014Anhui0.8862014Guizhou0.8112014Hunan0.8572014Ningxia0.6692014Sichuan0.857
2013Anhui0.8752013Guizhou0.8012013Hunan0.8512013Ningxia0.7342013Sichuan0.853
2012Anhui0.8662012Guizhou0.8082012Hunan0.8392012Ningxia0.6912012Sichuan0.848
2011Anhui0.8742011Guizhou0.8042011Hunan0.8312011Ningxia0.6882011Sichuan0.847
2019Beijing1.012019Hainan1.0052019Jilin1.012019Qinghai0.8222019Tianjin0.903
2018Beijing1.0012018Hainan0.9552018Jilin0.9442018Qinghai1.0022018Tianjin0.898
2017Beijing12017Hainan0.9872017Jilin0.9692017Qinghai0.8582017Tianjin0.9
2016Beijing1.0032016Hainan0.9242016Jilin0.9512016Qinghai0.7632016Tianjin0.906
2015Beijing12015Hainan0.9342015Jilin0.9162015Qinghai0.7532015Tianjin0.907
2014Beijing1.0022014Hainan0.942014Jilin0.9222014Qinghai0.72014Tianjin0.912
2013Beijing0.9892013Hainan0.9792013Jilin0.8612013Qinghai0.692013Tianjin0.909
2012Beijing0.9922012Hainan0.9382012Jilin0.9522012Qinghai0.6662012Tianjin0.897
2011Beijing1.0012011Hainan1.0152011Jilin0.9722011Qinghai0.6832011Tianjin0.912
2019Fujian0.8352019Hebei0.8342019Jiangsu0.8892019Shandong0.8492019Xinjiang0.912
2018Fujian0.8412018Hebei0.8252018Jiangsu0.8882018Shandong0.8462018Xinjiang0.852
2017Fujian0.8472017Hebei0.8152017Jiangsu0.8892017Shandong0.8532017Xinjiang0.847
2016Fujian0.8462016Hebei0.812016Jiangsu0.8932016Shandong0.8512016Xinjiang0.868
2015Fujian0.8462015Hebei0.8012015Jiangsu0.8912015Shandong0.8482015Xinjiang0.869
2014Fujian0.8372014Hebei0.7992014Jiangsu0.8932014Shandong0.8482014Xinjiang0.868
2013Fujian0.8362013Hebei0.7872013Jiangsu0.8842013Shandong0.8572013Xinjiang0.862
2012Fujian0.8382012Hebei0.7872012Jiangsu0.8852012Shandong0.8522012Xinjiang0.849
2011Fujian0.8582011Hebei0.7752011Jiangsu0.8762011Shandong0.8452011Xinjiang0.84
2019Gansu0.8892019Henan0.8412019Jiangxi 0.8742019Shanxi0.8422019Yunnan0.817
2018Gansu0.8442018Henan0.8572018Jiangxi 0.8682018Shanxi0.8542018Yunnan0.824
2017Gansu0.8492017Henan0.8572017Jiangxi 0.8752017Shanxi0.842017Yunnan0.824
2016Gansu0.8412016Henan0.8522016Jiangxi 0.872016Shanxi0.8372016Yunnan0.82
2015Gansu0.892015Henan0.8492015Jiangxi 0.8472015Shanxi0.7972015Yunnan0.819
2014Gansu0.8992014Henan0.8332014Jiangxi 0.8342014Shanxi0.7832014Yunnan0.826
2013Gansu0.8922013Henan0.8412013Jiangxi 0.8342013Shanxi0.7942013Yunnan0.811
2012Gansu0.8932012Henan0.8052012Jiangxi 0.8112012Shanxi0.7952012Yunnan0.826
2011Gansu0.8932011Henan0.8062011Jiangxi 0.7732011Shanxi0.7922011Yunnan0.827
2019Guangdong0.9042019Heilongjiang0.8322019Liaoning0.8782019Shaanxi0.8782019Zhejiang0.892
2018Guangdong0.8962018Heilongjiang0.8242018Liaoning0.8822018Shaanxi0.8642018Zhejiang0.892
2017Guangdong0.9012017Heilongjiang0.8182017Liaoning0.8742017Shaanxi0.8592017Zhejiang0.894
2016Guangdong0.8962016Heilongjiang0.7892016Liaoning0.8822016Shaanxi0.8412016Zhejiang0.9
2015Guangdong0.8812015Heilongjiang0.782015Liaoning0.8612015Shaanxi0.8312015Zhejiang0.894
2014Guangdong0.882014Heilongjiang0.7782014Liaoning0.8712014Shaanxi0.842014Zhejiang0.896
2013Guangdong0.882013Heilongjiang0.7882013Liaoning0.8712013Shaanxi0.8392013Zhejiang0.877
2012Guangdong0.8592012Heilongjiang0.7782012Liaoning0.8532012Shaanxi0.8342012Zhejiang0.873
2011Guangdong0.8542011Heilongjiang0.7712011Liaoning0.8452011Shaanxi0.8462011Zhejiang0.873
2019Guangxi0.8992019Hubei0.8982019In. Mong. 0.772019Shanghai0.9542019Chongqing0.881
2018Guangxi0.9112018Hubei0.9072018In. Mong0.7742018Shanghai0.9482018Chongqing0.878
2017Guangxi0.9292017Hubei0.92017In. Mong0.762017Shanghai0.9552017Chongqing0.893
2016Guangxi0.9172016Hubei0.8952016In. Mong0.7332016Shanghai0.9532016Chongqing0.907
2015Guangxi0.912015Hubei0.8912015In. Mong0.7082015Shanghai0.9442015Chongqing0.898
2014Guangxi0.8782014Hubei0.8862014In. Mong0.6852014Shanghai12014Chongqing0.879
2013Guangxi0.8862013Hubei0.8842013In. Mong0.7282013Shanghai0.9532013Chongqing0.882
2012Guangxi0.8592012Hubei0.8692012In. Mong0.7112012Shanghai0.9582012Chongqing0.864
2011Guangxi0.8452011Hubei0.8642011In. Mong0.7052011Shanghai0.962011Chongqing0.885
Note: DMU–decision making unit; In. Mong–Inner Mongolia.
Figure A1. Trends of TIE in the first stage. The decimals after the provinces are the average efficiency of the DMU from 2011–2019.
Sustainability 14 08321 g0a1

References

  1. Chen, Q.; Lin, S.; Zhang, X. The effect of China’s incentive policies for technological innovation: Incentivising quantity or quality. China Ind. Econ. 2020, 4, 79–96. [Google Scholar]
  2. Trzeciak, M.; Kopec, T.P.; Kwilinski, A. Constructs of Project Programme Management Supporting Open Innovation at the Strategic Level of the Organisation. J. Open Innov. Technol. Mark. Complex. 2022, 8, 58. [Google Scholar] [CrossRef]
  3. Shkarlet, S.; Kholiavko, N.; Dubyna, M. Information economy: Management of educational, innovation, and research determinants. Mark. Manag. Innov. 2019, 3, 126–141. [Google Scholar] [CrossRef]
  4. Fiľa, M.; Levicky, M.; Mura, L.; Maros, M.; Korenkova, M. Innovations for Business Management: Motivation and Barriers. Mark. Manag. Innov. 2020, 4, 266–278. [Google Scholar] [CrossRef]
  5. Vasylieva, T.A.; Kasyanenko, V.O. Integral assessment of innovation potential of ukraine’s national economy: A scientific methodical approach and practical calculations. Actual Probl. Econ. 2013, 144, 50–59. [Google Scholar]
  6. National Bureau of Statistics of China. 2022. Available online: http://www.stats.gov.cn/english/ (accessed on 1 March 2022).
  7. Basu, P.; Getachew, Y. Redistributive innovation policy, inequality, and efficiency. J. Public Econ. Theory 2019, 22, 532–554. [Google Scholar] [CrossRef] [Green Version]
  8. Xu, J.; Cui, J.B. Low-carbon cities and firms’ green technological innovation. China Ind. Econ. 2020, 12, 178–196. [Google Scholar]
  9. Zhang, L.; Huang, L. Research on Proactive GTIE Evaluation of Industrial Enterprises: Analysis Based on Improved Three Stage SBM-Dea Model. Stat. Inf. Forum 2020, 35, 50–61. [Google Scholar]
  10. Chygryn, O.; Lyulyov, O.; Pimonenko, T.; Mlaabdal, S. Efficiency of oil-production: The role of institutional factors. Eng. Manag. Prod. Serv. 2020, 12, 92–104. [Google Scholar] [CrossRef]
  11. Wang, Y.; Pan, J.-F.; Pei, R.-M.; Yi, B.-W.; Yang, G.-L. Assessing the technological innovation efficiency of China’s high-tech industries with a two-stage network DEA approach. Socio-Econ. Plan. Sci. 2020, 71, 100810. [Google Scholar] [CrossRef]
  12. Bi, K.; Huang, P.; Wang, X. Innovation performance and influencing factors of low-carbon technological innovation under the global value chain: A case of Chinese manufacturing industry. Technol. Forecast. Soc. Change 2016, 111, 275–284. [Google Scholar] [CrossRef]
  13. Li, H.; Zhang, J.; Wang, C.; Wang, Y.; Coffey, V. An evaluation of the impact of environmental regulation on the efficiency of technology innovation using the combined DEA model: A case study of Xi’an, China. Sustain. Cities Soc. 2018, 42, 355–369. [Google Scholar] [CrossRef]
  14. Cruz-Cázares, C.; Bayona-Sáez, C.; Garcίa-Marco, T. You can’t manage right what you can’t measure well: Technological innovation efficiency. Res. Policy 2013, 42, 1239–1250. [Google Scholar] [CrossRef]
  15. Zuo, Z.; Guo, H.; Li, Y.; Cheng, J. A two-stage DEA evaluation of Chinese mining industry technological innovation efficiency and eco-efficiency. Environ. Impact Assess. Rev. 2022, 94, 106762. [Google Scholar] [CrossRef]
  16. Albort-Morant, G.; Leal-Millán, A.; Cepeda-Carrión, G. The antecedents of green innovation performance: A model of learning and capabilities. J. Bus. Res. 2016, 69, 4912–4917. [Google Scholar] [CrossRef]
  17. Aghion, P.; Askenazy, P.; Berman, N.; Cette, G.; Eymard, L. Credit constraints and the cyclicality of r&d investment: Evidence from france. J. Eur. Econ. Assoc. 2012, 10, 1001–1024. [Google Scholar] [CrossRef]
  18. Dong, Z.; Wang, H. Local-neighborhood effect of green technology of environmental regulation. China Ind. Econ. 2019, 1, 100–118. [Google Scholar]
  19. Sharma, S.; Thomas, V.J. Inter-country R&D efficiency analysis: An application of data envelopment analysis. Scientometrics 2008, 76, 483–501. [Google Scholar] [CrossRef]
  20. Qian, L.; Wang, W.; Xiao, R. Analysis on the Regional Differences and Loss Sources of Green Innovation Efficiency of Chinese Enterprises Under Technology Heterogeneity. Sci. Res. Manag. 2021, 11, 1–16. [Google Scholar]
  21. Liu, Y.Q.; Quan, Q.; Zhu, J.; Wang, F. Green technology innovation, industrial agglomeration and ecological efficiency: A case study of urban agglomerations on Yangtze River Economic Belt. Resour. Environ. Yangtze Basin 2018, 27, 2395–2406. [Google Scholar]
  22. Shin, J.; Kim, C.; Yang, H. Does Reduction of Material and Energy Consumption Affect to Innovation Efficiency? The Case of Manufacturing Industry in South Korea. Energies 2019, 12, 1178. [Google Scholar] [CrossRef] [Green Version]
  23. Zhou, S.H.; Deng, Q. Impact of Technology Transfer on Green Innovation Efficiency in High-tech Manufacturing Industry. Sci. Technol. Prog. Countermeas. 2021, 38, 46–52. [Google Scholar]
  24. Wang, H.; Yang, T. Research on Green Technology Innovation Efficiency and Its Influencing Factors of Biomass Power Generation Enterprises: Test Based on Bootstrap-DEA Method. Sci. Technol. Manag. Res. 2021, 41, 191–198. [Google Scholar]
  25. Vlontzos, G.; Pardalos, P. Assess and prognosticate green house gas emissions from agricultural production of EU countries, by implementing, DEA Window analysis and artificial neural networks. Renew. Sustain. Energy Rev. 2017, 76, 155–162. [Google Scholar] [CrossRef]
  26. Amirteimoori, A.; Emrouznejad, A.; Khoshandam, L. Classifying flexible measures in data envelopment analysis: A slack-based measure. Measurement 2013, 46, 4100–4107. [Google Scholar] [CrossRef]
  27. Asmild, M.; Paradi, J.C.; Aggarwall, V.; Schaffnit, C. Combining DEA Window Analysis with the Malmquist Index Approach in a Study of the Canadian Banking Industry. J. Prod. Anal. 2004, 21, 67–89. [Google Scholar] [CrossRef]
  28. Gu, H.; Yue, J. The Relationship between Bank Efficiency and Stock Returns: Evidence from Chinese Listed Banks’. World J. Soc. Sci. 2011, 1, 95–106. [Google Scholar]
  29. Lin, S.; Sun, J.; Wang, S. Dynamic evaluation of the technological innovation efficiency of China’s industrial enterprises. Sci. Public Policy 2018, 46, 232–243. [Google Scholar] [CrossRef]
  30. Czyżewski, B.; Polcyn, J.; Brelik, A. Political orientations, economic policies, and environmental quality: Multi-valued treatment effects analysis with spatial spillovers in country districts of Poland. Environ. Sci. Policy 2021, 128, 1–13. [Google Scholar] [CrossRef]
  31. Kuzmenko, O.; Vasylieva, T.; Vojtovič, S.; Chygryn, O.; Snieška, V. Why do regions differ in vulnerability to COVID-19? Spatial nonlinear modeling of social and economic patterns. Econ. Sociol. 2020, 13, 318–340. [Google Scholar] [CrossRef]
  32. Tone, K. A slacks-based measure of efficiency in data envelopment analysis. Eur. J. Oper. Res. 2001, 130, 498–509. [Google Scholar] [CrossRef] [Green Version]
  33. Liu, H. Research on Innovation Performance and Its Affecting Factors of Industrial Enterprises in China—Empirical Analysis Based on the DEA-Tobit Two-step Method. J. Shanxi Univ. Financ. Econ. 2010, 32, 68–74. [Google Scholar]
  34. Tobin, J. Estimation of relationships for limited dependent variables. Econom. J. Econom. Soc. 1958, 26, 24–36. [Google Scholar] [CrossRef] [Green Version]
  35. Broekel, T.; Rogge, N.; Brenner, T. The innovation efficiency of German regions—A shared-input DEA approach. Rev. Reg. Res. 2017, 38, 77–109. [Google Scholar] [CrossRef] [Green Version]
  36. Bound, J.; Cummins, C.; Griliches, Z.; Hall, B.H.; Jaffe, A.B. Who does R&D and who patents? (No. w0908). In R&D, Patents, and Productivity; University of Chicago Press: Chicago, IL, USA, 1982; pp. 21–54. [Google Scholar]
  37. Yang, S.h.; Wu, T.; Li, Z. Study on Spatio-Temporal Differentiation and Influencing Factors of Green Innovation Efficiency in Yangtze River Economic Belt. Macroecon. Res. 2018, 2006, 107–117. [Google Scholar]
  38. Li, X.; Li, N.; Bai, J.H.; Xie, Z.Q. Study on the R&D innovation efficiency of High-tech industry in China. China Soft Sci. 2011, 2, 52–61. [Google Scholar]
  39. Tkachenko, V.; Kwilinski, A.; Korystin, O.; Svyrydiuk, N.; Tkachenko, I. Assessment of information technologies influence on financial security of economy. J. Secur. Sustain. Issues 2019, 8, 375–385. [Google Scholar] [CrossRef]
  40. Tiutiunyk, I.V.; Zolkover, A.O.; Lyeonov, S.V.; Ryabushka, L.B. The impact of economic shadowing on social development: Challenges for macroeconomic stability. Nauk. Visnyk Natsionalnoho Hirnychoho Universytetu 2022, 1, 183–191. [Google Scholar] [CrossRef]
  41. Kostiukevych, R.; Mishchuk, H.; Zhidebekkyzy, A.; Nakonieczny, J.; Akimov, O. The impact of European integration processes on the investment potential and institutional maturity of rural communities. Econ. Sociol. 2020, 13, 46–63. [Google Scholar] [CrossRef]
  42. Kendiukhov, I.; Tvaronavičienė, M. Managing innovations in sustainable economic growth. Mark. Manag. Innov. 2017, 3, 33–42. [Google Scholar] [CrossRef]
  43. Kharazishvili, Y.; Kwilinski, A.; Sukhodolia, O.; Dzwigol, H.; Bobro, D.; Kotowicz, J. The Systemic Approach for Estimating and Strategizing Energy Security: The Case of Ukraine. Energies 2021, 14, 2126. [Google Scholar] [CrossRef]
  44. Kharazishvili, Y.; Kwilinski, A.; Grishnova, O.; Dzwigol, H. Social Safety of Society for Developing Countries to Meet Sustainable Development Standards: Indicators, Level, Strategic Benchmarks (with Calculations Based on the Case Study of Ukraine). Sustainability 2020, 12, 8953. [Google Scholar] [CrossRef]
  45. Dalevska, N.; Khobta, V.; Kwilinski, A.; Kravchenko, S. A model for estimating social and economic indicators of sustainable development. Entrep. Sustain. Issues 2019, 6, 1839–1860. [Google Scholar] [CrossRef]
  46. Banytė, J.; Šalčiuvienė, L.; Dovalienė, A.; Piligrimienė, Ž.; Sroka, W. Sustainable Consumption Behavior at Home and in the Workplace: Avenues for Innovative Solutions. Sustainability 2020, 12, 6564. [Google Scholar] [CrossRef]
  47. Chygryn, O.; Krasniak, V. Theoretical and applied aspects of the development of environmental investment in Ukraine. Mark. Manag. Innov. 2015, 3, 226–234. [Google Scholar]
  48. Hashimoto, A.; Haneda, S. Measuring the change in R&D efficiency of the Japanese pharmaceutical industry. Res. Policy 2008, 37, 1829–1836. [Google Scholar] [CrossRef] [Green Version]
  49. Sun, Y.-K.; Li, G.-P.; Xi, Q.-M. Knowledge Structure, City Heterogeneity and Innovation Growth. Econ. Manag. 2021, 5, 60–74. [Google Scholar]
  50. Diaz-Balteiro, L.; Herruzo, A.C.; Martinez-Nuñez, M.; Gonzalez-Pachon, J. An analysis of productive efficiency and innovation activity using DEA: An application to Spain’s wood-based industry. For. Policy Econ. 2006, 8, 762–773. [Google Scholar] [CrossRef] [Green Version]
  51. Jianzhong, X.; Yanan, Z. Research on the Efficiency of Regional Low Carbon Innovation Network Based on J-SBM Three-stage DEA Model. Manag. Rev. 2021, 33, 97. [Google Scholar]
  52. Zhao, W.; Yang, H. Efficiency Evaluation of Western Regional Innovation Network Based on DEA. Sci. Res. Manag. 2016, 37, 393–400. [Google Scholar]
  53. Dai, X. The Puzzle of R&D Boom and Productivity Slowdown in China: The Role of Resource Misallocation. World Econ. 2021, 44, 86–109. [Google Scholar]
Figure 1. The steps of the investigation.
Sustainability 14 08321 g001
Figure 2. Kernel density curve of four regions. (a) the TIE of the whole country; (b) the TIE of the eastern region; (c) the TIE in the central region; (d) the TIE in the western region.
Sustainability 14 08321 g002
Table 1. Descriptive statistics of variables.
VariableMeanStd. Dev.MinMax
Score0.8600.0670.6831.010
PGDP47,617.1423,146.8418,951.46132,494.2
Rely0.2660.2730.0141.269
Compet8.8251.1955.82010.794
Tech0.0740.0440.0130.250
Internet0.5050.1240.2480.780
Fund0.2400.1350.0700.572
Table 2. Regression results of Tobit model.
Variables(1)(2)(3)(4)
Whole CountryEastern RegionCentral RegionWestern Region
PGDP−0.005
(−0.30)
−0.017
(−1.02)
−0.022
(−0.72)
−0.024
(−0.96)
Rely0.073 ***
(2.76)
−0.006
(−0.26)
0.139
(0.88)
0.334 **
(2.40)
Compet0.012 *
(1.94)
−0.007
(−1.15)
0.030 *
(1.65)
0.013
(1.06)
Tech0.291 *
(1.87)
0.459 ***
(3.31)
0.497
(1.10)
−0.076
(−0.19)
Internet0.048
(1.02)
0.130 ***
(2.96)
0.018
(0.17)
−0.237 **
(−2.19)
Fund0.192 ***
(4.68)
0.034
(0.72)
0.279 ***
(3.81)
0.248 ***
(3.44)
constant0.685 ***
(3.62)
1.028 ***
(5.07)
0.682 **
(2.01)
0.927 ***
(3.46)
N270997299
Wald chi2119.01056.77077.25056.240
Prob>chi20.0000.0000.0000.000
Log likelihood566.859267.667175.162183.690
Note: *** p < 0.01, ** p < 0.05 and * p <0.1; The representation in parentheses indicates t statistics. (1), (2), (3), (4)—number of model.
Publisher’s Note: MDPI stays neutral with regard to jurisdictional claims in published maps and institutional affiliations.

