Article

Soil Organic Carbon Stocks under Different Land Utilization Types in Western Kenya

by
Esphorn Kibet
1,
Collins Muimi Musafiri
2,
Milka Ngonyo Kiboi
2,3,
Joseph Macharia
4,
Onesmus K Ng’etich
1,
David K Kosgei
5,
Betty Mulianga
6,
Michael Okoti
7,
Abdirahman Zeila
8 and
Felix Kipchirchir Ngetich
2,9,*
1
Department of Water and Agricultural Resource Management, University of Embu, P.O. Box 6, Embu 60100, Kenya
2
Cortile Scientific, P.O. Box 34991, Nairobi 00100, Kenya
3
Division of Research Innovation and Outreach, KCA University, P.O. Box 56808, Nairobi 00200, Kenya
4
Department of Geography, Kenyatta University, P.O. Box 43844, Nairobi 00100, Kenya
5
Department of Agricultural Economics and Resource Management, Moi University, P.O. Box 3900, Eldoret 30100, Kenya
6
Kenya Agricultural and Livestock Research Organization (KALRO), Sugar Research Institute (SRI), P.O. Box 44, Kisumu 40100, Kenya
7
Kenya Agricultural and Livestock Research Organization (KALRO), Headquarters, P.O. Box 30148, Nairobi 00100, Kenya
8
The World Bank, Nairobi 00100, Kenya
9
School of Agricultural and Food Sciences, Jaramogi Oginga Odinga University of Science and Technology (JOOUST), P.O. Box 210, Bondo 40601, Kenya
*
Author to whom correspondence should be addressed.
Sustainability 2022, 14(14), 8267; https://doi.org/10.3390/su14148267
Submission received: 6 June 2022 / Revised: 3 July 2022 / Accepted: 5 July 2022 / Published: 6 July 2022
(This article belongs to the Special Issue Policy, Land Use and Management of Natural Resources)

Abstract

:
The up-surging population in sub-Saharan Africa (SSA) has led to the conversion of more land for agricultural purposes. Resilient land utilization types that input carbon to the soil are key in enhancing climate change mitigation. However, there are limited data on different land utilization types’ contribution to climate mitigation through carbon input to soils. The study aims to quantify carbon stock across different land utilization types (LUT) practiced in Western Kenya. The following land utilization types were studied: agroforestry M (agroforestry with Markhamia lutea), sole sorghum, agroforestry L (agroforestry with Leucaena leucocephalaI), sole maize, and grazing land replicated thrice. To determine soil bulk density, SOC concentration, and soil carbon stock, soil samples were collected at depths of 0–5, 5–10, 10–20, and 20–30 cm from different LUTs. A PROC ANOVA was used to determine the difference in soil bulk density, SOC, and SOC stock between different LUTs and depths. The four variables differed across the LUTs and depths. A high soil bulk density was observed at 0–5 cm under grazing land (1.6 g cm−3) and the lowest under agroforestry M (1.30 g cm−3). Conversely, the soil bulk density was low at 20–30 cm under grazing land. The 0–5 cm depth accounted for a high share of SOC and SOC stock under Agroforestry M, while the 10–20 and 20–30 cm depth accounted for the high share of SOC stock under agroforestry L. The study showed differences in SOC across the different depths and LUTs. The findings highlight that agroforestry L and agroforestry M are promising interventions toward climate mitigation through carbon induction to soils.

1. Introduction

Land use alters ecosystems’ function and structure, increasing or decreasing carbon stock and consequently affecting biodiversity [1]. Generally, about 79% of carbon is stored in soil compartments [2]. Carbon plays a fundamental role in agronomic production, soil fertility, and ecosystem health [3,4]. However, with the increase in population, more land has been degraded due to limited available land [5], thus lowering crop production [6]. To increase carbon input to soils, farming systems and land utilization should honor the 4/1000 initiative (http://4p1000.org/, accessed on 4 April 2022), which aims to increase carbon by 4% to 40 cm depth.
The change of more land for crop production has significantly led to decreased carbon concentration and stocks and increased anthropogenic greenhouse gas emissions (CO2). Agriculture contributes 14–17% of global greenhouse gas emissions through changes in land utilization and intensification of agricultural activities [7]. Agriculture can remedy climate change through the implementation of sustainable farming practices that increase carbon input in soils and reduce greenhouse gas (GHG) emissions [4,8,9]. In Kenya, the increasing population has led to the conversion of more land to croplands to meet dietary needs to curb food insecurity [6]. The diversity of land utilization has been necessitated by reduced land holding, especially in Western Kenya [10]. The change in land utilization types may significantly influence soil organic carbon (SOC) in soil compartments.
Diverse land utilization types include grazing lands (intensively controlled grasslands, pasture lands), agroforestry systems (afforestation and general agroforestry systems and home gardens), and intensively managed croplands (annual and perennial crops) [1,2,11]. Among these, grazing land occupies nearly 40% of the total land utilized globally [12]. It is considered that grazing land stores considerable amounts of SOC. However, studies have come up with conflicting findings, while Qiu et al. [13] and Sheng et al. [12] found a reduction in carbon stock under intense grazing, and Silveira et al. [14] found promising findings concerning carbon storage. Additionally, the croplands have a diverse influence on SOC that affects soil health and productivity [8,15]. However, in an attempt to increase carbon inputs and reduce the incidence of climate change, agroforestry systems have been introduced [16]. According to a review by Kim et al. [7], agroforestry systems proved advantageous in crop production and increasing soil restoration. Adopting agroforestry has improved carbon inputs to soil compartments and reduced greenhouse gas emissions [4]. Cultivation and cropping intensity reduce carbon in soils [17]. On the other hand, croplands are thought to lower carbon inputs in the study area [5].
The SOC stock is a predictor of soil quality and health, used as a measurable component of soil organic matter (SOM) [15]. Soil organic carbon is driven by site characteristics [18], environment [3], and management practices [19,20]. Specifically, soil water holding capacity, pH, and nutrients, such as nitrogen and phosphorus concentration, affect SOC [1]. The soil’s physical characteristics play a crucial role in regulating the carbon input and output rate. Clay content protects organic carbon against microbial oxidation and helps to stabilize carbon [21]. Conversely, a high fraction of sand content can lead to a low SOC storage. Soil bulk density can significantly affect carbon stock [22]. Soil depth affects the SOC stock. Generally, SOC stock decreases with increasing depths [22]. Therefore, the variability of land utilization types could affect carbon due to varied soil characteristics and the level of disturbance. Despite assorted works on carbon dynamics under croplands [5,8], knowledge of the effect of specific LUTs on SOC stock under the smallholder rainfed-dependent tropical farming systems is limited [11]. Thus, the study fills a data gap on the effects of LUTs on SOC stocks in smallholder farms.
This study aim to evaluate the effects of LUTs on SOC stock across the soil profile (0–30 cm). The hypotheses backing this study are: (i) LUTs can vary soil organic carbon stock across soil profiles and (ii) soil bulk density can control SOC stock storage.

2. Materials and Methods

2.1. Study Area

The study was conducted in smallholder farms (0°01′47.27″ S, 34°16′41.5″ E) of the Nyajuok sub-location, Alego-Usonga sub-county, Siaya County, Kenya. The selected farms lie at approximately 1236 m above sea level. Nyajuok lies in the lower midland (LM1) agroecological zone, mainly a sugarcane belt. The area experiences bimodal rainfall distribution with a long rain (LR) season from March to July and short rains (SR) from August to December. The area receives long-term annual rainfall between 1500 and 1900 mm and temperatures ranging from 20.9 to 21.8 °C. Rainfall during the SR season is in the range of 600–800 mm, while for LR season, it is in the range of 750–950 mm [23]. The soil type in the area is Ferralsols, with declining soil fertility attributed to continuous cropping practices without amendments [24]. The main economic activity in the area is rainfed agriculture, with a low farm holding per household of 1.0 ha [10]. The primary land utilization types include livestock grazing, agroforestry, and cereals (monocropping and intercropping). The smallholder farmers often intercrop cereals, such as maize (Zea mays) and sorghum (Sorghum bicolar), with common beans (Phaseolus vulgaris), cowpeas (Vigna unguiculata), and soya beans (Glycine max) [23].

2.2. Experimental Design

The study design was farmer-designed and -managed (Type III). The smallholder farms were selected based on gradient homogeneity, soil type, and elevation. The study was conducted during the short rains of 2020 (SR 20) and the long rains of 2021 (LR 21). Five land utilization types under a similar soil type—Ferralsols—were selected; the homogeneity in farm characteristics aided in limiting errors and uncertainties of data quality. The selected land utilization types included (i) agroforestry with Markhamia lutea, (ii) sole sorghum, (iii) agroforestry with Leucaena leucocephala, (iv) sole maize, and (v) grazing land. In each land utilization type, measurements were conducted from three randomly established plots, with three replications.

2.3. Soil Sampling

Undisturbed soil organic carbon and soil bulk density samples were collected from four depths (0–5, 5–10, 10–20, and 20–30 cm) per land utilization type using a 100 cm3 core ring (Eijkelkamp Agrisearch Equipment, Giesbeek, The Netherlands). The soil samples were collected at plot level (replicate of LUT) in June 2021. Four soil samples from every replicate of land utilization type were taken. The total number of samples was sixty. For soil texture, soil samples were collected in each replicate of the selected land utilization type up to a depth of 20 cm, and then mixed by hand in well-labeled Zip Lock bags to form one composite sample totaling five samples. Samples were then transported to the laboratory for analysis.

2.4. Laboratory Analysis

Soil texture samples were subjected to analysis following the hydrometer method. Soil bulk density was analyzed gravimetrically by oven drying at 105 °C for 24 h [25]. The soil samples were then passed through a 2 mm sieve and analyzed for soil organic carbon (SOC) following the Walkley and Black wet oxidation method [25]. Percentage carbon (% C) was calculated using Equation (1).
CS = SOC × Pb   ×   D × 100
where CS is carbon stock (kg C ha−1), SOC is soil organic carbon concentration (g C kg−1), Pb is soil bulk density (g cm−3), and D is soil depth (cm).

2.5. Statistical Analysis

The statistical analysis was performed using SAS 9.4 software. A PROC ANOVA was used to determine the difference in soil bulk density, SOC%, and SOC stock between different LUTs and depths. Mean separation was conducted using Tukey’s honest significant difference (HSD) test at p < 0.05. A simple Pearson correlation was conducted to determine the relationship between SOC and soil bulk density under LUTs. The normality of the data was checked using Proc Univariate, where treatment, depths, and replicates were fixed factors, while bulk density, SOC, and carbon stock were random factors.

3. Results and Discussion

3.1. Soil Texture

The soil had a high percentage of sand followed by silt in all the treatments. Sole maize had the highest percentage of sand (52%) and the lowest clay percentage (15%). The soil texture was predominantly loam across the different land utilization types (Table 1).
Soil texture plays a fundamental role in soil nutrient management and the rate at which soil minerals translocate across the soil profile. The clay content in soils predicts the rate of soil compaction [26], thus influencing the movement of SOC across the soil profile. However, in this study, the amount of silt and clay fractions across the land utilization type could not be linked to the amounts of carbon because of similar silt–clay concentrations. The results are consistent with the findings of Gonçalves et al. [3], who found no texture effects on carbon pools. However, Bruun et al. [27] and Saidy et al. [21] demonstrated that silt and clay fractions play a crucial role in stabilizing carbon. Additionally, clay fractions help in protecting carbon against microbial oxidation [21]. Gonçalves et al. [3] reported a significant increase in microbial respiration and consequently loss of carbon from soil compartments with increasing silt and sand contents.

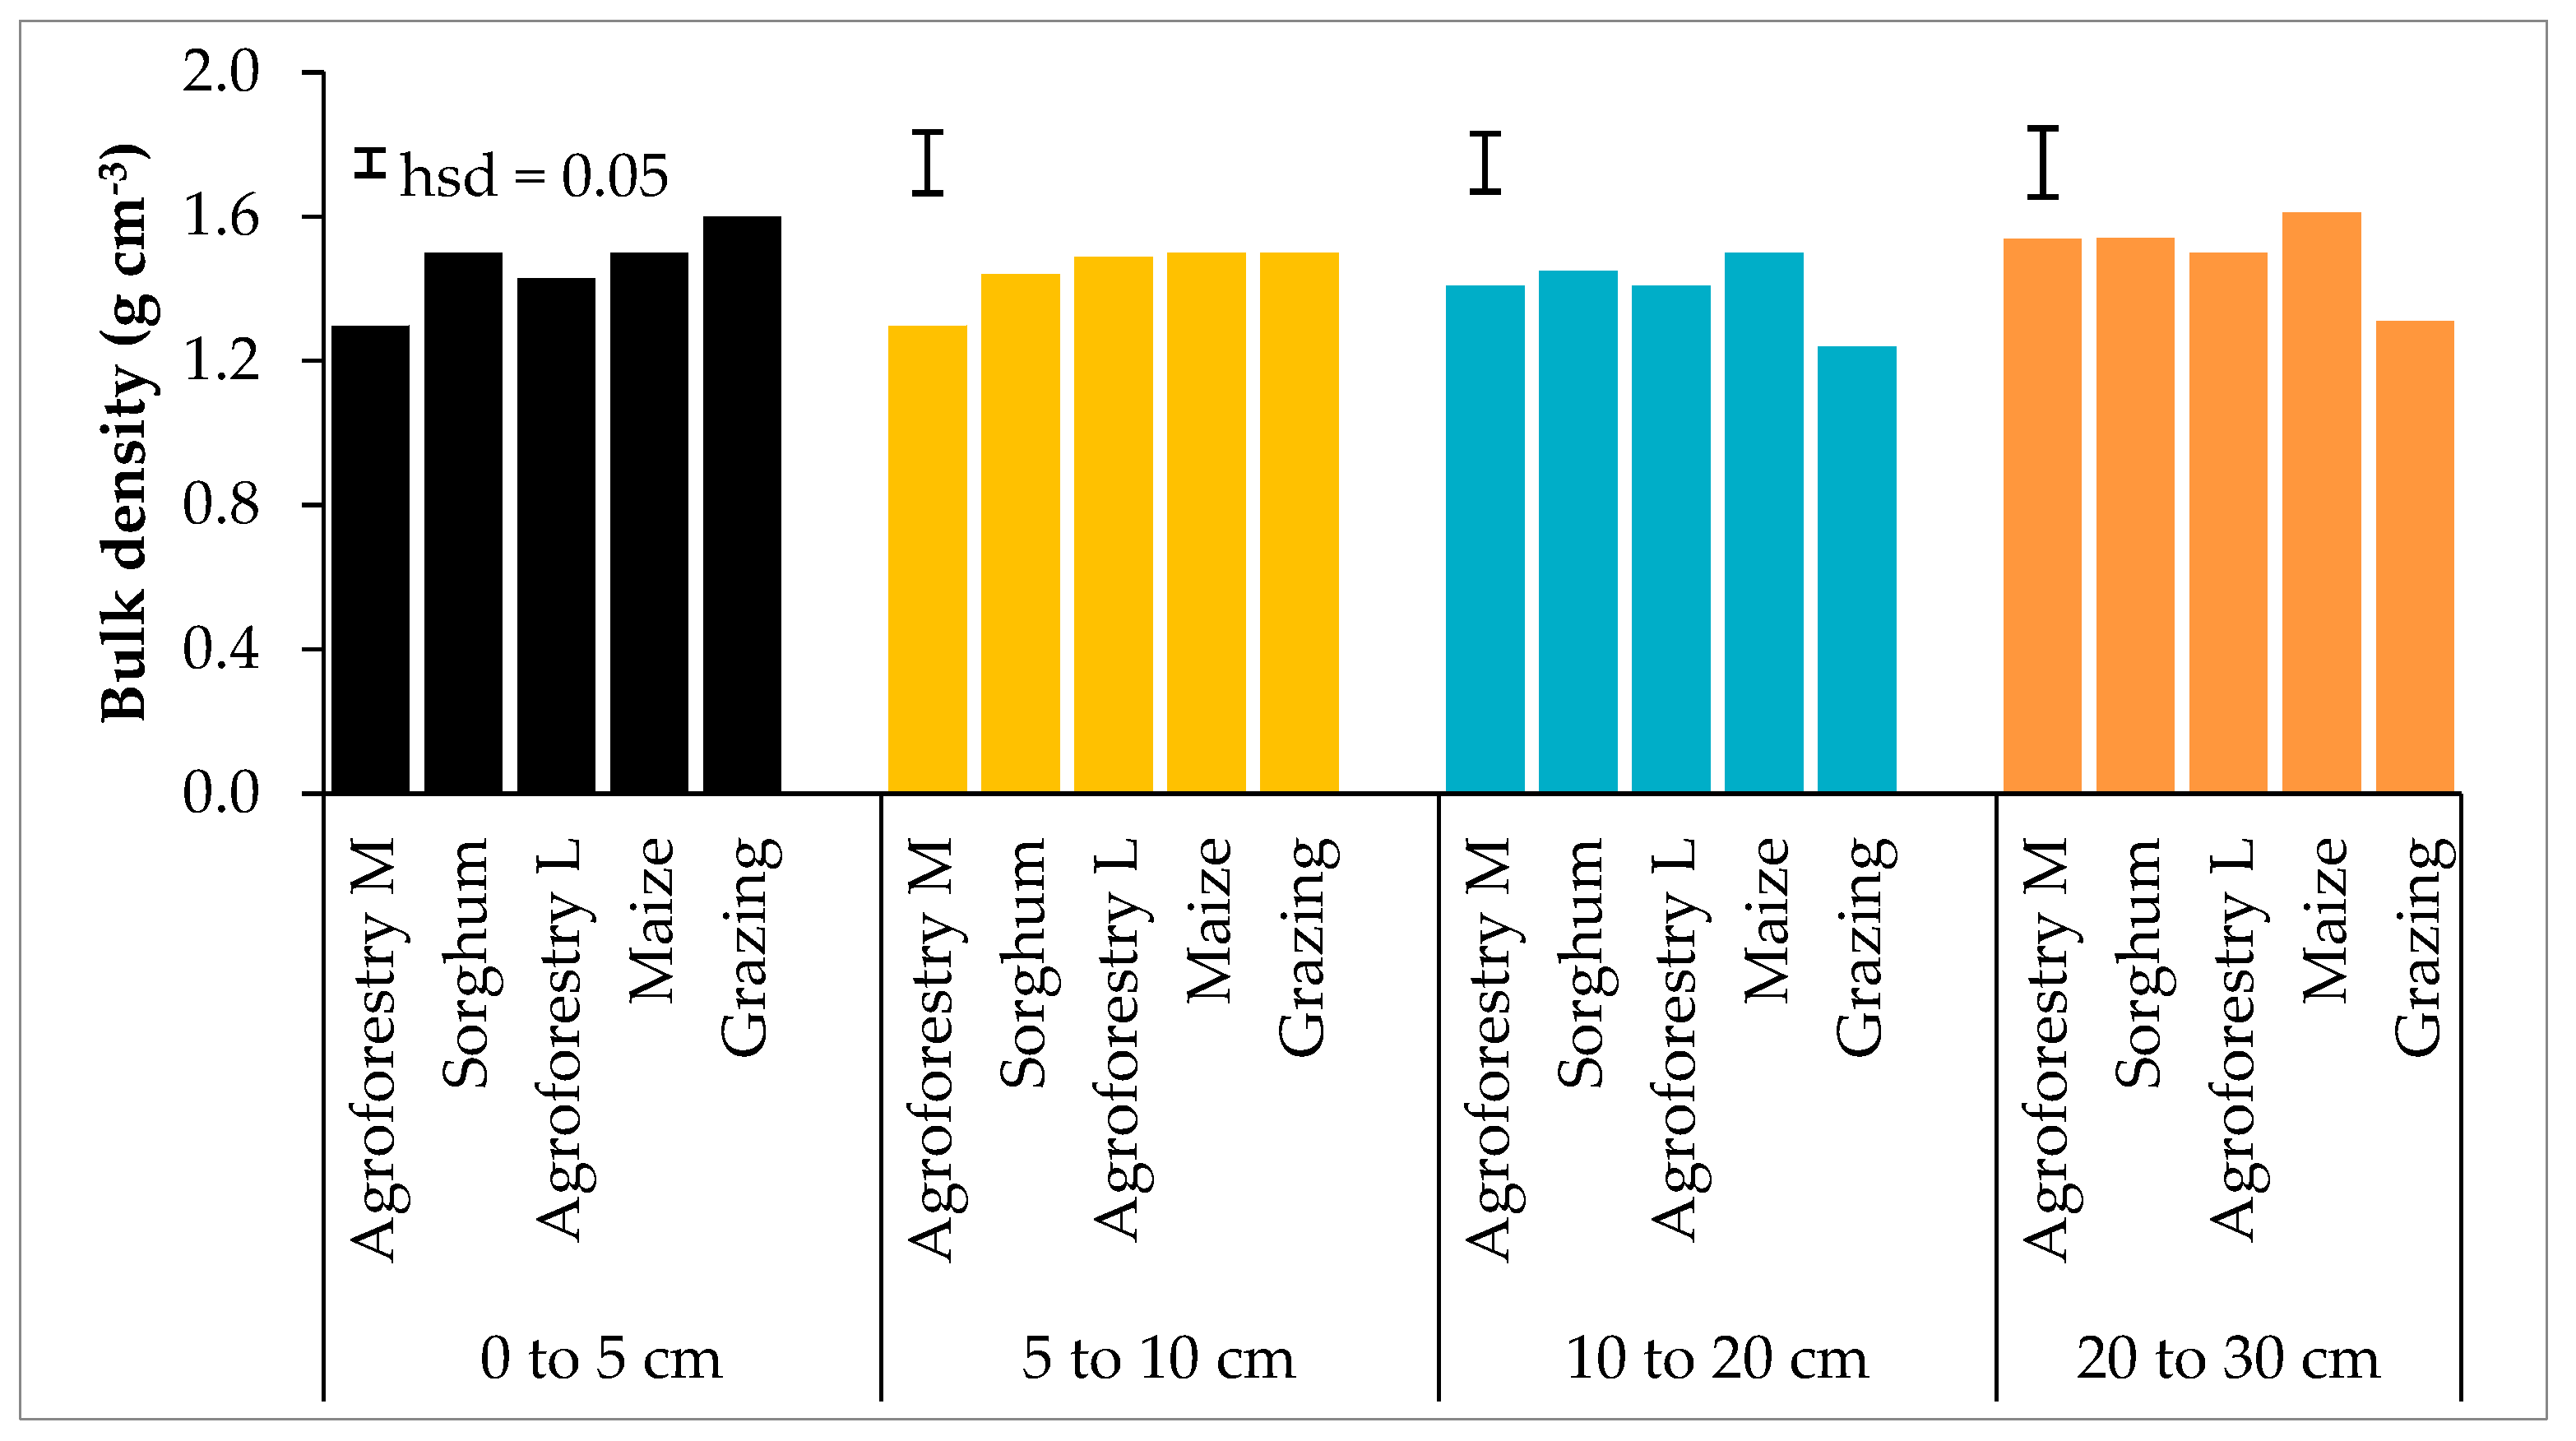
3.2. Soil Bulk Density in Different Land Utilization Types at Different Depths

Significant (p < 0.05) differences were observed in soil bulk densities across the selected LUTs and soil depths (Figure 1). The soil bulk density in different LUTs and depths ranged from 1.24 to 1.61 g cm−3 (Figure 1). There was a significant (p < 0.0001) difference in soil bulk density at the 0–5 cm depth across the LUTs, with the variability ranging from 1.3 to 1.6 g cm−3. The highest soil bulk density was under grazing land, while the lowest was in agroforestry M (Figure 1). There was a significant (p = 0.02) difference at the 5–10 cm depth with low distinction across LUTs. Nonetheless, sole sorghum had a high soil bulk density (1.44 g cm−3). Additionally, a significant (p = 0.01) difference was observed in bulk density at the 10–20 cm and 20–30 cm depths, with grazing land having the lowest in both depths (Figure 1).
Soil bulk density is a fundamental soil parameter affected by soil clay content, soil aeration status, texture, and soil enzymes, which are a function of soil nutrients [28]. It is a predictor of the nutrient concentration in the soil [29]. The soil bulk density in this study was within those conducted in SSA [4,8,26]. The results show a high soil bulk density in sole sorghum, sole maize, and agroforestry L compared to the information obtained from the East African soil database [30]. These results could be attributed to the low mechanical fracturing of soils that reduces soil bulk density [26]. Martin et al. [18] found a low soil bulk density under grazing land compared to cropland; this was contrary to the results observed in this study, where grazing land had a higher soil bulk density than all LUTs. Grazing land was the most compacted due to livestock trampling on upper depths, thus reducing microbial activities [31]. Additionally, compaction in grazing land could have increased micro-porosity and reduced macro-porosity, hence a high BD on the upper depths [12].
Agroforestry systems showed a low bulk density, which could be attributed to an increase in soil volume, while reducing the soil mass due to high organic matter from leaf litterfall. Rahman et al. [22] found a low soil bulk density under the agroforestry systems. Further, Guo et al. [1] found a low soil bulk density under poplar plantations. Root penetrance might have increased the pore spaces in soil layers, hence increasing air circulation, which necessitates the decomposition of organic matter in the soil layers by increasing microbial activities [16], thus a low bulk density. The high bulk density at the 0–5 cm depth under the sole maize and sole sorghum could be attributed to the soils’ low organic matter (OM). Generally, the low soil amendments in sole maize and sole sorghum could lead to a high soil bulk density [26].

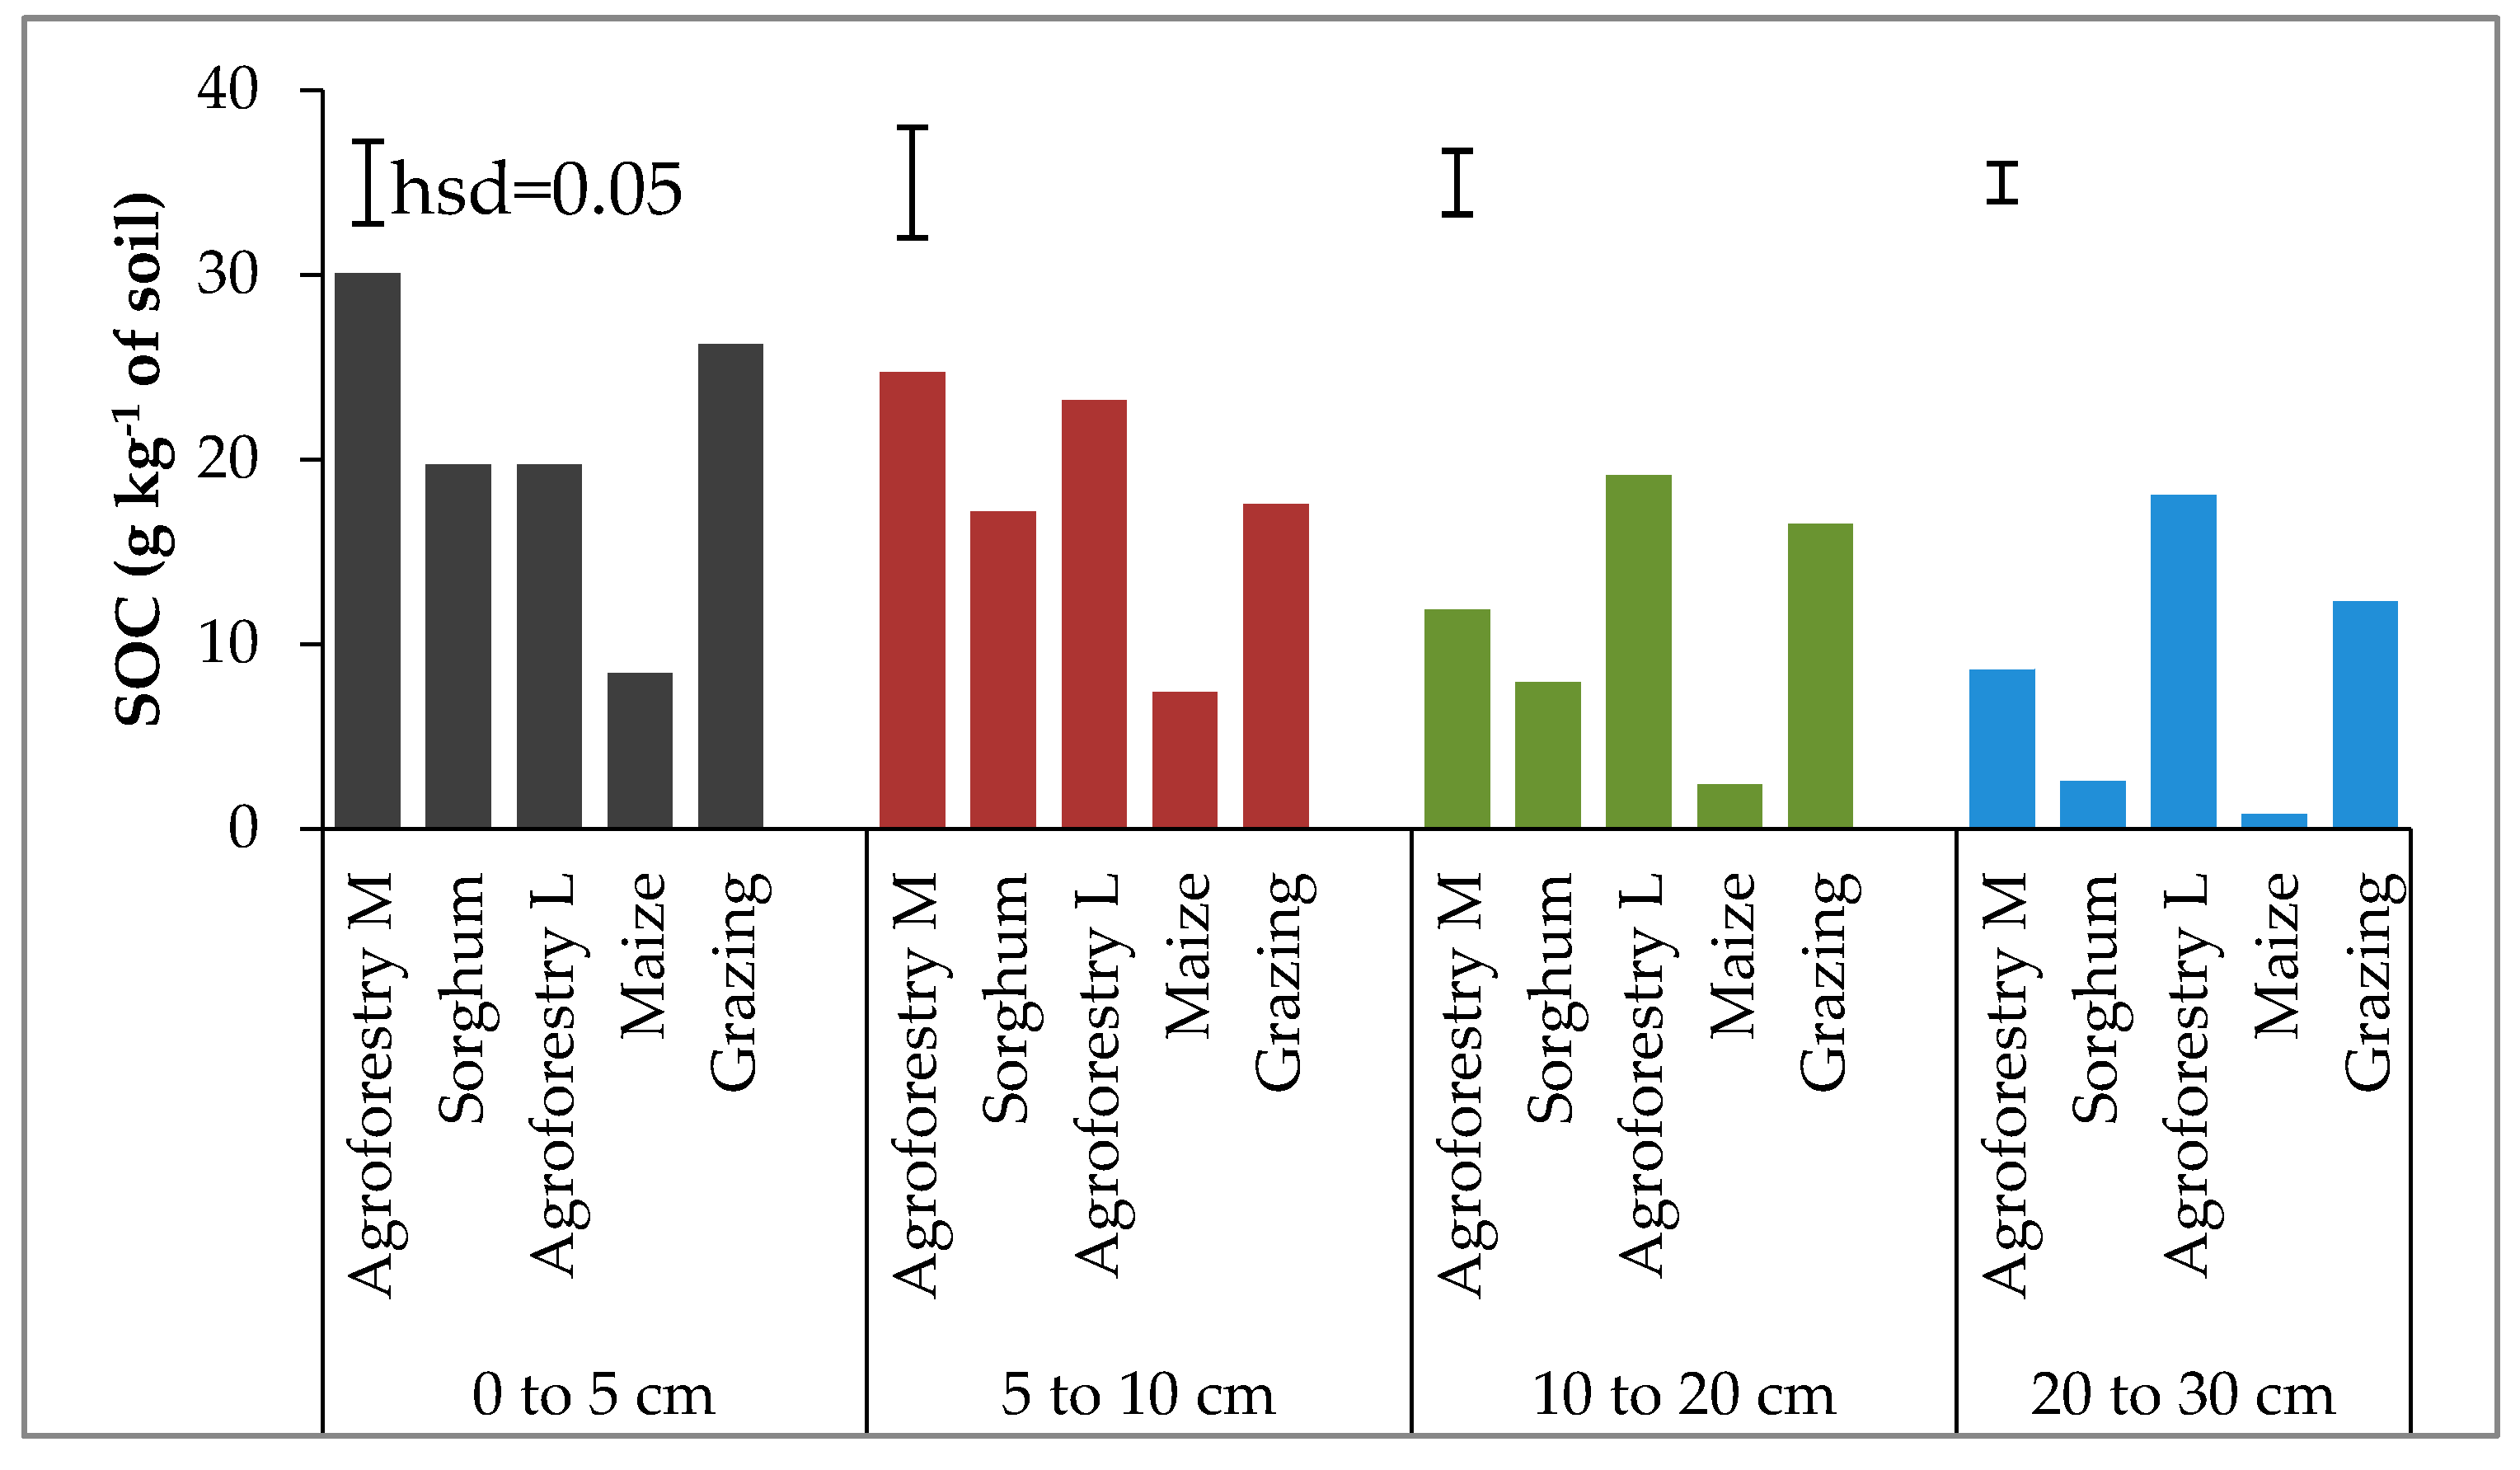
3.3. Soil Organic Carbon Contents in Different Land Utilization Types and Depths

The variability of SOC contents in depths and LUTs ranged from 8.4 to 30.14 g C kg−1. At the 0–5 cm depth, SOC differed significantly (p < 0.0001) among LUTs (Figure 2). The agroforestry M and grazing land had significantly high SOC contents than all LUTs (0–5 cm, Figure 2). A significant (p = 0.0002) difference in SOC contents was observed at the 5–10 cm depth. There was a higher SOC content in the agroforestry L and agroforestry M than in the sole maize and sole sorghum at the 5–10 cm depth (Figure 2). There was also a significant (p < 0.0001) difference in SOC concentration in the 10–20 cm and 20–30 cm depths, with high SOC contents of 19.15 and 18.06 g C kg−1 under agroforestry L, respectively. In the sole maize, the SOC contents were low across all depths compared to all the LUTs. Decreasing SOC concentration with increasing soil depth was observed across the LUTs, except under agroforestry L (Figure 2).
There were decreased SOC contents with increasing depth across the LUTs, except under agroforestry L (Figure 2). These results agree with those of Sommer et al. [8], whose results showed a decrease in SOC with increasing depths in Western Kenya. These results could be attributed to differences in dissolved organic carbon (DOC) percolation attributed to varied soil bulk densities and, consequently, differences in micro-pores in the soil profile [32]. The variability of soil bulk density across LUTs contributed to the difference in SOC concentration. The study had varied soil bulk densities at different depths and, thus, a varied SOC [31]. Generally, the decrease in SOC in depth concurs with the findings by Kadiri et al. [33]. The concentration of SOC in LUTs across depth could be due to high C inputs by roots through degradation [22].
Soil texture is a predictor of SOC storage. Saidy et al. [21] found that clay contents influence SOC stabilization by protecting it against microbial activities. Therefore, the different rates of silt, clay, and clay play a key role in carbon storage, thus influencing SOC across different LUTs. However, there was no data on textural differences across soil depths. Textural characteristics could be contributed to changes in SOC across different depths.
The significant difference in SOC across LUTs was consistent with previous research in SSA [8,33,34]. The sole maize and sole sorghum had a low SOC. These results agree with those of Degu et al. [26], who reported a low SOC concentration under continuous maize plantation compared to maize–pepper rotation. Additionally, the plant residue removal and low nutrient replenishment in the study area [8,35] could have lowered the amount of carbon in soils. Frequent cultivation could have increased soil aggregate disturbance and microbial activities, thus lowering SOC concentration [5]. The SOC concentration under agroforestry L was significantly higher than monocrop LUTs (sole sorghum and sole maize; Figure 2). The results corroborate the findings of several studies conducted in SSA [11,17,35]. Guo et al. [1] found a significantly higher SOC under the metasequoia agroforestry system than in the poplar plantation. The addition of leaf litterfall by the Leucaena leucocephala could have created favorable conditions for biotic activities for SOC accumulation and utilization [13]. The highest amount of SOC under agroforestry L compared to agroforestry M could be ascribed to differences in species. Additionally, the difference could be due to the ability of agroforestry L to fix nitrogen that aids in building SOC [16]. Compared to grazing land, agroforestry has huge potential to store SOC [1,16].

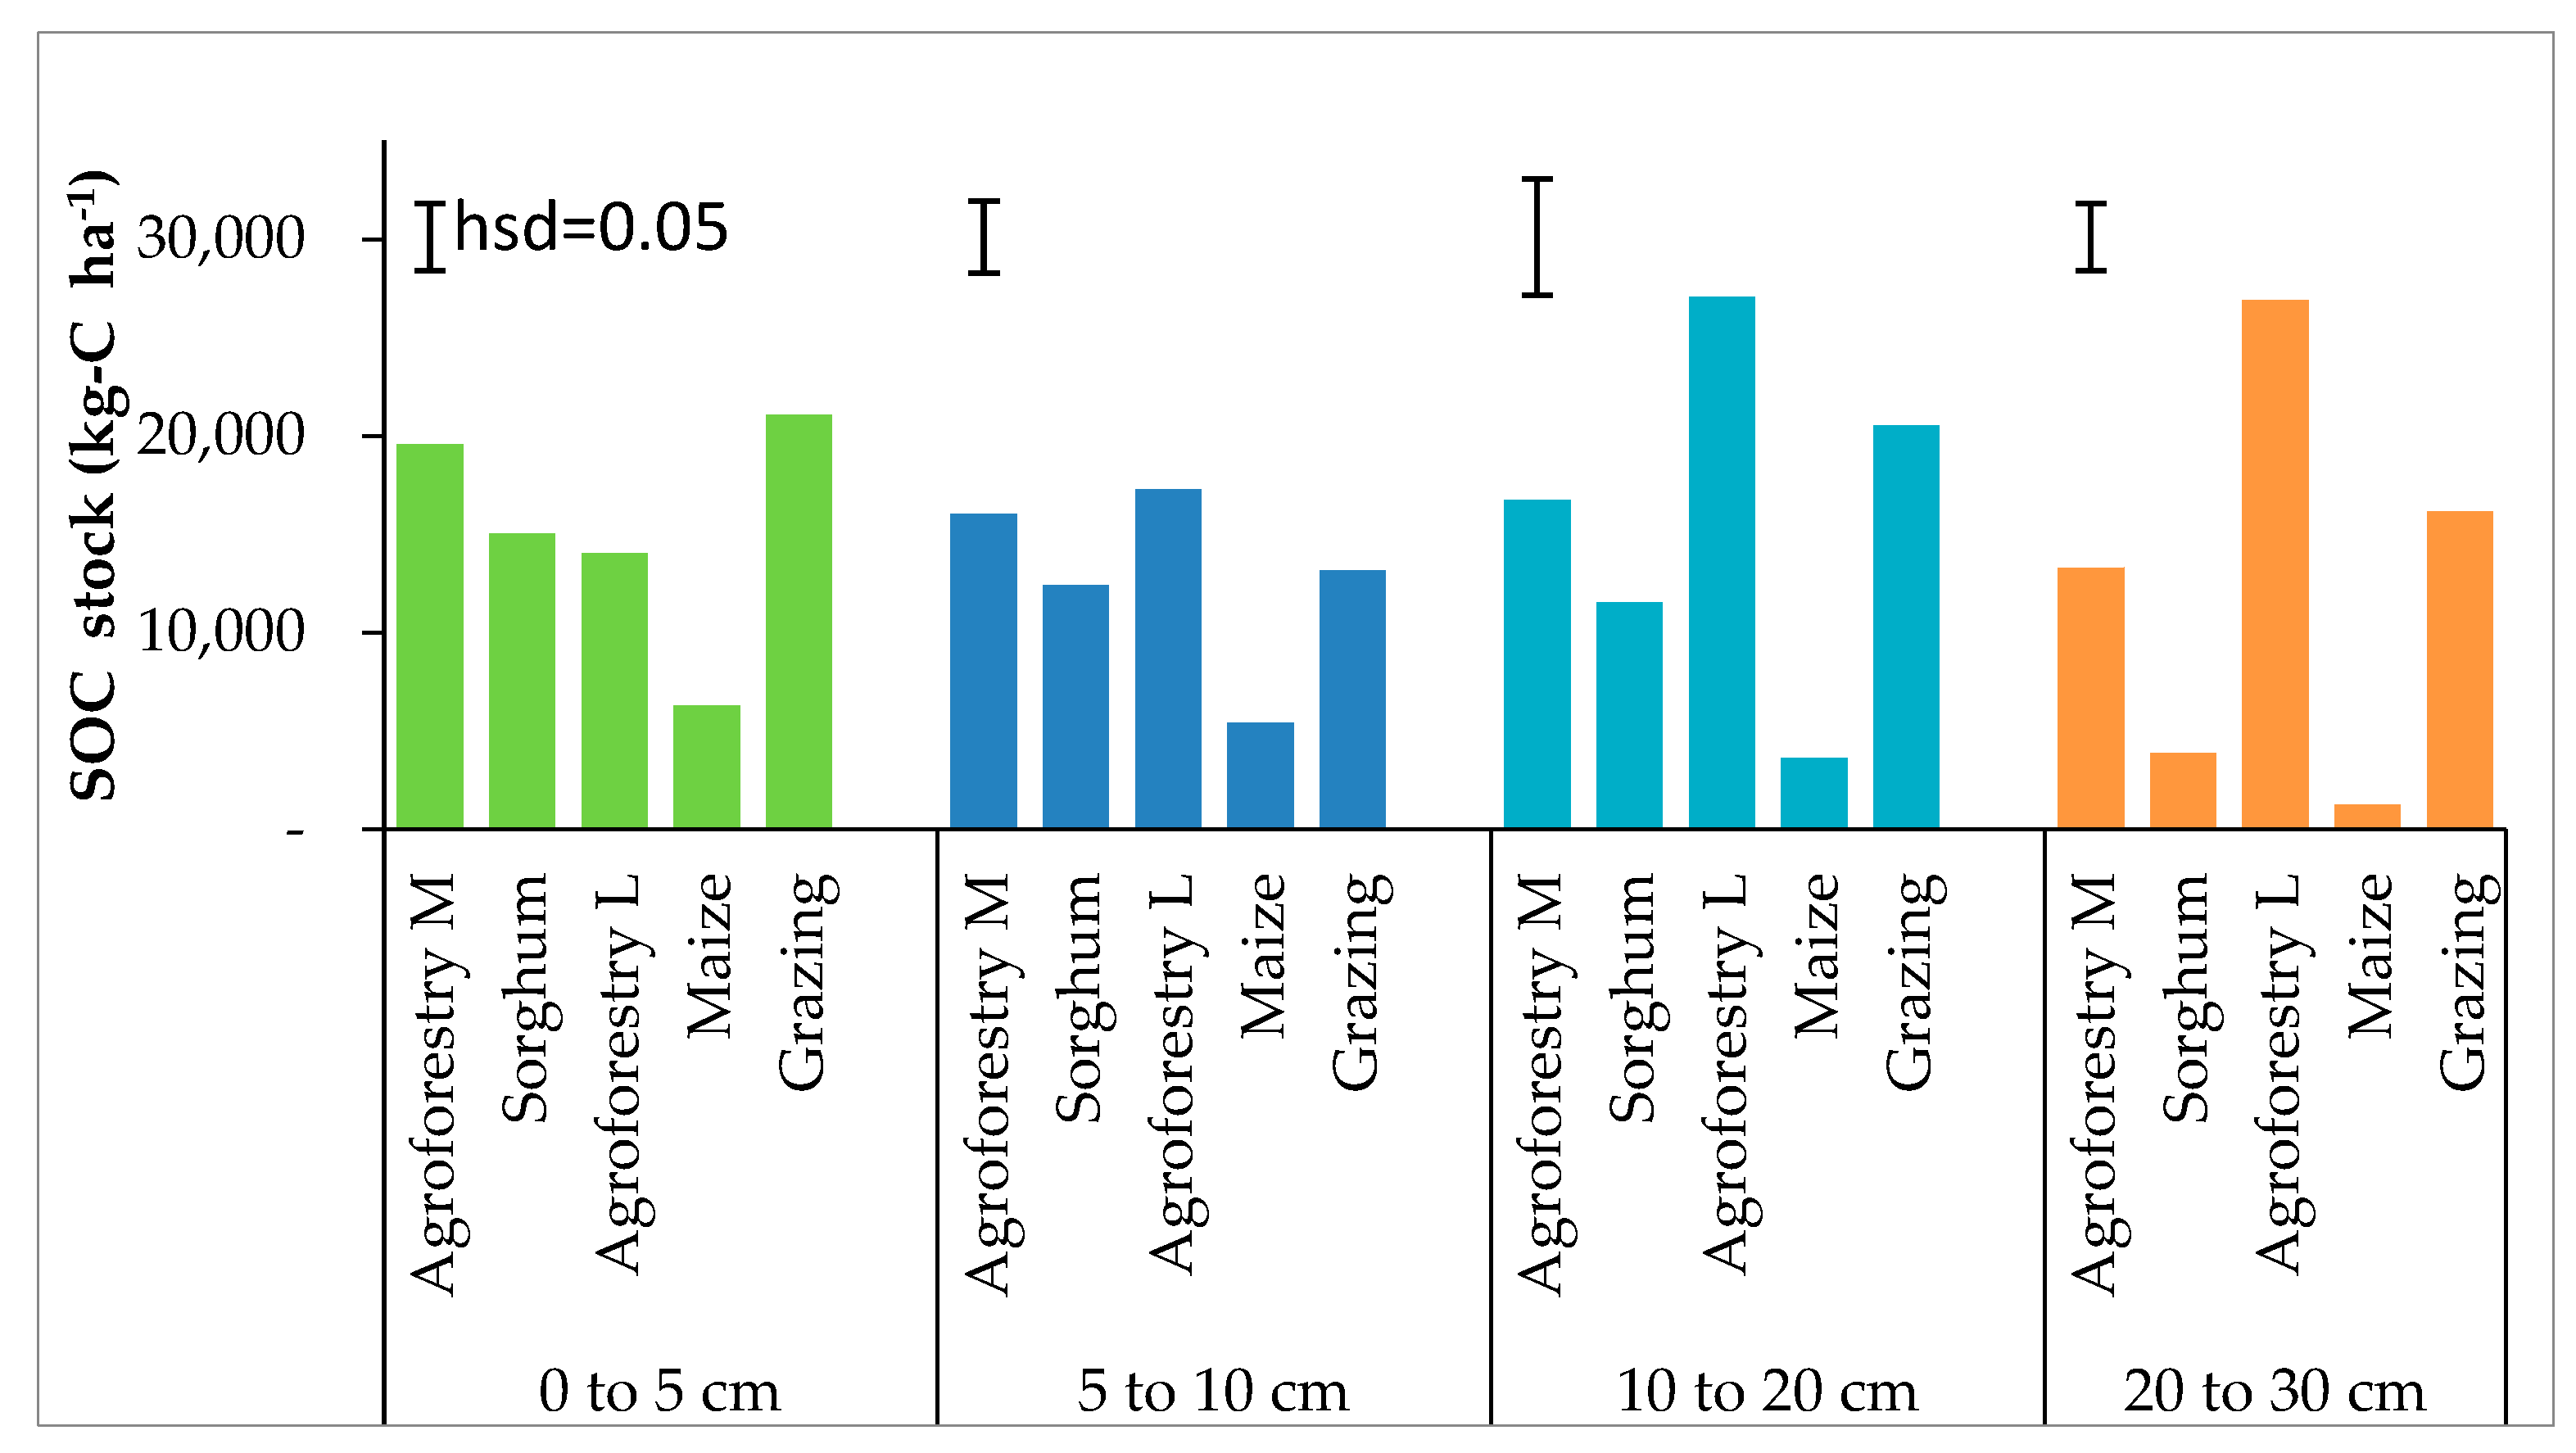
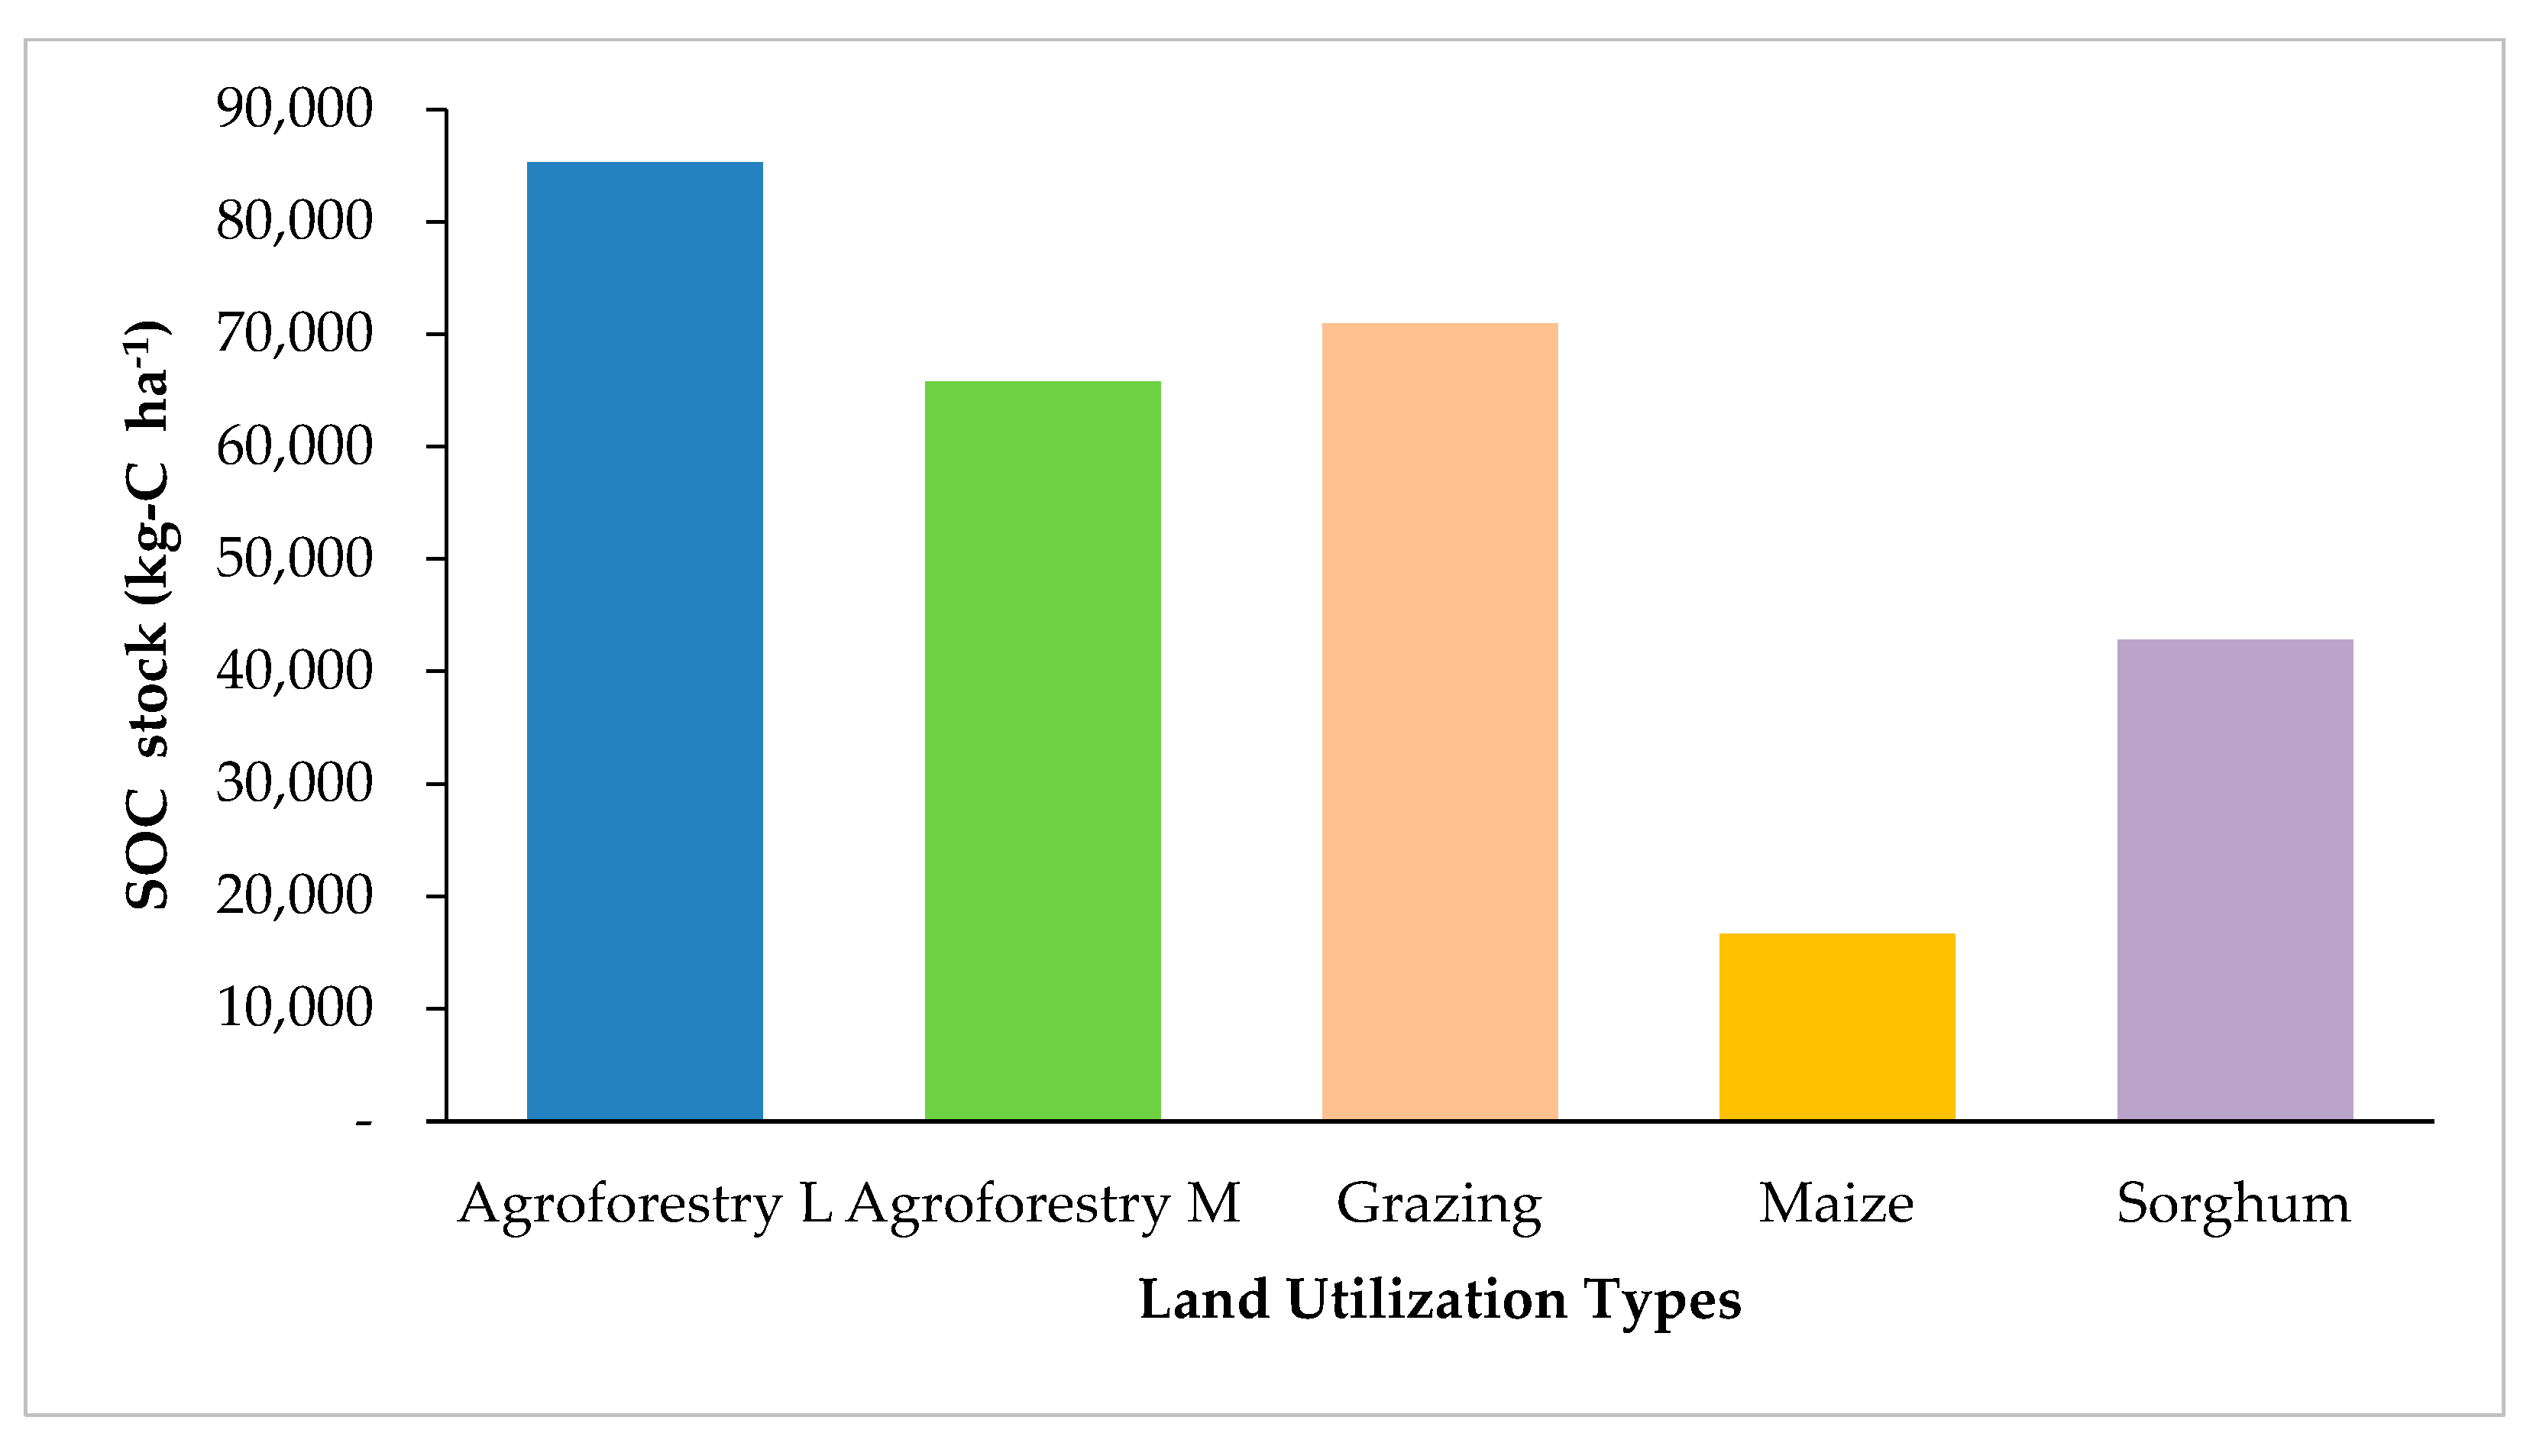
3.4. Soil Organic Carbon Stock in Different Land Utilization Types and Depths

The SOC stock across the different LUTs and depths ranged between 1283.4 and 27,057 kg C ha−1. The SOC stock differed significantly (p < 0.0001) at the 0–5 cm depth. The variation was between 6313.2 and 20,069.7 kg C ha−1 (Figure 3). A significant difference (p < 0.0001) in SOC was also observed at the 5–10 cm depth ranging between 5411 and 17,258 kg C ha−1. At the 10–20 cm depth, the SOC stock varied significantly (p < 0.0001) across the LUTs with a range from 1283 to 26,913 kg C ha−1. Additionally, the SOC stock differed (p < 0.0001) significantly at the 20–30 cm depth. A high amount of SOC stock was observed under agroforestry L (26,913.1 kg Cha−1) and the lowest under sole maize (1283.47 kg C ha−1) at the 20–30 cm depth. Compared to all LUTs, agroforestry L had the highest carbon stock. The lowest SOC stock was detected under sole maize (Figure 4). Carbon stock increased with depths across the LUTs, except in agroforestry L (Figure 3). The SOC stock under agroforestry L increased from 0–5 to 5–10 cm and decreased from 10–20 to 20–30 cm. The variability of the SOC stock differed significantly (p < 0.00001) across LUTs. The estimated SOC stock between the LUTs was from 16,631 to 85,287 kg Cha−1 (Figure 4).
There was a significant difference in the SOC stock under different LUTs. These results agree with previous findings in the study area by Henry et al. [35] and Sommer et al. [8]. The SOC stock decreased with increasing depth in agroforestry M, sole sorghum, grazing land, and sole maize, consistent with the findings of Kadiri et al. [33] and Rahman et al. [22]. The results also agreed with those of Votuporanga city, São Paulo, Brazil [36], where a decreasing SOC stock with increasing depth was reported. Conversely, agroforestry L did not follow the trend due to low stock at the 0–5 cm depth compared to the 5–10, 10–20, and 20–30 cm depths. Silveira et al. corroborated the high carbon under grazing land [14]. This could be attributed to the continuous grass-root turnover favoring carbon accumulation [36]. However, some studies, such as Sheng et al. [12] and Qiu et al. [13], reported contrary results. Qiu et al. (2013) found a carbon stock loss under grazed lands. In addition, Abegaz et al. [2] reported low carbon under grazing land compared to croplands.
Soils in agroforestry L showed a significantly higher SOC stock than all LUTs in this study due to the continuous supply of N by Leucaena leucocephala. These results are consistent with those of other studies conducted in SSA [16,34]. Corbeels et al. [16] also showed a high carbon stock under agroforestry systems. The addition of leaf litter residue from Leucaena leucocephala increased nitrogen in soil compartments, which increased SOC stock by increasing microbial decomposition of labile organic matter [30]. Root exudates and faunal bioturbation could have significantly increased SOC stock accumulation [16]. The difference in SOC accumulation under the two agroforestry (agroforestry L and agroforestry M) LUTs could be attributed to the difference in tree species. While agroforestry L is a leguminous plant, agroforestry M is non-leguminous, hence the difference in nitrogen levels that plays a fundamental role in building up SOC [22].
Soils in croplands are characterized by low nutrients coupled with degradation [11,37] due to low nutrient replenishment [5]. Sole maize and sole sorghum had low nutrient replenishment due to frequent cultivation, leading to soil aggregate disintegration and exposing the available carbon to the atmosphere. Additionally, cultivation could have accelerated weathering and SOC oxidation [27], therefore reducing organic matter inputs to the soil and affecting the SOC stock levels [5,8]. Researchers have reported a low carbon stock under croplands in Western Kenya [8,35]. Additionally, crop biomass removal during harvesting could be a fundamental reason for the low SOC stock under sole maize and sole sorghum. The N fertilization during the vegetative state of plants could have led to a reduction in SOC stock. Bungau et al. [38] reported that N fertilization leads to a reduction in carbon. Continuous chemical fertilization leads to drastic changes in SOC [38]. Low SOC stock could have also occurred due to pest damage coupled with the decomposition of plant fragments, which could have aggravated the loss of carbon through a heterotrophic process at the expense of terrestrial carbon inputs [4].
Soil carbon is influenced by the soil microclimate, which may change in weeks or seasons and on a decadal scale. The change in soil moisture and temperature (climatic factors) also impacts SOC pools [12]. Additionally, change in soil microclimate impacts soil enzymes such as C-degrading [38]. Additionally, texture controls the amount of SOC in soils. The amount of clay and silts determines the factor between gains and losses of SOC stock [18]. The microbial abundance, soil moisture, and temperature control carbon stock storage. Although there were no data on soil microclimate, its effect could have led to a change in the SOC stock across LUTs and depths.

3.5. Percentage Distribution of SOC at Different Depths and Land Utilization Types

The percentage distribution of the SOC stock was high under all LUTs at the 0–5 cm depth, except agroforestry L (Figure 5). The order of carbon distribution at the 0–5 cm depth is agroforestry L < grazing land < agroforestry M < sole sorghum < sole maize. A high SOC stock percentage was observed at the 20–30 cm depth under agroforestry L compared to all the LUTs. Sole maize had the highest carbon stock distribution (37.96%) at the 0–5 cm depth. At the 5–10 cm depth, the percentage distribution ranged between 32.5 and 18.6%. Sole maize had a high percentage at this depth compared to all LUTs. The range of carbon at the 10–20 cm depth varied between 31.7% and 21.8%. Across the LUTs, the carbon distribution decreased with increasing depth under sole maize and sole sorghum. In contrast, the percentage SOC stock distribution in agroforestry L increased with increasing depth (0–20 cm) (Figure 5).
The SOC stock distribution exhibited significant differences across the different LUTs and depths. Compared to all LUTs, agroforestry L had the lowest SOC stock distribution at the 0–5 cm depth and a high SOC stock at the 20–30 cm depth. The variation could be ascribed to the high root density that increases micropores [39], aiding the percolation of SOC in the form of DOC to deeper depths due to high faunal activities. The difference in SOC stock in the two agroforestry LUTs could be ascribed to the difference in rooting systems that aid in SOC accumulation [16]. The high SOC distribution at the upper depths under sole maize, sole sorghum, and grazing land could have occurred due to the relatively huge amounts of organic matter than at the deeper depths [33]. Additionally, increased mineralization by soil biota could have contributed to a huge SOC concentration at the upper layers [40].

3.6. Correlation between Soil Bulk Density and SOC Concentration

Except under grazing land, soil bulk density correlated negatively with SOC across the LUTs (Table 2). The correlation between soil bulk density and SOC content significantly correlated positively (p = 0.0001) with grazing land and negatively (p = 0.0003) with agroforestry M.
The SOC concentration showed a negative correlation with soil bulk density since soil porosity is a measure of soil productivity, a function of SOM; thus, an increase in SOC leads to a reduction in soil bulk density. Similarly, the amount of SOC determines the availability of micropores in soils [29], affecting soil bulk density. Therefore, a huge amount of SOC results in high porosity and low soil bulk density [41]. These results agree with those of Rahman et al. [22], who reported a negative correlation of SOC with the soil bulk density. Blanco-Canqui et al. [42] reported similar results despite the difference in the texture of soils. Compaction in grazing land by animal trampling could have reduced the cycling of labile carbon in soils after enrichment with animal droppings. Additionally, there could have been a low percolation of DOC, hence the low concentration of SOC with increasing bulk density [43]. The results from grazing land are in accord with those of Zhang et al. [44], who reported a negative correction of SOC with soil bulk density.
The study demonstrated that LUTs influence SOC storage. The short time during which the study was conducted could have limited the influence of treatments on soil physicochemical properties. The benefits of agroforestry systems on carbon inputs could be more evident at a certain time scale. Nonetheless, the study fills a data gap in the contribution of smallholder farms’ LUTs to carbon dynamics.

4. Conclusions

In line with the hypothesis, the study showed that soil organic carbon and bulk density varied across land utilization types and depths. Greater SOC stocks were detected under agroforestry L and grazing land. In conclusion, the type of agroforestry systems adversely affects SOC accumulation. The variability of SOC stock across the LUTs highlights a possibility of increasing carbon inputs by practicing sustainable agriculture, such as agroforestry with Leucaena sp. that helps build carbon in soils. The soil bulk density significantly influences the variations in SOC stock. The variability of soil bulk density showed a significant influence on SOC stock storage across the LUTs. The negative correlation between the SOC and soil bulk density depicts a strong impact of soil bulk density on the SOC stock. Therefore, there is a need to monitor soil organic carbon through quantification to inform carbon dynamics. The diversity of land utilization types in Western Kenya causes soil organic carbon stocks variability. The study revealed the possibility of improving soil productivity by practicing agroforestry. Therefore, smallholder farmers are encouraged to practice agroforestry systems. Future studies should consider the influence of other factors, such as soil structure, pH, and N on SOC storage.

Author Contributions

Conceptualization, E.K., C.M.M. and F.K.N.; Data curation, E.K. and C.M.M.; Formal analysis, E.K., M.N.K., O.K.N. and J.M.; Funding acquisition, F.K.N., B.M. and M.O.; Investigation, E.K., M.N.K. and J.M; Methodology, E.K., M.N.K. and J.M.; Project administration, F.K.N. and O.K.N.; Supervision, D.K.K.; Validation, E.K., C.M.M. and A.Z.; Visualization, E.K., M.N.K., O.K.N. and J.M.; Writing—original draft, E.K., C.M.M. and F.K.N.; Writing—review and editing, E.K., C.M.M. and F.K.N. All authors have read and agreed to the published version of the manuscript.

Funding

This research was funded by Kenya Climate-Smart Agriculture Project (KCSAP), Project reference number: FP 04-4/1.

Institutional Review Board Statement

Not applicable.

Informed Consent Statement

No humans were involved.

Data Availability Statement

All the data used are contained in the article.

Acknowledgments

The authors wish to acknowledge the Kenya Climate-Smart Agriculture Project (KCSAP), a multi-disciplinary collaborative project entitled “Validating Sustainable Land Management Technologies for Enhanced Carbon Sequestration and Improved Smallholder Farmer’s Livelihoods”. We also thank the smallholder farmer for allowing us to implement the soil GHG experimentation in his field.

Conflicts of Interest

The authors declare no conflict of interest.

References

  1. Guo, J.; Wang, B.; Wang, G.; Myo, S.T.; Cao, F. Effects of three cropland afforestation practices on the vertical distribution of soil organic carbon pools and nutrients in eastern China. Glob. Ecol. Conserv. 2020, 22, e00913. [Google Scholar] [CrossRef]
  2. Abegaz, A.; Tamene, L.; Abera, W.; Yaekob, T.; Hailu, H.; Nyawira, S.S.; Da Silva, M.; Sommer, R. Soil organic carbon dynamics along chrono-sequence land-use systems in the highlands of Ethiopia. Agric. Ecosyst. Environ. 2020, 300, 106997. [Google Scholar] [CrossRef]
  3. Gonçalves, D.R.; de Moraes Sá, J.C.; Mishra, U.; Cerri, C.E.; Ferreira, L.A.; Furlan, F.J. Soil type and texture impacts on soil organic carbon storage in a sub-tropical agro-ecosystem. Geoderma 2017, 286, 88–97. [Google Scholar] [CrossRef]
  4. Smith, P. Soil carbon sequestration and biochar as negative emission technologies. Glob. Chang. Biol. 2016, 22, 1315–1324. [Google Scholar] [CrossRef]
  5. Kanyenji, G.M.; Oluoch-Kosura, W.; Onyango, C.M.; Karanja Ng’ang’a, S. Prospects and constraints in smallholder farmers’ adoption of multiple soil carbon enhancing practices in Western Kenya. Heliyon 2020, 6, e03226. [Google Scholar] [CrossRef] [PubMed]
  6. Vanlauwe, B.; AbdelGadir, A.H.; Adewopo, J.; Adjei-Nsiah, S.; Ampadu-Boakye, T.; Asare, R.; Baijukya, F.; Baars, E.; Bekunda, M.; Coyne, D.; et al. Looking back and moving forward: 50 years of soil and soil fertility management research in sub-Saharan Africa. Int. J. Agric. Sustain. 2017, 15, 613–631. [Google Scholar] [CrossRef] [PubMed] [Green Version]
  7. Smith, P. Land use change and soil organic carbon dynamics. Nutr. Cycl. Agroecosyst. 2008, 81, 169–178. [Google Scholar] [CrossRef]
  8. Sommer, R.; Paul, B.K.; Mukalama, J.; Kihara, J. Reducing losses but failing to sequester carbon in soils–the case of Conservation Agriculture and Integrated Soil Fertility Management in the humid tropical agroecosystem of Western Kenya. Agric. Ecosyst. Environ. 2018, 254, 82–91. [Google Scholar] [CrossRef]
  9. Kim, D.G.; Kirschbaum, M.U.; Beedy, T.L. Carbon sequestration and net emissions of CH4 and N2O under agroforestry: Synthesizing available data and suggestions for future studies. Agric. Ecosyst. Environ. 2016, 226, 65–78. [Google Scholar] [CrossRef]
  10. Siaya County. County Integrated Development Plan (CIDP); Siaya County: Siaya, Kenya, 2018. [Google Scholar]
  11. Reppin, S.; Kuyah, S.; de Neergaard, A.; Oelofse, M.; Rosenstock, T.S. Contribution of agroforestry to climate change mitigation and livelihoods in Western Kenya. Agrofor. Syst. 2020, 94, 203–220. [Google Scholar] [CrossRef] [Green Version]
  12. Sheng, Z.; Du, J.; Sun, B.; Mao, J.; Zhang, Y.; Zhang, J.; Diao, Z. The Role of Plant Functional Diversity in Regulating Soil Organic Carbon Stocks under Different Grazing Intensities in Temperate Grassland, China. Sustainability 2022, 14, 4376. [Google Scholar] [CrossRef]
  13. Qiu, L.; Wei, X.; Zhang, X.; Cheng, J. Ecosystem carbon and nitrogen accumulation after grazing exclusion in semiarid grassland. PLoS ONE 2013, 8, e55433. [Google Scholar] [CrossRef]
  14. Silveira, M.L.; Xu, S.; Adewopo, J.; Franzluebbers, A.J.; Buonadio, G. Grazing land intensification effects on soil C dynamics in aggregate size fractions of a Spodosol. Geoderma 2014, 230, 185–193. [Google Scholar] [CrossRef]
  15. Kiboi, M.N.; Ngetich, F.K.; Muriuki, A.; Adamtey, N.; Mugendi, D. The response of soil physicochemical properties to tillage and soil fertility resources in Central Highlands of Kenya. Ital. J. Agron. 2020, 15, 71–87. [Google Scholar] [CrossRef]
  16. Corbeels, M.; Cardinael, R.; Naudin, K.; Guibert, H.; Torquebiau, E. The 4 per 1000 goal and soil carbon storage under agroforestry and conservation agriculture systems in sub-Saharan Africa. Soil Tillage Res. 2019, 188, 16–26. [Google Scholar] [CrossRef] [Green Version]
  17. Namirembe, S.; Piikki, K.; Sommer, R.; Söderström, M.; Tessema, B.; Nyawira, S.S. Soil organic carbon in agricultural systems of six countries in East Africa–a literature review of status and carbon sequestration potential. South Afr. J. Plant Soil. 2020, 37, 35–49. [Google Scholar] [CrossRef]
  18. Martín, J.R.; Álvaro-Fuentes, J.; Gonzalo, J.; Gil, C.; Ramos-Miras, J.J.; Corbí, J.G.; Boluda, R. Assessment of the soil organic carbon stock in Spain. Geoderma 2016, 264, 117–125. [Google Scholar] [CrossRef] [Green Version]
  19. Nyawira, S.S.; Hartman, M.D.; Nguyen, T.H.; Margenot, A.J.; Kihara, J.; Paul, B.K.; Williams, S.; Bolo, P.; Sommer, R. Simulating soil organic carbon in maize-based systems under improved agronomic management in Western Kenya. Soil Tillage Res. 2021, 211, 105000. [Google Scholar] [CrossRef]
  20. Ndung’u, M.; Ngatia, L.W.; Onwonga, R.N.; Mucheru-Muna, M.W.; Fu, R.; Moriasi, D.N.; Ngetich, K.F. The influence of organic and inorganic nutrient inputs on soil organic carbon functional groups content and maize yields. Heliyon 2021, 7, e07881. [Google Scholar] [CrossRef]
  21. Saidy, A.R.; Smernik, R.J.; Baldock, J.A.; Kaiser, K.; Sanderman, J. The sorption of organic carbon onto differing clay minerals in the presence and absence of hydrous iron oxide. Geoderma 2013, 209, 15–21. [Google Scholar] [CrossRef]
  22. Rahman, N.; Giller, K.E.; de Neergaard, A.; Magid, J.; van de Ven, G.; Bruun, T.B. The effects of management practices on soil organic carbon stocks of oil palm plantations in Sumatra. J. Environ. Manag. 2021, 278, 111446. [Google Scholar] [CrossRef]
  23. Jaetzold, R.; Schmidt, H.; Hornet, Z.B.; Shisanya, C.A. Farm Management Hand-Book of Kenya. In Natural Conditions and Farm Information, 2nd ed.; Ministry of Agriculture/GTZ: Nairobi, Kenya, 2010; Volume 11. [Google Scholar]
  24. De Groote, H.; Vanlauwe, B.; Rutto, E.; Odhiambo, G.D.; Kanampiu, F.; Khan, Z.R. Economic analysis of different options in integrated pest and soil fertility management in maize systems of Western Kenya. Agric. Econ. 2010, 41, 471–482. [Google Scholar] [CrossRef]
  25. Okalebo, J.R.; Gathua, K.W.; Woomer, P.L. Laboratory methods of soil and plant analysis: A working manual second edition. Sacred Afr. Nairobi 2002, 21, 25–26. [Google Scholar]
  26. Degu, M.; Melese, A.; Tena, W. Effects of soil conservation practice and crop rotation on selected soil physicochemical properties: The Case of Dembecha District, Northwestern Ethiopia. Appl. Environ. Soil Sci. 2019, 14. [Google Scholar] [CrossRef]
  27. Bruun, T.B.; Elberling, B.; de Neergaard, A.; Magid, J. Organic carbon dynamics in different soil types after conversion of forest to agriculture. Land Degrad. Dev. 2015, 26, 272–283. [Google Scholar] [CrossRef]
  28. Samuel, A.D.; Tit, D.M.; Melinte, C.E.; Iovan, C.; Purza, L.A.V.I.N.I.A.; Gitea, M.A.N.U.E.L.; Bungau, S. Enzymological and physicochemical evaluation of the effects of soil management practices. Rev. Chim. 2017, 68, 2243–2247. [Google Scholar] [CrossRef]
  29. Tanveera, A.; Kanth, T.A.; Tali, P.A.; Naikoo, M. Relation of soil bulk density with texture, total organic matter content and porosity in the soils of Kandi Area of Kashmir valley. India. Int. Res. J. Earth Sci. 2016, 4, 1–6. [Google Scholar]
  30. Hengl, T.; Mendes de Jesus, J.; Heuvelink, G.B.; Ruiperez Gonzalez, M.; Kilibarda, M.; Blagotić, A.; Shangguan, W.; Wright, M.N.; Geng, X.; Bauer-Marschallinger, B.; et al. SoilGrids250m: Global gridded soil information based on machine learning. PLoS ONE 2017, 12, e0169748. [Google Scholar]
  31. Gao, Y.; Zhou, J.; Wang, L.; Guo, J.; Feng, J.; Wu, H.; Lin, G. Distribution patterns and controlling factors for the soil organic carbon in four mangrove forests of China. Glob. Ecol. Conserv. 2019, 17, e00575. [Google Scholar] [CrossRef]
  32. Mishra, G.; Sarkar, A. Studying the relationship between total organic carbon and soil carbon pools under different land management systems of Garo hills, Meghalaya. J. Environ. Manag. 2020, 257, 110002. [Google Scholar] [CrossRef]
  33. Kadiri, W.O.; Fasina, A.S.; Babalola, T.S. Soil organic carbon concentration and stock of arable land use of two agroecological zones of Nigeria. J. Saudi Soc. Agric. Sci. 2021, 20, 180–189. [Google Scholar]
  34. Muhati, G.L.; Olago, D.; Olaka, L. Quantification of carbon stocks in Mount Marsabit Forest Reserve, a sub-humid montane forest in northern Kenya under anthropogenic disturbance. Glob. Ecol. Conserv. 2018, 14, e00383. [Google Scholar] [CrossRef]
  35. Henry, M.; Tittonell, P.; Manlay, R.J.; Bernoux, M.; Albrecht, A.; Vanlauwe, B. Biodiversity, carbon stocks and sequestration potential in aboveground biomass in smallholder farming systems of western Kenya. Agric. Ecosyst. Environ. 2009, 129, 238–252. [Google Scholar] [CrossRef]
  36. Sarto, M.V.; Borges, W.L.; Sarto, J.R.; Rice, C.W.; Rosolem, C.A. Deep soil carbon stock, origin, and root interaction in a tropical integrated crop–livestock system. Agrofor. Syst. 2020, 94, 1865–1877. [Google Scholar] [CrossRef]
  37. Kihara, J.; Bolo, P.; Kinyua, M.; Nyawira, S.S.; Sommer, R. Soil health and ecosystem services: Lessons from sub-Sahara Africa (SSA). Geoderma 2020, 370, 114342. [Google Scholar] [CrossRef]
  38. Bungau, S.; Behl, T.; Aleya, L.; Bourgeade, P.; Aloui-Sossé, B.; Purza, A.L.; Abid, A.; Samuel, A.D. Expatiating the impact of anthropogenic aspects and climatic factors on long-term soil monitoring and management. Environ. Sci. Pollut. Res. 2021, 28, 30528–30550. [Google Scholar] [CrossRef]
  39. Sarvade, S.; Singh, R.; Prasad, H.; Prasad, D. Agroforestry practices for improving soil nutrient status. Popular Kheti. 2014, 2, 60–64. [Google Scholar]
  40. Zhang, K.; Maltais-Landry, G.; Liao, H.L. How soil biota regulate C cycling and soil C pools in diversified crop rotations. Soil Biol. Biochem. 2021, 156, 108219. [Google Scholar] [CrossRef]
  41. Alavaisha, E.; Manzoni, S.; Lindborg, R. Different agricultural practices affect soil carbon, nitrogen and phosphorous in Kilombero-Tanzania. J. Environ. Manag. 2019, 234, 159–166. [Google Scholar] [CrossRef]
  42. Blanco-Canqui, H.; Stone, L.R.; Schlegel, A.J.; Lyon, D.J.; Vigil, M.F.; Mikha, M.M.; Stahlman, P.W.; Rice, C.W. No-till induced increase in organic carbon reduces maximum bulk density of soils. Soil Sci. Soc. Am. J. 2009, 73, 1871–1879. [Google Scholar] [CrossRef]
  43. Hobley, E.U.; Baldock, J.; Wilson, B. Environmental and human influences on organic carbon fractions down the soil profile. Agric. Ecosyst. Environ. 2016, 223, 152–166. [Google Scholar] [CrossRef] [Green Version]
  44. Zhang, X.; Liu, M.; Zhao, X.; Li, Y.; Zhao, W.; Li, A.; Huang, J. Topography and grazing effects on storage of soil organic carbon and nitrogen in the northern China grasslands. Ecol. Indic. 2018, 93, 45–53. [Google Scholar] [CrossRef]
Figure 1. Soil bulk density in different land utilization types (Agroforestry M = Agroforestry with Markhamia luteai; sole sorghum; Agroforestry L = Agroforestry with Leucaena leucocephala; sole maize; and grazing land) at different depths in Siaya County, Kenya (p ≤ 0.05).
Sustainability 14 08267 g001
Figure 2. Soil organic carbon (SOC) g C kg−1 in different land utilization types (Agroforestry M = Agroforestry with Markhamia lutea; sole sorghum; Agroforestry L = Agroforestry with Leucaena leucocephala; sole maize; and grazing land) at different depths in Siaya County, Kenya (p ≤ 0.05).
Sustainability 14 08267 g002
Figure 3. Soil organic carbon (SOC) stock in g kg−1 of soil under different land utilization types (Agroforestry M = Agroforestry with Markhamia lutea; sole sorghum; Agroforestry L = Agroforestry with Leucaena leucocephala; sole maize; and grazing land) at different depths in Siaya County, Kenya (p ≤ 0.05).
Sustainability 14 08267 g003
Figure 4. Soil organic carbon stock (SOC) stock in different land utilization types (Agroforestry M = Agroforestry with Markhamia lutea; sole sorghum; Agroforestry L = Agroforestry with Leucaena leucocephala; sole maize; and grazing land) at 0 to 30 cm depth in Siaya County, Kenya (p ≤ 0.05).
Sustainability 14 08267 g004
Figure 5. Percentage distribution of SOC stock in different land utilization types (Agroforestry M = Agroforestry with Markhamia lutea; sole sorghum; Agroforestry L = Agroforestry with Leucaena leucocephala; sole maize; and grazing land) at different depths in Siaya County, Kenya.
Sustainability 14 08267 g005
Table 1. Soil texture (loam) in different land utilization types of the Alego-Usonga sub-county.
LUT 1Sand (%)Clay (%)Silt (%)
Agroforestry M471834
Sole sorghum481537
Agroforestry L461836
Sole Maize521830
Grazing land501832
1 LUT = land utilization types; Agroforestry M = Agroforestry with Markhamia lutea; sole sorghum; Agroforestry L = Agroforestry with Leucaena leucocephala; sole maize; and grazing land.
Table 2. Relationships between soil bulk density and SOC under different land utilization types.
LUTsCoefficientp-Value
Agroforestry M−0.868 **0.0003
Sole sorghum−0.1380.7
Agroforestry L−0.1400.7
Sole Maize−0.2740.4
Grazing land0.900 **0.0001
** represents a significant correlation at p < 0.01. LUTs = Land utilization types (Agroforestry M = Agroforestry with Markhamia lutea; sole sorghum; Agroforestry L = Agroforestry with Leucaena leucocephala; sole maize; and grazing land) in Siaya County, Kenya.
Publisher’s Note: MDPI stays neutral with regard to jurisdictional claims in published maps and institutional affiliations.

