
Exploring the Forms of the Economic Effects of Renewable Energy Consumption: Evidence from China


Abstract
1. Introduction
2. Literature Review
2.1. Analysis of Economic Effects of Renewable Energy Consumption across the World
2.2. Analysis of the Economic Effects of Renewable Energy Consumption in China
3. Variable Description and Model Specification
3.1. Variable Description
3.2. Model Specification
4. Results and Discussion
4.1. Variables’ Statistical Description
4.2. Fundamental Statistical Analysis
4.3. Causality Analysis
4.4. Indirect and Direct Economic Effects of Renewable Energy Consumption
5. Conclusions
Author Contributions
Funding
Institutional Review Board Statement
Informed Consent Statement
Data Availability Statement
Conflicts of Interest
References
- Yu, S.; Zheng, Y.; Li, L. A Comprehensive Evaluation of the Development and Utilization of China’s Regional Renewable Energy. Energy Policy 2019, 127, 73–86. [Google Scholar] [CrossRef]
- Batel, S. A Critical Discussion of Research on the Social Acceptance of Renewable Energy Generation and Associated Infrastructures and an Agenda for the Future. J. Environ. Policy Plan. 2018, 20, 356–369. [Google Scholar] [CrossRef]
- Olabi, A.G.; Abdelkareem, M.A. Renewable Energy and Climate Change. Renew. Sustain. Energy Rev. 2022, 158, 112111. [Google Scholar] [CrossRef]
- Dincer, I.; Rosen, M.A. Energy, Environment and Sustainable Development. Appl. Energy 1999, 64, 427–440. [Google Scholar] [CrossRef]
- Mahmood, N.; Wang, Z.; Hassan, S.T. Renewable Energy, Economic Growth, Human Capital, and CO2 Emission: An Empirical Analysis. Environ. Sci. Pollut. Res. 2019, 26, 20619–20630. [Google Scholar] [CrossRef] [PubMed]
- Ocal, O.; Aslan, A. Renewable Energy Consumption–Economic Growth Nexus in Turkey. Renew. Sustain. Energy Rev. 2013, 28, 494–499. [Google Scholar] [CrossRef]
- Aydin, M. Renewable and Non-Renewable Electricity Consumption–Economic Growth Nexus: Evidence from OECD Countries. Renew. Energy 2019, 136, 599–606. [Google Scholar] [CrossRef]
- Koengkan, M.; Fuinhas, J.A.; Santiago, R. The Relationship between CO2 Emissions, Renewable and Non-Renewable Energy Consumption, Economic Growth, and Urbanisation in the Southern Common Market. J. Environ. Econ. Policy 2020, 9, 383–401. [Google Scholar] [CrossRef]
- Magazzino, C. Renewable Energy Consumption-Economic Growth Nexus in Italy. Int. J. Energy Econ. Policy 2017, 7, 119–127. [Google Scholar]
- Grabara, J.; Tleppayev, A.; Dabylova, M.; Mihardjo, L.W.; Dacko-Pikiewicz, Z. Empirical Research on the Relationship amongst Renewable Energy Consumption, Economic Growth and Foreign Direct Investment in Kazakhstan and Uzbekistan. Energies 2021, 14, 332. [Google Scholar] [CrossRef]
- Khan, M.K.; Khan, M.I.; Rehan, M. The Relationship between Energy Consumption, Economic Growth and Carbon Dioxide Emissions in Pakistan. Financ. Innov. 2020, 6, 1–13. [Google Scholar] [CrossRef]
- Banday, U.J.; Aneja, R. Renewable and Non-Renewable Energy Consumption, Economic Growth and Carbon Emission in BRICS: Evidence from Bootstrap Panel Causality. Int. J. Energy Sect. Manag. 2019, 14, 248–260. [Google Scholar] [CrossRef]
- Ozcan, B.; Ozturk, I. Renewable Energy Consumption-Economic Growth Nexus in Emerging Countries: A Bootstrap Panel Causality Test. Renew. Sustain. Energy Rev. 2019, 104, 30–37. [Google Scholar] [CrossRef]
- Kónya, L. Exports and Growth: Granger Causality Analysis on OECD Countries with a Panel Data Approach. Econ. Model. 2006, 23, 978–992. [Google Scholar] [CrossRef]
- Rasoulinezhad, E.; Saboori, B. Panel Estimation for Renewable and Non-Renewable Energy Consumption, Economic Growth, CO2 Emissions, the Composite Trade Intensity, and Financial Openness of the Commonwealth of Independent States. Environ. Sci. Pollut. Res. 2018, 25, 17354–17370. [Google Scholar] [CrossRef]
- Yildirim, E.; Saraç, Ş.; Aslan, A. Energy Consumption and Economic Growth in the USA: Evidence from Renewable Energy. Renew. Sustain. Energy Rev. 2012, 16, 6770–6774. [Google Scholar] [CrossRef]
- Dogan, E. Analyzing the Linkage between Renewable and Non-Renewable Energy Consumption and Economic Growth by Considering Structural Break in Time-Series Data. Renew. Energy 2016, 99, 1126–1136. [Google Scholar] [CrossRef]
- Bhat, J.A. Renewable and Non-Renewable Energy Consumption—Impact on Economic Growth and CO2 Emissions in Five Emerging Market Economies. Environ. Sci. Pollut. Res. 2018, 25, 35515–35530. [Google Scholar] [CrossRef]
- Zhe, L.; Yüksel, S.; Dinçer, H.; Mukhtarov, S.; Azizov, M. The Positive Influences of Renewable Energy Consumption on Financial Development and Economic Growth. Sage Open 2021, 11, 21582440211040132. [Google Scholar] [CrossRef]
- Hung-Pin, L. Renewable Energy Consumption and Economic Growth in Nine OECD Countries: Bounds Test Approach and Causality Analysis. Sci. World J. 2014, 2014, 919167. [Google Scholar] [CrossRef]
- Xiarchos, I.M.; Nondo, C.; Kahsai, M.S. Renewable Energy and Economic Growth in US States: A Panel Dynamic Approach. J. Energy Dev. 2013, 39, 95–117. [Google Scholar]
- Ito, K. CO2 Emissions, Renewable and Non-Renewable Energy Consumption, and Economic Growth: Evidence from Panel Data for Developing Countries. Int. Econ. 2017, 151, 1–6. [Google Scholar] [CrossRef]
- Rahman, M.M.; Velayutham, E. Renewable and Non-Renewable Energy Consumption-Economic Growth Nexus: New Evidence from South Asia. Renew. Energy 2020, 147, 399–408. [Google Scholar] [CrossRef]
- Pedroni, P. Critical Values for Cointegration Tests in Heterogeneous Panels with Multiple Regressors. Oxf. Bull. Econ. Stat. 1999, 61, 653–670. [Google Scholar] [CrossRef]
- Kao, C. Spurious Regression and Residual-Based Tests for Cointegration in Panel Data. J. Econom. 1999, 90, 1–44. [Google Scholar] [CrossRef]
- Dumitrescu, E.-I.; Hurlin, C. Testing for Granger Non-Causality in Heterogeneous Panels. Econ. Model. 2012, 29, 1450–1460. [Google Scholar] [CrossRef]
- Cetin, M.A. Renewable Energy Consumption-Economic Growth Nexus in E-7 Countries. Energy Sources Part B Econ. Plan. Policy 2016, 11, 1180–1185. [Google Scholar] [CrossRef]
- Le, T.-H.; Chang, Y.; Park, D. Renewable and Nonrenewable Energy Consumption, Economic Growth, and Emissions: International Evidence. Energy J. 2020, 41, 73–92. [Google Scholar] [CrossRef]
- Narayan, S.; Doytch, N. An Investigation of Renewable and Non-Renewable Energy Consumption and Economic Growth Nexus Using Industrial and Residential Energy Consumption. Energy Econ. 2017, 68, 160–176. [Google Scholar] [CrossRef]
- Sahlian, D.N.; Popa, A.F.; Creţu, R.F. Does the Increase in Renewable Energy Influence Gdp Growth? An EU-28 Analysis. Energies 2021, 14, 4762. [Google Scholar] [CrossRef]
- Shahbaz, M.; Loganathan, N.; Zeshan, M.; Zaman, K. Does Renewable Energy Consumption Add in Economic Growth? An Application of Auto-Regressive Distributed Lag Model in Pakistan. Renew. Sustain. Energy Rev. 2015, 44, 576–585. [Google Scholar] [CrossRef]
- Maji, I.K.; Sulaiman, C.; Abdul-Rahim, A.S. Renewable Energy Consumption and Economic Growth Nexus: A Fresh Evidence from West Africa. Energy Rep. 2019, 5, 384–392. [Google Scholar] [CrossRef]
- Qi, S.; Li, Y. Threshold Effects of Renewable Energy Consumption on Economic Growth under Energy Transformation. Chin. J. Popul. Resour. Environ. 2017, 15, 312–321. [Google Scholar] [CrossRef]
- Venkatraja, B. Does Renewable Energy Affect Economic Growth? Evidence from Panel Data Estimation of BRIC Countries. Int. J. Sustain. Dev. World Ecol. 2020, 27, 107–113. [Google Scholar]
- Chen, C.; Pinar, M.; Stengos, T. Renewable Energy Consumption and Economic Growth Nexus: Evidence from a Threshold Model. Energy Policy 2020, 139, 111295. [Google Scholar] [CrossRef]
- Baz, K.; Cheng, J.; Xu, D.; Abbas, K.; Ali, I.; Ali, H.; Fang, C. Asymmetric Impact of Fossil Fuel and Renewable Energy Consumption on Economic Growth: A Nonlinear Technique. Energy 2021, 226, 120357. [Google Scholar] [CrossRef]
- Namahoro, J.P.; Wu, Q.; Xiao, H.; Zhou, N. The Asymmetric Nexus of Renewable Energy Consumption and Economic Growth: New Evidence from Rwanda. Renew. Energy 2021, 174, 336–346. [Google Scholar] [CrossRef]
- Shakouri, B.; Khoshnevis Yazdi, S. Causality between Renewable Energy, Energy Consumption, and Economic Growth. Energy Sources Part B Econ. Plan. Policy 2017, 12, 838–845. [Google Scholar] [CrossRef]
- Apergis, N.; Payne, J.E. Renewable Energy Consumption and Economic Growth: Evidence from a Panel of OECD Countries. Energy Policy 2010, 38, 656–660. [Google Scholar] [CrossRef]
- Apergis, N.; Payne, J.E. On the Causal Dynamics between Renewable and Non-Renewable Energy Consumption and Economic Growth in Developed and Developing Countries. Energy Syst. 2011, 2, 299–312. [Google Scholar] [CrossRef]
- Marinaș, M.-C.; Dinu, M.; Socol, A.-G.; Socol, C. Renewable Energy Consumption and Economic Growth. Causality Relationship in Central and Eastern European Countries. PLoS ONE 2018, 13, e0202951. [Google Scholar] [CrossRef] [PubMed]
- Ben Mbarek, M.; Saidi, K.; Rahman, M.M. Renewable and Non-Renewable Energy Consumption, Environmental Degradation and Economic Growth in Tunisia. Qual. Quant. 2018, 52, 1105–1119. [Google Scholar] [CrossRef]
- Kahia, M.; Aïssa, M.S.B.; Charfeddine, L. Impact of Renewable and Non-Renewable Energy Consumption on Economic Growth: New Evidence from the MENA Net Oil Exporting Countries (NOECs). Energy 2016, 116, 102–115. [Google Scholar] [CrossRef]
- Saad, W.; Taleb, A. The Causal Relationship between Renewable Energy Consumption and Economic Growth: Evidence from Europe. Clean Technol. Environ. Policy 2018, 20, 127–136. [Google Scholar] [CrossRef]
- Azam, A.; Rafiq, M.; Shafique, M.; Yuan, J. An Empirical Analysis of the Non-Linear Effects of Natural Gas, Nuclear Energy, Renewable Energy and ICT-Trade in Leading CO2 Emitter Countries: Policy towards CO2 Mitigation and Economic Sustainability. J. Environ. Manag. 2021, 286, 112232. [Google Scholar] [CrossRef] [PubMed]
- Cho, S.; Heo, E.; Kim, J. Causal Relationship between Renewable Energy Consumption and Economic Growth: Comparison between Developed and Less-Developed Countries. Geosyst. Eng. 2015, 18, 284–291. [Google Scholar] [CrossRef]
- Xie, F.; Liu, Y.; Guan, F.; Wang, N. How to Coordinate the Relationship between Renewable Energy Consumption and Green Economic Development: From the Perspective of Technological Advancement. Environ. Sci. Eur. 2020, 32, 1–15. [Google Scholar] [CrossRef]
- Lin, B.; Moubarak, M. Renewable Energy Consumption–Economic Growth Nexus for China. Renew. Sustain. Energy Rev. 2014, 40, 111–117. [Google Scholar] [CrossRef]
- Long, X.; Naminse, E.Y.; Du, J.; Zhuang, J. Nonrenewable Energy, Renewable Energy, Carbon Dioxide Emissions and Economic Growth in China from 1952 to 2012. Renew. Sustain. Energy Rev. 2015, 52, 680–688. [Google Scholar] [CrossRef]
- Bloch, H.; Rafiq, S.; Salim, R. Economic Growth with Coal, Oil and Renewable Energy Consumption in China: Prospects for Fuel Substitution. Econ. Model. 2015, 44, 104–115. [Google Scholar] [CrossRef]
- Dong, K.; Sun, R.; Jiang, H.; Zeng, X. CO2 Emissions, Economic Growth, and the Environmental Kuznets Curve in China: What Roles Can Nuclear Energy and Renewable Energy Play? J. Clean. Prod. 2018, 196, 51–63. [Google Scholar] [CrossRef]
- Zhang, C.; Zhou, K.; Yang, S.; Shao, Z. On Electricity Consumption and Economic Growth in China. Renew. Sustain. Energy Rev. 2017, 76, 353–368. [Google Scholar] [CrossRef]
- Zhang, Y.-J.; Da, Y.-B. The Decomposition of Energy-Related Carbon Emission and Its Decoupling with Economic Growth in China. Renew. Sustain. Energy Rev. 2015, 41, 1255–1266. [Google Scholar] [CrossRef]
- Fei, L.; Dong, S.; Xue, L.; Liang, Q.; Yang, W. Energy Consumption-Economic Growth Relationship and Carbon Dioxide Emissions in China. Energy Policy 2011, 39, 568–574. [Google Scholar] [CrossRef]
- Chen, Y.; Zhao, J.; Lai, Z.; Wang, Z.; Xia, H. Exploring the Effects of Economic Growth, and Renewable and Non-Renewable Energy Consumption on China’s CO2 Emissions: Evidence from a Regional Panel Analysis. Renew. Energy 2019, 140, 341–353. [Google Scholar] [CrossRef]
- Fan, W.; Hao, Y. An Empirical Research on the Relationship amongst Renewable Energy Consumption, Economic Growth and Foreign Direct Investment in China. Renew. Energy 2020, 146, 598–609. [Google Scholar] [CrossRef]
- Arain, H.; Sharif, A.; Akbar, B.; Younis, M. Dynamic Connection between Inward Foreign Direct Investment, Renewable Energy, Economic Growth and Carbon Emission in China: Evidence from Partial and Multiple Wavelet Coherence. Environ. Sci. Pollut. Res. 2020, 27, 40456–40474. [Google Scholar] [CrossRef]
- Wang, J.; Zhang, S.; Zhang, Q. The Relationship of Renewable Energy Consumption to Financial Development and Economic Growth in China. Renew. Energy 2021, 170, 897–904. [Google Scholar] [CrossRef]
- Wang, B.; Wang, Z. Imported Technology and CO2 Emission in China: Collecting Evidence through Bound Testing and VECM Approach. Renew. Sustain. Energy Rev. 2018, 82, 4204–4214. [Google Scholar]
- Pao, H.-T.; Fu, H.-C. Renewable Energy, Non-Renewable Energy and Economic Growth in Brazil. Renew. Sustain. Energy Rev. 2013, 25, 381–392. [Google Scholar] [CrossRef]
- Li, T.; Shi, Z.; Han, D. Does Renewable Energy Consumption Contribute to the Development of Low-Carbon Economy? Evidence from China. Environ. Sci. Pollut. Res. 2021, 28, 54891–54908. [Google Scholar] [CrossRef] [PubMed]
- Zhang, N.; Lior, N.; Jin, H. The Energy Situation and Its Sustainable Development Strategy in China. Energy 2011, 36, 3639–3649. [Google Scholar] [CrossRef]
- Zhang, X.-P.; Cheng, X.-M. Energy Consumption, Carbon Emissions, and Economic Growth in China. Ecol. Econ. 2009, 68, 2706–2712. [Google Scholar] [CrossRef]
- Salim, R.A.; Hassan, K.; Shafiei, S. Renewable and Non-Renewable Energy Consumption and Economic Activities: Further Evidence from OECD Countries. Energy Econ. 2014, 44, 350–360. [Google Scholar] [CrossRef]
- Dogan, E. The Relationship between Economic Growth and Electricity Consumption from Renewable and Non-Renewable Sources: A Study of Turkey. Renew. Sustain. Energy Rev. 2015, 52, 534–546. [Google Scholar] [CrossRef]
- Gyimah, J.; Yao, X.; Tachega, M.A.; Isaac, S.H.; Opoku-Mensah, E. Renewable Energy Consumption and Economic Growth: New Evidence from Ghana. Energy 2022, 248, 123559. [Google Scholar] [CrossRef]
- Khan, I.; Hou, F.; Le, H.P. The Impact of Natural Resources, Energy Consumption, and Population Growth on Environmental Quality: Fresh Evidence from the United States of America. Sci. Total Environ. 2021, 754, 142222. [Google Scholar] [CrossRef]
- Khan, H.; Weili, L.; Khan, I. Environmental Innovation, Trade Openness and Quality Institutions: An Integrated Investigation about Environmental Sustainability. Environ. Dev. Sustain. 2022, 24, 3832–3862. [Google Scholar] [CrossRef]
- Sebri, M. Use Renewables to Be Cleaner: Meta-Analysis of the Renewable Energy Consumption–Economic Growth Nexus. Renew. Sustain. Energy Rev. 2015, 42, 657–665. [Google Scholar] [CrossRef]
- Blinder, A.S.; Deaton, A.; Hall, R.E.; Hubbard, R.G. The Time Series Consumption Function Revisited. Brook. Pap. Econ. Act. 1985, 1985, 465–521. [Google Scholar] [CrossRef]
- Banerjee, A.; Dolado, J.; Mestre, R. Error-Correction Mechanism Tests for Cointegration in a Single-Equation Framework. J. Time Ser. Anal. 1998, 19, 267–283. [Google Scholar] [CrossRef]
- Hylleberg, S.; Mizon, G.E. Cointegration and Error Correction Mechanisms. Econ. J. 1989, 99, 113–125. [Google Scholar] [CrossRef]
- Hjalmarsson, E.; Österholm, P. Testing for Cointegration Using the Johansen Methodology When Variables Are Near-Integrated. Available SSRN 1007890. 2007. Available online: https://papers.ssrn.com/sol3/papers.cfm?abstract_id=1007890 (accessed on 22 April 2022).
- Lu, W.-C. Greenhouse Gas Emissions, Energy Consumption and Economic Growth: A Panel Cointegration Analysis for 16 Asian Countries. Int. J. Environ. Res. Public. Health 2017, 14, 1436. [Google Scholar] [CrossRef] [PubMed]
- Scholten, D.; Bazilian, M.; Overland, I.; Westphal, K. The Geopolitics of Renewables: New Board, New Game. Energy Policy 2020, 138, 111059. [Google Scholar] [CrossRef]
- Johansen, S.; Juselius, K. Maximum Likelihood Estimation and Inference on Cointegration—With Appucations to the Demand for Money. Oxf. Bull. Econ. Stat. 1990, 52, 169–210. [Google Scholar] [CrossRef]
- Engle, R.F.; Granger, C.W. Co-Integration and Error Correction: Representation, Estimation, and Testing. Econom. J. Econom. Soc. 1987, 55, 251–276. [Google Scholar] [CrossRef]
- Asiedu, B.A.; Hassan, A.A.; Bein, M.A. Renewable Energy, Non-Renewable Energy, and Economic Growth: Evidence from 26 European Countries. Environ. Sci. Pollut. Res. 2021, 28, 11119–11128. [Google Scholar] [CrossRef]
- Lee, J.W. Long-Run Dynamics of Renewable Energy Consumption on Carbon Emissions and Economic Growth in the European Union. Int. J. Sustain. Dev. World Ecol. 2019, 26, 69–78. [Google Scholar] [CrossRef]
- Alam, M.M.; Murad, M.W. The Impacts of Economic Growth, Trade Openness and Technological Progress on Renewable Energy Use in Organization for Economic Co-Operation and Development Countries. Renew. Energy 2020, 145, 382–390. [Google Scholar] [CrossRef]
- Sebri, M.; Ben-Salha, O. On the Causal Dynamics between Economic Growth, Renewable Energy Consumption, CO2 Emissions and Trade Openness: Fresh Evidence from BRICS Countries. Renew. Sustain. Energy Rev. 2014, 39, 14–23. [Google Scholar] [CrossRef]
- Topcu, E.; Altinoz, B.; Aslan, A. Global Evidence from the Link between Economic Growth, Natural Resources, Energy Consumption, and Gross Capital Formation. Resour. Policy 2020, 66, 101622. [Google Scholar] [CrossRef]
- Hicks, J.; Basu, P.K.; Sappey, R.B. Ageing, Labour Force Participation and Education: Comparing the Implications for Economic Growth in China and India. Econ. Pap. J. Appl. Econ. Policy 2010, 29, 333–341. [Google Scholar] [CrossRef]
- Zafar, M.W.; Shahbaz, M.; Hou, F.; Sinha, A. From Nonrenewable to Renewable Energy and Its Impact on Economic Growth: The Role of Research & Development Expenditures in Asia-Pacific Economic Cooperation Countries. J. Clean. Prod. 2019, 212, 1166–1178. [Google Scholar]
- Chen, S.; Zhang, H.; Wang, S. Trade Openness, Economic Growth, and Energy Intensity in China. Technol. Forecast. Soc. Change 2022, 179, 121608. [Google Scholar] [CrossRef]
- Pilinkiene, V. Trade Openness, Economic Growth and Competitiveness. The Case of the Central and Eastern European Countries. Inž. Ekon. 2016, 27, 185–194. [Google Scholar] [CrossRef]
- Ostic, D.; Twum, A.K.; Agyemang, A.O.; Boahen, H.A. Assessing the Impact of Oil and Gas Trading, Foreign Direct Investment Inflows, and Economic Growth on Carbon Emission for OPEC Member Countries. Environ. Sci. Pollut. Res. 2022, 29, 43089–43101. [Google Scholar] [CrossRef]
- Williams, L.; Sovacool, B.K.; Foxon, T.J. The Energy Use Implications of 5G: Reviewing Whole Network Operational Energy, Embodied Energy, and Indirect Effects. Renew. Sustain. Energy Rev. 2022, 157, 112033. [Google Scholar] [CrossRef]
- Wang, E.-Z.; Lee, C.-C. The Impact of Clean Energy Consumption on Economic Growth in China: Is Environmental Regulation a Curse or a Blessing? Int. Rev. Econ. Finance 2022, 77, 39–58. [Google Scholar] [CrossRef]
- Ntamwiza, J.M.V.; Masengesho, F. Impact of Gross Capital Formation and Foreign Direct Investment on Economic Growth in Rwanda (1990–2017). Curr. Urban Stud. 2022, 10, 1–13. [Google Scholar] [CrossRef]
- Islam, M.S.; Alsaif, S.S.; Alsaif, T. Trade Openness, Government Consumption, and Economic Growth Nexus in Saudi Arabia: ARDL Cointegration Approach. SAGE Open 2022, 12, 21582440221096660. [Google Scholar] [CrossRef]
- Usman, M.; Kousar, R.; Makhdum, M.S.A.; Yaseen, M.R.; Nadeem, A.M. Do Financial Development, Economic Growth, Energy Consumption, and Trade Openness Contribute to Increase Carbon Emission in Pakistan? An Insight Based on ARDL Bound Testing Approach. Environ. Dev. Sustain. 2022, 1–30. [Google Scholar] [CrossRef]
- Boeing, P.; Eberle, J.; Howell, A. The Impact of China’s R&D Subsidies on R&D Investment, Technological Upgrading and Economic Growth. Technol. Forecast. Soc. Change 2022, 174, 121212. [Google Scholar]
- Iqbal, A.; Tang, X.; Rasool, S.F. Investigating the Nexus between CO2 Emissions, Renewable Energy Consumption, FDI, Exports and Economic Growth: Evidence from BRICS Countries. Environ. Dev. Sustain. 2022, 1–30. [Google Scholar] [CrossRef]
- Zafar, M.W.; Saleem, M.M.; Destek, M.A.; Caglar, A.E. The Dynamic Linkage between Remittances, Export Diversification, Education, Renewable Energy Consumption, Economic Growth, and CO2 Emissions in Top Remittance-Receiving Countries. Sustain. Dev. 2021, 30, 165–175. [Google Scholar] [CrossRef]
- Zaidi, S.A.H.; Hussain, M.; Zaman, Q.U. Dynamic Linkages between Financial Inclusion and Carbon Emissions: Evidence from Selected OECD Countries. Resour. Environ. Sustain. 2021, 4, 100022. [Google Scholar] [CrossRef]
- Mungai, E.M.; Ndiritu, S.W.; Da Silva, I. Unlocking Climate Finance Potential and Policy Barriers—A Case of Renewable Energy and Energy Efficiency in Sub-Saharan Africa. Resour. Environ. Sustain. 2022, 7, 100043. [Google Scholar] [CrossRef]
- Banerjee, S. Theoretical Design for Ascertaining Sustainability of Energy Systems with Special Reference to the Competing Renewable Energy Schemes. Resour. Environ. Sustain. 2022, 7, 100048. [Google Scholar] [CrossRef]


| Variable | Form | Definition | Source |
|---|---|---|---|
| Renewable energy consumption | ren | Renewable energy consumption is the share of renewable energy in total final energy consumption in log. | World Bank |
| Economic growth | eco | Annual percentage growth rate of gross domestic product based on constant 2015 in log. | World Bank |
| Gross capital formation | gro | Gross capital formation is the share of gross domestic product in log. | World Bank |
| Labor force | lab | Labor force participation rate, total (% of total population ages 15–64) in log. | World Bank |
| Trade openness | tra | Trade is the sum of exports and imports of goods and services measured as a share of gross domestic product in log. | World Bank |
| Research and development expenditure | tec | Research and development expenditure (% of gross domestic product) in log. | World Bank |
| Foreign direct investment | for | Net inflows (% of gross domestic product) in log. | World Bank |
| var/sta | ren | eco | gro | lab | tra | tec | for |
|---|---|---|---|---|---|---|---|
| mean | 1.285 | 0.936 | 1.606 | 1.902 | 1.612 | 0.153 | 0.473 |
| max | 1.5323 | 1.153 | 1.669 | 1.926 | 1.809 | 0.707 | 0.791 |
| min | 1.055 | 0.371 | 1.526 | 1.880 | 1.385 | −1.000 | 0.029 |
| std | 0.187 | 0.159 | 0.045 | 0.018 | 0.109 | 0.312 | 0.216 |
| ren | eco | gro | lab | tra | tec | for | |
|---|---|---|---|---|---|---|---|
| Pane A: Unit Root Test | |||||||
| ADF-test (level) | −1.545 (0.113) | −0.501 (0.491) | 0.338 (0.776) | 0.476 (0.812) | 0.532 (0.825) | −1.578 (0.106) | −0.642 (0.431) |
| PP-test (level) | −2.192 (0.029) | −0.522 (0.482) | 0.769 (0.874) | 0.816 (0.953) | 0.373 (0.786) | −1.744 (0.101) | −0.683 (0.413) |
| ∆ren | ∆eco | ∆gro | ∆lab | ∆tra | ∆tec | ∆for | |
| ADF-test (first difference) | −2.347 (0.021) | −3.232 (0.002) | −3.609 (0.001) | −4.586 (0.000) | −3.686 (0.001) | −7626 (0.000) | −4.387 (0.000) |
| PP-test (first difference) | −2.235 (0.027) | −3.232 (0.002) | −3.549 (0.001) | −4.640 (0.000) | −3.667 (0.001) | −10.303 (0.000) | −4.299 (0.000) |
| Panel B: Cointegration test | |||||||
| Trace statistics | Critical value 5% | Max-eigen value | Critical value 5% | ||||
| r = 0 | 179.444 | 125.615 | 58.542 | 46.231 | |||
| r ≤ 1 | 120.901 | 95.753 | 45.004 | 40.077 | |||
| r ≤ 2 | 75.897 | 69.819 | 25.965 | 33.877 | |||
| r ≤ 3 | 49.932 | 47.856 | 20.421 | 27.584 | |||
| r ≤ 4 | 29.510 | 29.797 | 16.487 | 21.132 | |||
| r ≤ 5 | 13.023 | 15.495 | 11.585 | 14.264 | |||
| r ≤ 6 | 1.438 | 3.842 | 1.438 | 3.841 | |||
| Panel C: Correlation test | |||||||
| ren | eco | gro | lab | tra | tec | for | |
| ren | 1.000 | ||||||
| eco | 0.278 | 1.000 | |||||
| gro | 0.847 | 0.024 | 1.000 | ||||
| lab | 0.985 | 0.284 | −0.796 | 1.000 | |||
| tra | 0.531 | 0.392 | 0.474 | −0.554 | 1.000 | ||
| tec | 0.417 | 0.233 | 0.633 | −0.377 | 0.244 | 1.000 | |
| for | 0.303 | 0.706 | −0.095 | 0.339 | 0.435 | 0.141 | 1.000 |
| Null Hypothesis | F-Value | p-Value | Null Hypothesis | F-Value | p-Value |
|---|---|---|---|---|---|
| eco ≠ ren | 7.239 | 0.012 ** | gro ≠ eco | 2.864 | 0.088 * |
| ren ≠ eco | 7.069 | 0.018 ** | eco ≠ gro | 0.695 | 0.508 |
| gro ≠ ren | 1.742 | 0.196 | lab ≠ eco | 4.380 | 0.027 ** |
| ren ≠ gro | 4.143 | 0.028 * | eco ≠ lab | 0.108 | 0.897 |
| lab ≠ ren | 9.926 | 0.001 *** | tra ≠ eco | 2.851 | 0.077 * |
| ren ≠ lab | 6.979 | 0.004 *** | eco ≠ tra | 0.126 | 0.881 |
| tra ≠ ren | 3.624 | 0.042 | tec ≠ eco | 4.474 | 0.024 ** |
| ren ≠ tra | 1.675 | 0.208 | eco ≠ tec | 0.674 | 0.518 |
| tec ≠ ren | 0.660 | 0.525 | for ≠ eco | 9.507 | 0.001 *** |
| ren ≠ tec | 1.285 | 0.294 | eco ≠ for | 1.717 | 0.201 |
| for ≠ ren | 0.048 | 0.952 | lab ≠ gro | 3.989 | 0.032 ** |
| ren ≠ for | 7.031 | 0.004 *** | gro ≠ lab | 0.045 | 0.955 |
| tra ≠ gro | 0.394 | 0.678 | tec ≠ gro | 2.718 | 0.086 * |
| gro ≠ tra | 4.112 | 0.029 ** | gro ≠ tec | 3.154 | 0.061 * |
| for ≠ gro | 3.412 | 0.049 ** | tra ≠ lab | 0.703 | 0.505 |
| gro ≠ for | 4.585 | 0.021 ** | lab ≠ tra | 9.519 | 0.001 *** |
| tec ≠ lab | 0.355 | 0.704 | for ≠ lab | 0.691 | 0.510 |
| lab ≠ tec | 1.624 | 0.218 | lab ≠ for | 7.232 | 0.004 *** |
| tec ≠ tra | 1.525 | 0.237 | for ≠ tra | 0.140 | 0.870 |
| tra ≠ tec | 0.133 | 0.875 | tra ≠ for | 0.961 | 0.396 |
| for ≠ tec | 3.866 | 0.035 ** | tec ≠ for | 2.273 | 0.124 |
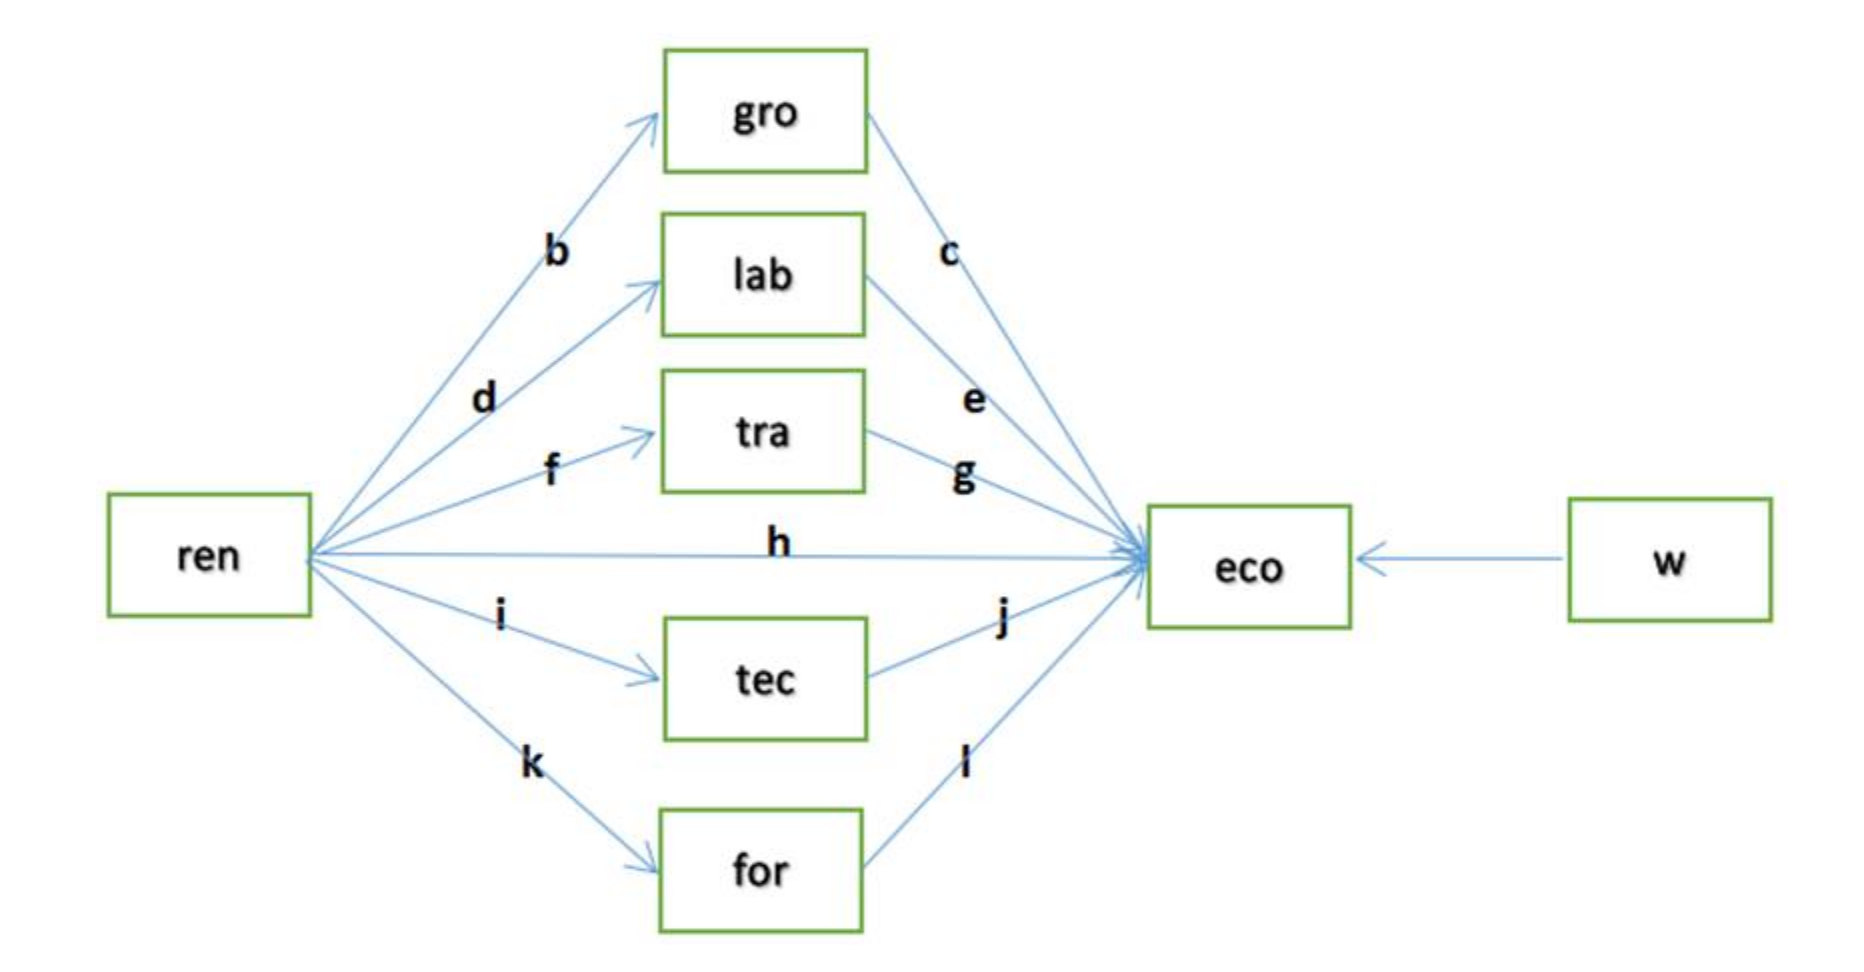
| Direct Effect | Indirect Effect | ||
|---|---|---|---|
| ren → gro | 0.205 *** (8.581) | ren → gro → eco | 0.018 |
| ren → lab | 0.094 *** (9.413) | ren → lab → eco | 0.024 |
| ren → tra | 0.309 *** (3.372) | ren → tra → eco | 0.177 |
| ren → tec | 0.694 ** (2.471) | ren → tec → eco | 0.083 |
| ren → for | 0.349 * (1.713) | ren → for → eco | 0.182 |
| ren → eco | 0.237 *** (3.197) | ||
| gro → eco | 0.087 *** (3.296) | ||
| lab → eco | 0.252 *** (5.934) | ||
| tra → eco | 0.573 ** (2.297) | ||
| tec → eco | 0.119 *** (2.891) | ||
| for → eco | 0.522 *** (5.375) | ||
Publisher’s Note: MDPI stays neutral with regard to jurisdictional claims in published maps and institutional affiliations. |
© 2022 by the authors. Licensee MDPI, Basel, Switzerland. This article is an open access article distributed under the terms and conditions of the Creative Commons Attribution (CC BY) license (https://creativecommons.org/licenses/by/4.0/).
Share and Cite
He, Y.; Huang, P. Exploring the Forms of the Economic Effects of Renewable Energy Consumption: Evidence from China. Sustainability 2022, 14, 8212. https://doi.org/10.3390/su14138212
He Y, Huang P. Exploring the Forms of the Economic Effects of Renewable Energy Consumption: Evidence from China. Sustainability. 2022; 14(13):8212. https://doi.org/10.3390/su14138212
Chicago/Turabian StyleHe, Yugang, and Panpan Huang. 2022. "Exploring the Forms of the Economic Effects of Renewable Energy Consumption: Evidence from China" Sustainability 14, no. 13: 8212. https://doi.org/10.3390/su14138212
APA StyleHe, Y., & Huang, P. (2022). Exploring the Forms of the Economic Effects of Renewable Energy Consumption: Evidence from China. Sustainability, 14(13), 8212. https://doi.org/10.3390/su14138212