Article

Optimal Controllers and Configurations of 100% PV and Energy Storage Systems for a Microgrid: The Case Study of a Small Town in Jordan

1
Department of Electrical Engineering, Faculty of Engineering, The Hashemite University, P.O. Box 330127, Zarqa 13133, Jordan
2
Protection and Metering Department, National Electric Power Company, Amman 11181, Jordan
3
Department of Electrical Engineering, College of Electrical and Electronics Technology-Benghazi, Benghazi 23P7F49, Libya
4
School of Science, Engineering & Environment, University of Salford, Salford M5 4WT, UK
*
Authors to whom correspondence should be addressed.
Sustainability 2022, 14(13), 8124; https://doi.org/10.3390/su14138124
Submission received: 13 May 2022 / Revised: 19 June 2022 / Accepted: 30 June 2022 / Published: 3 July 2022

Abstract

:
Renewable energy systems such as Photovoltaic (PV) have become one of the best options for supplying electricity at the distribution network level. This is mainly because the PV system is sustainable, environmentally friendly, and is a low-cost form of energy. The intermittent and unpredictable nature of renewable energy sources which leads to a mismatch between the power generation and load demand is the challenge to having 100% renewable power networks. Therefore, an Energy Storage System (ESS) can be a significant solution to overcome these challenges and improve the reliability of the network. In Jordan, the energy sector is facing a number of challenges due to the high energy-import dependency, high energy costs, and the inadequate electrification of rural areas. In this paper, the optimal integration of PV and ESS systems is designed and developed for a distribution network in Jordan. The economic and energy performance of the network and a proposed power network under different optimization algorithms and power network operation scenarios are investigated. Metaheuristic optimization algorithms, namely: Golden Ratio Optimization Method (GROM) and Particle Swarm Optimization (PSO) algorithms, are employed to find the optimal configurations and integrated 100% PV and ESS for the microgrid.

1. Introduction

1.1. Background

Electrical demand worldwide is increasing due to the increase in population, electrification of vehicles, economic expansion, and customer energy behaviour [1]. In Jordan, the electricity demand is growing at a rate of 3% every year [2]. Many developing and developed countries such as Jordan have limited traditional energy resources (fossil fuels) which contributes to economic challenges due to high and volatile operating costs [1,2,3]. The electrical demand trend in global consumerism requires improvements in power generation methods. In addition, there is a need to meet the growth in demand and develop a more cost-efficient energy system by motivating the consideration of new generation methods, in particular, distribution generation, renewable energy, and energy storage technologies [4]. The concerns of energy costs, climate change, and fossil fuel depletion have led many countries to move towards low-polluting Renewable Energy Sources (RES) such as Photovoltaic (PV), which offer cost-effective and environmental friendliness options [4,5]. Replacing traditional energy resources (fossil fuels) with renewable energy sources is the key to achieving a sustainable and zero-carbon economy. Therefore, PV and other RES systems have become an attractive option for 100% supplying loads in islands or remote areas. The volatile generation nature of RESs means that an energy storage system (ESS) such as batteries and an optimal operation process to achieve a well-planned zero-carbon energy system and ensure reliable delivery are needed [6,7]. This article aims to develop a realistic 100% PV and ESS for a microgrid based on a case study from Jordan and to optimally treat the stochastic behaviour of a PV by using different control methods for the ESS. In addition, this work will present an economic assessment of the proposed systems. The key contributions of this article will focus on providing an extensive investigation into the load demand and PV power generations of rural areas in Jordan and employing modern optimization algorithms (GROM and PSO) to improve the performance of 100% PV and ESS systems in a microgrid.

1.2. Literature Review

The studies by the authors of [2] introduced rural areas as the most affected zones by increasing the energy costs with a low reliable power system. Therefore, over the last few years, the significance of developing 100% RES has been globally addressed especially for island grids [8,9,10]. Bhuiyan et al. [8], Chen [9], and Alsaidan et al. [10] presented a standalone microgrid based on PV, wind turbines, and ESS to minimize the energy costs and gas emissions. However, the designed systems in [8,9] used the diesel-distributed generators as an auxiliary power supply to ensure the reliability of the system. Al-Shetwi et al. [11] presented a design and cost estimation of the stand-alone PV system to cover the basic needs for electricity such as lighting for a village consisting of 126 houses in Yemen. The proposed design by the authors of [11] did not include ESSs or an optimal operating system for the energy flow. In 2020, Ibrik [12] introduced two microgrid PV systems equipped with a battery storage system for two villages to reduce gas emissions. The author in [12] did not consider the impact of the optimal operation of ESSs and PV on energy and cost-efficiency.
The cost-efficient and optimal structure of a 100% RES system with a high-reliability performance in microgrids was the main goal of the different studies. For example, Zhao et al. [13] and Abdulgalil et al. [14] investigated the benefit of the optimal sizing of a standalone microgrid based on RES and ESS in terms of cost and pollution. The results in [13,14] showed that using an optimally sized PV and ESS is economically and environmentally beneficial and feasible. The researcher developed optimal configuration-sizing approaches to reduce the energy cost and sourcing reliability of RES integrated with urban university campuses [6] and in Al-Tafilah, Jordan [2]. The research studies [2,6,8,9,10] indicated that the integration of RES requires a high level of load-balancing constraints to achieve a reliable power system. In addition, a number of researchers have investigated the feasibility of standalone microgrids based on RES in terms of environmental and economic aspects [15,16,17,18]. In general, a few studies have focused on using 100% PV and ESS for a microgrid and the evaluation of their performance [2,6]. Algarani et al. [6] and Krishan et al. [19] provided an optimal sizing approach for an islanded PV system to meet the electricity need of a household. The feasibility of using PV equipped with ESS was not assessed in [6,19].
Recently, new metaheuristic optimization algorithms have been developed and employed in different areas such as power flow problems to improve the ability to solve challenging engineering problems [20,21,22]. The metaheuristic algorithms work to examine and cover a wide variable space for finding a promising solution which is not at a local area (local optimal point) by using as extensive and random a search as possible. Therefore, the metaheuristic optimization algorithms such as Particle Swarm Optimization (PSO) are increasingly becoming common for solving non-linear and complex objective functions [23]. However, the extensive and random search process will require a high computational effort to find the global optimal solution. Nematollahi et al. [24] developed a new metaheuristic algorithm called the Golden Ratio Optimization Method (GROM) with the motivation of achieving the global solution within an efficient time for complex problems. The research studies in [24] employed the GROM to solve the power flow problem for a power network with renewable energy sources. Therefore, the GROM algorithm could beneficially solve stochastic energy optimization problems and it will have a significant impact on improving the energy efficiency performance.

1.3. Contributions

Designing an optimal integration of PV and ESS systems for microgrids and investigating the economic and energy performance under different optimization algorithms is the objective of this article. To the best of the authors’ knowledge, no studies have provided a comparison of optimization operation algorithms for microgrids based on 100% PV and ESS. In addition, metaheuristic optimization algorithms, namely GROM and PSO algorithms, are employed to find the optimal configurations and integrated 100% PV and ESS for the microgrid. The main objectives and contributions of this article are:
  • Providing one of the first extensive investigations into the load demand and PV power generations of rural areas in Jordan;
  • Designing an optimal 100% PV and ESS system for a microgrid and rural areas in Jordan;
  • Employing new metaheuristic optimization algorithms (GROM and PSO) to improve the economic and energy performance of 100% PV and ESS systems for the microgrid.

1.4. Outline of Paper

The following sections are organized as follows: The description of the 100% PV and ESS systems and methodology are introduced in Section 2. In Section 3, the proposed model results are discussed. Finally, the summary and conclusion of this paper are introduced in Section 4.

2. The Description of the 100% PV and ESS Systems and Methodology

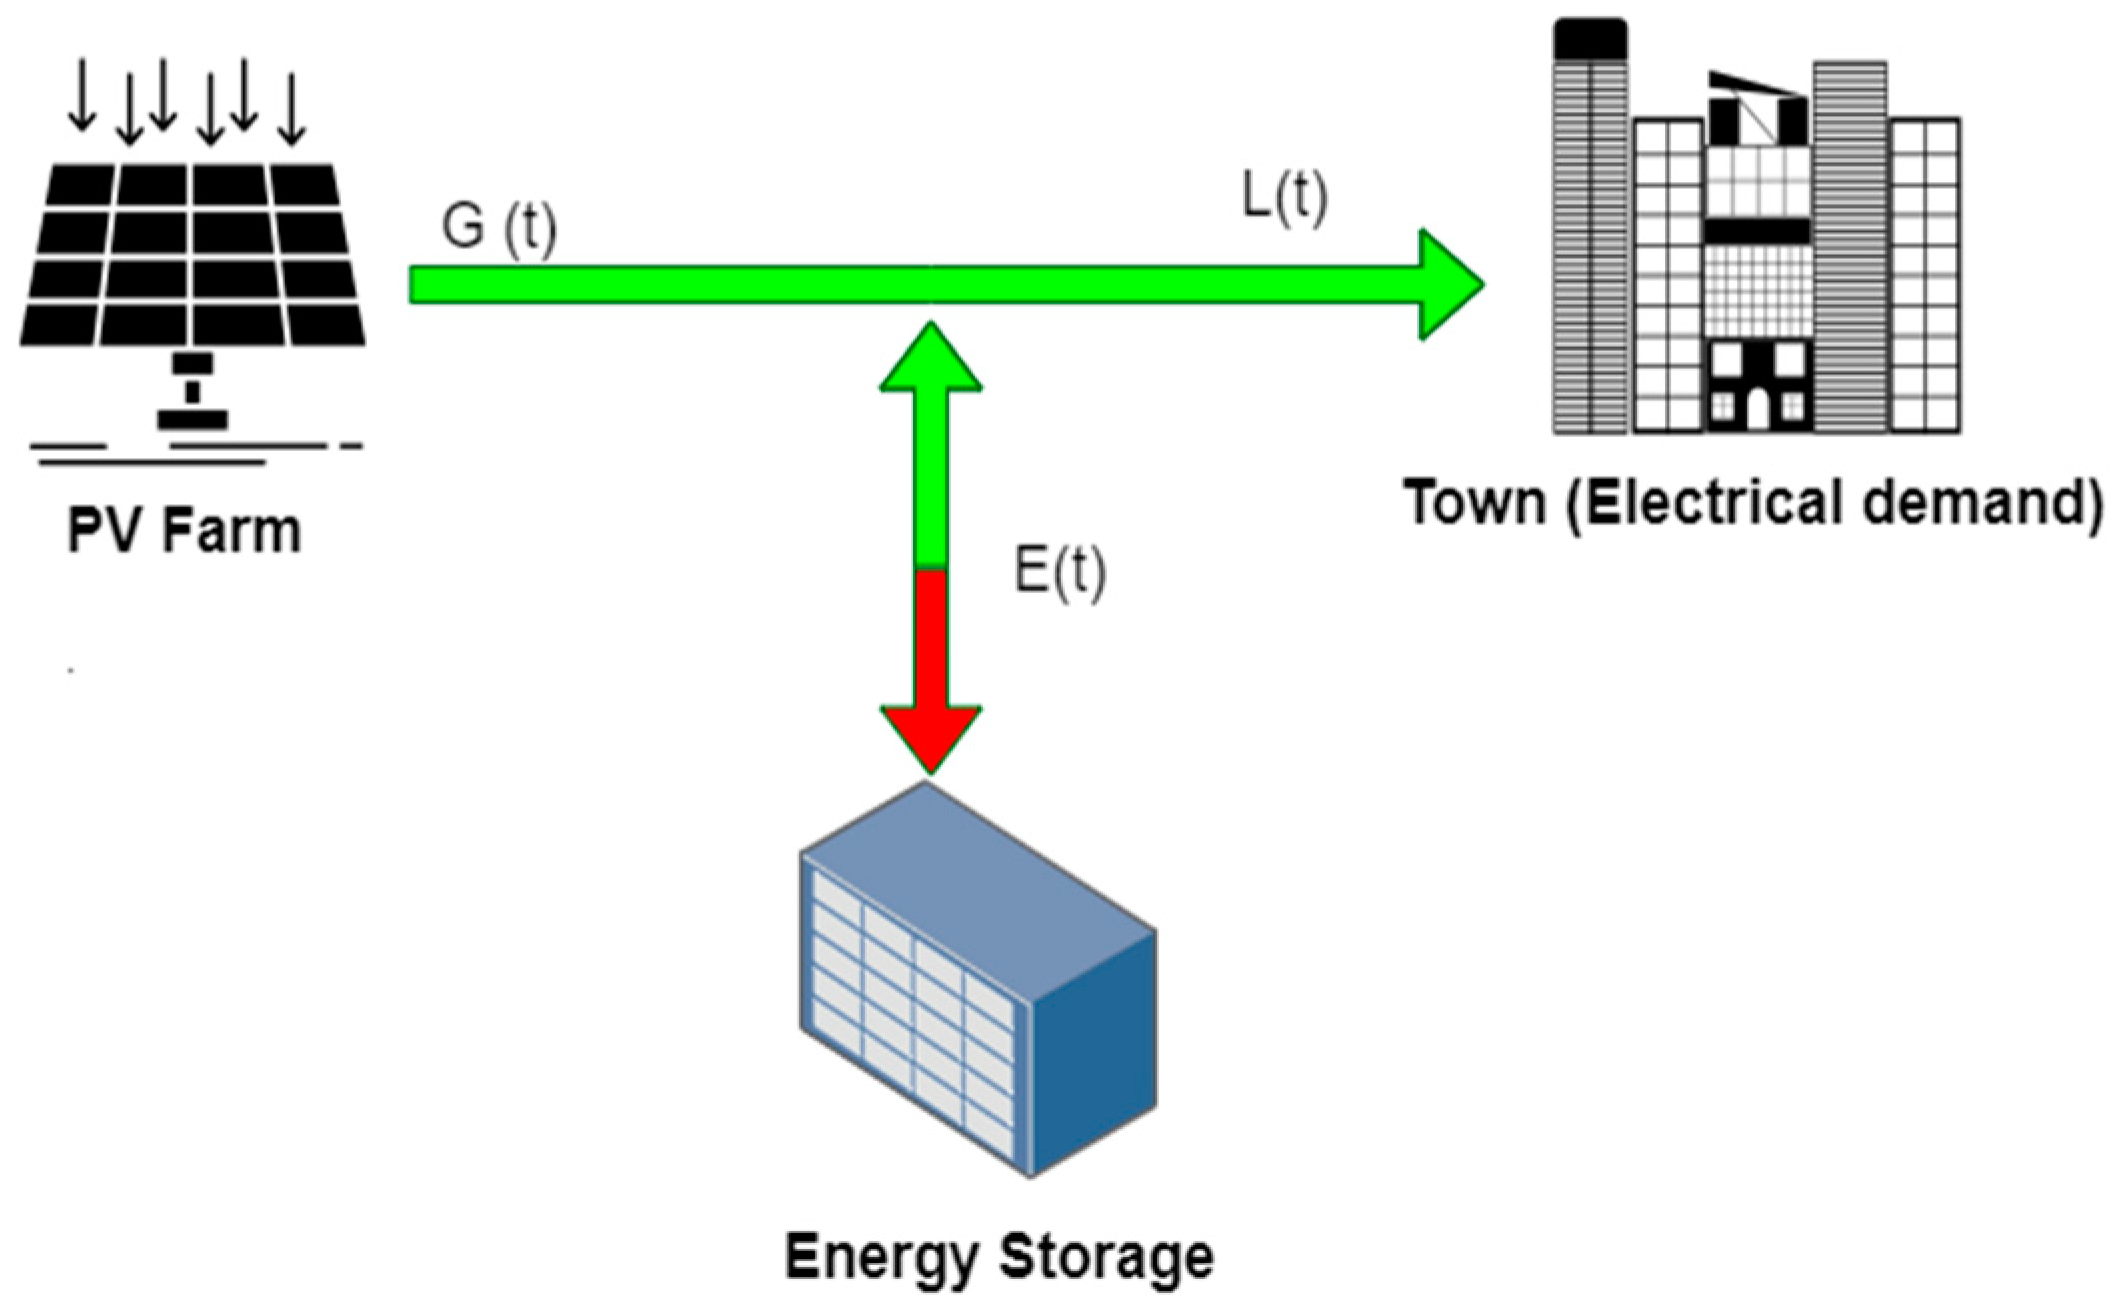
This section aims to introduce the 100% PV and ESS systems for microgrid topology and the optimal controllers for the ESS. Firstly, the schematic energy flow diagram, as shown in Figure 1, shows the flow of energy from the main energy source (the PV system G ( t ) ) and ESS, E ( t ) , to the demand side of the gird, L ( t ) . The energy flow diagram presents that the PV system, G ( t ) , supplies all the required electrical energy consumption, L ( t ) , and charge to the storage device ( E ( t ) with the red arrow, in Figure 1). However, in the case of discharging the ESS, ( E ( t ) with the green arrow, Figure 1), the PV system, G ( t ) , will supply the energy of the grid demand, L ( t ) , minus the discharged energy from the ESS. The energy flow can be described as follows [1,2,3]:
G ( t ) = L ( t ) E ( t ) ,   t   +
In addition, this work aims to develop and present an optimal energy controller for the ESS to improve the power network performance compared to the common energy controller, the set-point algorithm [25]. The optimal energy controller aims to find the optimal ESS operation condition (charging and discharging). 
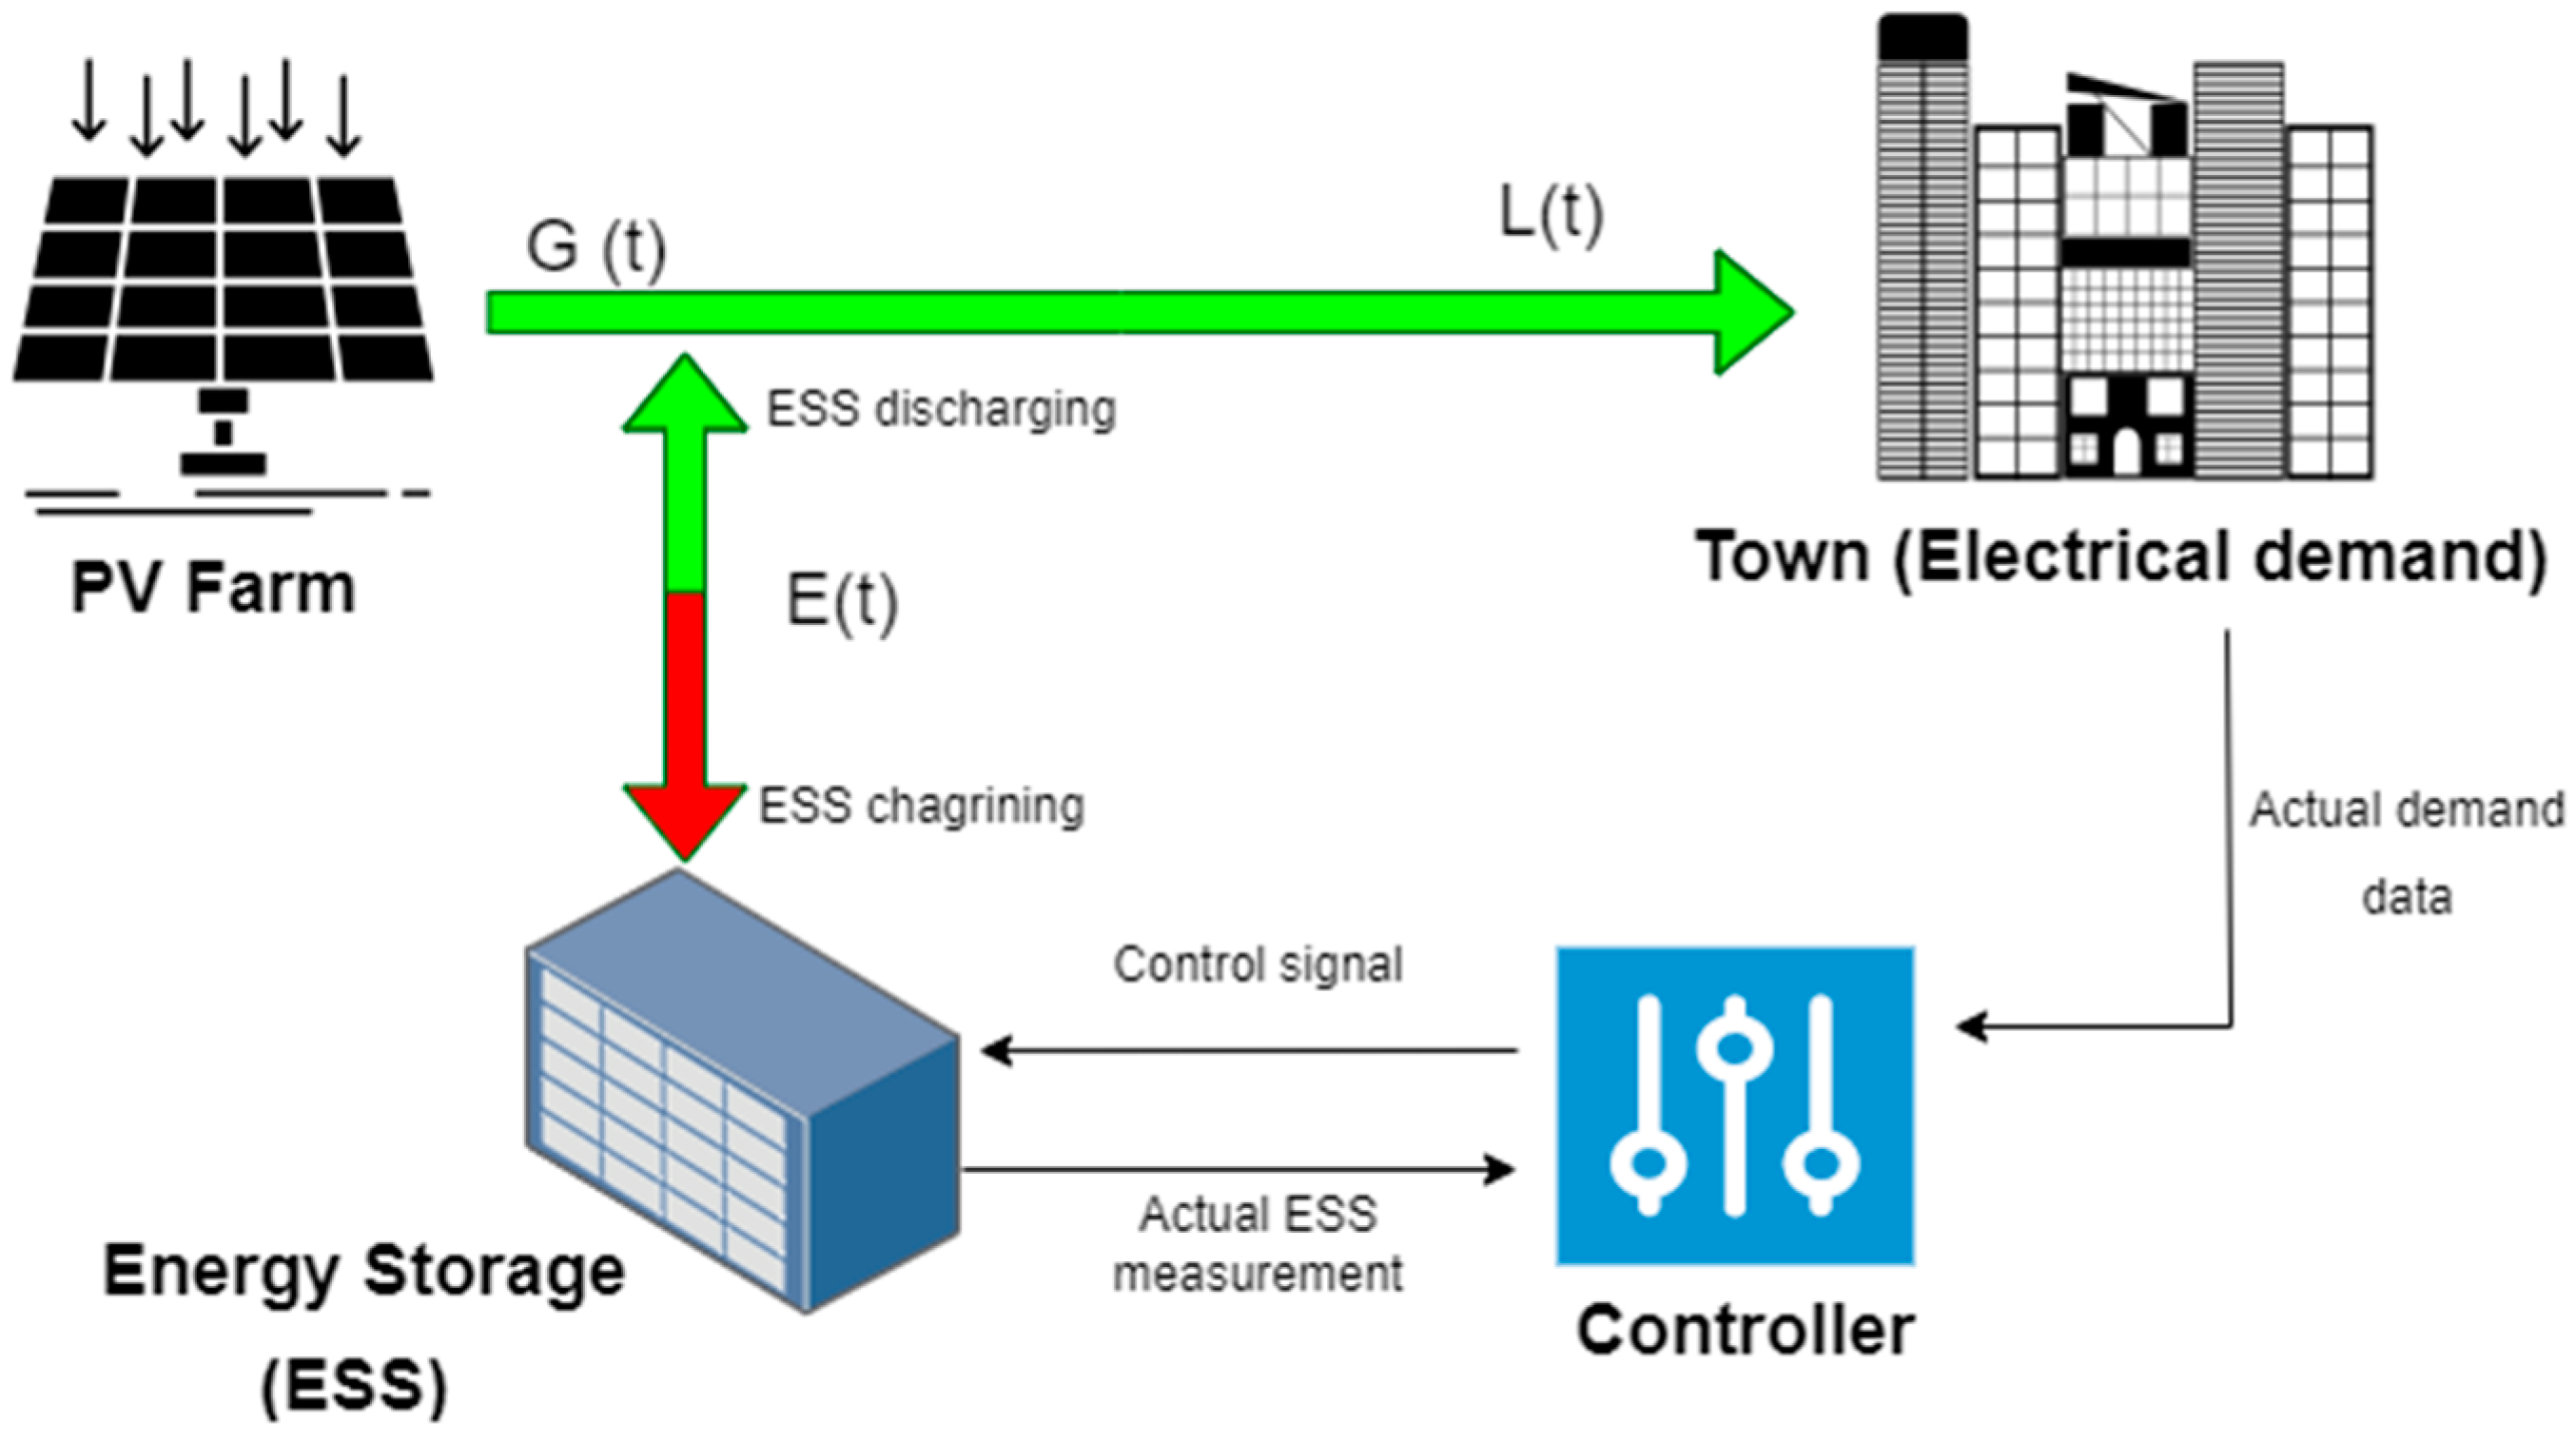
Figure 2 introduces the proposed energy control loop for the microgrid system. The actual electrical demand and the ESS measurements are fed to the energy controller to generate a control decision to optimally charge or discharge the energy storage. The main components of the proposed system in this paper, as presented in Figure 2, will be discussed in the following subsections.

2.1. Area and Load Demand Analysis

This work focuses on the development of a 100% renewable energy resources system for low voltage networks (microgrid). In general, the electrical demands at the low voltage level of the network have higher volatile and stochastic behaviour compared to the high and medium voltage levels [2,6]. This increases the complexity of designing and developing 100% renewable energy resources with ESS. In this paper, electrical demand data for a town in Jordan were collected from the Electrical Distribution Co (EDCO) over a year from 1 January 2020 to 31 December 2020 with a 15 min resolution. The smart meter data were collected at Al-Mashari’e town in Irbid. The location of the town is in the northwest of Jordan, Northern Shuna, Al-Mashari’e in Irbid within the geographical coordinates 35°44′88″ N, 35°59′51″ E, as shown in Figure 3. Al-Mashari’e town has a population of over 27,000 according to the Jordanian Department of Statistics. To develop an optimal PV system and ESS for a network, it is important to understand the behaviour of the demand and to study the electrical demand trends. The following subsection aims to provide an overview of the demand and an investigation of the town demand trend.

2.1.1. Demand Trend and Analysis

The section aims to present and analyse the profile of electricity demand at the Al-Mashari’e town in Jordan. The electrical energy usage is used to provide a detailed examination of demand based on the following criteria:
  • Overview of the town demand patterns based on the hourly, daily, and monthly load consumption;
  • The seasonal demand (winter and summer).
Firstly, the profile of hourly electricity demand in the Al-Mashari’e town in 2020 is shown in Figure 4. In 2020, the maximum hourly power recorded was 420 kW during September. The hourly power consumption registered the minimum power values within the spring season (March to May) with power less than 100 kW. As seen in Figure 5, the hourly demand was examined by plotting the average demand based on the sort of hour per day. The hourly demand distribution shows that the hourly demand data included two main peak patterns at 2:00 and 17:00, as shown in Figure 5.
In order to design the optimal size of PV and ESS systems, the peak and valley demand values need to be taken into account. Therefore, Figure 6 introduces the average hourly minimum and maximum power consumption recorded for all days of the year. The average hourly maximum power consumption showed a variation based on the time of the day. The average maximum power consumption was 417 kW at 4 o’clock and power consumption registered at over 400 kW at the time between 3 and 5 o’clock. The minimum power consumption showed a constant behaviour with power values between 50 kW and 70 kW. To examine the peak power values over a year, Figure 7 presents the maximum peak values that occurred over a year on a specific day. The maximum power consumption occurred on Thursday 5th of September. Figure 7 introduces a comparison between the maximum, minimum, and average hourly power consumption over a day during the year. This introduces the highly volatile behaviour of the power consumption for the same day over the year. For example, the hourly power consumption at 17:00 was between 81 and 367 kW as the minimum and maximum power consumption, respectively.
To develop an optimal PV system, it is important to examine the behaviour of the daily demand. Figure 8 aims to provide an overview of the daily power consumption (cumulative over the day) and the investigation of the town demand trend. The minimum and maximum daily power consumption over each month during a year are presented in Figure 8. The minimum and maximum power values have the same seasonal trend over the year, as shown in Figure 8. The maximum daily power value occurred during September was 7284 kW and the minimum daily power consumption occurred during April was 1664 kW.

Seasonal Analysis

The previous analysis presented a seasonal trend for the power consumption; therefore, the load demand profiles are examined based on the season cycles over a year. Figure 9 shows the monthly load demand over the year. The monthly load demand had an increasing trend during the period (July, August, and September). This is mainly related to the switching on of the cooling systems as the temperature went to around 40 °C. In addition, the average hourly power consumption over each month is presented in Figure 10. The hourly power consumption curves during the summer period were significantly increased compared to winter and other months of the year. However, the hourly power trend for each season (summer and winter) was almost consistent, as shown in Figure 10 and Figure 11. In general, the seasonal analysis indicated a seasonal (summer, Figure 11a and winter, Figure 11b) trend in the power profile data due to the weather effects on the demand behaviour.

2.2. Sizing of the PV System

In general, the size of the PV system depends on different terms such as the scale of the project (small, medium, or large scale) and location. The impact of location on the PV system is related to the ambient conditions (temperature and solar radiation) which affect the efficiency of the PV system (energy production) [2,5]. In this section, the annual and monthly averaged values of global horizontal irradiance (GHI), direct normal irradiation (DNI), diffuse horizontal irradiation (DIF), and global tilted irradiation at an optimum angle (GTI) were downloaded from the solar energy database provided (SolarGIS website) [
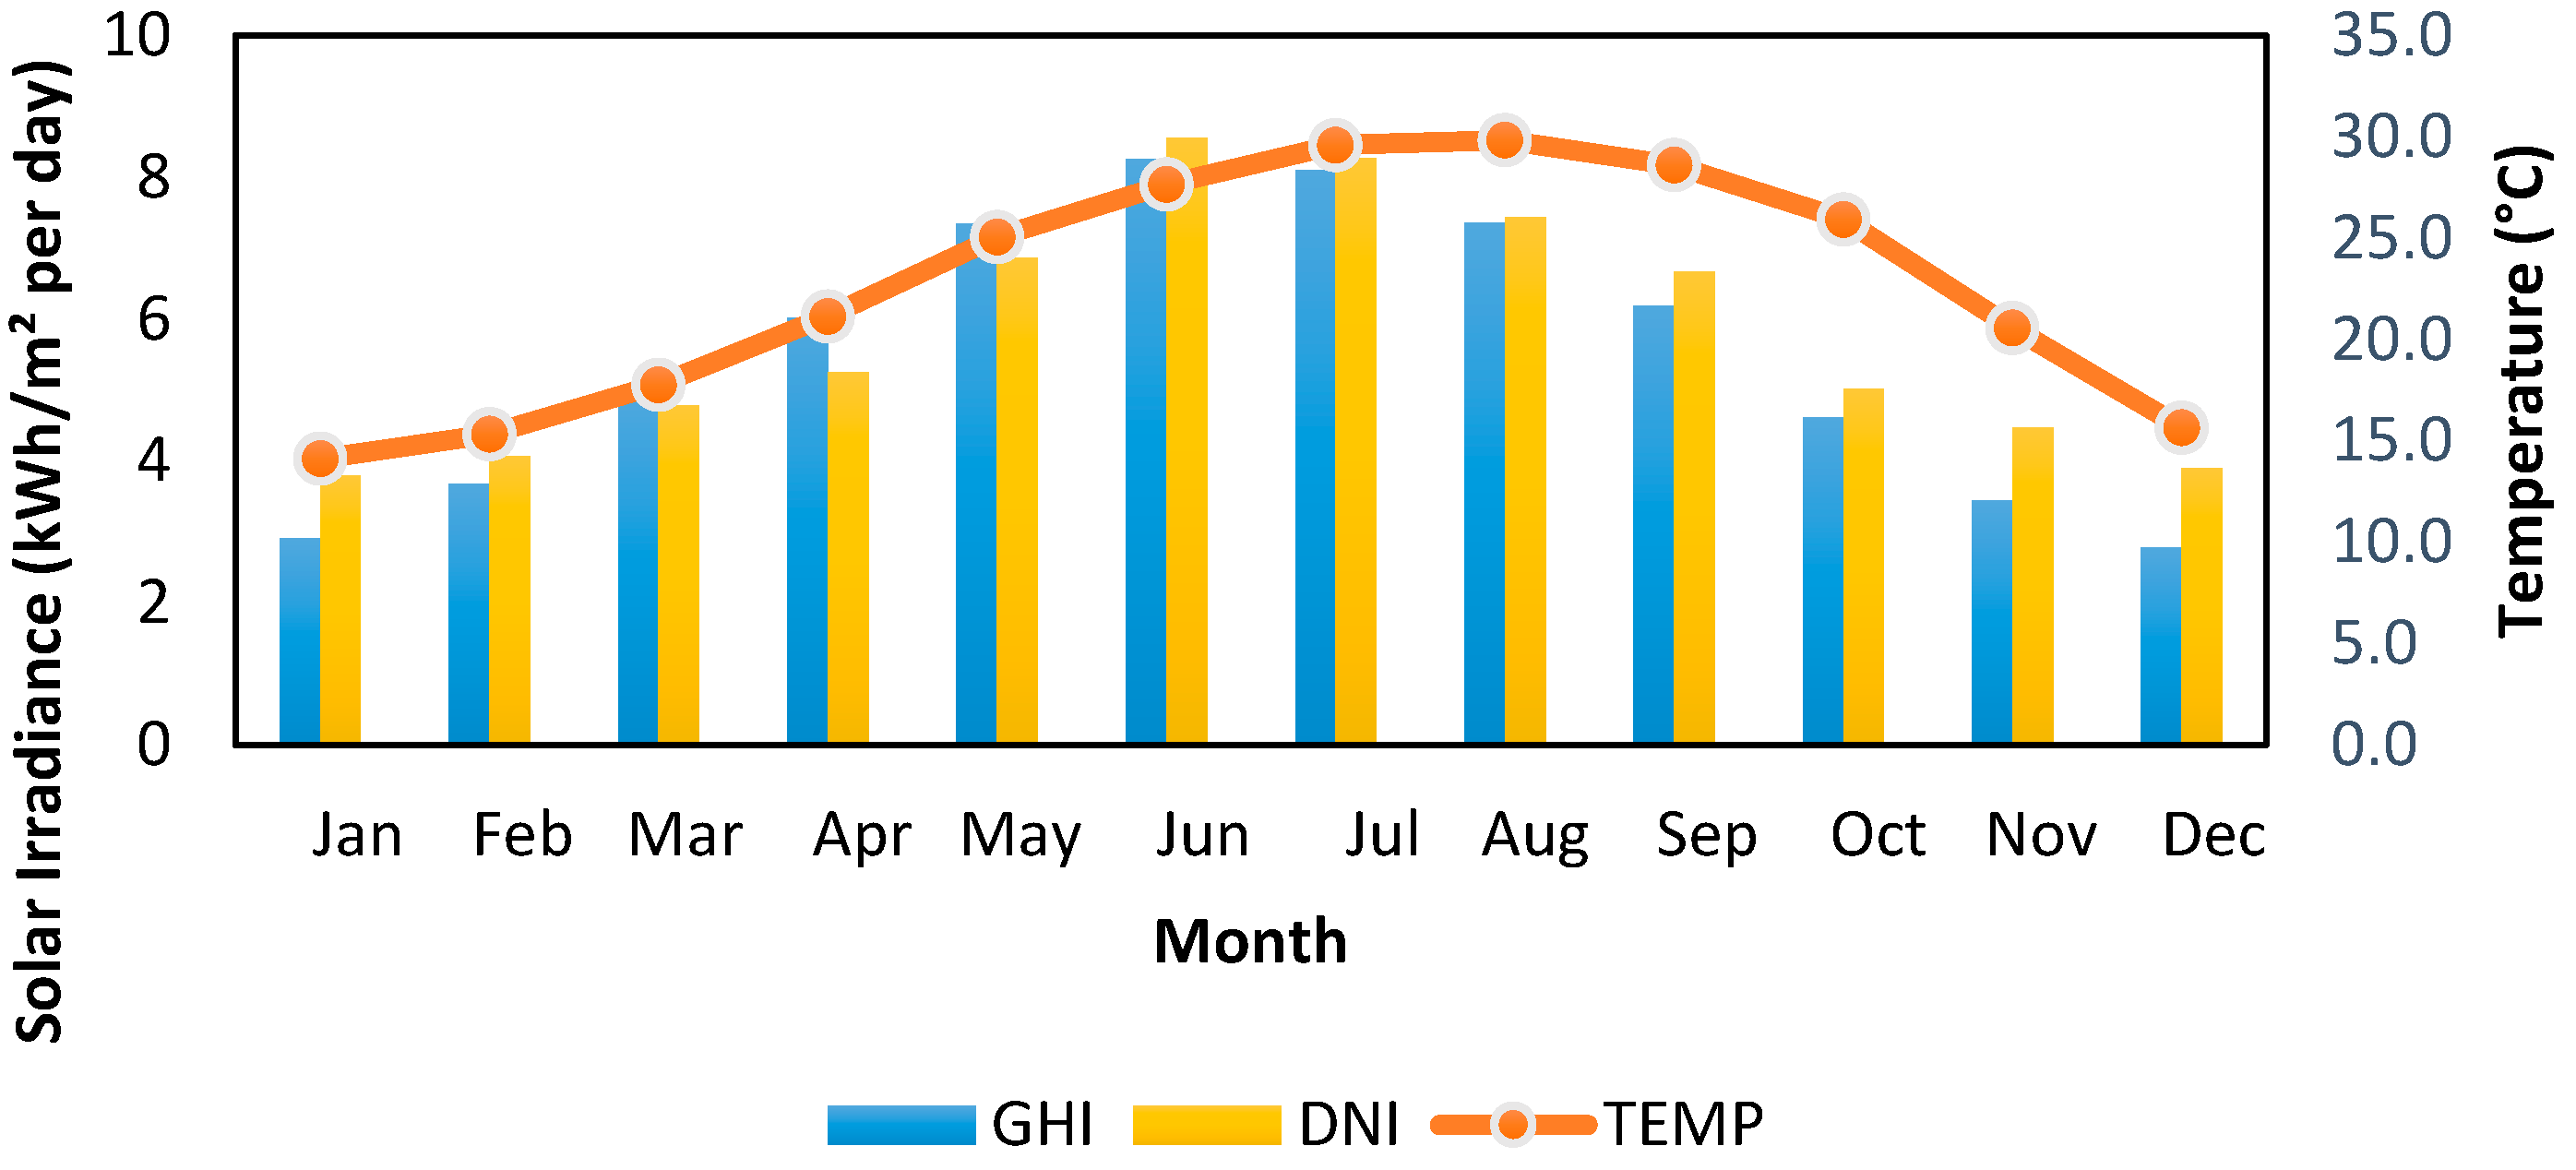
26]. The annual average GHI is 5.485 kWh/m2 per day which introduced this location as a significant location for installing PV systems with a high level of solar radiation, as shown in Table 1 and Figure 12. In addition, from April to September, the irradiance level is more than 6 kWh/m2 per day. The solar radiation in summer is significantly higher and reaches above 8 kWh/m2 per day in June and July, whereas in winter it still records a sufficient level of radiation with an amount of around 3 kWh/m2 per day in December and January.
A power network based on a 100% RES system with high-reliability performance in microgrids was the main goal of this study. The size of the PV system considering the different load demand scenarios is presented in Table 2. Equation (2) was used to calculate the size of the PV systems, Z PV in kW [5]:
Z PV = E daily S daily η pv
where E daily is the average daily load energy (kWh/day), S daily is the average direct sunlight hours within the day, and η pv is the PV system efficiency. In this work, the η pv was considered to be 0.79 and S daily 
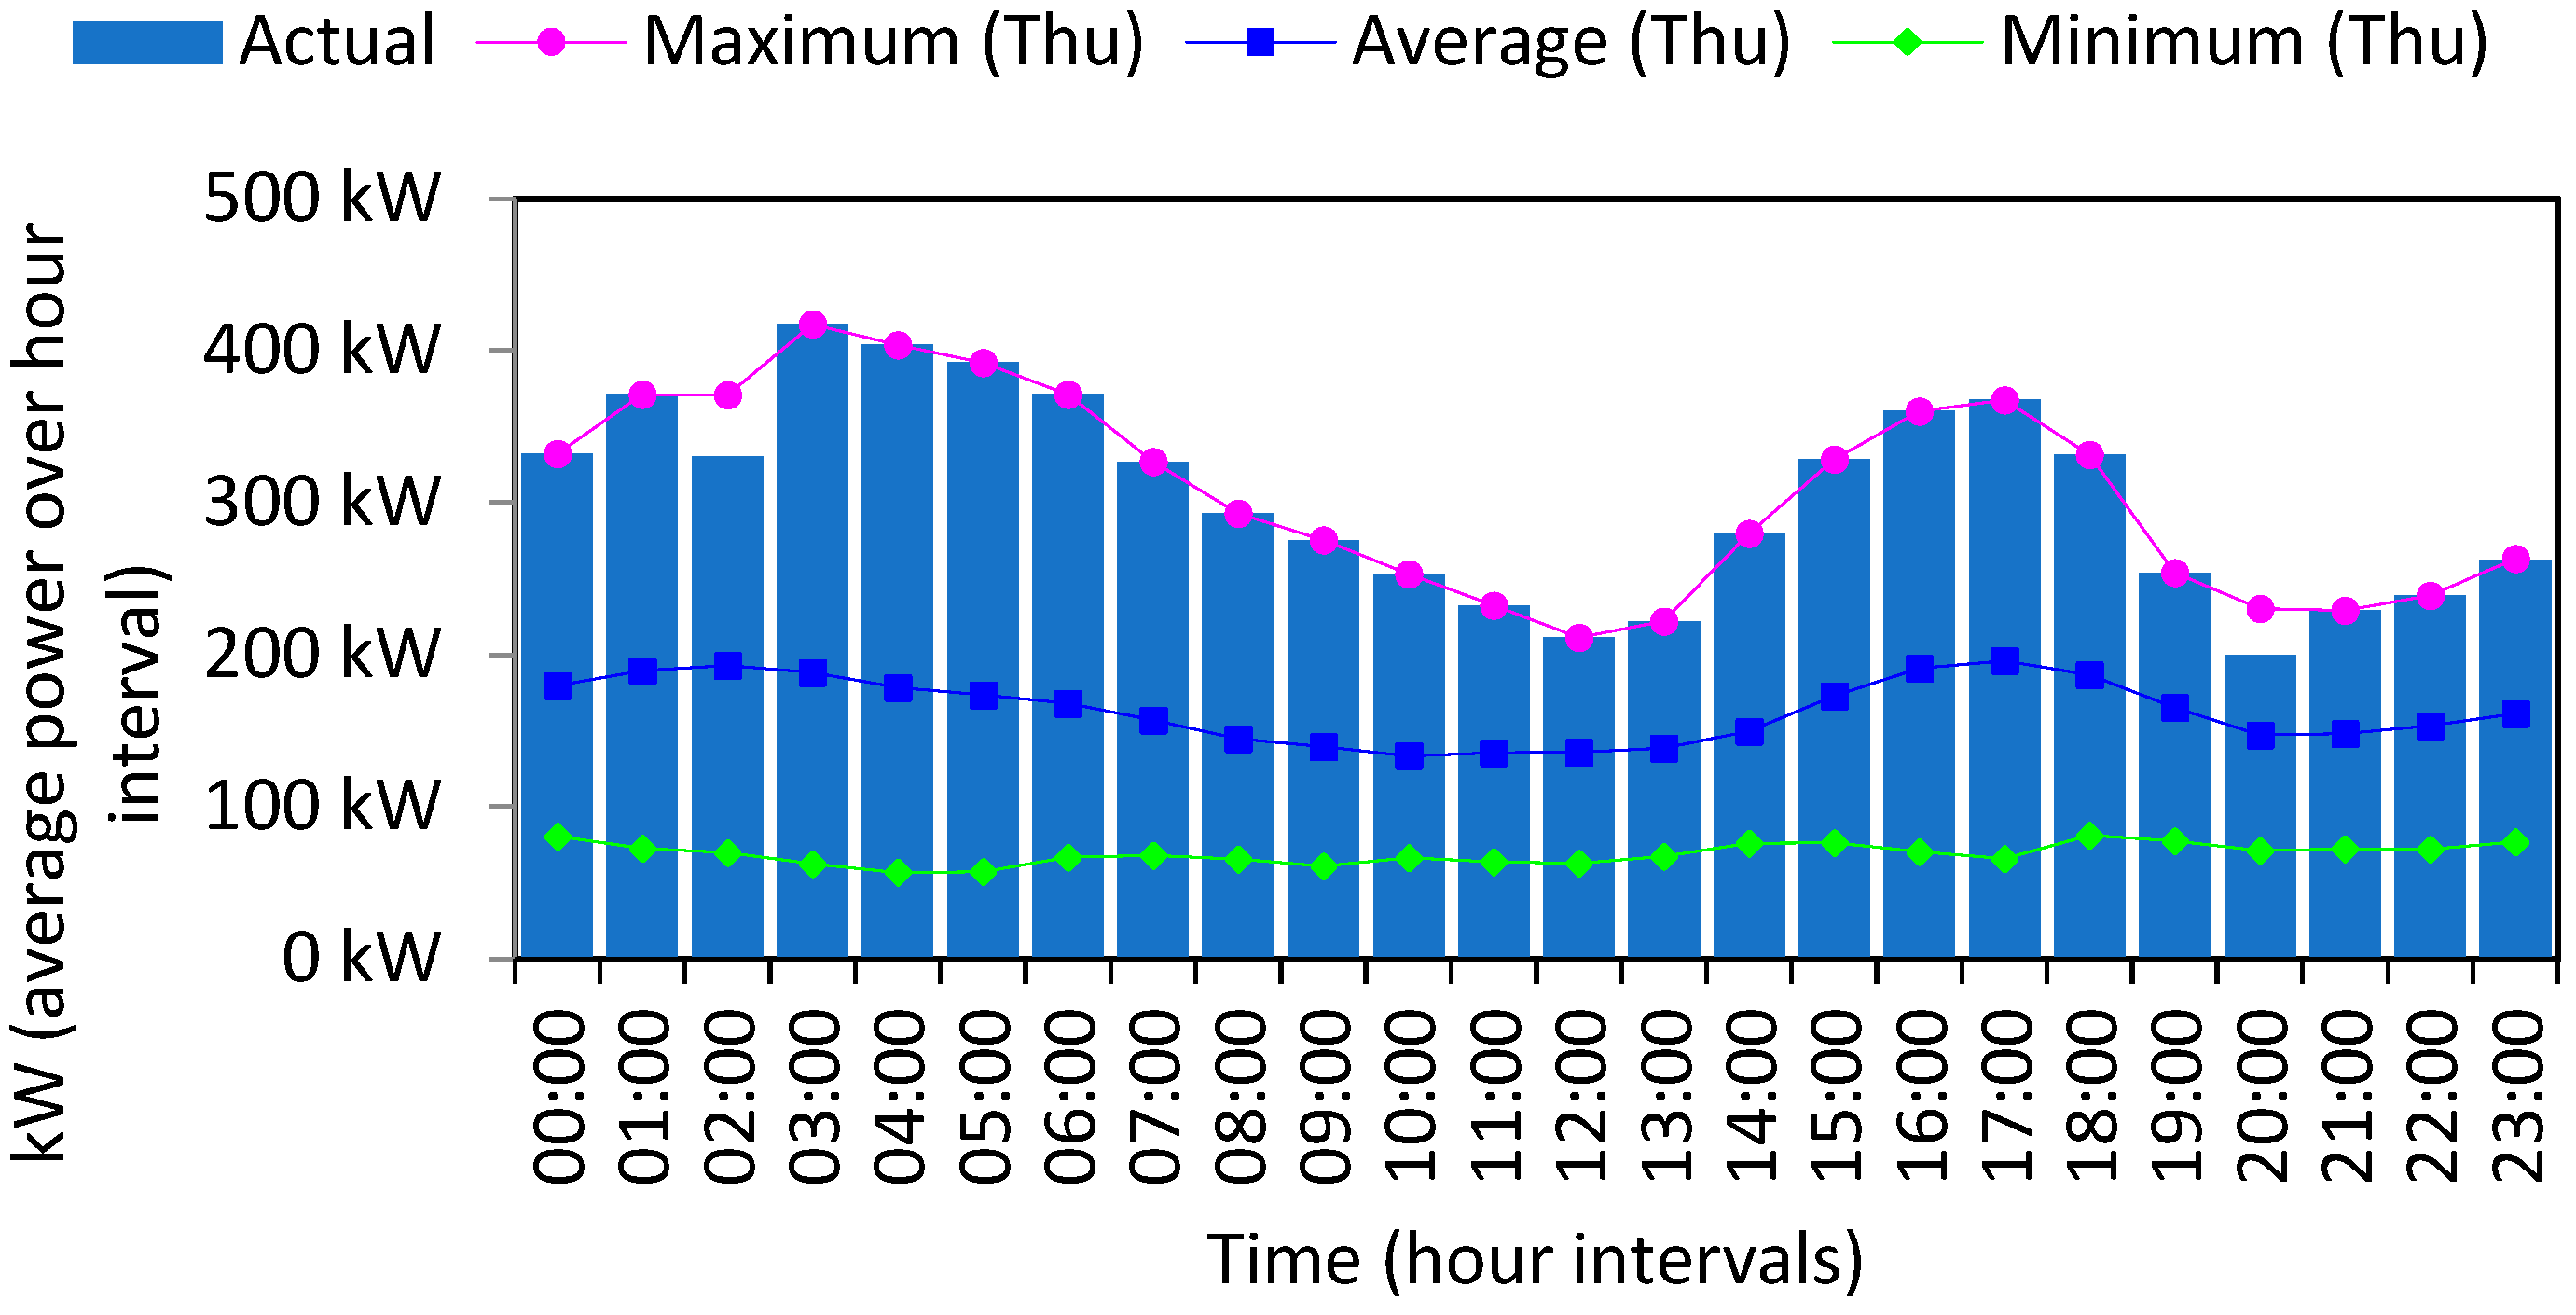
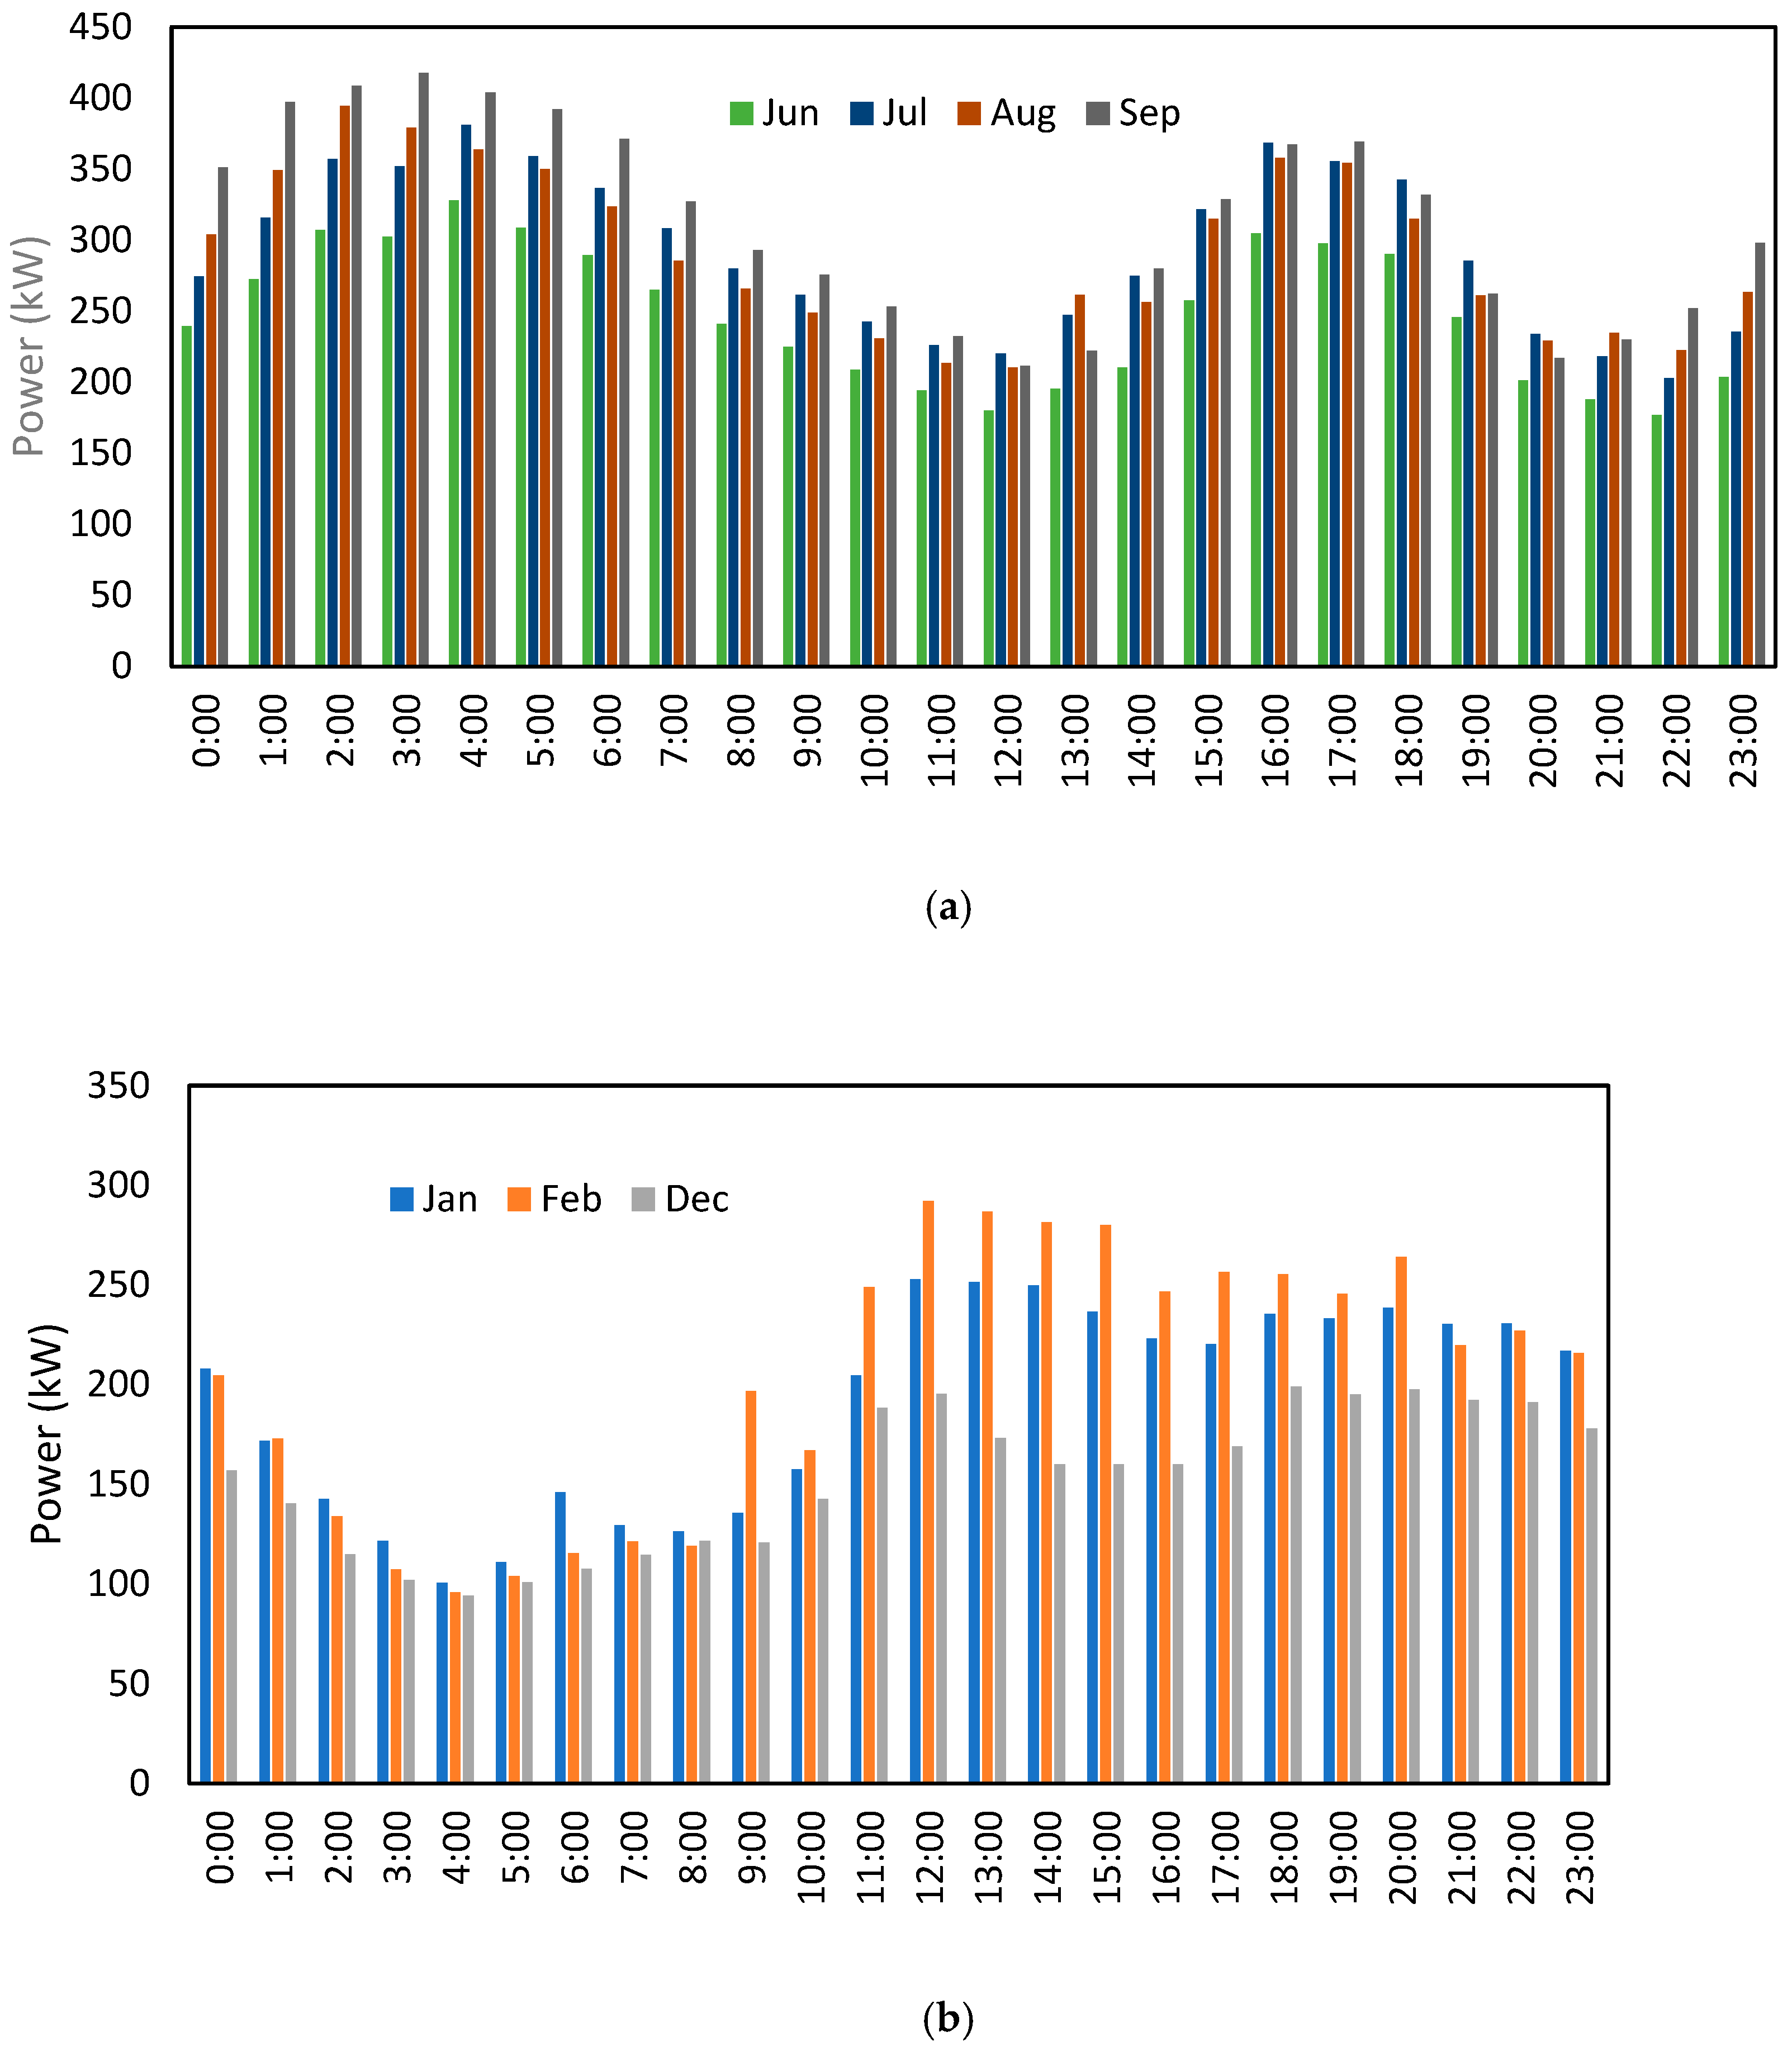
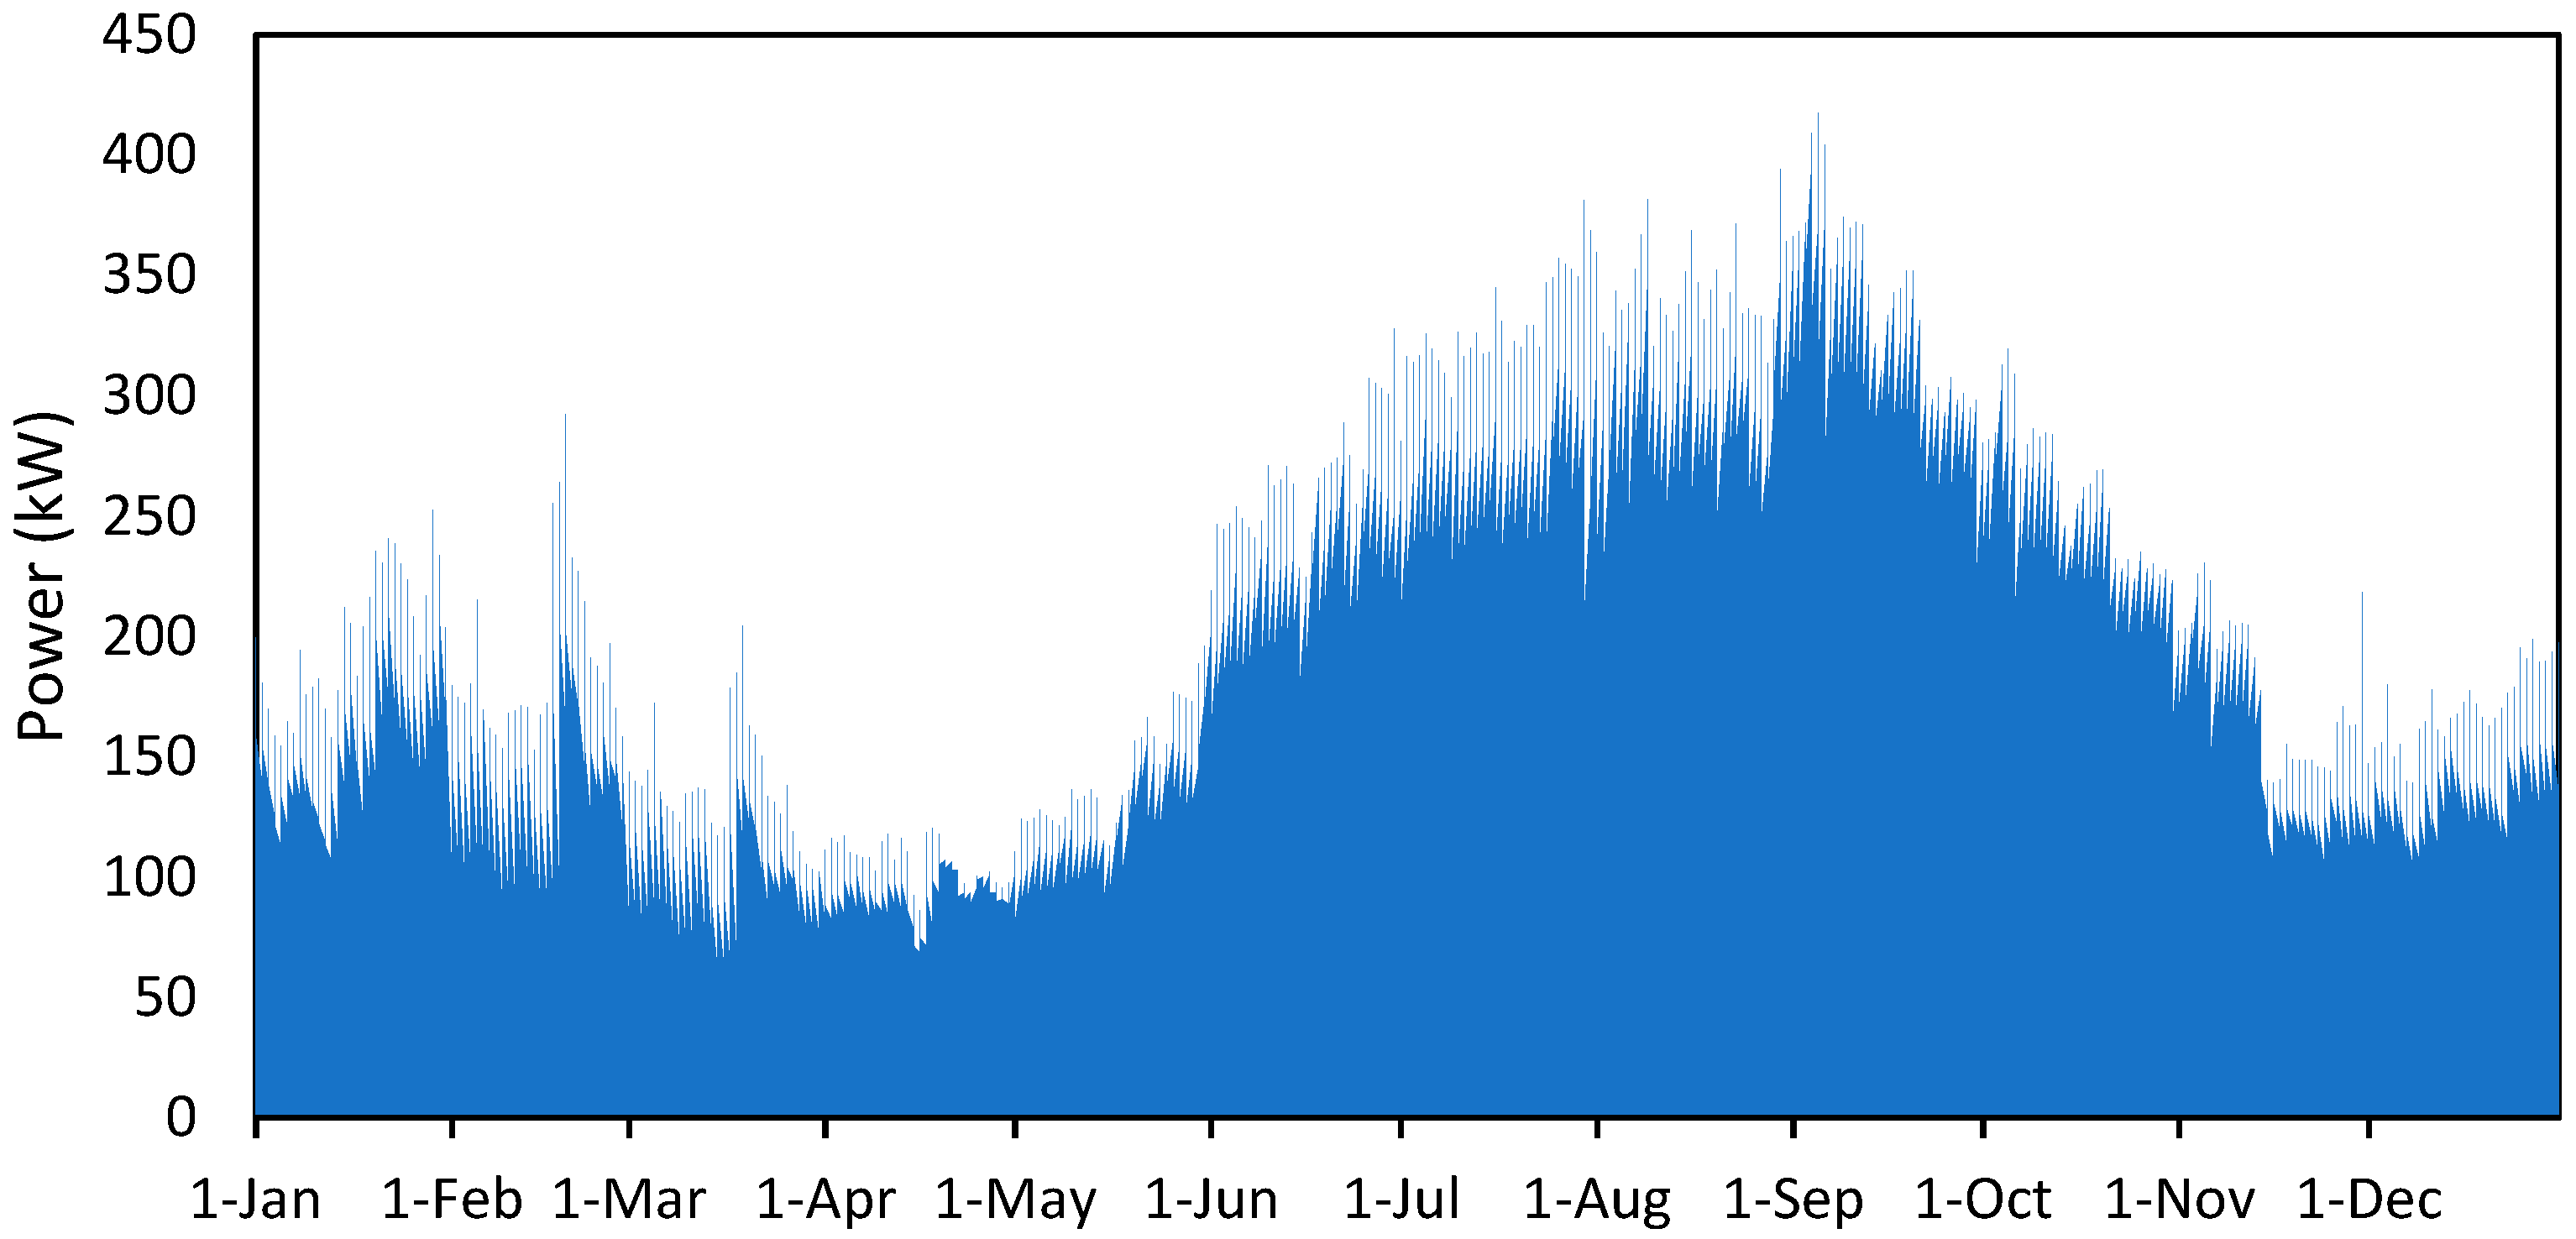
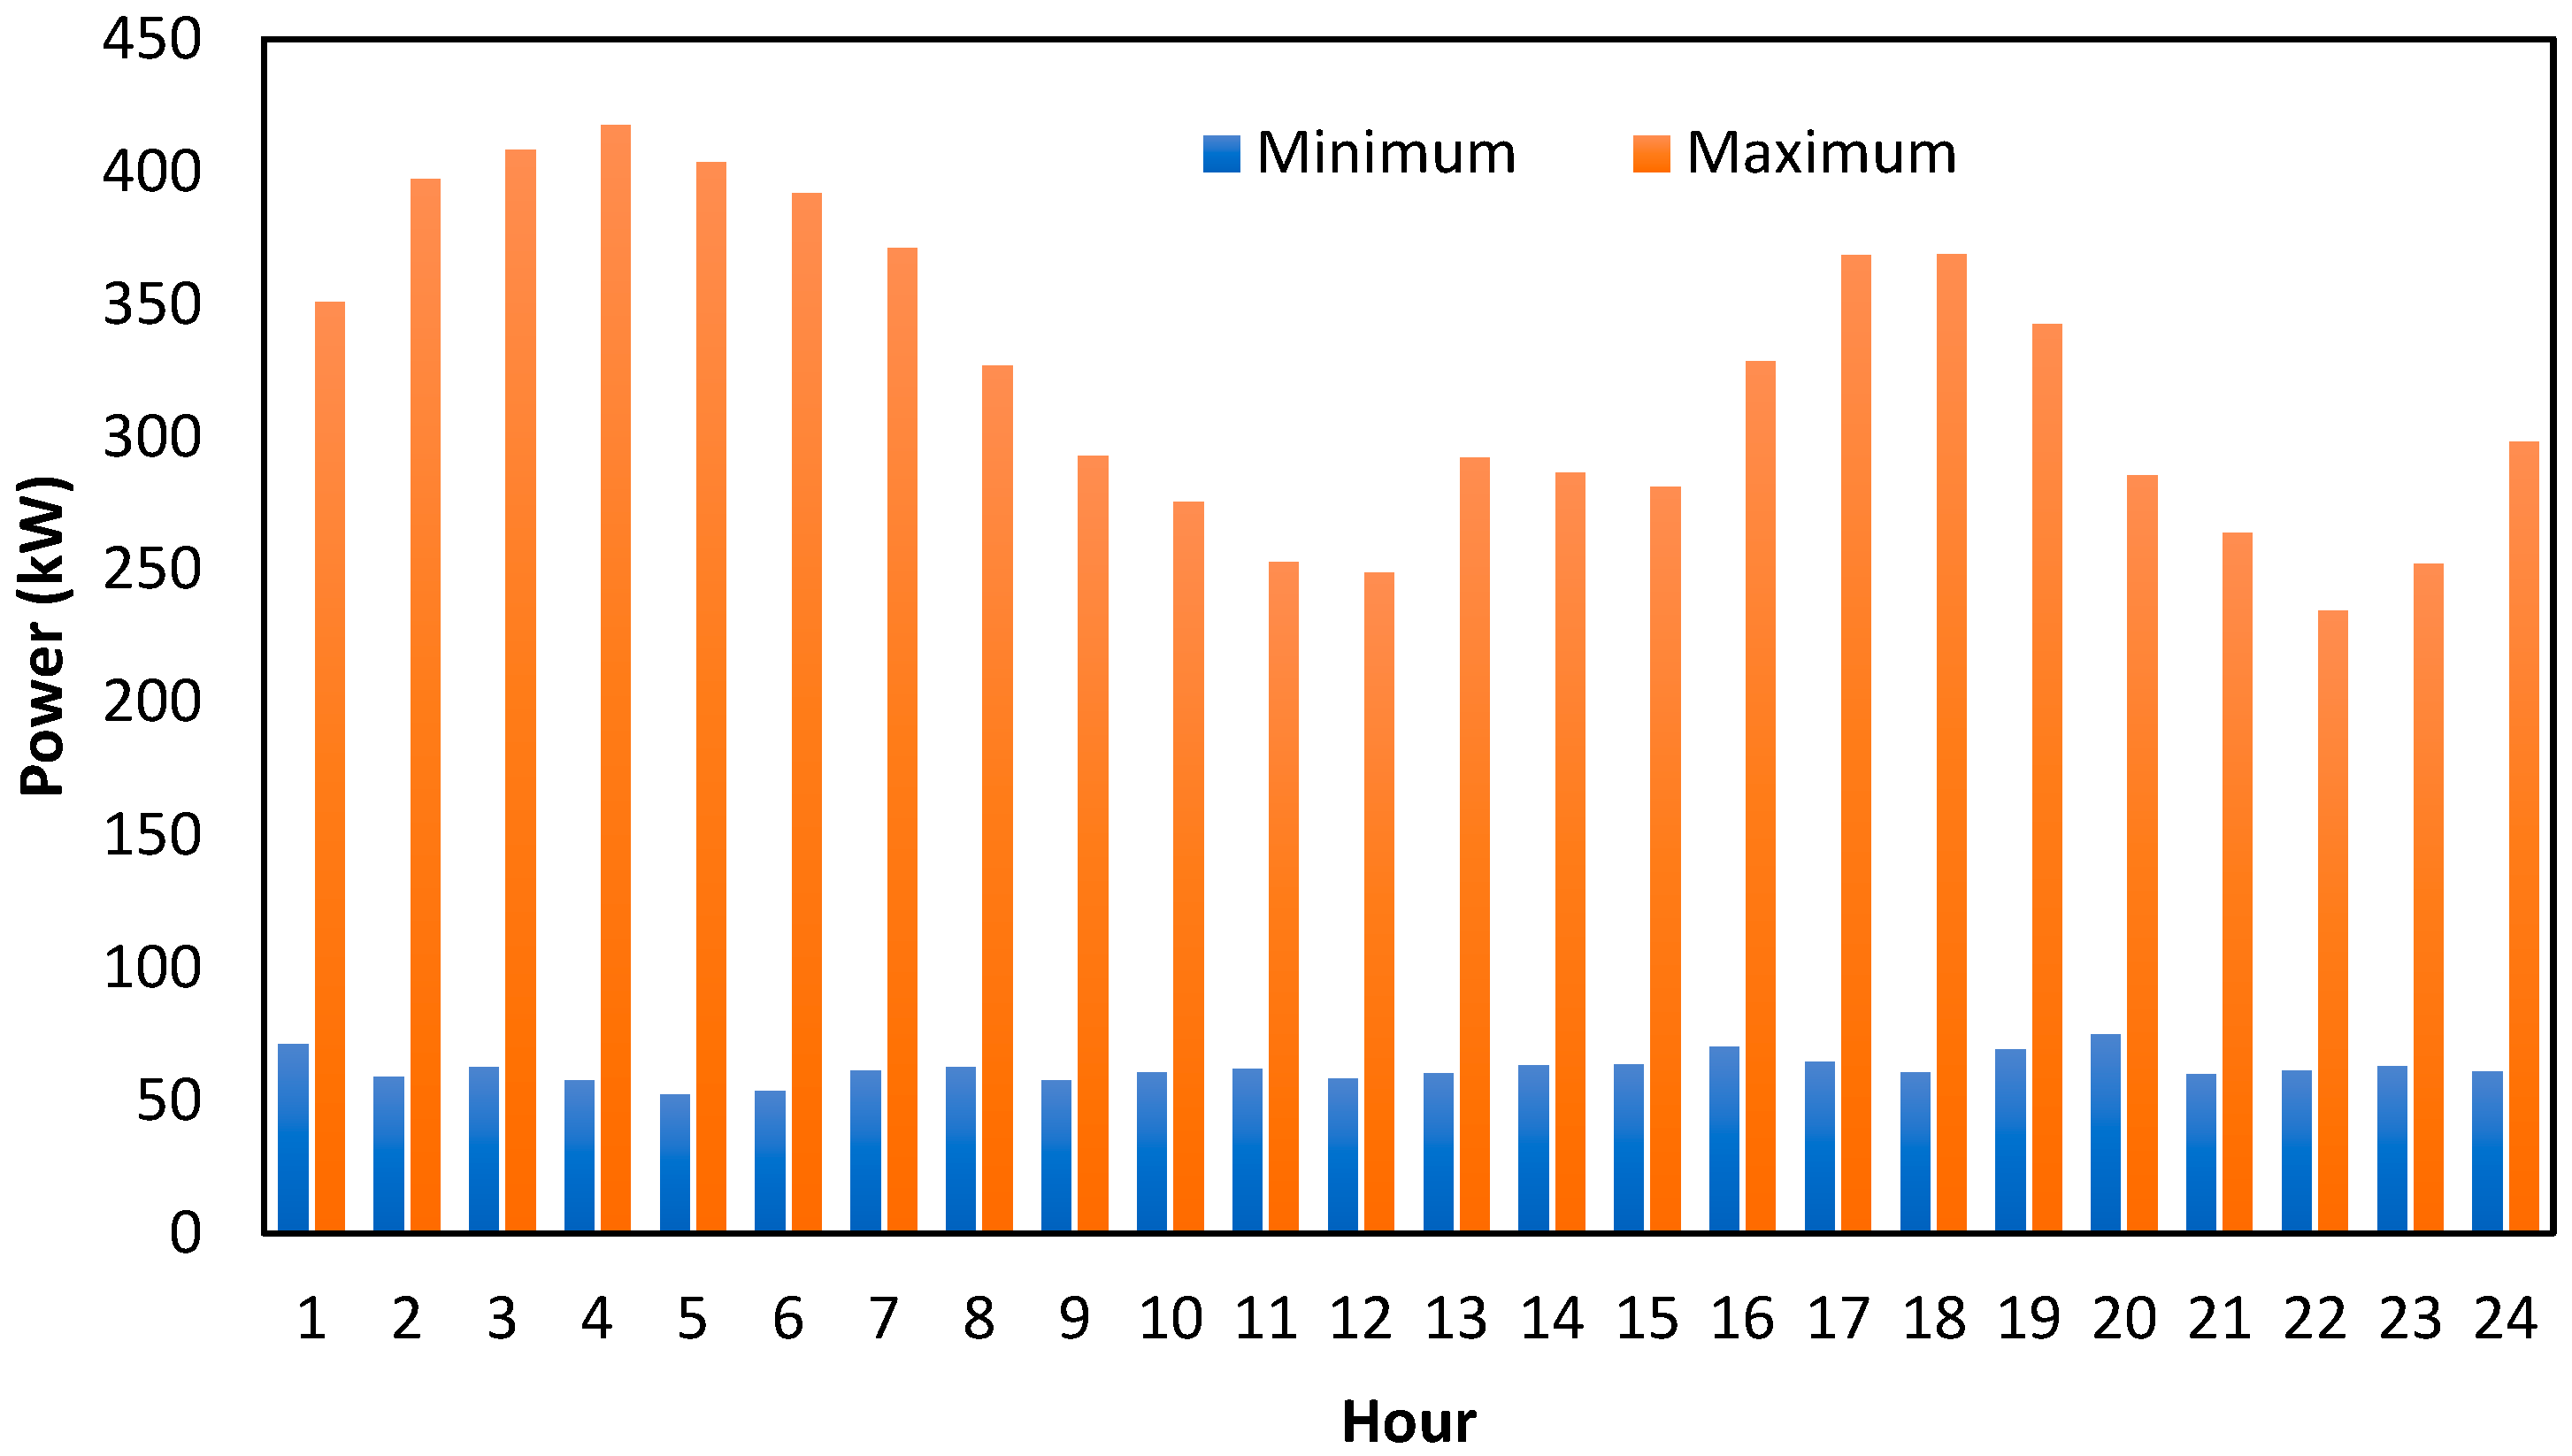
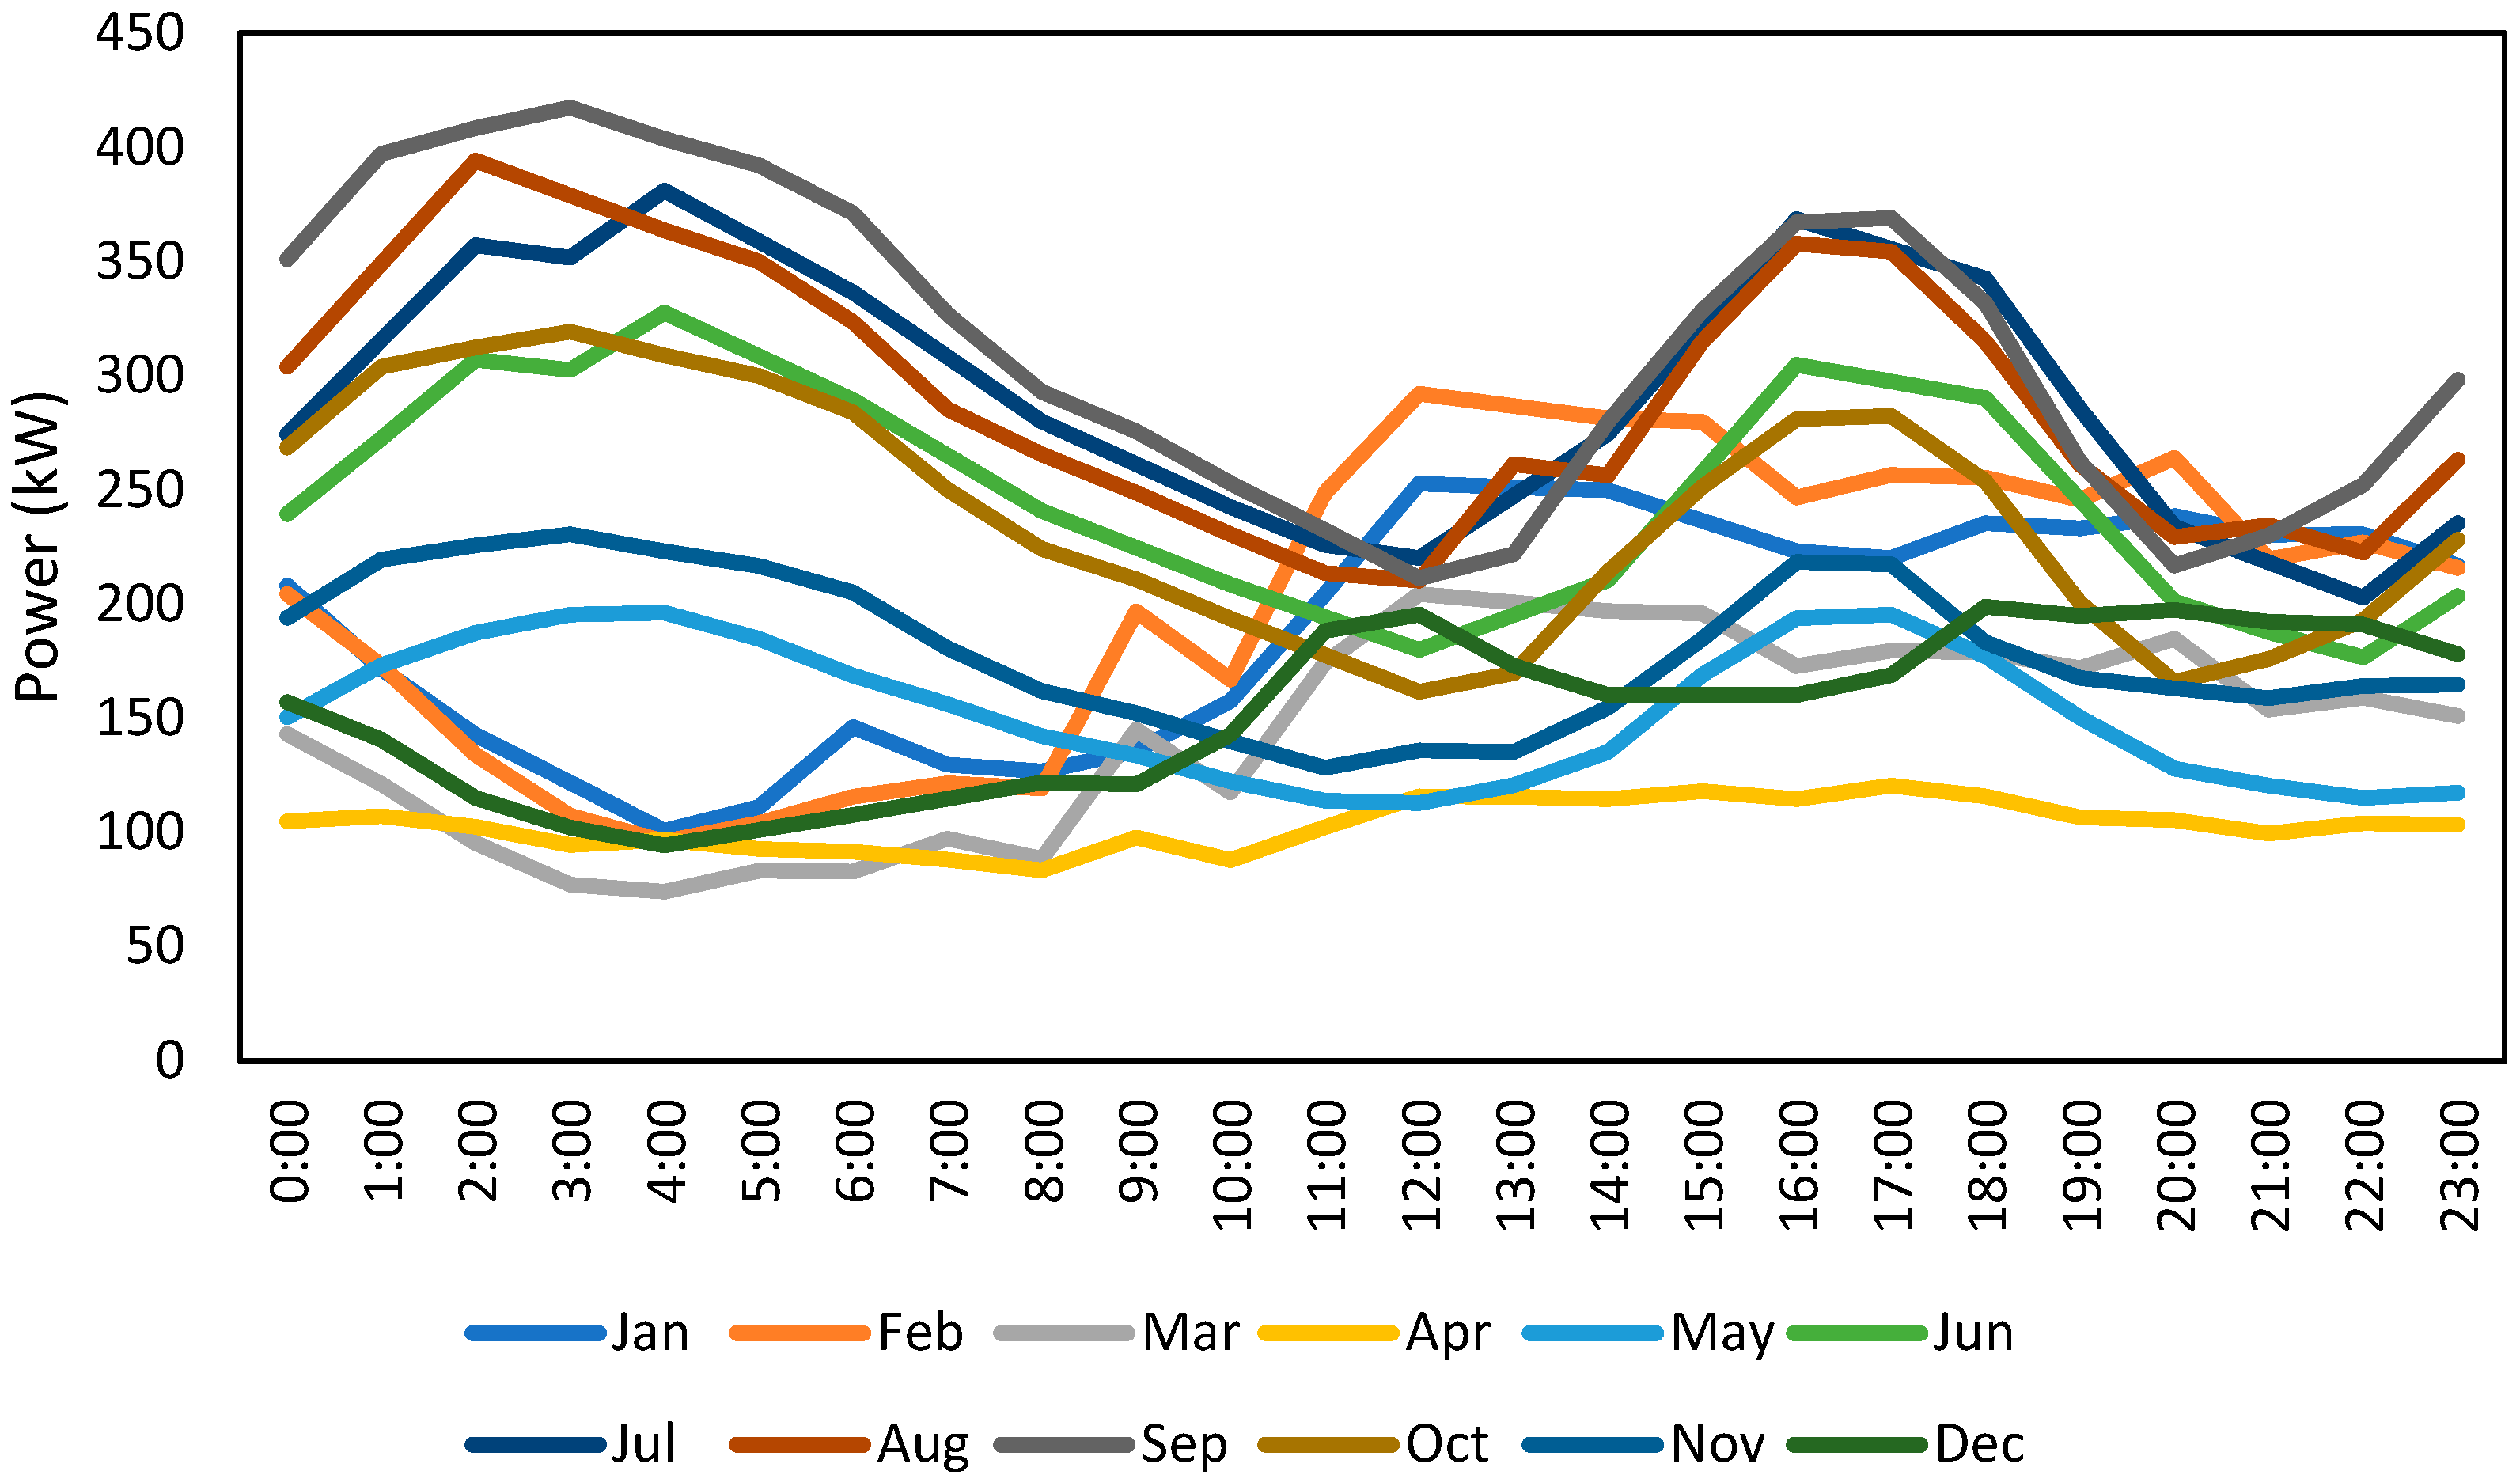
to be 5.485 kWh/hour-day. The data analysis in the previous section showed the stochastic behaviour of the load demand, as shown in Figure 9. Therefore, the size of the PV system was investigated in this work based on a different level of demand by using Equation (2), as follows:
  • Scenario 1: The monthly average load demand;
  • Scenario 2: 1.5 of the monthly average load demand to cover maximum days of demand as presented in the previous section;
  • Scenario 3: The average of the highest daily power consumption in the month over a year, as shown in Table 3.
A computational model called photovoltaic yield simulation [27] was used to calculate the PV out generation (kWh) on monthly bases for the different PV system scenarios, as presented in Table 4. The results in 
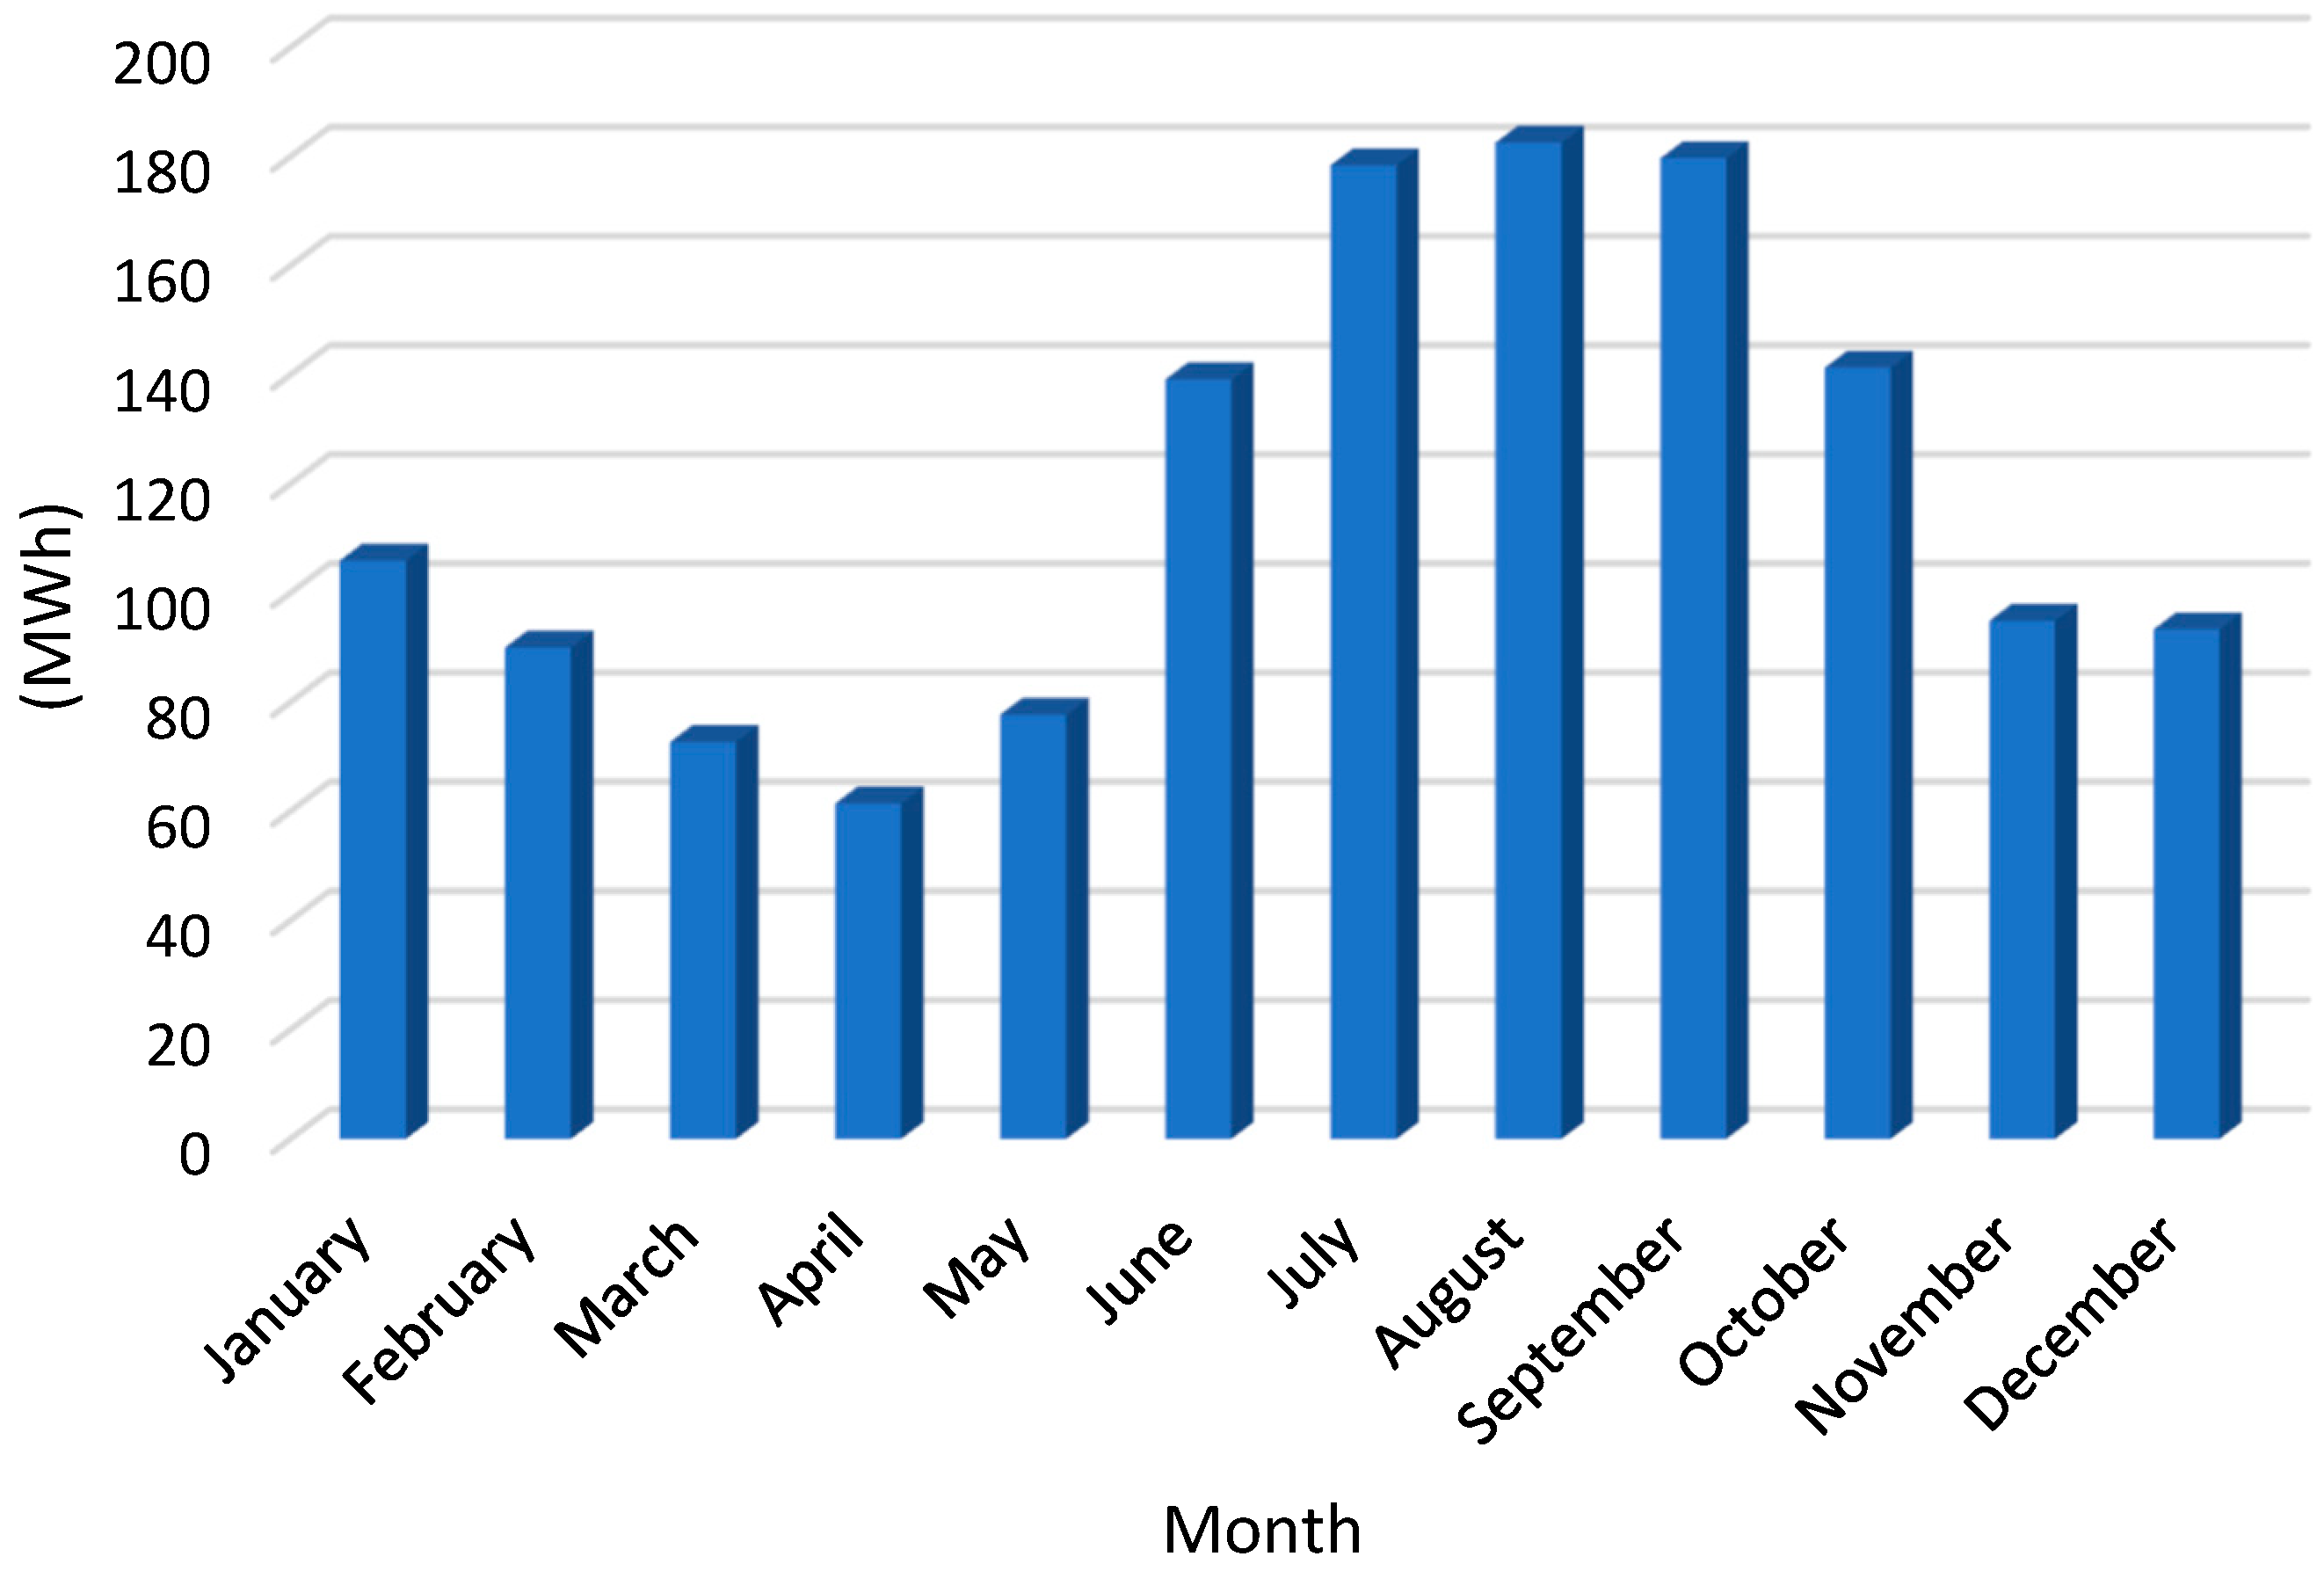
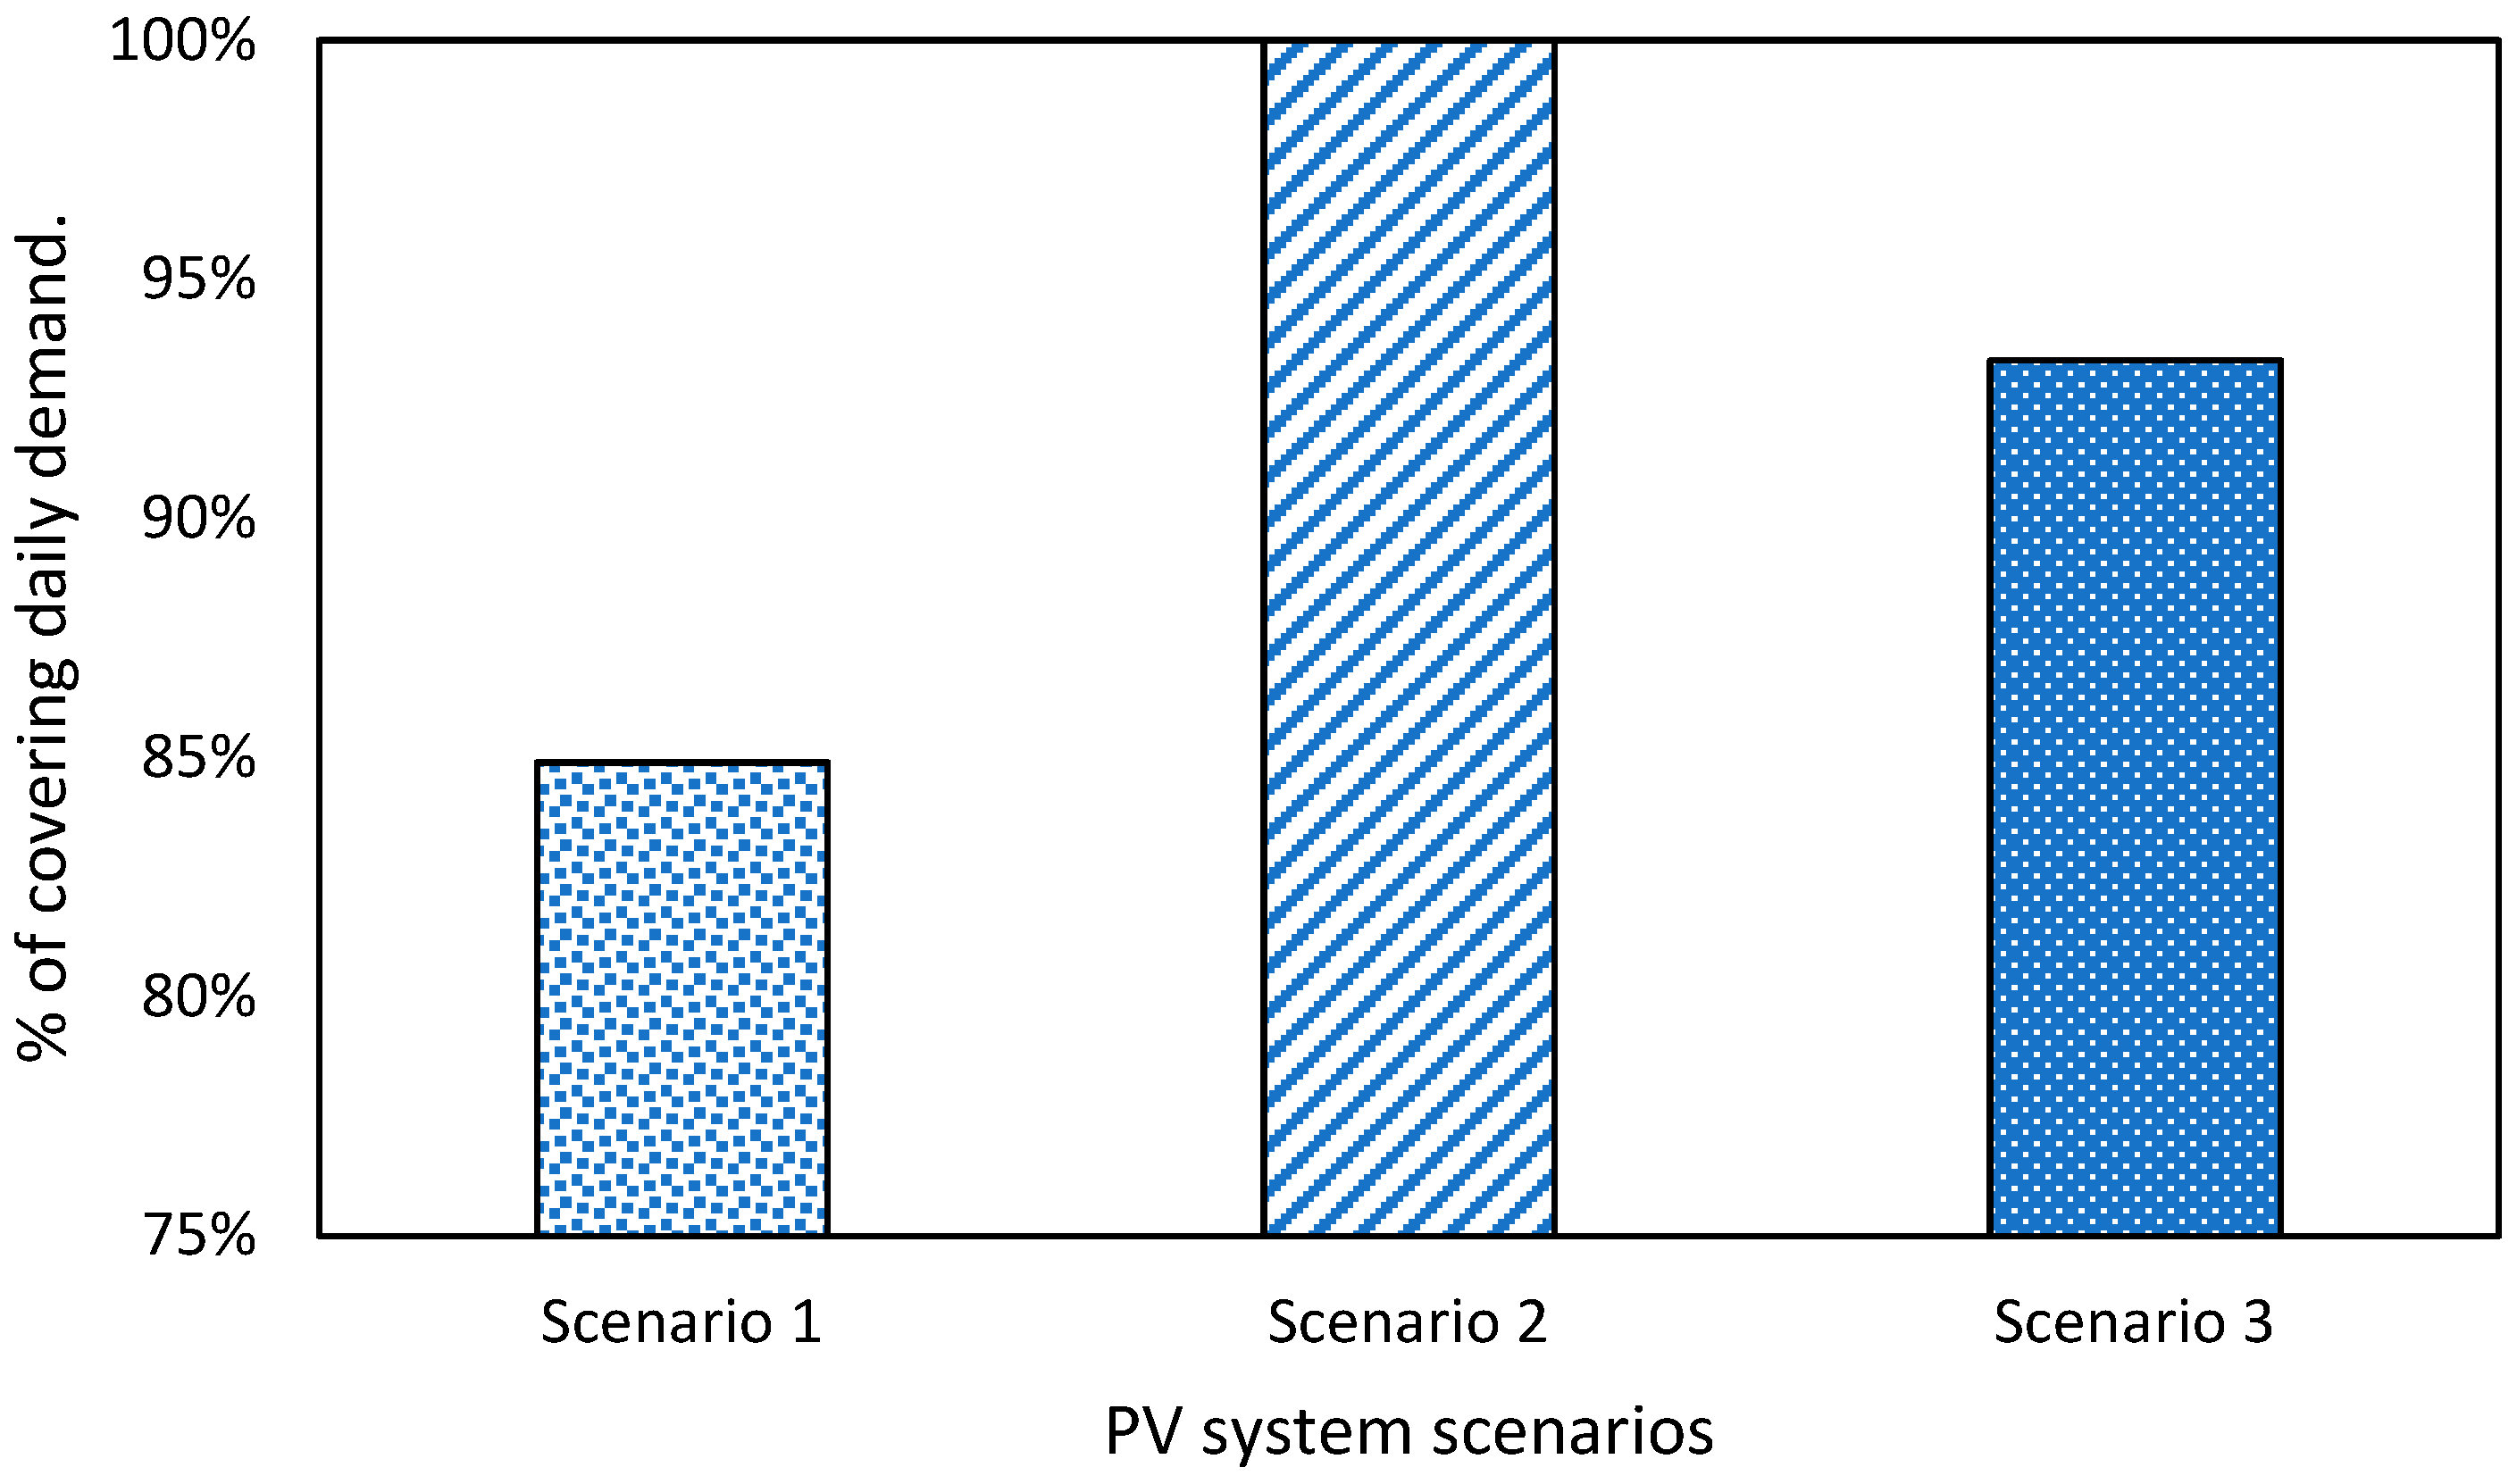
Table 4 show that the three PV system scenarios provided the required electrical energy over the year as yearly power generation and load demand consumption. However, in terms of monthly load demand consumptions, the PV system (scenario 1) was not able to cover it 100% compared to scenarios 2 and 3. Table 4 presents the percentage of coverage for the total daily demand by the PV power generation over a year. For example, the total load demand in December was approximately 93 MWh which was not able to be achieved by the generation of the PV system (scenario 1) with 89 MWh. In terms of daily load demand consumptions, the PV system was able to cover the required load demand by 52.3%, 95.61%, and 80.72% for scenarios 1, 2, and 3, respectively. Therefore, there is significant potential for covering the required daily demand by developing an optimal energy management system including an ESS.

2.3. Sizing of ESS

ESS is introduced into the power network, as described in Equation (1), as a solution to guarantee to cover the load demand and match between PV power supply and demand. In this article, the power network was developed based on an isolated network scenario; therefore, ESS (lithium-ion battery) was used for the intermittency of a 100% PV system. 
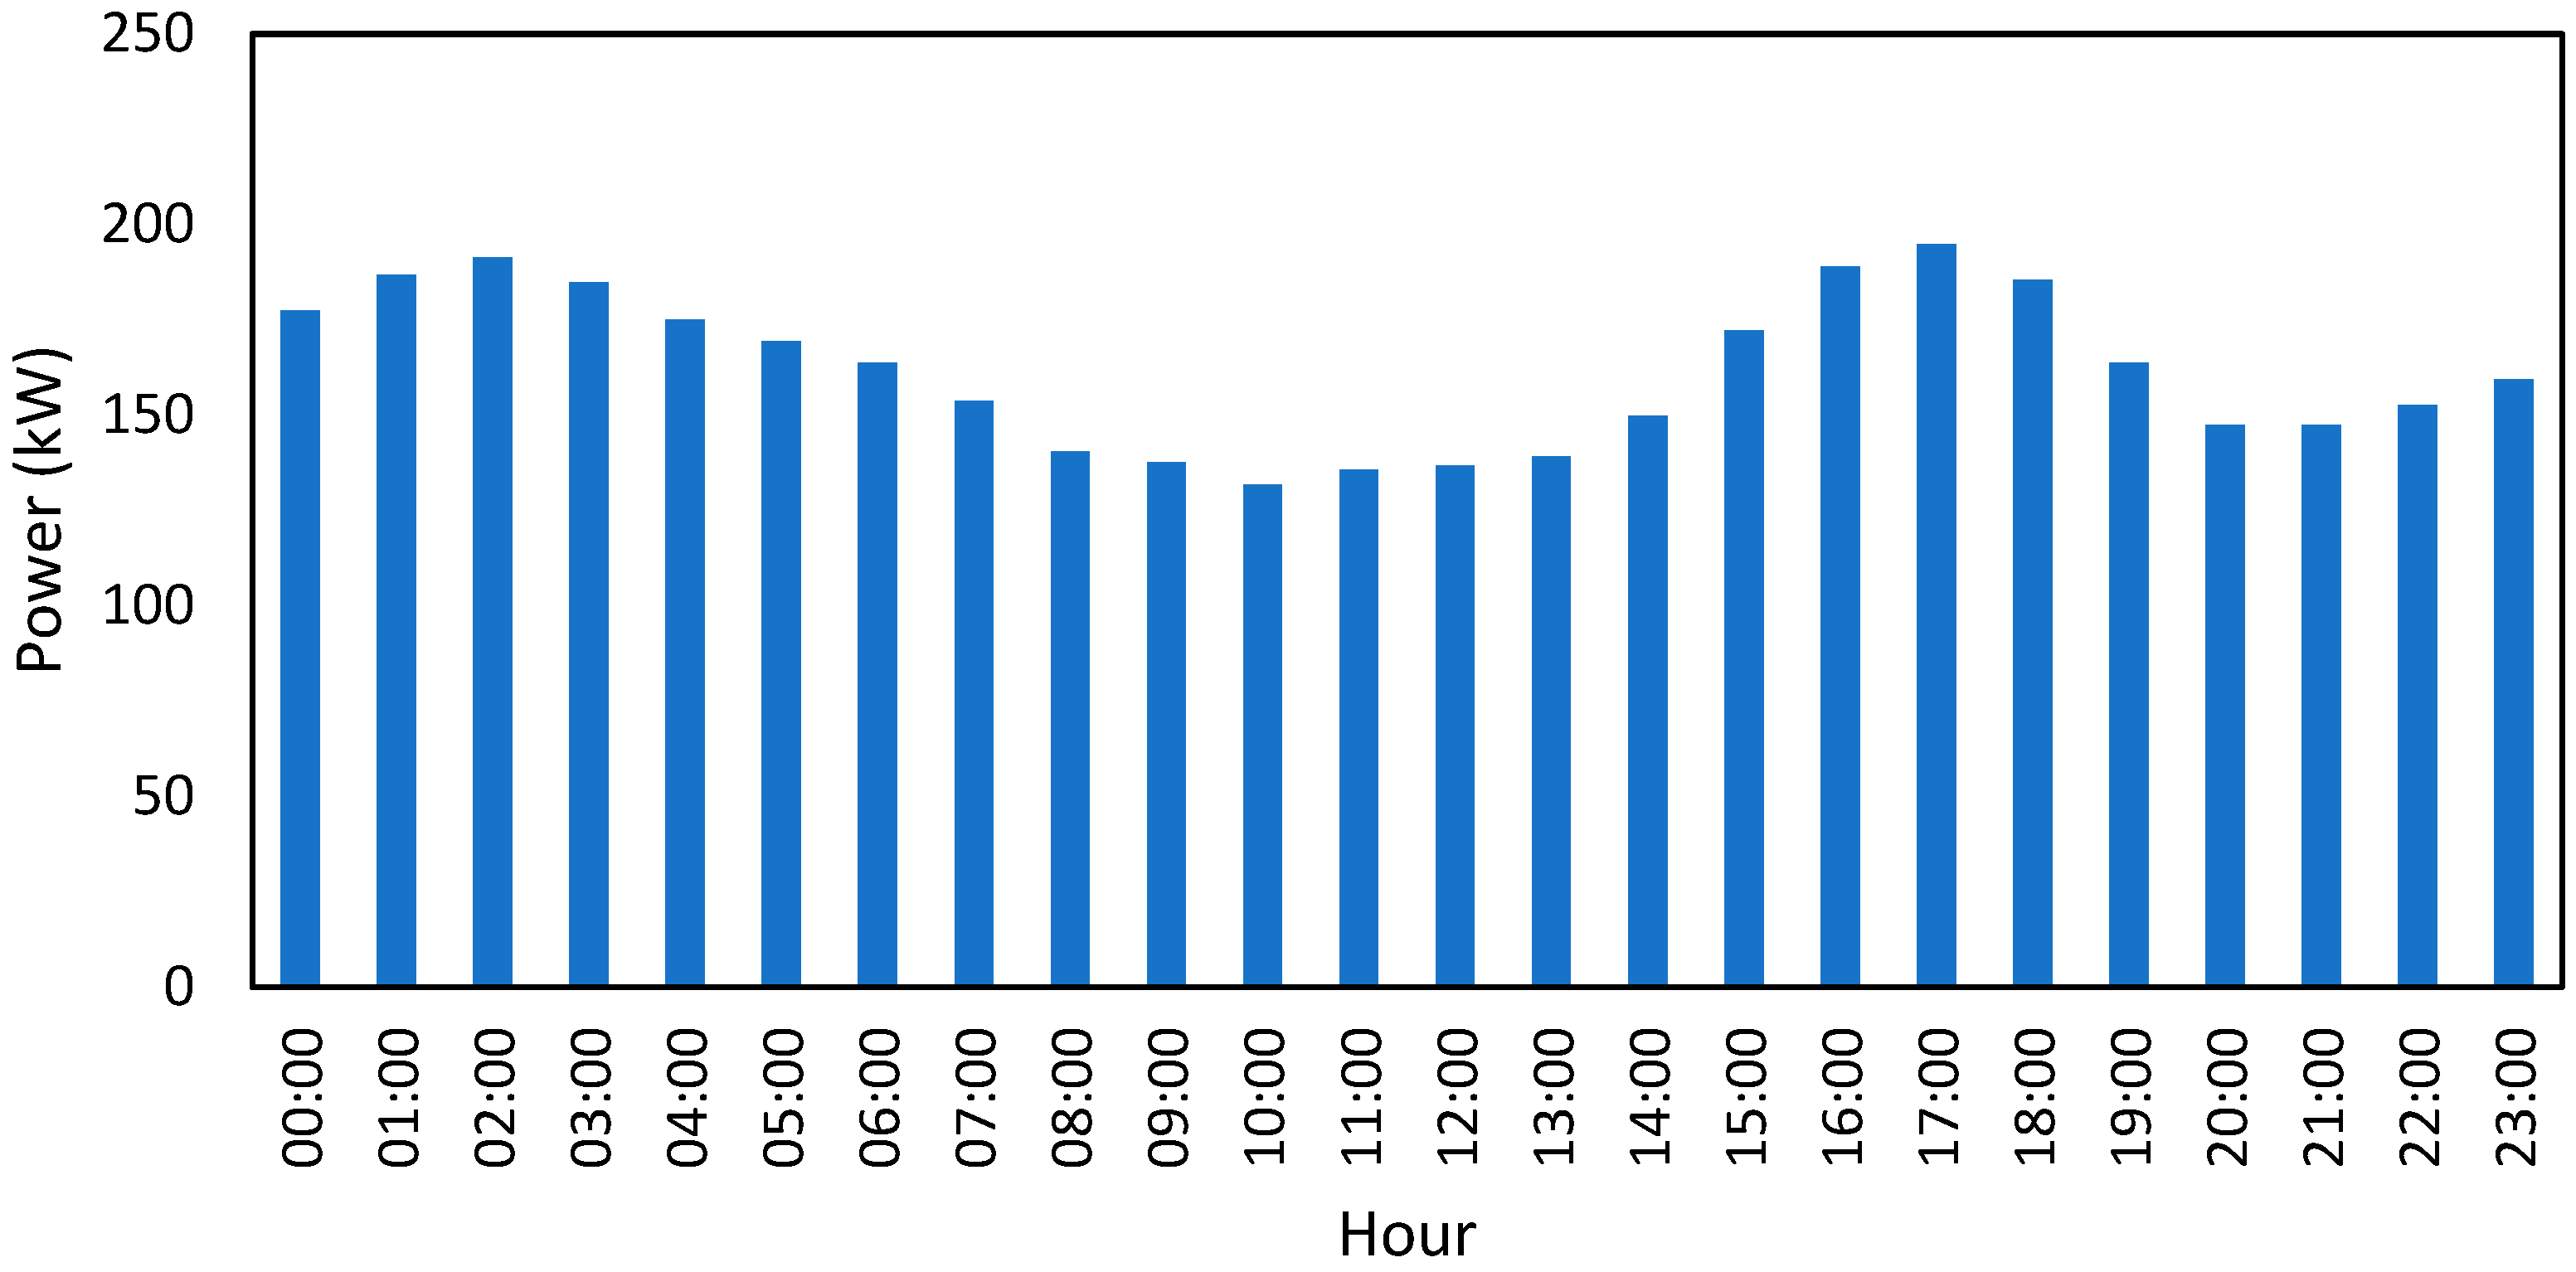
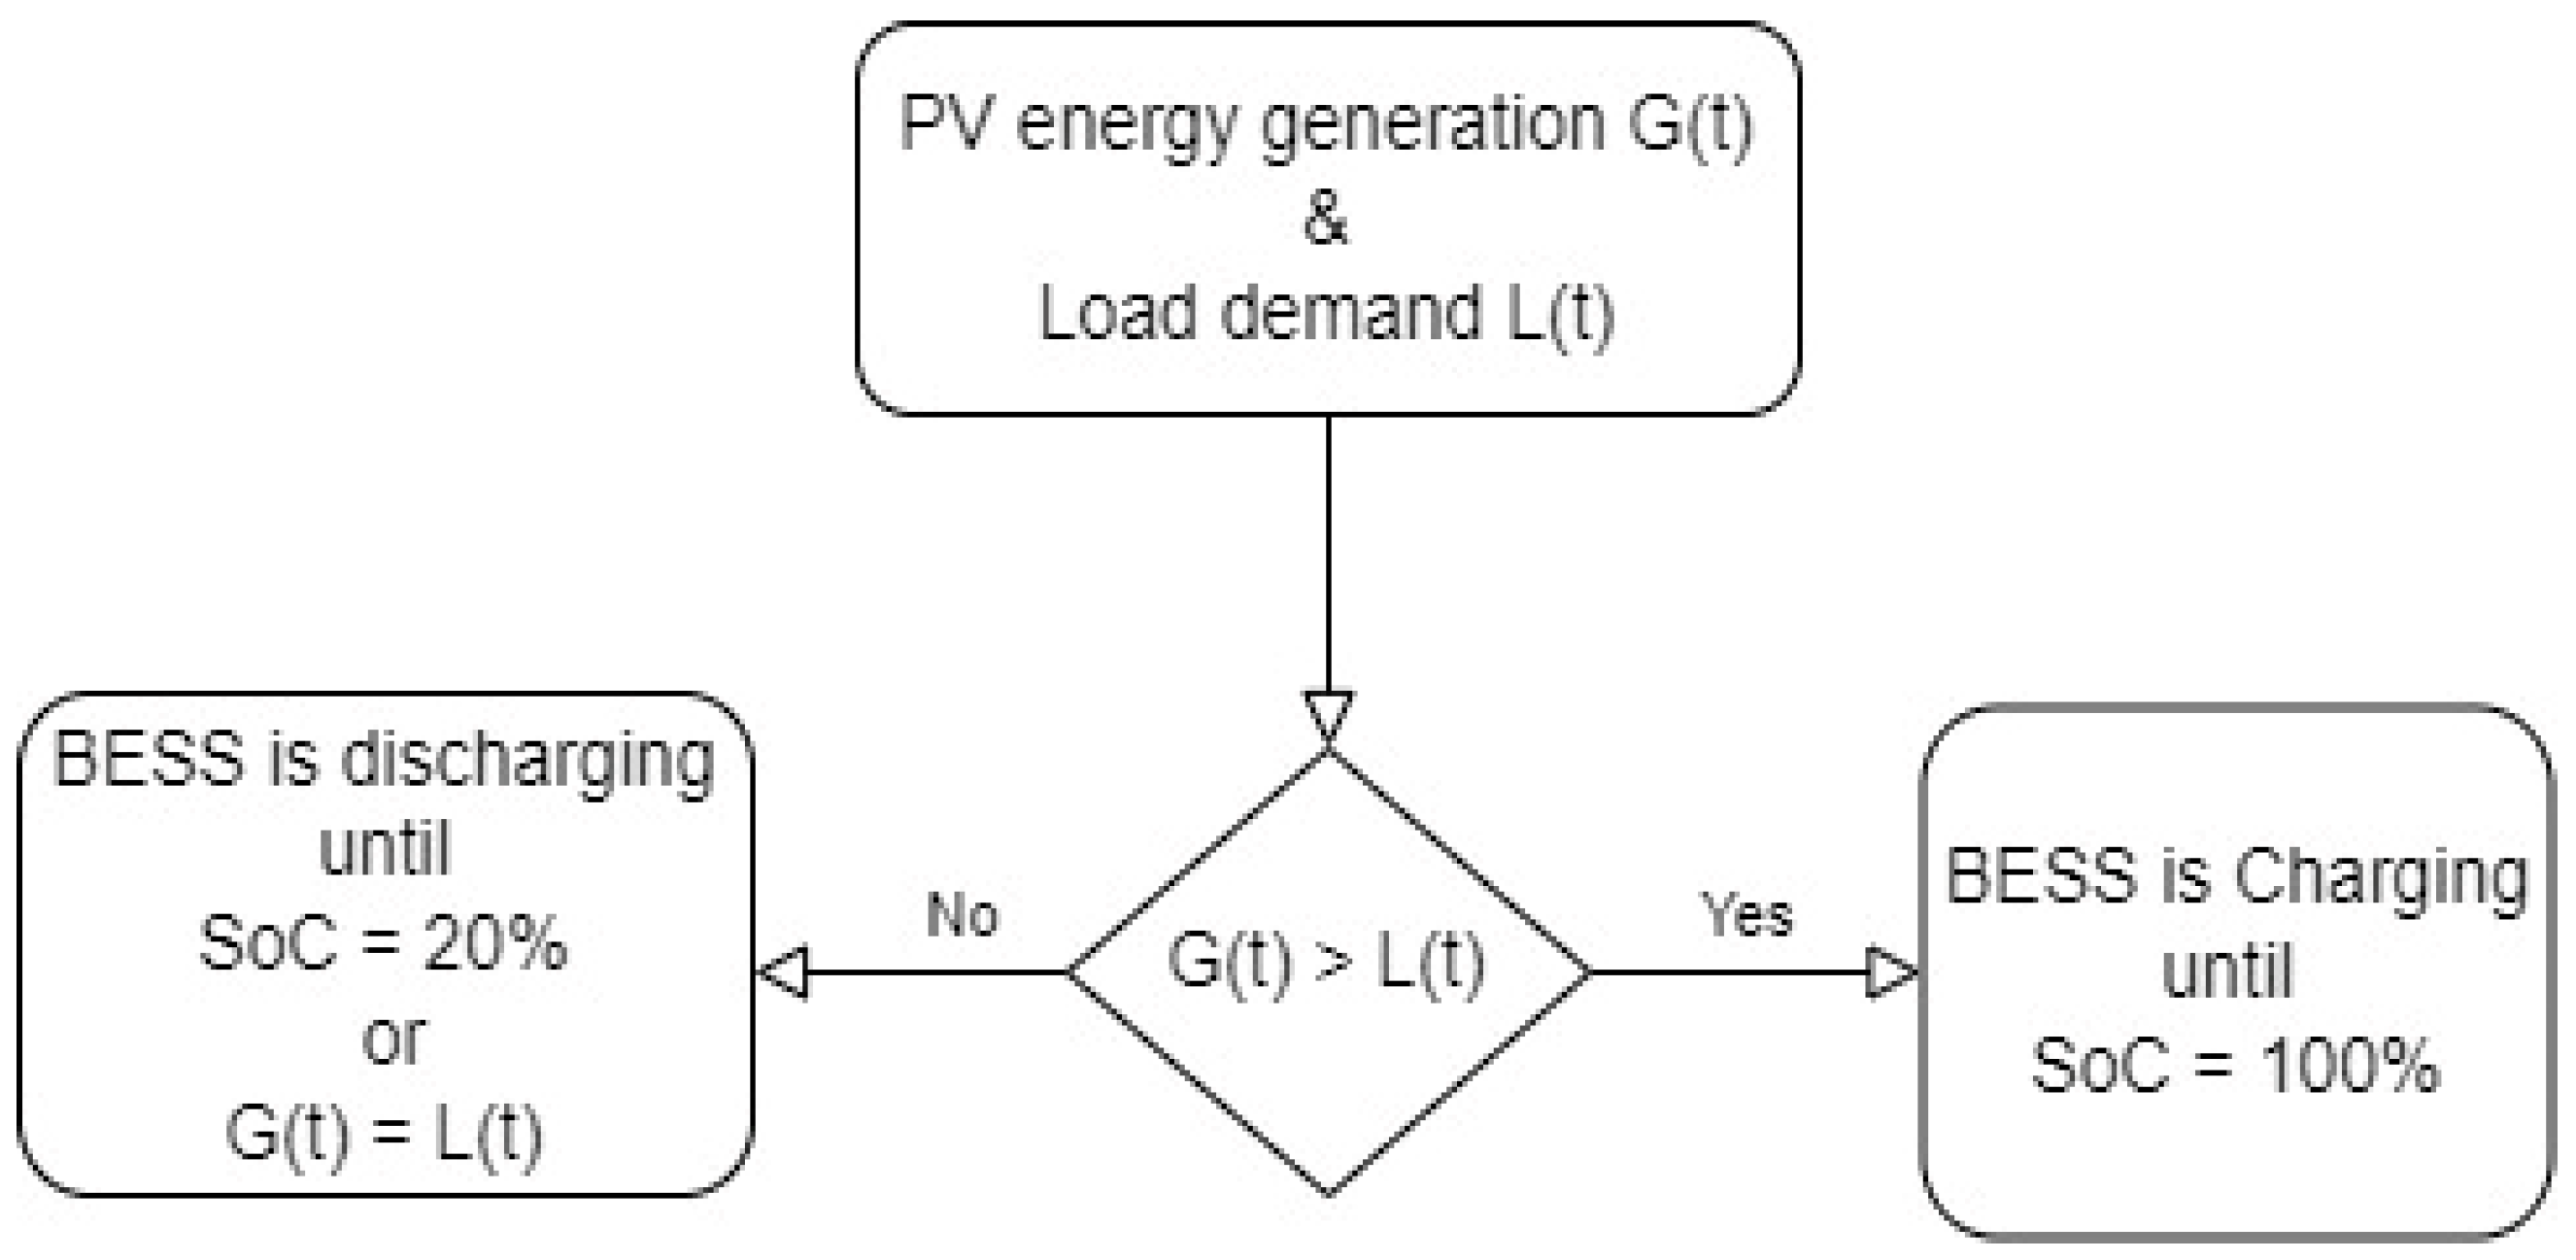
Figure 13 introduces a basic flow chart for the operation of the power network with ESS. To determine the size of the EES, techno-economic analysis needs to be performed, usually under different defined assumptions. Firstly, the background of the case study needs to be identified such as load profile scenarios, the PV generation size, and profiles and the sun irradiation profile. The required background has been presented and discussed in Section 2.1 and 
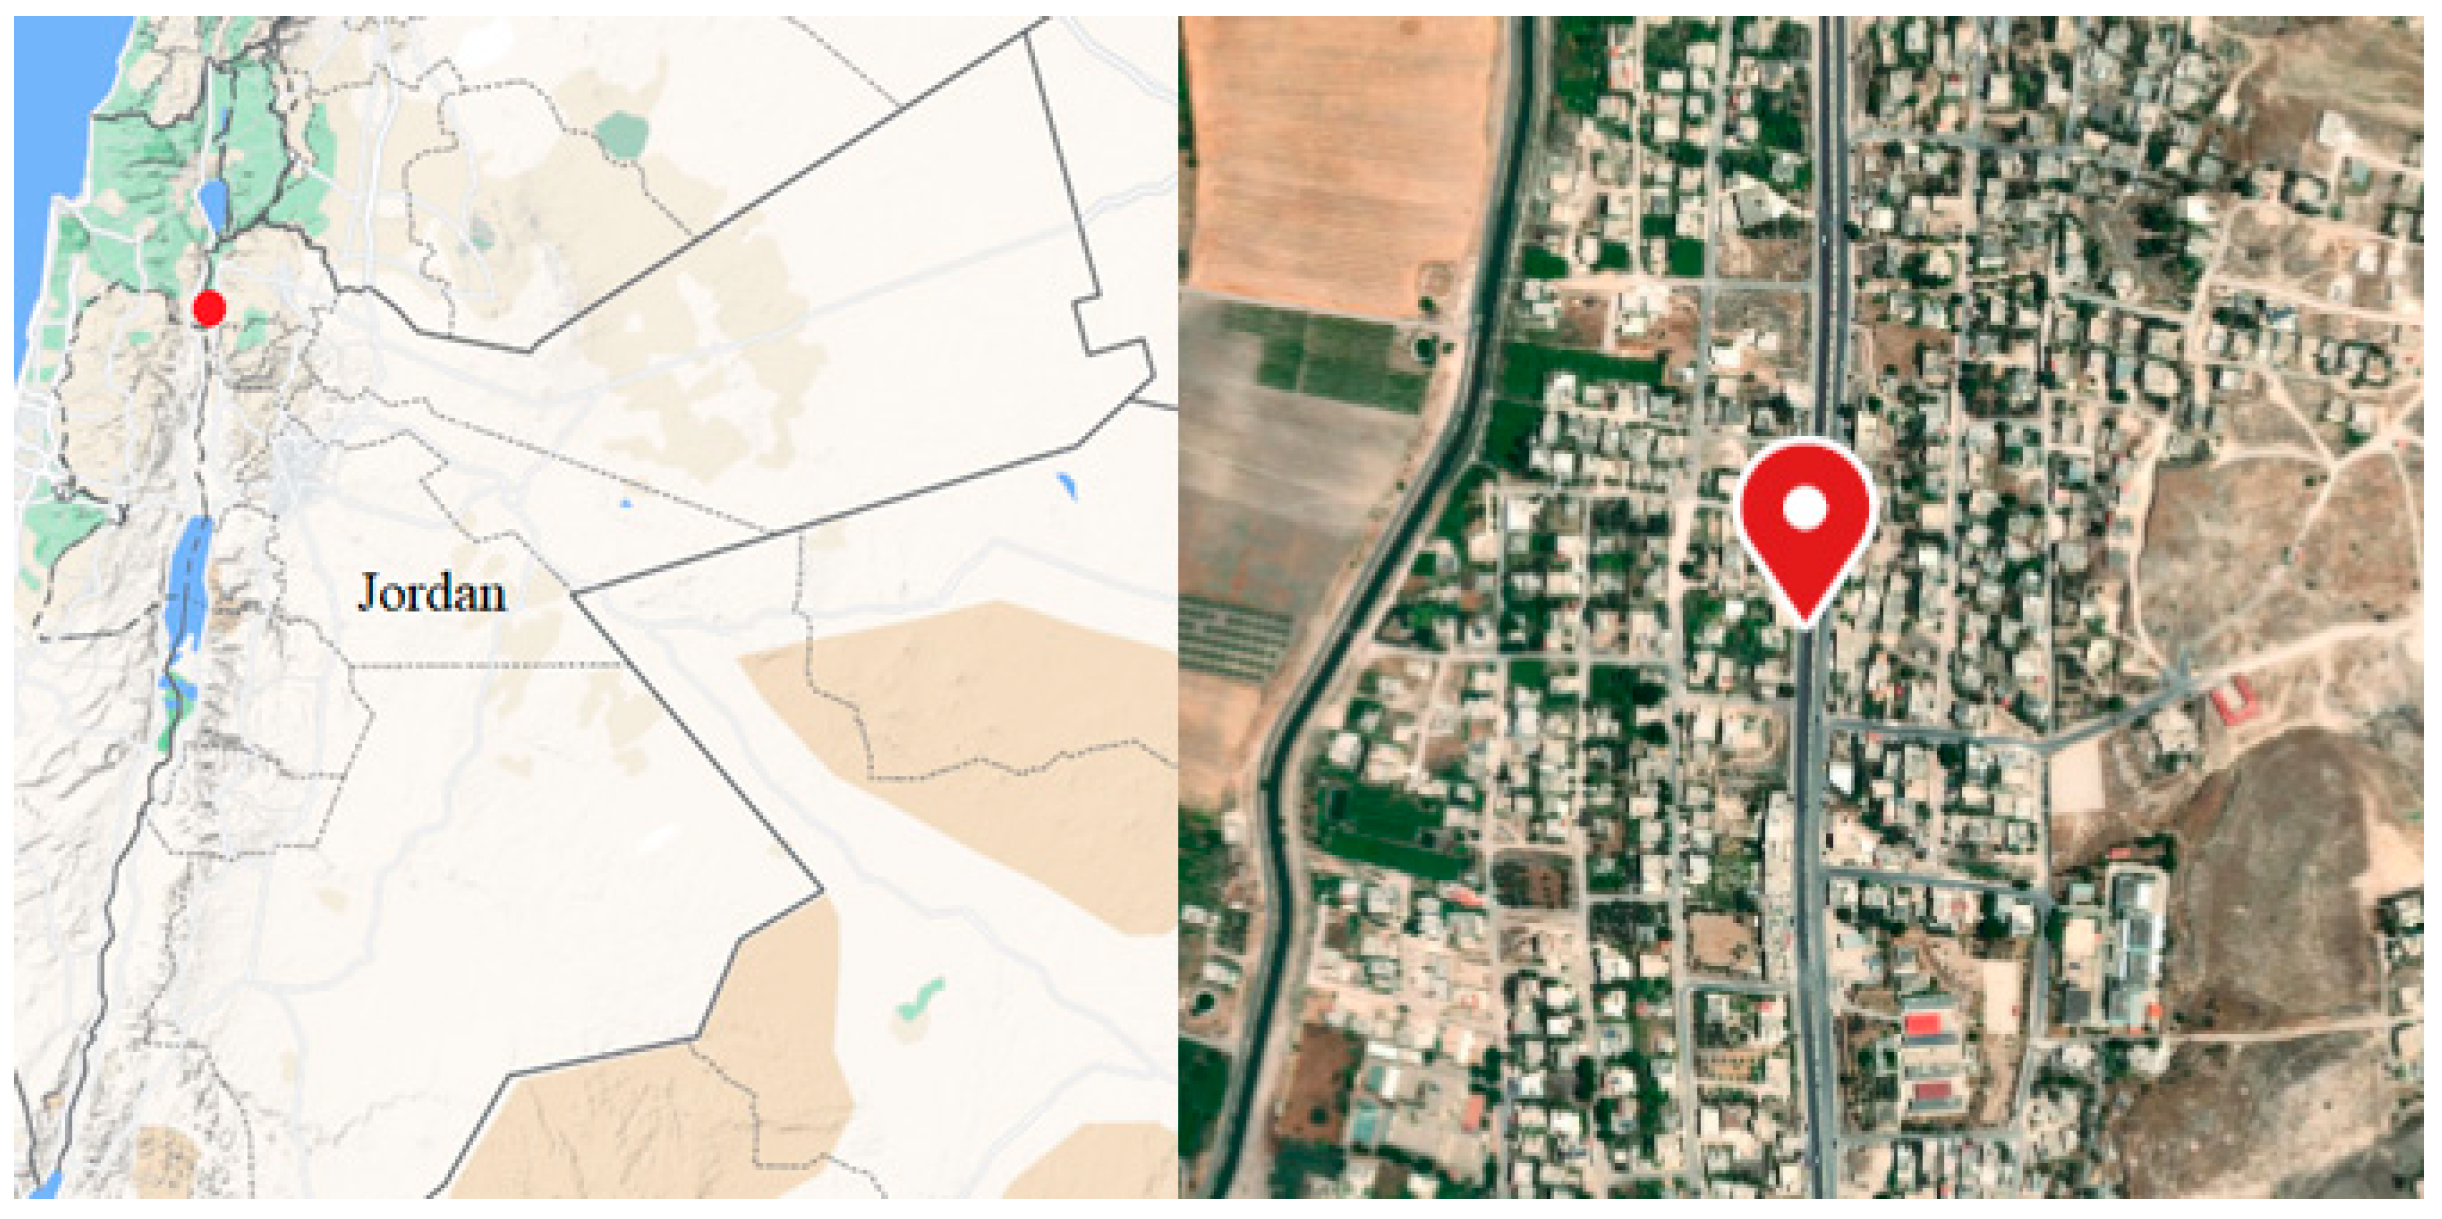
Section 2.2. The load demand refers to Al-Mashari’e town in Irbid with a mean hourly power of 164 kW, while the peak power reached 420 Kw and the total energy demand over a year was 1417.5 MWh. The PV plant was investigated in the previous section with three scenarios to match PV power supply and demand. Scenario 2 with a peak power equal to 1363.02 kWp covered the town demand for 95.61% of the days in the year. The total energy production from the PV plant (scenario 2) was 2202.6 MWh. Furthermore, Table 5 presents the monthly energy consumption during the night period with an average of 72.9 MWh/monthly and 2.4 MWh/day. The maximum monthly demand during nights was during August with 115.2 MWh.
With regard to the ESS (lithium-ion battery) specification and re-electrification performance [25,28], the inverter efficiency is set to 85% and the charge/discharge efficiency is 90%. Then, the minimum and maximum State of Charge (SoC) is set to be equal to 20% and 100%, respectively [25,28]. In this work, the main task of the ESS was to help the PV system match the demand during the night and autonomy days (when the PV generation was less than the load demand), as shown in Figure 13. In addition, this control process for the BESS is called the set-point control model.
Based on the previous analysis, Equation (3) is used to determine the size of the battery system [6,25]:
BESS = L daily   D atu DoD   η inv   η dis   f
where the BESS is the size of the battery storage system in kWh, D atu is the days of Autonomy (2 day), L daily is average daily demand during the night period in kWh/day, DoD is the depth of discharge, η inv is the efficiency of the inverter, η dis is the charge/discharge efficiency, and f is a safety factor. Furthermore, the size of the energy storage system will depend on the role of this storage such as frequency controlling or peak shaving. The ESS size was chosen to cover the daily demand based on the kWh term by using Equation (3), as presented in [6,25]. The size of the BESS and main specification are summarized in Table 6 from the literature [6,25]. There are also different factors that can affect the size of the ESS such as the location of the ESS in the network.
The location of the energy storage system in the microgrid also has a direct impact on the size and performance of the storage model [29,30]. In general, the location of the energy storage system on the network depends on the role of this storage. For example, a central energy storage system located on the distribution substation to cover the town demand will help to reduce the total peak and cover the total demand of the town and control it in total. In addition, the central energy storage will support the substation to mitigate the operational constraints and reduce the thermal and voltage problems at the substation in this zone [25,28]. In another scenario, the energy storage system can be divided into smaller sizes and located near the load or on the distribution feeders, as distributed energy storage system. In this scenario, the distributed energy storage system will help to reduce the peak, control the demand, and minimize thermal and voltage problems on the cables at the end of the feeder. However, the distributed energy storage system will have a limited impact on controlling the total demand or reducing the thermal problem at the substation [25]. Therefore, the location of the energy storage system depends on the role of the storage in the network. In this work, the covering of total demand and cost-saving performance were considered which led to the central storage system being located at the substation. A comparison analysis for the central and distributed energy storage system will be discussed in Section 3.
In addition, the effective controlling of the energy storage system, demand response (DR), and the dynamic thermal rating (DTR) system will help to improve the network performance [30,31]. The controlling of the energy storage system and DR aim to cover the load demand and reduce peaks and blackouts [25,31]. The DTR is mainly used to enhance the capacity of the power lines and mitigate the thermal constraints of the power lines by considering the advantages of the variability of power line rating based on the fluctuations of the weather conditions [30,31]. Therefore, the DTR can help to improve the performance of the power network and minimize the size of the required ESS [31]. In this work, the thermal rating for the power lines (voltage and current) has not been studied; the controlling of ESS is the main technique used to improve the network performance and the focus is on covering the total demand and energy cost-saving performance.

2.4. Optimization Operation Method for the BESS

The power sources, the PV plant, and the BESS feed the required load demand consumption to cover 100% of the power network demand, as shown in Figure 1. Let L, as described in Equation (4), be the hourly load demand of the network over more than one day (two days):
L = ( L ( 1 ) , , L ( t ) , , L ( 24 )   ) T 24
The basic operation of the BESS is presented in the previous section as shown in Figure 13. In this section, an optimal BESS controller is introduced and developed to achieve the optimal operation plan for the BESS over a day. The objective is to minimize the function, d l (t), which is described as the status of not covering 100% of load demand by PV and BESS over the day.
d l   ( t ) = ( G ( t ) + E ( t ) )
The BESS model presented in this section has been introduced by the authors of [25]. The BESS model works under a number of constraints, as presented by Equations (6) and (7). In general, The SoC at the time step t is SoC ( t ) is required to be within the minimum and maximum SoC value, SoC min , and SoC max , respectively, and the charging/discharging energy E(t) restricted to lower and upper limits ( E min , E max ). The SoC ( t )   shows the stored energy in the BESS which depends on the previous status of the BESS, SoC ( t 1 ) , E(t), and the efficiency of the BESS, η ˜ , [25,28] as follows:
SoC ( t ) = SoC ( t 1 ) + η ˜ . E ( t )
SoC min   SoC ( t )     SoC max E min   E ( t )   E max } ,   t .
The energy flow problem is formulated in Equation (5); the BESS control loop is introduced in Figure 2. As stated in Section 1, optimally controlling the BESS normally shows significant increases in the reliability of the power system. Therefore, new metaheuristic optimization algorithms (GROM and PSO) have been used in this paper to improve the economic and energy performance of 100% PV and ESS systems for microgrids by solving the optimization problem in Equation (5). The optimal BESS controller based on GROM and PSO will aim to find the optimal operation plan of the BESS. Here, the E ( t ) is the charging or discharging energy for the BESS at time t and to describe the BESS plan or operation sequence over a day, the E   = ( E ( 1 ) , ,   E ( t ) , ,   E ( 24 ) ) T 24 .

3. Results

The proposed optimal BESS controller in this work was applied to a power network equipped with a BESS, as described in Table 6, and a PV system based on three different scenarios, as described in Table 4. The optimal BESS controllers based on GROM and PSO were modelled in Matlab (R2016b, The MathWorks, Inc., Natick, MA, USA). In this section, we aim to discuss and present the results from the proposed optimal BESS controllers compared to the common controller (set-point):
  • Firstly, the results of the optimal BESS controllers for the power network with the three PV system scenarios are presented;
  • Then, the impact of the optimal BESS controllers on the sizing of BESS is investigated under a specific case study;
  • Finally, the feasibility and economic results of using the BESS with different operation scenarios are presented.

3.1. Three Scenarios of PV Systems for the Isolated Power Grid

In Section 2, the size of the PV system was investigated and calculated based on three different scenarios: Scenario 1 (908.7 kWp), Scenario 2 (1363.02 kWp), and Scenario 3 (1104.1 kWp). Table 5 showed that the PV system was able to cover the required load demand, based on daily load demand consumptions, by 52.3%, 95.61%, and 80.72% for scenarios 1, 2, and 3, respectively. Therefore, the BESS, as shown in Table 6, was employed with the PV systems to cover the 100% of the load demand. Figure 14 shows that the BESS covered the night demand and increased the percentage of covering daily demand for the three PV system scenarios. For example, Scenario 2 achieved 100% while the percentage of coverage increased by 62.3% and 15.6% for Scenario 1 and Scenario 3, respectively.
To improve the performance of BESS, the proposed optimal BESS controllers based on GROM [24] and PSO [23] were used. Table 7 shows that the optimal controllers for BESS significantly improved the percentage of covering daily demand. For example, the GROM and PSO algorithms increased the percentage of covering in Scenario 1 by 5.4% and 4.3%, respectively, compared to the set-point controller. This means that the PV systems (Scenario 1 and 3) can be relied upon to cover 100% of load demand by using load scheduling and shaving algorithms. This will help to decrease the cost of the PV system and the land requirement.

3.2. Sizing of BESS

This section aims to investigate the impact of the optimal BESS controllers on the sizing of BESS under the different sizes of BESS. In Section 2, the size of the BESS system has been investigated by using three different cases:
  • Case 1: The calculated size of BESS (9535.725 kWh) is presented in Section 2.3 and Table 6;
  • Case 2: 80% of the calculated size of BESS (7628.580 kWh);
  • Case 3: 60% of the calculated size of BESS (5721.435 kWh).
As shown in Figure 15, the BESS (Case 1) covered 100% of the load demand without any hours that the power went off. With the calculated size of BESS (9535.725 kWh), Case 2 achieved 100% cover of the demand over a year while Case 2 and 3 had 30 and 81 h where the power was off, respectively.
In order to reduce the number of hours for the power sources (PV and BESS) that were not able to cover the load demand, the proposed optimal BESS controllers were used for the performance of BESS. Table 8 presents the optimal controllers for BESS which showed a significant solution to improve the percentage of covering daily demand. For example, the GROM and PSO algorithms reduced the number of hours with power off in Scenario 3 by 39.5% and 35.8%, respectively, compared to the set-point controller. This means that the BESS (Case 2 and 3) can be relied upon to cover 100% of load demand by using load scheduling and shaving algorithms. This will also help to decrease the capital cost of BESS.

3.3. Economic Results

This section aims to introduce the economic implications of the proposed system by presenting a primary economic analysis. This economic investigation aims to show the commercial benefits of the BESS and PV system for 100% covering the load demand. BESS such as lithium-ion batteries has been used in different power network applications [25,28]. In general, BESS has a medium power density level and high energy density with a low self-discharge rate; therefore, BESS is suitable for power network applications which need slow gains of energy (in hours). In this work, the major capital cost of BESS and PV systems are presented in Table 9 based on the required PV and BESS specifications in Table 4 and Table 6. The capital costs for the PV and BESS have been obtained from [28,32], which provide the recent prices of the PV and BESS.
In this work, the presented power network aimed to cover 100% load demand of the network. The electricity energy tariff in Jordan is 211 USD/MWh. According to the data provided by Electrical Distribution Power Company in Jordan, the annual electricity energy cost is around USD 299,469. Table 10 presents an economic analysis of the BESS case studies. The economic viability analysis introduces the Net Present Value (NPV), Internal Rate of Return (IRR) and payback period for the BESS case studies. The results indicated that the three options of BESS are potentially economically profitable with a payback period of 11 years or less. In addition, the three options recorded positive NPV values and an IRR greater than 3% which are usually used in energy projects.

3.4. ESS Location Results

In this section, a comparison of the central energy storage system (Case 1) and the distributed energy storage system at the end of three feeders is presented in Table 11 in terms of the percentage of covering daily demand for the different optimal BESS controllers. In this section, a central PV system with a 908.7 kWp size (Scenario 2) was used for both types of energy storage. The GROM outperformed the other controllers for both of the ESS location scenarios. The percentage of covering daily demand shows that the GROM improved the performance by achieving 89.5% and 84.4% for the central and distrusted location scenarios, respectively. The distributed ESS scenario achieved a reasonable demand covering but was lower than the central ESS scenario. This is mainly related to the power loss between the PV and the distributed ESS and the demand behaviour at feeders.

4. Conclusions and Discussion

In general, developing countries such as Jordan rely heavily on importing the main energy sources to cover their needs. Therefore, the movement toward a sustainable energy sector based on renewable energy systems such as Photovoltaic (PV) is important. The cost-efficient and optimal structure of a 100% RES system with high-reliability performance in microgrids at Jordan was the main goal of this article. This work provides one of the first extensive investigations into the load demand and PV power generations of rural areas in Jordan. This investigation designed an optimal 100% PV and ESS system for rural areas in Jordan. Metaheuristic optimization algorithms were developed and employed in different areas such as power flow problems to improve the performance of solving challenging engineering problems. In this paper, metaheuristic optimization algorithms, namely: GROM and PSO algorithms, were employed to find the optimal configurations and integrated 100% PV and ESS for a microgrid. For example, the GROM and PSO algorithms reduced the number of hours with power off in Scenario 3 by 39.5% and 35.8%, respectively, compared to the set-point controller. In terms of the ESS location, a comparison between the central and distributed energy storage systems was presented for the different optimal BESS controllers. The central ESS scenario achieved a higher performance compared to a distributed storage system in terms of demand covering. This is mainly related to the stochastic demand behaviour and the power loss between the PV and the distributed ESS. In addition, the GROM outperformed the other controllers for both of the ESS location scenarios by achieving daily demand covering equal to 89.5% and 85.4% for central and distributed ESS, respectively. The analysis of the results indicated that to achieve and implement a 100% renewable energy system for a microgrid system (small town demand), the following points are recommended:
  • The size of the PV system depends on different factors such as the scale of the project (small, medium, or large scale) and location. The size of PV is usually calculated based on the monthly average of the demand. However, the results showed that is recommended to take safety factors and increase the size of PV to cover the seasonal and night peaks for a 100% renewable network model;
  • The type and size of ESS selected based on the main role of the ESS in the network. In this work, the ESS was used to cover 100% of the demand with the PV. Therefore, the size was calculated based on the maximum peak and demand during the night and based on the PV generation. However, the results showed that it can be relied upon to minimize the size of ESS and cover 100% of load demand by using load scheduling and shaving algorithms;
  • It is important to develop and implement an effective controller for the ESS to improve the network performance. The results showed that the optimal controller can help to cover the load demand and reduce peaks and blackouts.

Author Contributions

Conceptualization, F.A., M.S. and A.S.; methodology, F.A., M.S. and A.S.; software, F.A., K.N. and N.E.-N.; validation, F.A., K.N. and N.E.-N.; formal analysis, F.A., W.H. and K.N.; investigation, F.A., M.S. and A.S.; resources, all authors; data curation, all authors; writing—original draft preparation, F.A., M.S. and A.S.; writing—review and editing, all authors; visualization, all authors; supervision, all authors; project administration, F.A. All authors have read and agreed to the published version of the manuscript.

Funding

The publication of this article was funded by University of Salford Library.

Institutional Review Board Statement

Not applicable.

Informed Consent Statement

Not applicable.

Data Availability Statement

Not applicable.

Acknowledgments

We would like to thank the Renewable Energy Center at The Hashemite University for their support.

Conflicts of Interest

The authors declare no conflict of interest.

Nomenclature

PVPhotovoltaic Z P V Size of PV
ESSEnergy Storage System E d a i l y Average daily demand
GROMGolden Ratio Optimization Method S d a i l y Direct sunlight (hours)
PSOParticle Swarm Optimization η p v PV system efficiency
G(t)Main energy source BESS Size of the battery
E(t)Energy of ESS L d a i l y Average daily-night demand
L(t)Load demand D a t u the days of Autonomy
tTime t D o D Depth of discharge
EDCOElectrical Distribution Co η inv Efficiency of inverter
GHIGlobal horizontal irradiation η dis Charge/discharge efficiency
DNIDirect normal irradiation f Safety factor
DIFDiffuse horizontal irradiation ITHD l i m ITHD limitation
DEDifferential Evolution L load demand
GTIGlobal tilted irradiation at optimal angle SoC State of Charge
SoC min Minimum SoC SoC max Maximum SoC
NPVNet Present ValueIRRInternal Rate of Return

References

  1. Alasali, F.; Nusair, K.; Obeidat, A.; Fiudeh, H.; Holderbaum, W. An analysis of optimal power flow strategies for a power network incorporating stochastic renewable energy resources. Int. Trans. Electr. Energy Syst. 2021, 31, e13060. [Google Scholar] [CrossRef]
  2. Al-Ghussain, L.; Abujubbeh, M.; Darwish Ahmad, A.; Abubaker, A.M.; Taylan, O.; Fahrioglu, M.; Akafuah, N.K. 100% Renewable Energy Grid for Rural Electrification of Remote Areas: A Case Study in Jordan. Energies 2020, 13, 4908. [Google Scholar] [CrossRef]
  3. Alasali, F.; Nusair, K.; Alhmoud, L.; Zarour, E. Impact of the COVID-19 Pandemic on Electricity Demand and Load Forecasting. Sustainability 2021, 13, 1435. [Google Scholar] [CrossRef]
  4. Pierie, F.; Van Someren, C.E.J.; Kruse, S.N.M.; Laugs, G.A.H.; Benders, R.M.J.; Moll, H.C. Local Balancing of the Electricity Grid in a Renewable Municipality; Analyzing the Effectiveness and Cost of Decentralized Load Balancing Looking at Multiple Combinations of Technologies. Energies 2021, 14, 4926. [Google Scholar] [CrossRef]
  5. Kaushik, E.; Prakash, V.; Mahela, O.P.; Khan, B.; El-Shahat, A.; Abdelaziz, A.Y. Comprehensive Overview of Power System Flexibility during the Scenario of High Penetration of Renewable Energy in Utility Grid. Energies 2022, 15, 516. [Google Scholar] [CrossRef]
  6. Shirzadi, N.; Nasiri, F.; Eicker, U. Optimal Configuration and Sizing of an Integrated Renewable Energy System for Isolated and Grid-Connected Microgrids: The Case of an Urban University Campus. Energies 2020, 13, 3527. [Google Scholar] [CrossRef]
  7. Marczinkowski, H.M.; Barros, L. Technical Approaches and Institutional Alignment to 100% Renewable Energy System Transition of Madeira Island—Electrification, Smart Energy and the Required Flexible Market Conditions. Energies 2020, 13, 4434. [Google Scholar] [CrossRef]
  8. Bhuiyan, F.A.; Yazdani, A.; Primak, S.L. Optimal sizing approach for islanded microgrids. IET Renew. Power Gener. 2015, 9, 166–175. [Google Scholar] [CrossRef]
  9. Chen, H.C. Optimum capacity determination of stand-alone hybrid generation system considering cost and reliability. Appl. Energy 2013, 103, 155–164. [Google Scholar] [CrossRef]
  10. Alsaidan, I.; Khodaei, A.; Gao, W. Determination of battery energy storage technology and size for standalone microgrids. In Proceedings of the 2016 IEEE Power and Energy Society General Meeting (PESGM), Boston, MA, USA, 17–21 July 2016; pp. 1–5. [Google Scholar]
  11. Al-Shetwi, A.; Sujod, M.; Tarabsheh, A.; Altawil, I. Design and Economic Evaluation of Electrification of Small Villages in Rural Area in Yemen Using Stand-Alone PV System. Int. J. Renew. Energy Res. 2016, 6, 289–298. [Google Scholar]
  12. Ibrik, I. Micro-Grid Solar Photovoltaic Systems for Rural Development and Sustainable Agriculture in Palestine. Agronomy 2020, 10, 1474. [Google Scholar] [CrossRef]
  13. Zhao, B.; Zhang, X.; Li, P.; Wang, K.; Xue, M.; Wang, C. Optimal sizing, operating strategy and operational experience of a stand-alone microgrid on Dongfushan Island. Appl. Energy 2014, 113, 1656–1666. [Google Scholar] [CrossRef]
  14. Abdulgalil, M.A.; Khalid, M.; Alismail, F. Optimal sizing of battery energy storage for a grid-connected microgrid subjected to wind uncertainties. Energies 2019, 12, 2412. [Google Scholar] [CrossRef] [Green Version]
  15. Butturi, M.A.; Lolli, F.; Sellitto, M.A.; Balugani, E.; Gamberini, R.; Rimini, B. Renewable energy in eco-industrial parks and urban-industrial symbiosis: A literature review and a conceptual synthesis. Appl. Energy 2019, 255, 113825. [Google Scholar] [CrossRef]
  16. Al Garni, H.; Kassem, A.; Awasthi, A.; Komljenovic, D.; Al-Haddad, K. A multicriteria decision making approach for evaluating renewable power generation sources in Saudi Arabia. Sustain. Energy Technol. Assess. 2016, 16, 137–150. [Google Scholar] [CrossRef]
  17. Abo-Elyousr, F.K.; Elnozahy, A. Bi-objective economic feasibility of hybrid micro-grid systems with multiple fuel options for islanded areas in Egypt. Renew. Energy 2018, 128, 37–56. [Google Scholar] [CrossRef]
  18. Tomar, V.; Tiwari, G.N. Techno-economic evaluation of grid connected PV system for households with feed in tari_ and time of day tari_ regulation in New Delhi—A sustainable approach. Renew. Sustain. Energy Rev. 2017, 70, 822–835. [Google Scholar] [CrossRef]
  19. Krishan, O. Sathans Optimum sizing and techno-economic analysis of grid-independent PV system under different tracking systems. In Proceedings of the 2018 IEEE 8th Power India International Conference (PIICON), Kurukshetra, India, 10–12 December 2018; pp. 1–6. [Google Scholar]
  20. El Ela, A.A.; Abido, M.; Spea, S. Optimal power flow using differential evolution algorithm. Electr. Power Syst. Res. 2010, 80, 878–885. [Google Scholar] [CrossRef]
  21. Nusair, K.; Alasali, F. Optimal Power Flow Management System for a Power Network with Stochastic Renewable Energy Resources Using Golden Ratio Optimization Method. Energies 2020, 13, 3671. [Google Scholar] [CrossRef]
  22. Oliveira, E.J.; Oliveira, L.W.; Pereira, J.; Honório, L.M.; Junior, I.C.S.; Marcato, A. An optimal power flow based on safety barrier interior point method. Int. J. Electr. Power Energy Syst. 2015, 64, 977–985. [Google Scholar] [CrossRef]
  23. Mirjalili, S.; Lewis, A.; Sadiq, A.S. Autonomous particles groups for particle swarm optimization. Arab. J. Sci. Eng. 2014, 39, 4683–4697. [Google Scholar] [CrossRef] [Green Version]
  24. Nematollahi, A.F.; Rahiminejad, A.; Vahidi, B. A novel meta-heuristic optimization method based on golden ratio in nature. Soft Comput. 2019, 24, 1117–1151. [Google Scholar] [CrossRef]
  25. Alasali, F.; Haben, S.; Foudeh, H.; Holderbaum, W. A Comparative Study of Optimal Energy Management Strategies for Energy Storage with Stochastic Loads. Energies 2020, 13, 2596. [Google Scholar] [CrossRef]
  26. Solargis Prospect. Available online: https://apps.solargis.com/prospect/detail/ (accessed on 1 April 2022).
  27. Umwelt-Campus.de. Available online: https://www.umwelt-campus.de/fileadmin/Umwelt-Campus/IBT/energytools/excel/PV_Yield_Simulation.xlsx (accessed on 1 April 2022).
  28. Alasali, F.; Haben, S.; Holderbaum, W. Energy management systems for a network of electrified cranes with energy storage. Int. J. Electr. Power Energy Syst. 2019, 106, 210–222. [Google Scholar] [CrossRef]
  29. Mohamad, F.; Teh, J.; Lai, C. Optimum allocation of battery energy storage systems for power grid enhanced with solar energy. Energy 2021, 223, 120105. [Google Scholar] [CrossRef]
  30. Metwaly, M.; Teh, J. Optimum Network Ageing and Battery Sizing for Improved Wind Penetration and Reliability. IEEE Access 2020, 8, 118603–118611. [Google Scholar] [CrossRef]
  31. Teh, J.; Lai, C. Reliability impacts of the dynamic thermal rating and battery energy storage systems on wind-integrated power networks. Sustain. Energy Grids Netw. 2019, 20, 100268. [Google Scholar] [CrossRef]
  32. Yu, H. A prospective economic assessment of residential PV self-consumption with batteries and its systemic effects: The French case in 2030. Energy Pol. 2018, 113, 673–687. [Google Scholar] [CrossRef]
Figure 1. The energy flow directions of the PV system equipped with ESS to feed 100% of the electricity demand.
Sustainability 14 08124 g001
Figure 2. A simple schematic diagram of the optimal energy flow management controller.
Sustainability 14 08124 g002
Figure 3. Location of the town (Al-Mashari’e) in Jordan.
Sustainability 14 08124 g003
Figure 4. Hourly load consumption for the whole year.
Sustainability 14 08124 g004
Figure 5. The hourly average demand over the day.
Sustainability 14 08124 g005
Figure 6. The average hourly minimum and maximum power consumption recorded for all days of the year.
Sustainability 14 08124 g006
Figure 7. The highest day in summer is Thursday 5 September compared with other Thursdays.
Sustainability 14 08124 g007
Figure 8. The minimum and maximum daily power consumption during every month.
Sustainability 14 08124 g008
Figure 9. The monthly load consumption.
Sustainability 14 08124 g009
Figure 10. Average hourly power consumption over each month.
Sustainability 14 08124 g010
Figure 11. Hourly power load consumption for (a) summer (b) winter.
Sustainability 14 08124 g011
Figure 12. GHI, DNI, and temperature of the Al-Mashari’e town over a year.
Sustainability 14 08124 g012
Figure 13. The power flow operation for the BESS (set-point control model).
Sustainability 14 08124 g013
Figure 14. The percentage of daily demand cover for different PV system scenarios and operations for the BESS (set-point control model).
Sustainability 14 08124 g014
Figure 15. The number of hours with power off for different BESS scenarios (set-point control model).
Sustainability 14 08124 g015
Table 1. Solar radiation information at the Al-Mashari’e.
DescriptionValue
Global horizontal irradiation (GHI)5.485 kWh/m2 per day
Direct normal irradiation (DNI)5.766 kWh/m2 per day
Diffuse horizontal irradiation (DIF)1.752 kWh/m2 per day
Global tilted irradiation at the optimal angle (GTI)6.089 kWh/m2 per day
Table 2. PV Design Calculations.
Scenario 1Scenario 2Scenario 3
Size of PV system908.7 kWp1363.02 kWp1104.1 kWp
Table 3. The highest daily power consumption in the month.
DaykWh
30 January4294.0
19 February4630.8
19 March3241.6
19 Apr2242.5
31 May3652.5
30 June5838.1
30 July6788.5
8 August6533.5
5 September7284.6
5 October5572.7
5 November4024.7
25 December3306.8
Table 4. The load consumption and the generation of the PV systems.
MonthLoad Demand (KWh)PV Generation (KWh)
Scenario 1Scenario 2Scenario 3
January105,979.498,543.5162,060.76122,614.3
February90,028.182,154.5127,728.19101,974.3
March72,724.6129,591.1192,806.33158,579.3
April61,455.3126,340.6179,116.61153,826.9
May77,744.7155,105.2205,204.63185,515.2
June139,174.0163,629.1208,850.06193,707.7
July178,426.6167,412.3214,515.70197,073.6
August182,593.0163,069.1218,132.98191,825.3
September179,735.3143,128.3204,109.48169,488.6
October141,340.3128,551.6195,558.83154,242.9
November94,927.593,260.9147,172.77113,257.9
December93,359.989,522.3147,353.35110,809.2
Total1,417,488.71,540,308.52,202,609.691,852,915.2
Number of Days covered 100%190349295
Percentage of coverage for the total daily demand by the daily PV power generation over a year.52.3%95.61%80.72%
Table 5. The monthly energy consumption during the night period.
MonthConsumption (kWh)
January63,469.6
February52,734.9
March42,675.6
April37,162.1
May48,360.4
June86,575.9
July110,432.4
August115,169.3
September114,193.7
October89,793.9
November58,932.1
December55,880.1
Year/Total875,380.0
Average72,948.3
Table 6. The size of BESS and the main sizing parameters.
ParameterDescription
BESS9535.7 kWh
DoD, SoC80%, 20%
η inv 85%
η dis 90%
f 1.2
Table 7. The percentage of covering daily demand for different optimal BESS controllers.
PV System ScenarioSet-PointGROMPSO
Scenario 184.9%89.5%88.6%
Scenario 2100%100%100%
Scenario 393.3%97.4%96.9%
Table 8. The number of hours with power off for the different optimal BESS controllers.
Case NumberSet-PointGROMPSO
Case 1000
Case 2302123
Case 3814952
Table 9. The main capital costs for a BESS and PV system.
Capital CostsValue
BESS (Case 1)USD 2,860,717 (300 USD/kWh)
PV includes panels, inverters, and cables. (Scenario 2)USD 559,870
Total capital costsUSD 3,420,587
Table 10. The viability results for the BESS case studies.
BESSNPV (K USD)IRR (%)Payback Period (Years)
Case 19405.811
Case 214737.910
Case 3237713.27
Table 11. The percentage of covering daily demand for the different ESS location and optimal BESS controllers.
ESS LocationSet-PointGROMPSO
Central ESS84.9%89.5%88.6%
Distributed ESS80.1%85.4%84.8%
Publisher’s Note: MDPI stays neutral with regard to jurisdictional claims in published maps and institutional affiliations.

